
10. Money Stock Measures - আৰবিআই - Reserve Bank of India


10. Money Stock Measures
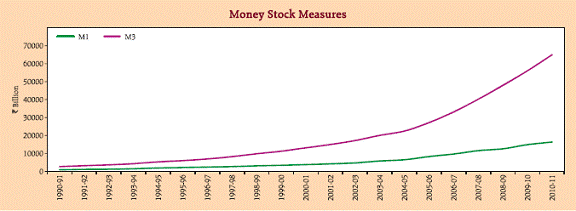
(` Billion) |
|||||||||||||||
March 31/ reporting Fridays of the month/last reporting Friday of the month |
Currency with the Public |
Deposit Money of the Public |
M1 (5+8) |
Post Office Saving Bank Depo sits |
M2 (9+10) |
Time Depo sits with Banks |
M3 (9+12) |
Total Post Office Depo |
M4 (13+14) |
||||||
Notes in Circul ation (1) |
Circulation of |
Cash on Hand with Banks |
Total (1+2 +3-4) |
Dem and Depo sits with Banks |
‘Other’ Depo sits with Res erve Bank (3) |
Total (6+7) |
|||||||||
Rupee Coins (2) |
Small Coins (2) |
||||||||||||||
1 |
2 |
3 |
4 |
5 |
6 |
7 |
8 |
9 |
10 |
11 |
12 |
13 |
14 |
15 |
|
2008-09 |
6,811.0 |
84.9 |
15.7 |
257.0 |
6,654.5 |
5,886.9 |
55.3 |
5,942.2 |
12,596.7 |
50.4 |
12,647.1 |
35,351.0 |
47,947.8 |
259.7 |
48,207.4 |
2009-10 |
7,882.8 |
97.0 |
15.7 |
320.6 |
7,674.9 |
7,179.7 |
38.1 |
7,217.8 |
14,892.7 |
50.4 |
14,943.1 |
41,134.3 |
56,027.0 |
259.7 |
56,286.7 |
2010-11 |
9,369.4 |
111.6 |
15.7 |
354.6 |
9,142.0 |
7,176.6 |
36.5 |
7,213.1 |
16,355.1 |
50.4 |
16,405.5 |
48,639.8 |
64,994.9 |
259.7 |
65,254.6 |
February 11, 2011 |
9,294.1 |
109.1 |
15.7 |
341.8 |
9,077.1 |
6,493.0 |
30.9 |
6,523.9 |
15,601.0 |
50.4 |
15,651.4 |
47,638.6 |
63,239.6 |
259.7 |
63,499.3 |
February 25, 2011 |
9,287.8 |
110.2 |
15.7 |
360.2 |
9,053.5 |
6,788.4 |
35.8 |
6,824.2 |
15,877.7 |
50.4 |
15,928.1 |
47,789.4 |
63,667.1 |
259.7 |
63,926.8 |
October 2011 |
9,840.4 |
120.5 |
15.7 |
438.5 |
9,538.1 |
6,385.8 |
11.4 |
6,397.3 |
15,935.3 |
50.4 |
15,985.7 |
53,718.2 |
69,653.6 |
259.7 |
69,913.3 |
November 2011 |
10,081.3 |
121.5 |
15.7 |
433.5 |
9,784.9 |
6,301.2 |
11.6 |
6,312.8 |
16,097.8 |
50.4 |
16,148.2 |
54,059.6 |
70,157.4 |
259.7 |
70,417.1 |
December 2011 |
10,067.6 |
121.5 |
15.7 |
424.8 |
9,779.9 |
7,093.9 |
22.9 |
7,116.8 |
16,896.7 |
50.4 |
16,947.1 |
55,090.1 |
71,986.8 |
259.7 |
72,246.5 |
January 2012 |
10,245.7 |
121.5 |
15.7 |
416.4 |
9,966.5 |
6,645.4 |
26.8 |
6,672.2 |
16,638.7 |
50.4 |
16,689.1 |
54,956.0 |
71,594.7 |
259.7 |
71,854.3 |
February 10, 2012 |
10,415.6 |
121.5 |
15.7 |
387.5 |
10,165.3 |
6,639.5 |
21.7 |
6,661.2 |
16,826.5 |
50.4 |
16,876.9 |
55,292.4 |
72,118.9 |
259.7 |
72,378.6 |
February 24, 2012 |
10,433.7 |
121.5 |
15.7 |
411.0 |
10,159.8 |
6,673.4 |
10.6 |
6,684.0 |
16,843.8 |
50.4 |
16,894.2 |
55,418.8 |
72,262.7 |
259.7 |
72,522.4 |
Note : Monetary aggregates as at end-March incorporate data on i) scheduled commercial banks as on last reporting Friday and ii) the Reserve Bank of India pertaining to the last working day of the fiscal year. |
|||||||||||||||
 |

এই পৃষ্ঠাটো শ্বেয়াৰ কৰক:


ভাৰতীয় ৰিজাৰ্ভ বেংক মোবাইল এপ্পলিকেষ্যন ইনষ্টল কৰক আৰু নৱীনতম বাতৰিৰ প্ৰৱেশাধিকাৰ পাওক!


