The aggregate results of the select non-government non-financial public limited companies revealed that profitability of the companies shored up by soft raw material and power and fuel costs despite tepid sales growth. Smaller companies, however, could not benefit much. Debt to equity ratio at the aggregate level was contained. Some improvement in fixed capital investment was observed. This article presents the financial performance of select 19,602 non-government non-financial (NGNF) public limited companies for the financial year 2015-16 based on their audited annual accounts during April 2015 to March 2016, along with comparable data from the period from 2013-14 to 2014-15. The data are available on the Reserve Bank’s website at https://dbie.rbi.org.in/DBIE/dbie.rbi?site=statistics#!2_44 The 19,602 companies covered in the latest data release accounted for 39.9 per cent of the population’s paid-up capital (PUC) of all NGNF public limited companies as on March 31, 2016. 1. Corporate Profitability Improved Despite Slower Sales Growth 1.1. Sales growth of the select companies continued to decelerate during 2015-16, mainly due to subdued rural demand. However, the companies benefitted from lower cost of raw materials, power and fuel resulting in contraction of operating expenses. Accordingly, the growth of operating profits was higher. Magnitude of recovery in corporate earnings in terms of net profit growth was muted (Statement 1 and Chart 1). 1.2. The aggregate picture was marked by unevenness. While the companies in all size classes experienced lower sales growth, only the large companies (sales more than ₹ 10 billion) recorded higher operating profits growth, aided by sharper contraction in operating expenditure. Performance of the small companies’ (sales less than ₹ 1 billion) in terms of operating and net profit growth worsened in 2015-16. Medium sized companies (with sales between ₹ 1 billion to ₹ 10 billion) witnessed moderation in operating profits growth (Statement 1).
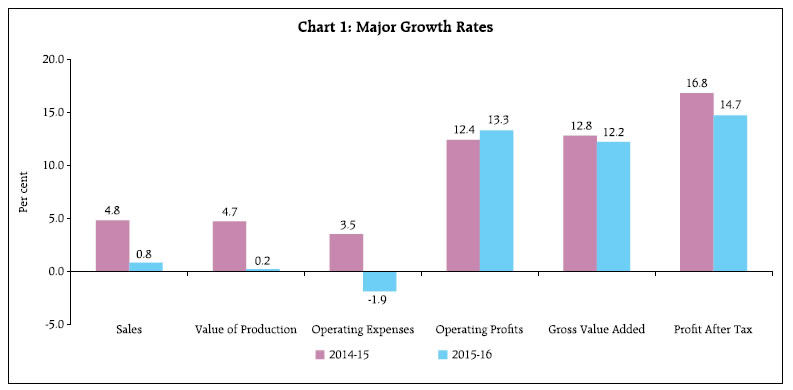
1.3. For companies in the mining sector, sales contracted for the second consecutive year, but its magnitude was lower in 2015-16. However, operating (and net) profits of these companies declined sharply. Continued poor performance of companies in textile and iron and steel industries pulled down the sales growth of manufacturing sector as a whole. In contrast, motor vehicles and other transport equipment industry in the manufacturing sector recorded pickup in sales. In respect of operating profits, the sector did well barring iron and steel industry. Lacklustre demand and stalled projects impacted the sales growth of construction sector companies’ and their operating profits growth plummeted in 2015-16. Services sector companies suffered moderation in both sales growth and operating profits growth. 1.4. One favourable development from the perspective of the corporate sector was that it could retain the pricing power (operating profit margin) despite weak demand conditions. Large companies had an edge over small companies in terms of better pricing power. Manufacturing and services sectors witnessed steadily improving pricing power along with better return on equity. 2. Companies Faced Higher Wage Cost Pressure 2.1. Despite a contraction in total operating expenses, staff cost of the select companies recorded 11.5 per cent growth and was higher than the sales growth. As a result, the share of staff cost in total sales rose sharply by 80 basis points (bps) in 2015-16 on top of 60 bps rise in the previous year (Table 1).
| Table 1: Major Items as Share of Sales |
| (Per cent) |
| Item |
2013-14 |
2014-15 |
2015-16 |
| Raw Materials |
58.4 |
56.2 |
51.7 |
| Staff Cost |
7.0 |
7.6 |
8.4 |
| Interest Expenses |
3.6 |
3.7 |
3.9 |
| Other Income |
1.8 |
1.9 |
1.9 |
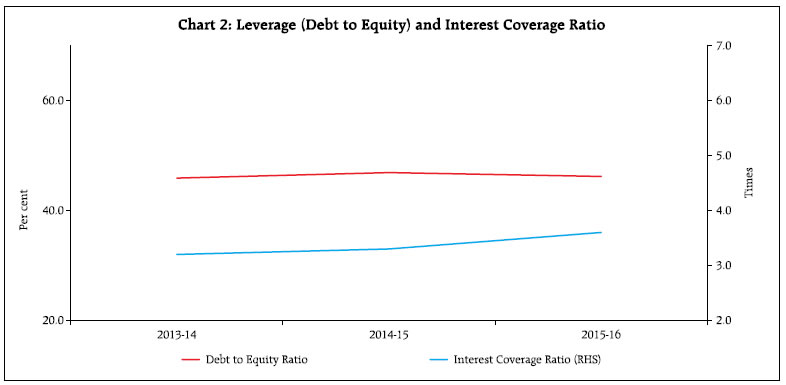
2.2. Contraction in raw material expenses helped in containing the fall in nominal gross value added (GVA) growth. While the companies in the smallest size class recorded lower GVA in 2015-16, those in the largest size class could maintain the momentum in GVA growth in 2015-16 (Table 2). 3. Corporate Leverage at the Aggregate Level Showed Signs of Improvement 3.1. On the face of weaker corporate results in the last few years, corporate leverage has remained a cause of concern. In that respect, the aggregate position of the public limited companies did not show any deterioration in 2015-16. The debt (i.e., long-term borrowings) to equity ratio registered marginal decline in 2015-16. However, the small sized companies bucked the trend. More worryingly, in the relatively more leveraged industries, viz., iron and steel and electrical machinery and apparatus as also in the electricity and construction sectors, the debt to equity ratio rose further in 2015-16. In contrast, the debt to equity ratio in the services sector including the telecom and the real estate companies declined in 2015-16 (Chart 2, Statement 2).
| Table 2: Growth Rate in Gross Value Added for Select 19,602 Public Limited Companies |
| (Per cent) |
| Sales Class Wise |
2014-15 |
2015-16 |
| Less than ₹ 1 billion |
8.3 |
-0.7 |
| ₹ 1 – ₹ 5 billion |
12.2 |
10.9 |
| ₹ 5 – ₹ 10 billion |
15.4 |
7.3 |
| ₹ 10 billion and above |
13.0 |
13.7 |
| Aggregate |
12.8 |
12.2 |
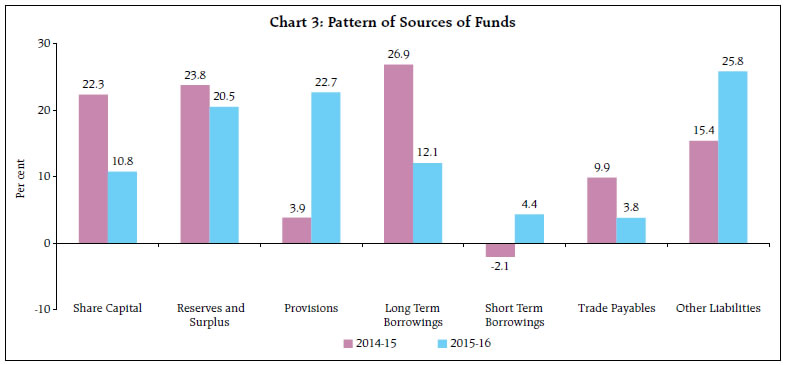
3.2. The share of long-term borrowings in the total borrowings remained around two-third in the aggregate. However, the share of bank borrowings in total borrowings declined further and for the companies with very high leverage ratio (more than 400 per cent), it fell quite sharply (Table 3). 3.3. The position of debt held by the vulnerable companies i.e. companies with leverage ratio more than 200 per cent and ICR less than 1 (including companies with negative net worth) showed some improvement in 2015-16. The share of bank borrowings held by the vulnerable companies declined to 24.5 per cent from 30.3 per cent in previous year (Table 4). 4. Recourse to Fresh Borrowings Was Lower 4.1. Of the funds raised by the selected companies during 2015-16, the share of borrowings declined sharply from 24.8 per cent in 2014-15 to 16.5 per cent in 2015-16 indicating deleveraging process undertaken by the companies. This also resulted in decline in share of funds raised through external sources. Accretion from internal sources, in the form of provisions (including depreciation provision) and reserves and surplus, was the major source of funds in 2015-16 (Statement 4A, Chart 3).
| Table 3: Share of Long-Term Borrowings in Total Borrowings (as per Leverage Ratio) |
| Leverage Ratio (Per cent) |
Share of Long Term Borrowings in Total Borrowings (Per cent) |
Share of Bank Borrowings in Total Borrowings (Per cent) |
| 2013-14 |
2014-15 |
2015-16 |
2013-14 |
2014-15 |
2015-16 |
| 0- 100 |
49.80 |
54.10 |
49.92 |
57.48 |
53.02 |
58.22 |
| 100 – 200 |
74.75 |
71.86 |
80.50 |
60.28 |
59.10 |
45.65 |
| 200 – 300 |
86.74 |
85.70 |
85.29 |
64.38 |
61.25 |
61.56 |
| 300 – 400 |
91.98 |
92.75 |
84.30 |
52.37 |
60.12 |
58.25 |
| Above 400 |
81.61 |
86.67 |
87.39 |
61.82 |
63.35 |
46.09 |
| Net worth <0 |
78.93 |
77.20 |
75.75 |
44.73 |
44.67 |
48.28 |
| Total |
64.83 |
67.58 |
67.92 |
57.73 |
55.50 |
53.60 |
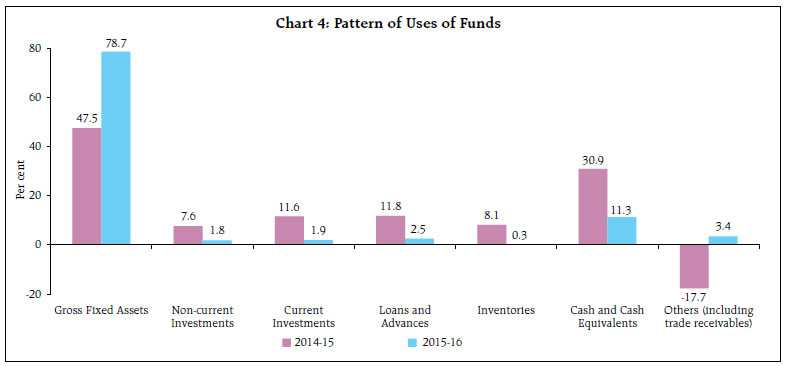
4.2. Reversing the trend observed during 2014-15, more than three-fourth of the fund garnered during 2015-16 was used in fixed assets formation by the selected companies. It can be seen as an early indicator of improved business sentiment (Statement 4B, Chart 4).
| Table 4: Share of Bank Borrowings Held by Vulnerable Companies |
| (per cent) |
| Year |
Number of Vulnerable Companies* |
Share of Debt of Vulnerable Companies in 19,602 Companies’ Debt |
Share of Bank Borrowings of Vulnerable Companies in 19,602 Companies’ Bank Borrowings |
| 2013-14 |
1729 |
33.9 |
26.6 |
| 2014-15 |
1723 |
35.9 |
30.3 |
| 2015-16 |
1777 |
31.2 |
24.5 |
| * includes companies with negative net worth |
5. Conclusion The aggregate results of the select NGNF public limited companies in 2015-16 revealed that despite slower sales growth, downturn in the commodity price cycle helped the sector in maintaining the nominal GVA growth at a comparable level of the previous year. Higher profit margin signalled better pricing power of the corporates. There has not been any deceleration in the leverage position at the aggregate level and increased fixed capital formation may indicate some improvement in business conditions.
| Statement 1: Growth rates of select parameters of select 19,602 NGNF public limited companies |
| |
Growth Rates (Per cent) |
| Sales |
Operating expenses |
Operating profits |
Net profit (PAT) |
| 2014-15 |
2015-16 |
2014-15 |
2015-16 |
2014-15 |
2015-16 |
2014-15 |
2015-16 |
| Aggregate (All Cos.) |
4.8 |
0.8 |
3.5 |
-1.9 |
12.4 |
13.3 |
16.8 |
14.7 |
| Sales-wise |
|
|
|
|
|
|
|
|
| Less than ₹ 1 billion |
-4.2 |
-3.1 |
-5.7 |
-1.9 |
11.3 |
-8.5 |
-17.1 |
-44.7 |
| ₹ 1 billion - ₹ 5 billion |
5.6 |
1.7 |
3.9 |
-0.03 |
16.5 |
12.5 |
25.2 |
46.6 |
| ₹ 5 billion - ₹ 10 billion |
10.0 |
4.2 |
10.6 |
4.0 |
11.2 |
3.7 |
30.6 |
-40.1 |
| ₹ 10 billion and above |
4.8 |
0.6 |
3.5 |
-2.9 |
12.1 |
15.6 |
16.8 |
16.9 |
| Industry-wise |
|
|
|
|
|
|
|
|
| Mining and quarrying |
-14.1 |
-5.7 |
-7.1 |
3.2 |
-26.0 |
-23.6 |
-54.1 |
-29.2 |
| Manufacturing |
2.6 |
-1.7 |
1.4 |
-5.3 |
10.8 |
17.1 |
18.3 |
16.0 |
| Food products and beverages |
7.3 |
2.2 |
5.8 |
2.3 |
12.7 |
9.6 |
25.4 |
-5.9 |
| Textile |
-11.3 |
-21.0 |
-13.0 |
-26.2 |
2.5 |
20.6 |
4.1 |
26.4 |
| Chemicals and chemical products |
10.4 |
8.6 |
10.5 |
5.1 |
9.9 |
26.4 |
11.6 |
33.1 |
| Pharmaceuticals and medicines |
14.6 |
14.4 |
15.2 |
9.0 |
11.8 |
42.2 |
8.1 |
50.1 |
| Cement and cement products |
13.9 |
3.9 |
12.9 |
2.4 |
25.5 |
10.1 |
71.8 |
-15.3 |
| Iron and steel |
2.7 |
-16.5 |
4.2 |
-17.2 |
1.7 |
-33.0 |
41.1 |
# |
| Machinery and equipments n.e.c. |
7.9 |
2.7 |
8.7 |
0.9 |
12.4 |
5.3 |
30.2 |
17.2 |
| Electrical machinery and apparatus |
11.3 |
5.2 |
10.3 |
3.8 |
16.8 |
17.6 |
40.3 |
30.0 |
| Motor vehicles and other transport equipments |
13.2 |
14.9 |
12.6 |
11.8 |
26.6 |
29.8 |
36.1 |
21.3 |
| Electricity, gas, steam and air conditioning supply |
18.4 |
9.8 |
16.0 |
4.2 |
32.6 |
35.9 |
# |
-102.3 |
| Construction |
8.8 |
3.6 |
6.9 |
1.1 |
24.8 |
0.5 |
21.3 |
-29.0 |
| Services |
8.8 |
5.8 |
7.4 |
5.1 |
16.3 |
7.3 |
21.5 |
15.4 |
| Transportation and storage |
9.3 |
11.7 |
11.3 |
11.8 |
5.2 |
15.4 |
39.4 |
36.8 |
| Telecommunications |
4.3 |
0.6 |
0.5 |
-4.7 |
38.3 |
51.6 |
# |
# |
| Real Estate |
20.0 |
3.2 |
23.8 |
-0.5 |
30.2 |
-7.4 |
25.9 |
4.5 |
| Computer and related activities |
18.7 |
5.4 |
21.4 |
7.0 |
5.2 |
-5.1 |
-6.2 |
-10.7 |
| # Denominator negative, nil or negligible |
| Statement 1: Growth rates of select parameters of select 19,602 NGNF public limited companies (Concld.) |
| |
Growth Rates (Per cent) |
| Net worth |
Total borrowings |
Total assets |
| 2014-15 |
2015-16 |
2014-15 |
2015-16 |
2014-15 |
2015-16 |
| Aggregate (All Cos.) |
8.8 |
8.2 |
6.8 |
6.1 |
8.3 |
8.5 |
| Sales-wise |
|
|
|
|
|
|
| Less than ₹ 1 billion |
3.9 |
1.9 |
8.0 |
11.3 |
7.2 |
6.7 |
| ₹ 1 billion - ₹ 5 billion |
7.8 |
9.6 |
10.9 |
8.4 |
8.4 |
8.6 |
| ₹ 5 billion - ₹ 10 billion |
11.7 |
7.1 |
8.8 |
4.4 |
8.4 |
6.3 |
| ₹ 10 billion and above |
9.8 |
9.6 |
4.8 |
3.8 |
8.7 |
9.2 |
| Industry-wise |
|
|
|
|
|
|
| Mining and quarrying |
-3.3 |
-0.1 |
-10.3 |
5.4 |
-4.0 |
0.7 |
| Manufacturing |
9.6 |
8.9 |
1.8 |
7.1 |
7.8 |
9.3 |
| Food products and beverages |
7.4 |
7.4 |
-1.1 |
5.7 |
5.1 |
4.1 |
| Textile |
8.4 |
10.3 |
4.4 |
3.5 |
7.0 |
12.3 |
| Chemicals and chemical products |
12.5 |
14.7 |
6.3 |
11.3 |
9.6 |
10.9 |
| Pharmaceuticals and medicines |
19.4 |
20.8 |
22.4 |
3.3 |
18.3 |
12.9 |
| Cement and cement products |
9.5 |
7.8 |
18.6 |
-3.5 |
13.1 |
5.7 |
| Iron and steel |
4.6 |
-10.1 |
-0.8 |
3.2 |
5.0 |
-2.9 |
| Machinery and equipments n.e.c. |
7.0 |
6.6 |
0.1 |
3.8 |
6.1 |
2.0 |
| Electrical machinery and apparatus |
3.8 |
6.5 |
3.8 |
15.5 |
4.6 |
9.2 |
| Motor vehicles and other transport equipments |
12.4 |
12.6 |
-33.9 |
-3.1 |
8.4 |
13.3 |
| Electricity, gas, steam and air conditioning supply |
13.5 |
4.1 |
20.2 |
11.5 |
15.9 |
9.2 |
| Construction |
10.6 |
5.1 |
15.2 |
15.0 |
13.5 |
9.3 |
| Services |
6.8 |
8.9 |
8.7 |
-1.7 |
7.6 |
7.0 |
| Transportation and storage |
-1.0 |
7.2 |
3.4 |
-4.0 |
6.0 |
9.3 |
| Telecommunications |
4.8 |
5.8 |
-12.5 |
-1.9 |
4.9 |
14.7 |
| Real Estate |
6.6 |
5.9 |
8.2 |
1.5 |
5.6 |
2.2 |
| Computer and related activities |
0.8 |
10.3 |
3.8 |
1.6 |
7.1 |
5.8 |
| Statement 2: Ratios of select parameters of 19,602 NGNF public limited companies |
| |
Ratios (Per cent) |
| Operating profit to sales |
PAT to net worth |
Debt to equity |
| 2013-14 |
2014-15 |
2015-16 |
2013-14 |
2014-15 |
2015-16 |
2013-14 |
2014-15 |
2015-16 |
| Aggregate (All Cos.) |
13.1 |
14.1 |
15.8 |
11.1 |
11.9 |
12.6 |
45.9 |
46.9 |
46.2 |
| Sales-wise |
|
|
|
|
|
|
|
|
|
| Less than ₹ 1 billion |
10.4 |
12.1 |
11.5 |
1.8 |
1.5 |
0.8 |
57.7 |
62.3 |
69.9 |
| ₹ 1 billion - ₹ 5 billion |
10.5 |
11.6 |
12.8 |
4.1 |
4.8 |
6.4 |
61.8 |
60.3 |
64.8 |
| ₹ 5 billion - ₹ 10 billion |
11.8 |
11.9 |
11.9 |
5.6 |
6.5 |
3.7 |
57.9 |
59.2 |
55.4 |
| ₹ 10 billion and above |
13.9 |
14.9 |
17.1 |
15.3 |
16.2 |
17.3 |
38.6 |
39.4 |
36.6 |
| Industry-wise |
|
|
|
|
|
|
|
|
|
| Mining and quarrying |
37.9 |
32.7 |
26.5 |
21.0 |
10.0 |
7.1 |
7.4 |
6.5 |
6.6 |
| Manufacturing |
12.5 |
13.4 |
16.0 |
13.6 |
14.6 |
15.6 |
39.6 |
40.0 |
39.1 |
| Food products and beverages |
8.1 |
8.5 |
9.1 |
18.0 |
21.0 |
18.4 |
49.8 |
56.2 |
47.2 |
| Textile |
8.7 |
10.1 |
15.4 |
10.0 |
9.6 |
11.0 |
43.3 |
46.4 |
43.2 |
| Chemicals and chemical products |
15.1 |
15.0 |
17.4 |
16.5 |
16.4 |
19.0 |
23.5 |
23.6 |
21.9 |
| Pharmaceuticals and medicines |
16.7 |
16.3 |
20.3 |
21.7 |
19.7 |
24.4 |
21.1 |
23.4 |
18.5 |
| Cement and cement products |
14.0 |
15.4 |
16.3 |
8.4 |
13.2 |
10.4 |
52.1 |
56.9 |
47.8 |
| Iron and steel |
11.0 |
10.9 |
8.7 |
2.6 |
3.5 |
-9.9 |
76.2 |
82.5 |
91.8 |
| Machinery and equipments n.e.c. |
12.9 |
13.5 |
13.8 |
11.9 |
14.5 |
15.9 |
19.9 |
19.5 |
22.7 |
| Electrical machinery and apparatus |
12.8 |
13.5 |
15.0 |
7.7 |
10.4 |
12.7 |
65.8 |
62.5 |
72.9 |
| Motor vehicles and other transport equipments |
10.9 |
12.2 |
13.7 |
12.6 |
15.3 |
16.5 |
7.6 |
5.5 |
4.4 |
| Electricity, gas, steam and air conditioning supply |
13.9 |
15.6 |
19.3 |
0.2 |
0.6 |
-0.01 |
117.9 |
126.3 |
144.0 |
| Construction |
15.7 |
17.9 |
17.4 |
5.0 |
5.4 |
3.7 |
109.0 |
115.4 |
124.0 |
| Services |
13.8 |
14.8 |
15.0 |
9.1 |
10.3 |
10.9 |
38.9 |
38.9 |
35.0 |
| Transportation and storage |
15.0 |
14.4 |
14.9 |
5.4 |
7.6 |
9.7 |
77.2 |
74.1 |
65.6 |
| Telecommunications |
6.1 |
8.1 |
12.3 |
-20.4 |
-10.2 |
-11.7 |
117.0 |
92.9 |
88.1 |
| Real Estate |
26.0 |
28.3 |
25.4 |
3.8 |
4.5 |
4.4 |
57.0 |
56.0 |
52.5 |
| Computer and related activities |
18.9 |
16.7 |
15.1 |
18.2 |
16.9 |
13.7 |
11.0 |
9.0 |
10.7 |
| Statement 3: Composition of liabilities and assets of 19,602 NGNF public limited companies |
| (Per cent) |
| A. Composition of liabilities |
| CAPITAL AND LIABILITIES |
2013-14 |
2014-15 |
2015-16 |
| 1. Shareholder's Funds |
42.3 |
42.5 |
42.4 |
| of which, (i) Share Capital |
7.5 |
8.0 |
7.9 |
| (ii) Reserves and Surplus |
34.8 |
34.5 |
34.5 |
| of which, Capital Reserve |
12.4 |
12.1 |
11.8 |
| 2. Long-term borrowings (debt) |
19.5 |
20.0 |
19.7 |
| of which, (i) Bonds / Debentures |
2.5 |
3.1 |
3.3 |
| (ii) Term loans from banks |
12.0 |
11.8 |
10.6 |
| 3. Short-term borrowings |
10.6 |
9.6 |
9.3 |
| of which, from banks |
5.3 |
4.6 |
4.9 |
| 4. Trade payables |
11.0 |
10.9 |
10.5 |
| 5. Provisions |
2.6 |
2.8 |
2.5 |
| 6. Other liabilities |
14.1 |
14.2 |
15.7 |
| (i) non-current |
2.9 |
2.8 |
2.8 |
| (ii) current |
11.2 |
11.4 |
12.9 |
| 7. TOTAL |
100.0 |
100.0 |
100.0 |
| B: Composition of assets |
| ASSETS |
2013-14 |
2014-15 |
2015-16 |
| 1. Gross Fixed Assets |
66.9 |
65.3 |
68.2 |
| (i) Tangible assets |
43.3 |
41.9 |
42.9 |
| (ii) Capital work in progress |
6.5 |
6.6 |
6.7 |
| (iii) Intangible assets |
16.4 |
16.1 |
18.1 |
| 2. Depreciation (i) Tangible |
21.5 |
19.6 |
20.2 |
| (ii) Intangible |
1.8 |
1.8 |
1.8 |
| 3. Net fixed assets |
43.6 |
44.0 |
46.2 |
| 4. Non-current investments |
6.4 |
6.5 |
6.2 |
| 5. Current investments |
4.2 |
4.8 |
4.6 |
| 6. Loans and Advances |
12.9 |
12.8 |
12.0 |
| 7. Inventories |
11.9 |
11.6 |
10.7 |
| 8. Trade receivables |
11.3 |
11.1 |
11.2 |
| 9. Cash and cash equivalents |
1.5 |
3.7 |
4.6 |
| 10. Other assets |
8.2 |
5.5 |
4.4 |
| (i) non-current |
1.4 |
1.3 |
1.3 |
| (ii) current |
6.8 |
4.2 |
3.1 |
| 11. TOTAL |
100.0 |
100.0 |
100.0 |
| Statement 4: Composition of sources and uses of funds of 19,602 NGNF public limited companies |
| (Per cent) |
| A. Composition of sources of funds during the year |
| |
2014-15 |
2015-16 |
| Internal sources (Own sources) |
42.1 |
48.1 |
| 1. Paid-up Capital |
14.5 |
4.9 |
| 2. Reserves and Surplus |
23.8 |
20.5 |
| 3. Provisions |
3.9 |
22.7 |
| of which, Depreciation |
-1.7 |
22.9 |
| External sources (Other than own sources) |
57.9 |
51.9 |
| 4. Share Capital and Premium |
7.8 |
5.9 |
| 5. Long-term borrowings |
26.9 |
12.1 |
| of which, (i) Bonds / Debentures |
10.1 |
4.5 |
| (ii) From banks |
9.3 |
-2.9 |
| 6. Short-term borrowings |
-2.1 |
4.4 |
| of which, From banks |
-3.7 |
6.6 |
| 7. Trade payables |
9.9 |
3.8 |
| 8. Other liabilities |
15.4 |
25.8 |
| (i) non-current |
0.7 |
2.5 |
| (ii) current |
14.7 |
23.3 |
| 9. TOTAL |
100.0 |
100.0 |
| B. Composition of uses of funds during the year |
| |
2014-15 |
2015-16 |
| 1. Gross Fixed Assets |
47.5 |
78.7 |
| (i) Tangible assets |
25.5 |
41.7 |
| (ii) Capital Work-in-progress |
8.4 |
5.5 |
| (iii) Intangible assets |
13.6 |
31.5 |
| 2. Non-current investments |
7.6 |
1.8 |
| 3. Current investments |
11.6 |
1.9 |
| 4. Loans and advances |
11.8 |
2.5 |
| 5. Inventories |
8.1 |
0.3 |
| 6. Trade Receivables |
8.9 |
10.0 |
| 7. Cash and cash equivalents |
30.9 |
11.3 |
| 8. Other assets |
-26.6 |
-6.6 |
| (i) non-current |
0.2 |
1.2 |
| (ii) current |
-26.8 |
-7.9 |
| 9. TOTAL |
100.0 |
100.0 |
|