
Composition and Ownership Pattern of Deposits with Scheduled Commercial Banks: March 2014 - ಆರ್ಬಿಐ - Reserve Bank of India


Composition and Ownership Pattern of Deposits with Scheduled Commercial Banks: March 2014
This article presents an analysis of composition and ownership pattern of outstanding deposits with scheduled commercial banks (including regional rural banks) during 2007-2014. The data on ownership pattern of deposits as estimated from annual sample survey for the period from 2007-10 is used along with the annual census survey data as collected from-March 2012 to 20141. The analysis brings out broad trends across type of deposit accounts, institutional sectors, population groups and bank groups over the period. Introduction The annual survey on ‘Composition and Ownership Pattern of Bank Deposits with Scheduled Commercial Banks (SCBs)’, including Regional Rural Banks (RRBs) as on March 31, 2014, was conducted by the Reserve Bank of India through Basic Statistical Returns (BSR)-4 system. The data collected under this survey were published on the Bank’s website under ‘data release’ (http://rbi.org.in/scripts/BS_PressReleaseDisplay. aspx?prid=33283) in February 2015. 2. The data provides branch-wise outstanding deposits as on March 31, according to type of deposits (viz., current, savings and term deposits), and institutional categories of depositors (i.e., Household, Government, Private Corporate (Non-Financial, Financial and Foreign). These data help to analyse the trends across states, population groups and major bank groups (public sector banks, private sector banks and foreign banks). 3. This article is based on 2014 survey data and presents a brief review of the trends and pattern in type of deposit accounts (current, savings and term deposits). The discussion on ownership pattern of deposits by broad institutional sectors is followed by the section on the pattern of deposits according to population groups. Subsequently, bank-group wise analysis on preference of various institutional depositors is discussed. A brief information on statewise pattern in bank deposits as on March 31, 2014 is also presented in the last section. Composition of Bank Deposits by Type of Deposits 4. The term deposits remained the largest constituent followed by savings deposits. As on March 31, 2014, term deposits constituted around two-thirds share and savings deposits at around one-fourth share in total deposits (Chart 1). 5. The share of term and savings deposits in total deposits showed increasing trends during 2010-2014, whereas share of current deposits showed declining trend during the same period. 6. The y-o-y growth in total deposits, which was decelerating till March 2013, exhibited some improvement in March 2014 (Table 1), mainly on account of acceleration in interest bearing deposits (i.e., savings and term). Lower growth in current deposits in the last two years is consistent with the slowdown in economic environment as reflected by lower/ negative growths in index of industrial production. Ownership pattern of deposits by broad institutional sectors 7. Household sector2 continued to lead deposits generation by SCBs over the entire period under review (Chart 2). As on March 2014, household sector contributed 59.7 per cent share in total deposits followed by the government sector (14.0 per cent). During 2013-14, the share of foreign sector’s deposits had also increased, mainly on account of substantial increase in non-residents’ deposits. A part of this increase might be attributed to policy changes on foreign deposit accounts, announced by the Reserve Bank during 2013-14. 8. The households’ share in total deposits, which was hovering around 58.0 per cent during 2008-2012, increased to 59.6 per cent in 2013 and remained at that level in 2014 (Table 2). As noted earlier in Table 1, during 2012-14, banks term deposits rates had remained quite competitive as compared to other sources of investment (i.e. stock market and gold/ silver) available to households. Within households, individuals3 comprised the largest share of around 834 per cent in total households’ deposits. Proprietary and partnership firms (4.7-6.3 per cent) and trusts and associations (3.5- 4.6 per cent) were other constituents of households’ deposits during the period 2008-2014. (For detailed data, refer RBI website (/en/web/rbi). 9. Growth in deposits by various institutional sectors is given in Table 2. Non-financial private corporate sectors’ deposits with banks continued to decline for the second consecutive year. 10. The institutional ownership of different types of deposits indicates that the households, which is the largest holder of total deposits outstanding with SCBs, also held the largest shares across all three types of deposits, viz., current, savings and term deposits in 2014 (Table 3). Around 84 per cent of savings deposits, more than 50 per cent of term deposits and more than 40 per cent of current deposits are held by households. In current deposits, the non-financial private corporate sector was the second largest contributor followed by the Government sector in 2014. The share of nonfinancial private corporate sector in total deposits declined in 2014 mainly in favour of foreign sector. 11. Term deposits constituted major part of total deposits for all institutional sectors over the period 2008-2014 (Table 4). Savings deposits were the second major constituent in all sectors except non-financial private corporate and financial sectors, wherein current deposits were second most important with savings deposits having a negligible share. Ownership Pattern of Deposits across Population Groups5 12. Total deposits classified by population groups is presented in Table 5. The distribution of deposits across population groups indicated that metropolitan branches contributed the highest share in total deposits. The growth in deposits of metropolitan branches, which declined successively in 2012 and 2013, partly recovered in 2014. The share of these branches, which hovered around 56-58 per cent during 2007-2012 dipped to 54.8 per cent in 2013, and showed only a marginal decline to reach at 54.3 per cent in 2014, on account of higher deposit growth in other population groups. 13. Households sector was the major owner of bank deposits in all population groups. Household sector constituted 90 per cent of total deposits of rural branches. Households’ share in total deposits was also high in semi-urban (77.4 per cent), urban (67.6 per cent) and metropolitan (46.5 per cent) areas. In metropolitan area, other notable contributors were government sector (15.8 per cent), financial sector (15.1 per cent) and non-financial private corporate sector (14.7 per cent) (For detailed data, refer RBI website (/en/web/rbi). 14. Term deposits remained dominant type of deposits across metropolitan, urban and semi-urban population groups followed by savings deposits in 2014 (Chart 3). In 2014, metropolitan branches’ share in term deposits increased by 9.4 percentage points and stood at 73.9 per cent as against a decline by 9.6 percentage points in saving deposits. However, in respect of deposits by rural branches, savings deposits constituted the largest share, followed by term deposits. Ownership Pattern of Deposits According to Bank Groups 15. Bank group-wise analysis indicates that, public sector banks (consisting of SBI & its Associates and Nationalised Banks including IDBI Bank) comprised the largest share in total deposits, which hovered in the range of 70.1 -74.6 per cent between 2007 and 2014 (Table 6). Domestic private sector banks held 18-20 per cent of deposits and the share of foreign banks remained at 4-5 per cent in various years. The Regional Rural Banks contributed at around 3 per cent of total deposits. 16. Distribution of deposits, according to type was quite similar to earlier years among SBI and its associates, nationalised banks and private sector banks, where the term deposits had the largest share followed by savings deposits (Chart 4). In the case of foreign banks, term deposits constituted more than 60 per cent of the total deposits followed by current deposits (more than one-fifth). In the case of RRBs, savings deposits accounted for more than half of the total deposits followed by term deposits (more than two-fifth). 17. Institutional ownership of deposits as on March 31, 2014 indicated that the households accounted for the highest share in total deposits in all bank groups excluding the foreign banks group, where the foreign sector held the largest share of deposits followed by non-financial private corporate sector (Table 7). 18. Selection of bank groups by various institutional players appeared to be based on flexibilities required for their business as well as the customer oriented business strategies of banks. Around 90 per cent of the Government deposits were with public sector banks. About 62 per cent of financial sector (including banks) deposits were with nationalised banks followed by private sector banks (28.0 per cent). More than 56 per cent deposits by non-financial private corporate sector were held by public sector banks while 43.0 per cent deposits were held by foreign and private sector banks. More than three-fourth of household deposits, especially individuals (largest constituent of household sector) were with public sector banks, might be on account of bigger branch network of these banks. Institutional Ownership of Deposits According to States / Union Territories6 19. The composition of deposits as at end March 2014 across different States/Union Territories (UTs) showed higher concentration in seven states/UTs. These states/UTs (Maharashtra, Delhi, Uttar Pradesh, Karnataka, Tamil Nadu, West Bengal and Gujarat) comprised around 68 per cent of total deposits. Maharashtra alone contributed more than one-fourth of total deposits. 20. According to ownership, dominance of households’ savings in bank deposits was of different degrees in different regions. The overall households share in total deposits in the Central Region was the highest at 75.9 per cent (with the corresponding States/UT’s share varying in the range from 66 to 81 per cent), followed by the Eastern Region at 72.2 per cent (with the constituents’ share ranging between 62 to 75 per cent) 21. Of the total deposits by non-financial private corporates, 68.4 per cent was concentrated in four states, namely, Maharashtra (34.8 per cent), Delhi (14.1 per cent), Tamil Nadu (10.4 per cent), and Karnataka (9.1 per cent). In the total foreign sector deposits raised by SCBs, Maharashtra contributed to 39.1 per cent followed by Kerala (17.1 per cent), Delhi (8.3 per cent), Karnataka (6.9 per cent) and Gujarat (5.9 per cent). * Prepared in the Bank Branch Statistics Division of the Department of Statistics and Information Management, Reserve Bank of India, Mumbai. 1 More detailed data for March 2014 is available in the Reserve Bank website ‘URL: /en/web/rbi’. Previous findings from BSR-4 survey on Composition and Ownership Pattern of Deposits with scheduled commercial bank were published in various issues of Reserve Bank of India Bulletin; the latest was published in the April 2014 issue. 2 The household sector include individuals as well as unincorporated bodies. 3 Individuals including Hindu undivided families (HUF). 4 With improvements in classification some household deposits which were not classified elsewhere, are now classified under ‘salary and wage earners’ and ‘other individuals’. 5 The population group classification of banked centres is based on Census 2001. 6 More detailed data for March 2013 is available in the Reserve Bank website ‘URL: /en/web/rbi’. |

ಈ ಪುಟವನ್ನು ಹಂಚಿಕೊಳ್ಳಿ:


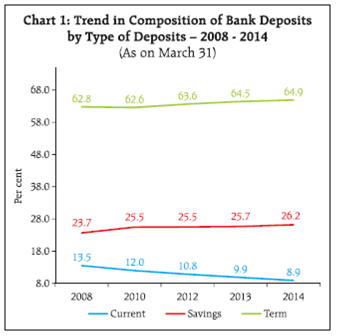
ಭಾರತೀಯ ರಿಸರ್ವ್ ಬ್ಯಾಂಕ್ ಮೊಬೈಲ್ ಅಪ್ಲಿಕೇಶನ್ ಅನ್ನು ಇನ್ಸ್ಟಾಲ್ ಮಾಡಿ ಮತ್ತು ಇತ್ತೀಚಿನ ಸುದ್ದಿಗಳಿಗೆ ತ್ವರಿತ ಅಕ್ಸೆಸ್ ಪಡೆಯಿರಿ!


