
Finances of Non-Government Non-Financial Public Limited Companies: 2014-15 - आरबीआय - Reserve Bank of India


Finances of Non-Government Non-Financial Public Limited Companies: 2014-15
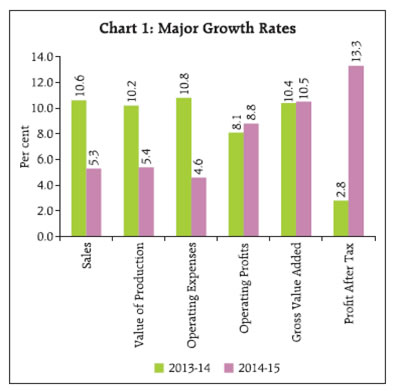
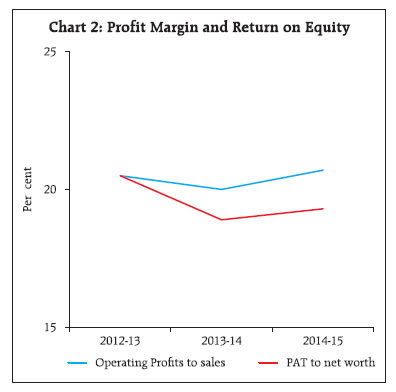
The aggregate results of the select non-government nonfinancial public limited companies revealed fall in sales growth rate in 2014-15, which was visible across all major sectors except Construction. Operating profits as well as net profits growth improved in 2014-15 over previous year. However, gross value added (GVA) growth improved marginally in 2014-15. Except for Mining, Electricity and Construction Sectors, operating profit margin improved in other sectors in 2014-15. Leverage of the companies continued to increase gradually and interest coverage ratio was stable. There was fall in funds raised through external sources by the companies. Share of funds used for fixed assets formation was higher whereas that of non-current investments was lower. This article presents the financial performance of select 16,923 non-government non-financial (NGNF) public limited companies for the financial year 2014- 15 based on their audited annual accounts closed during April 2014 to March 2015. The current study analyses data for the period from 2012-13 to 2014-15. The detailed data have been made available on the RBI website in March 2016. The select 16,923 companies covered in the latest data release accounted for 29.5 per cent of population paid-up capital (PUC) (provisional estimate supplied by Ministry of Corporate Affairs, GoI) of all NGNF public limited companies as on March 31, 2015. Of these select companies, data pertaining to 16,587 companies are based on Ministry of Corporate Affairs (MCA) system [both XBRL and non-XBRL (Form AOC-4)] and remaining 336 companies’ data obtained from other sources. 1. Sales growth declined and GVA growth improved marginally due to steep fall in operating expenses 1.1. Sales growth of the select companies halved during 2014-15 as compared to the previous year. Sharp fall in operating expenses growth was predominantly led by lower raw materials prices. As expenditure growth declined at a higher rate than sales, performance of select companies improved in terms of operating profit. Net profits also grew sharply in 2014-15 (Statement 1 and Chart 1). 1.2. The share of major expenditure items as percentage of sales revealed that cost of raw materials to sales declined steadily during the study period , i.e., 2012-13 to 2014-15. Staff cost to sales ratio as well as interest expenses to sales ratio increased gradually during this period (Table 1). 1.3. Based on sales size classifications1, it has been observed that large companies (sales more than ₹10 billion) recorded higher operating profits as well as net profit growth despite sales growth moderation. On the contrary, small companies (sales less than ₹1 billion) as well as companies with sales between ₹5 billion to ₹10 billion recorded improvement in sales growth but contraction in net profits in 2014-15. Net profits contracted for two consecutive years for companies with sales between ₹1 billion to ₹5 billion, though at a lower rate in 2014-15 as compared to 2013-14 (Statement 1).
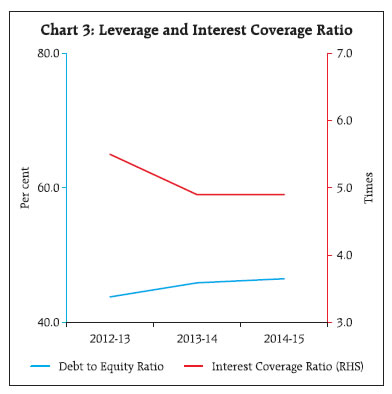
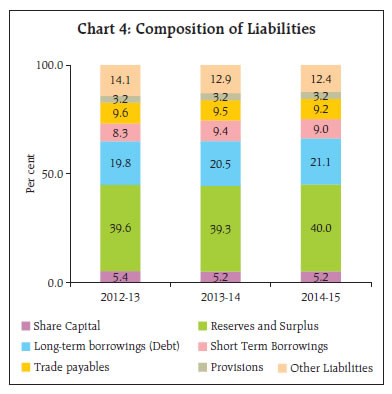
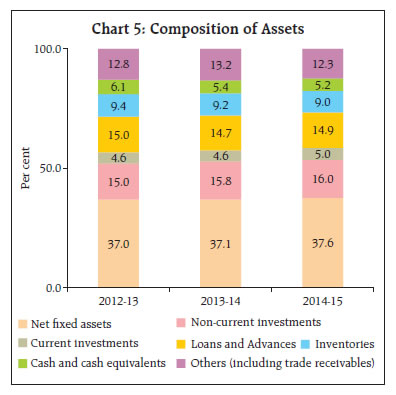
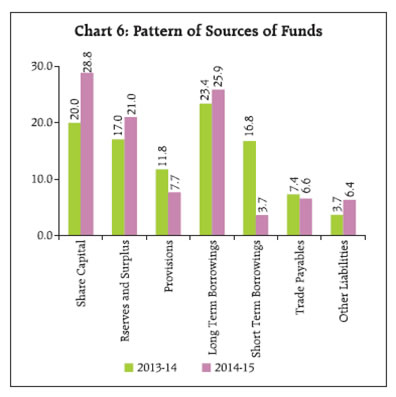
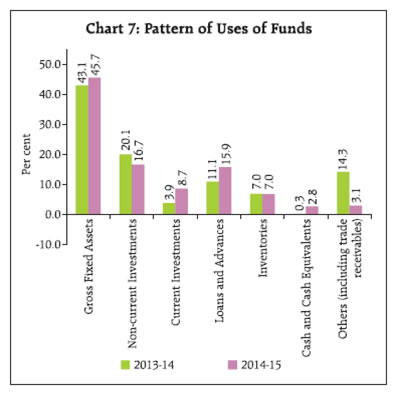
1.4. Gross value added (GVA) growth of select companies improved marginally in 2014-15. However, GVA of the companies in the sales size group of ‘₹5 billion to ₹10 billion’ improved significantly (Table 2). 1.5. Performance of companies in Mining Sector suffered major setback as these companies witnessed contraction in sales, operating profits as well as net profits in 2014-15. Performance of companies in Manufacturing and Services sector was in line with that at aggregate level. Construction Sector registered improved sales growth as well as profits growth in 2014-15. Sharp decline in sales growth was recorded by companies in Electricity Sector, resulting in contraction in operating profits in 2014-15 (Statement 1). 1.6. Among major industries in Manufacturing Sector, ‘cement’ as well as ‘motor vehicles’ recovered in terms of sales and profits growth despite higher growth in their expenses in 2014-15. Performance of ‘textile’ industry worsened although on the positive side, the total borrowings growth of these companies slowed down. 1.7. In the Services Sector, ‘transportation and storage’ and ‘computer and related activities’ industries recovered in terms of sales growth. However, their expenditure growth also increased sharply resulting in contraction in net profits. Telecommunication industry recorded weak sales growth and profit growth in 2014-15. Real estate industry showed signs of recovery in terms of profits growth, though its assets growth slowed down. 2. Operating profit margin as well as return on equity improved 2.1. The operating profit margin (operating profit as percentage of sales) improved to 20.7 per cent in 2014-15 after recording marginal decline in 2013-14 to 20 per cent from 20.5 per cent in 2012-13. Return on equity (PAT as a percentage of net worth) also exhibited similar pattern. Total borrowings to equity ratio improved in 2014-15 with slowdown in growth in total borrowings (Statement 2). 2.2. The improvement in operating profit margin was observed across all sales-size groups (Statement 2). Return on equity improved only for large companies (sales size ₹10 billion and above) while it declined for all other sales size groups. Small companies witnessed increase in total borrowings to equity ratio whereas for all other sales size groups, it improved (Statement 2). 2.3. Profitability of Mining Sector declined further in 2014-15. Profitability of Manufacturing Sector remained stagnant along with improvement in its total borrowings to equity ratio. Electricity Sector recorded high and steadily increasing total borrowings to equity ratio. Construction Sector witnessed very low although increasing return on equity with its total borrowings to equity ratio declining after registering increase in previous year (Statement 2). 2.4. During 2014-15, among major industries in Manufacturing Sector, food products industry recorded improved profitability in terms of both operating profit margin as well as return on equity. Profitability of cement industry also improved after registering decline in earlier year. Iron and steel industry was characterised by low profit margin ratio and high total borrowing to equity ratio. Among service sector companies, transportation industry recorded steady decline in return on equity however continuously improving profit margin. Real estate industry witnessed increase in total borrowings to equity ratio after remaining steady in 2012-13 and 2013-14. Profitability of computer and related service industry slowed down in 2014-15 after picking up in the previous year. 3. Total assets grew at a slower rate 3.1. There was slowdown in growth of total assets of select companies in 2014-15 over 2013-14 (from 12.9 per cent to 9.6 per cent). The trend was seen across all sales-size groups as well as across all major sectors. (Statement 1). Mining Sector witnessed sharp fall in total assets growth. However some constituent industries in Manufacturing Sector viz. ‘chemical and chemical products’, ‘pharmaceuticals and medicines’, and ‘cement and cement products’ recorded jump in total assets growth 2014-15 over previous year. Transportation and storage industry in Services Sector also witnessed improved total assets growth in 2014-15. 4. Gradual increase in leverage ratio and steady interest coverage ratio 4.1. Leverage, as measured by debt (long term borrowings) as a percentage of equity (net worth) recorded gradual increase during 2012-13 to 2014- 15. Total borrowings to equity ratio of the companies declined in 2014-15 after recording a jump in the previous year. Interest coverage ratio (measured by EBIT to interest expenses ratio) which reflects ability of companies to service debt, remained steady in 2014-15 after falling in previous year (Chart 3). 4.2. Total borrowings to equity ratio for small companies (sales less than ₹1 billion) witnessed continuous increase from 97.2 per cent in 2012-13 to 128.3 per cent in 2014-15. (Statement 2). 4.3. At sectoral level, for Manufacturing Sector and its major constituent industries’ (except for cement and cement products) total borrowings to equity ratio improved in 2014-15 as compared to 2013-14. Electricity sector was vulnerable in terms of high and increasing total borrowing to equity ratio during the study period. Total borrowings to equity ratio in the Services Sector deteriorated continuously (Statement 2). 4.4. Long term borrowings constituted around 70 per cent of total borrowings of companies in 2014-15 with predominant share of bank borrowings (more than 50 per cent). However, the share of bank borrowings declined over the years. Distribution of share of long term borrowings (debt) in total borrowings in different leverage classes revealed that companies with very high leverage ratio (more than 400 per cent) had 55 per cent of their total borrowings as bank borrowings. Loss making companies (companies with their net worth less than zero) had 33.2 per cent of their total borrowings as bank borrowings. (Table 3). 4.5. 9.1 per cent companies had their leverage ratio more than 200 per cent and ICR less than one or negative net worth in 2014-15. Such companies had 21.8 per cent share in total bank borrowings of select 16,923 companies (Table 4). 5. Share of funds raised through external sources declined 5.1. During the three year study period i.e., 2012- 13 to 2014-15, composition of liabilities of the select companies was characterised by continuous increase in the share of ‘long term borrowings’. ‘Reserves and surplus’ also recorded improvement in their share in 2014-15 after witnessing a decline in previous year (Statement 3A and Chart 4). On the assets side, share of inventories recorded gradual decline whereas that of non-current investments increased (Statement 3B and Chart 5). 5.2. Of the funds raised during 2014-15, there was preference for long term over short term borrowings. Short term borrowings witnessed sharp decline in their share in 2014-15 over previous year. This resulted in decline in share of funds raised through external sources (i.e., other than companies own). Among internal sources, share of provisions (including depreciation provision) declined whereas that of reserves and surplus improved on account of improved profits in 2014-15 (Statement 4A, Chart 6). 5.3. Share of gross fixed assets formation in uses of funds increased during 2014-15 mainly due to higher investment in tangible assets (i.e. 41.1 per cent in 2014-15 as compared to 38.8 per cent in 2013-14). Share of funds parked in non-current investments declined from 20.1 per cent in 2013-14 to 16.7 per cent in 2014-15. However, there was an increase in share of current investments and loans and advances in 2014-15. Share of fresh funds kept as ‘cash and cash equivalents’ increased in 2014-15 (2.8 per cent as against its share of 0.3 per cent in the previous year) (Statement 4B, Chart 7). 6. Conclusion The aggregate results of the select NGNF public limited companies in 2014-15 revealed moderation in sales growth but marginal improvement in gross value added growth. Resultantly, profitability of the select companies also improved in 2014-15. Leverage ratio of select companies recorded gradual increase while interest coverage ratio remained stable during the study period. Share of funds used for fixed assets formation was higher whereas that for fresh noncurrent investments was lower as compared to the previous year.
* Prepared in the Company Finances Division (CFD) of the Department of Statistics and Information Management, Reserve Bank of India, Mumbai Reference may be made to the April 2015 issue of the RBI Bulletin for the previous year study. 1 Sales-size classifications are based on the latest year’s, i.e., 2014-15, sales of the companies. |
|||||||||||||||||||||||||||||||||||||||||||||||||||||||||||||||||||||||||||||||||||||||||||||||||||||||||||||||||||||||||||||||||||||||||||||||||||||||||||||||||||||||||||||||||||||||||||||||||||||||||||||||||||||||||||||||||||||

हे पेज शेअर करा:


भारतीय रिझर्व्ह बँक मोबाईल ॲप्लिकेशन इंस्टॉल करा आणि नवीनतम बातम्यांचा त्वरित ॲक्सेस मिळवा!


