| This article presents the investment portfolio of Scheduled Commercial Banks (excluding Regional Rural Banks) in India and abroad, as at end-March 2006, as per the reporting system of annual Basic Statistical Return (BSR)-5. The investment portfolio covers investments in Central and State Government securities, securities other than Central and State Government securities - approved for the purpose of investments under the Indian Trusts Act, 1882, other domestic securities and investments, foreign securities and other foreign investments. Analysis of investments according to bank groups, namely, State Bank of India and its Associates, Nationalised Banks, Other Indian Scheduled Commercial Banks and Foreign Banks has been presented in terms of instruments, maturity, interest rate (coupon) and states. The article also highlights a comparative position of banks’ portfolio in 2006 with that of the previous year.
During 2005-06, at overall, total investments of the Scheduled Commercial Banks (SCBs) increased marginally (by 0.4 per cent) as against very high rise (9.0 per cent) as recorded in 2004-05. This possibly reflected a rebalancing of the banks’ portfolio to meet expanding credit needs of the growing economy.
Incrementally, while the SBI and its Associates and Nationalised Banks groups reported decline in their investment portfolio, the other Scheduled Commercial Banks and Foreign Banks registered enlargement of portfolio.
The maturity profile of holdings of Government securities (Central and State securities taken together) as at end-March 2006 depicted that over two-fifths of such securities held by SCBs were in the maturity bracket 2010-2015, followed by the maturity bracket 2015 and above (25.8 per cent), and 14.3 per cent share was accounted for by securities maturing within one year (2006-07).
Across different bank groups, Foreign Banks reported bulk (80.5 per cent) of their holding with residual maturity less than 4 years, as against 33.4 per cent for all SCBs.
During 2005-06, Central Government securities with interest rate of ‘6 per cent to 10 per cent’ witnessed further concentration. Introduction
The analysis of investment portfolio of Scheduled Commercial Banks (SCBs), excluding Regional Rural Banks, covers 85 banks, viz., 8 from the State Bank Group (SBI and its Associates), 20 from the Nationalised Banks group (including IDBI Ltd.), 28 Other Indian Scheduled Commercial Banks (OSCBs) or Indian Private Sector Banks and 29 Foreign Banks operating in India. These banks accounted for 97.3 per cent of the investments in approved securities for Statutory Liquidity Ratio (SLR) purposes of all SCBs1 (including Regional Rural Banks) on the last reporting Friday of March 2006. The analysis is based on data furnished by SCBs in the Basic Statistical Return (BSR)-5. The investments of SCBs, covered in the survey are grouped into: i) Central and State Government securities, ii) securities, other than Central and State Government securities - approved for the purpose of investments under the Indian Trusts Act, 1882, iii) shares, bonds and debentures of Indian joint stock companies, iv) fixed deposits with banks, v) domestic securities which are not eligible as trustee securities, such as initial contribution to the Unit Trust of India (UTI), share capital in RRBs, and vi) foreign securities and other foreign investments. The study covers domestic investments as well as foreign investments in respect of domestic banks whereas for foreign banks operating in India, only their investments made in India through their domestic branches are covered. Results
The results of the survey are presented in four sections. Section I relates to aggregate investments of SCBs according to types of securities and the Section II discusses bank group-wise investments. Section III covers information on the investments of SCBs in loans floated by the State Governments, contributions in the share capital of RRBs, subscription to debentures of cooperative institutions, subscription to bonds of the State Government guaranteed bodies, viz., Municipalities, State Electricity Boards, State Financial Institutions, Road Transport Corporations, etc. A summary of the results is presented in concluding section IV. The investment data presented in this article, in general, is referred to by their face value and in the case of investments in shares, bonds and debentures of Indian joint stock companies, market value is also indicated along with the face value. The data obtained through the current survey, together with those based on the previous survey (March 31, 2005) are presented in 10 Statements and 12 charts. Select macroeconomic and financial indicators having a bearing on investment portfolio of banks are presented as Annex Table and Charts.
I. Aggregate Investments
I.1 In the backdrop of high credit growth (37.0 per cent) during 2005-06, the aggregate investment of SCBs, excluding RRBs, as on March 31, 2006, at Rs.8,54,657 crore registered a marginal increase of 0.4 per cent (Rs. 3,103 crore) over the position as on March 31, 2005 (Statement 1). Investments of banks’ offices located in India continued to dominate the total investments portfolio and accounted for 98.3 per cent share as on March 31, 2006 (98.4 per cent as at end-March 2005). The balance 1.7 per cent of total investments was held by foreign offices of Indian banks in the form of securities of foreign countries, and shares and debentures of joint stock companies registered abroad. Incrementally, during 2005-06 there were increases in the investments of the Indian offices of banks, in Indian Government securities and Foreign securities (by Rs.8,022 crore and Rs.1,883 crore, respectively), while investments in other domestic securities, bonds, shares, etc. decreased by Rs. 7,088 crore.
The composition of investments according to broad categories of securities, revealed banks’ preferences for investments in Government securities, in order to meet stipulation in respect of SLR requirements and also, mainly, due to their risk free nature (Statement 1 and Chart 1). As on March 31, 2006, Government securities comprising of Central Government securities, State Governments securities and others (including postal saving deposit certificates and postal obligations) accounted for 77.4 per cent of total investments of banks (76.7 per cent share on March 31, 2005). However, this improvement in the share/deposits, resulted from a lower increase of Rs. 8,022 crore in holding of Government securities, compared with an increase of Rs. 69,075 crore registered in 2004-05. The share of ‘other domestic securities’ moved down from 21.5 per cent of the total investments of banks as on March 31, 2005 to 20.6 per cent as on March 31, 2006. The share of investments in foreign securities by domestic branches of SCBs at Rs. 2,701 crore accounted for 0.3 per cent of total investments as on March 31, 2006, compared to 0.1 per cent (Rs.818 crore) a year ago. 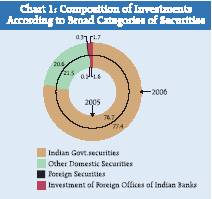
Analysis of changes in constituents of investment in Government securities (i.e., Central Government and State Government securities) during 2005-06 indicated that SCBs holdings of Central Government securities increased by Rs.9,805 crore (1.8 per cent) to Rs. 5,47,897 crore, while their investment in State Governments securities decreased by Rs.1,594 crore (1.4 per cent) to Rs. 1,13,622 crore as on March 31, 2006 in contrast to growth of 7.4 per cent recorded in 2004-05.
The investments of SCBs in ‘other domestic securities’ mainly comprise shares and debentures of joint stock companies, other trustee securities (excluding units of UTI), fixed deposits (FDs), units of UTI, certificates of deposit (CDs), commercialpapers (CPs), mutual funds, initial contribution to share capital of UTI, bonds and debentures of quasi-government bodies, venture capital funds, etc. SCBs’ investments in such domestic securities declined by 3.9 per cent in 2005-06 as against a marginal increase of 1.6 per cent recorded in the preceding year.
I.2 Classification of Investment Portfolio of Banks into HTM, AFS and HFT Categories
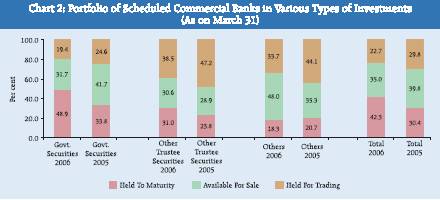
The investment portfolio of SCBs classified under the categories ‘held to maturity’ (HTM), ‘available for sale’ (AFS) and ‘held for trading’ (HFT) for different types of investments is depicted in Chart 2. At the aggregate level, the share of investments under the HTM category increased during 2005-06, while those of investments under AFS and HFT categories decreased. Compared with the share of investments in HTM category at 30.4 per cent as on March 31, 2005, the share of investments classified under this category was 42.3 per cent as on March 31,2006. The share of investments classified under AFS and HFT categories declined from 39.8 per cent in 2005 to 35.0 per cent in 2006 and 29.8 per cent in 2005 to 22.7 per cent in 2006, respectively. In the case of Government securities, the share of investments classified under HTM category, increased to 48.9 per cent as on March 31, 2006, from 33.8 per cent a year ago. As regards investments in subsidiaries and joint ventures of banks, the share of HTM category of investments was substantial at 60.1 per cent due to absence of secondary market trading in such investments, while in the case of investments in shares, 59.8 per cent of investments were in the AFS category. II. Bank Group-wise Investment of Scheduled Commercial Banks
The investments of SCBs classified by bank groups and type of securities are presented in Statement 2.
II.1 Composition of Investment
Among the various bank groups, Nationalised Banks continued to account for almost 50 per cent of investment as on March 31, 2006. These banks accounted for 47.3 per cent to total investment followed by SBI and its associates (25.1 per cent), OSCBs (21.4 per cent) and Foreign Banks (6.3 per cent) (Chart 3). Incrementally, among various bank groups there were asymmetric changes. The SBI and its Associates and Nationalised Banks groups reported 14.4 per cent and 1.5 per cent decline in their investment portfolio as on March 31, 2006 over the position a year ago, respectively. As against this, OSCBs and Foreign Banks registered 23.2 per cent and 25.4 per cent increase respectively, during the same period. 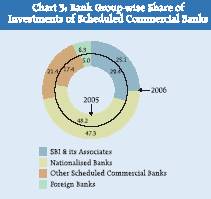
Perhaps, in order to bridge the resource gap for expanding credit, the public sector banks which have comfortable position in terms of SLR maintenance, reported decline in their holdings of Central Government securities during 2005-06. The sharp decline was (14.6 per cent) in the holding by the SBI & its associates, while Nationalised Banks reported marginal fall (0.2 per cent) in their holdings. Investments by OSCBs and Foreign Banks in the Central Government securities increased to the extent of 29.5 per cent and 25.5 per cent, respectively.
Investment in foreign securities, across the bank groups, continue to be negligible. Similarly, investment of foreign offices of the Indian banks in foreign securities continue to be very low, below 2 per cent.
II.2 Investment in Other Trustee Securities
Investment of SCBs in other trustee securities comprised of investment in securities/shares/bonds/debentures issued by major all-India bodies, State Financial Corporations (SFCs), State Electricity Boards (SEBs), IFCI Ltd., National Bank for Agriculture and Rural Development (NABARD), Small Industries Development Bank of India (SIDBI), etc. Such investments of SCBs, amounted to Rs. 15, 023 crore as on March 31, 2006 compared with Rs. 18,884 crore as on 31, March 2005 registering a decrease of 20.4 per cent during 2005-06 (Statement 3).
II.3 Investment in the Instruments of Capital Market
Instruments of capital market, comprise mainly of shares and debentures of joint stock companies, units of UTI and other mutual funds, initial contribution to share capital of UTI, CDs, CPs, FDs with banks and shares of DICGC. Investment by SCBs in these instruments stood at Rs.1,61,163 crore as on March 31, 2006, recording a decline of 2.0 per cent during 2005-06 (Statement 4). The investment by banks in debentures issued by joint stock companies constituted the major component (79.0 per cent in terms of market value) of total investment in shares and debentures as on March 31, 2006 as against 82.9 per cent as on March 31, 2005, although the investment in debentures of joint stock companies declined by 16.2 per cent during 2005-06. Investment by banks in shares of joint stock companies increased by 8.1 per cent to Rs.19,138 crore during this period. Further, it was observed that all bank groups continued to show a marked preference for debentures over shares, though proportion of investment in shares has increased over the year across bank groups, except Foreign Banks. The SCBs’ investments in ‘other capital market instruments’ increased by 15.2 per cent during 2005-06 to Rs. 70,071 crore as on March 31, 2006.
Bank group-wise investment in instruments of capital market as on March 31, 2006 indicated that the Nationalised Banks accounted for the largest share of 47.5 per cent. This was followed by OSCBs (33.6 per cent), the SBI and its Associates (11.3 per cent) and Foreign Banks (7.6 per cent) (Chart 4). While the relative shares of the SBI and its Associates and Nationalised Banks declined, those of the other two bank groups witnessed increase during 2005-06.
II.4 Investment in Public Sector Enterprises
Investment of SCBs in bonds of Public Sector Enterprises witnessed a decline of 20.9 per cent to Rs. 10,824 crore as on March 31, 2006 (Statement 5). As regards their composition, banks invested 38.6 per cent in the bonds of Rural Electrification Corporation, followed by Power Finance Corporation (18.5 per cent). The SBI and its Associates recorded 24.4 per cent decline in investment in PSE bonds during 2005-06, while Nationalised Banks and OSCBs witnessed a decline of 24.3 per cent and 14.6 per cent, respectively. 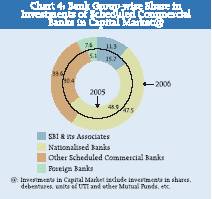
II.5 Maturity Profile of Outstanding Investment in Government Securities
The maturity classification of investment in Central and State Government securities excluding postal savings and other obligations for different bank groups is presented in Statement 6.
The maturity profile of holdings of Government securities (Central and State securities taken together) by SCBs as at the end-March 2006 is depicted in Chart 5. As reflected in Chart 5, over two-fifths (40.9 per cent) of such securities held by SCBs were in the maturity bracket 2010-2015, followed by the maturity bracket 2015 and above (25.8 per cent) and maturity bracket 2007-10 (19.1 per cent). Investment outstanding for the maturity bracket (2006-07), accounted for the lowest share (in the maturity profile of government securities held by SCBs). The maturity profile of holdings of Government securities was, however, not uniform across different bank groups. The share in the maturity bracket of 2010-2015 for SBI and its associates was the highest (48.5 per cent), 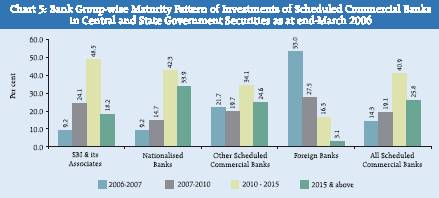
followed by Nationalised Banks (42.3 per cent), while for Foreign Banks it was 16.3 per cent. About one-third (33.4 per cent) of Government securities held by SCBs would be maturing by 2010 (i.e., residual maturity less than 4 years). The proportion of Government securities in this maturity bracket was 33.3 per cent for SBI and its Associates, 23.9 per cent for Nationalised Banks. Foreign Banks held substantial portion (80.5 per cent) of their holdings in this maturity bracket.
The maturity profile of Central Government securities held by SCBs as at end-March 2006 followed the pattern observed for their holding of Government securities (Central and State securities taken together) (Chart 6). At all SCBs level, Central Government securities maturing in 2010-2015 constituted the largest share (36.5 per cent), followed by the maturity beyond 2015 (27.9 per cent). In the case of SBI and its associates, 37.3 per cent of holding of Central Government securities was with maturity up to 2010, as against 23.5 per cent in the case of Nationalised Banks. In the case of OSCBs and Foreign Banks, a large proportion of their 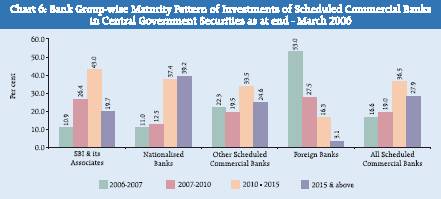
holdings (41.8 per cent and 80.5 per cent, respectively) fell in this bracket. The proportion of Central Government securities with maturity in 2015 and beyond was 39.2 per cent for Nationalised Banks. It was lower at 24.6 for the OSCBs and at 19.7 per cent for SBI and its Associates.
As regards the State Government securities, 62.2 per cent of SCBs holdings were in the maturity bracket 2010-2015. Across bank groups, this proportion was highest in the case of the SBI and its Associates (70.1 per cent), followed by Nationalised Banks (58.6 per cent) and OSCBs (50.6 per cent) (Chart 7). State Government securities maturing up to 2010 constituted 18.2 per cent, 25.5 per cent and 26.2 per cent of holdings in the case of the SBI and its Associates, Nationalised Banks and OSCBs, respectively.
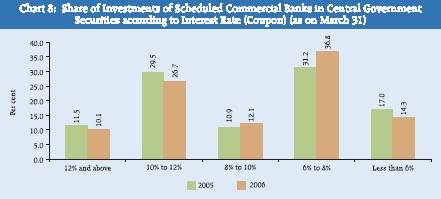
II.6 Investments in Central and State Government Securities (excluding Treasury Bills, Postal Obligations, etc.) – According to Interest Rate The distribution of banks’ investments in Central and State Government securities according to different interest (coupon) rate classes as on March 31, 2006 is set out in Statement 7. During 2005-06, Central Government securities with interest rate of ‘6 per cent to 10 per cent’ witnessed concentration as their share increased from 42.1 per cent as on March 31, 2005 to 48.9 per cent. As against this the proportion of banks’ holdings of Central Government securities with interest rate ‘less than 6 per cent’ and ‘10 per cent and above’ declined from 17.0 per cent as on March 31, 2005 to 14.3 per cent as on March 31, 2006 and from 41.0 per cent as on March 31, 2005 to 36.8 per cent as on March 31, 2006, respectively (Chart 8).
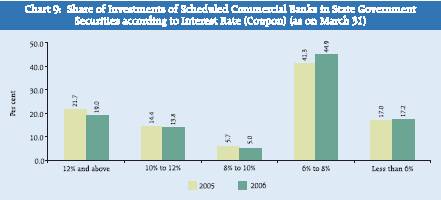
In regard to State Government securities, the distribution of securities in various interest rate groups did not depict perceptible changes in their position as on March 31, 2006 over the position as on March 31, 2005. The proportion of securities with interest rate of ‘6 per cent to 8 per cent’ increased from 41.3 per cent as on March 31, 2005 to 44.9 per cent as on March 31, 2006 (Chart 9). The proportion of State Government securities with interest rate ‘12 per cent and above’ stood at 19.0 per cent as on March 31, 2006; as against at 21.7 per cent on March 31, 2005. 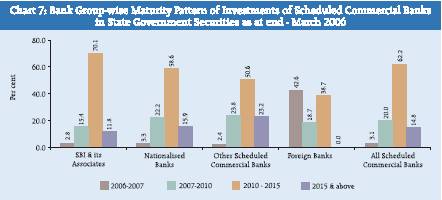
SBI and its Associates’ holdings of Central Government securities with interest rate of ‘less than 6 per cent’ fell from 20.1 per cent in 2005 to 13.3 per cent in 2006 and those with interest rate of ‘6 per cent to 8 per cent’ accounted for 33.2 per cent (as against 25.4 per cent in 2005) of their total holdings in Central Government securities as on March 31, 2006 (Chart 10). The share of securities with interest rate of ‘10 per cent and above’, however, declined from 42.5 per cent to 38.6 per cent during 2005-06. Of the total Central Government securities held by Nationalised Banks at end-March 2006, 42.5 per cent were in the interest rate ranges of ‘6 to 8 per cent’ as against 36.6 per cent at end-March 2005 (Chart 10). The share of securities in the interest rate range of ‘10 per cent and above’ declined from 41.8 per cent to 34.0 per cent. 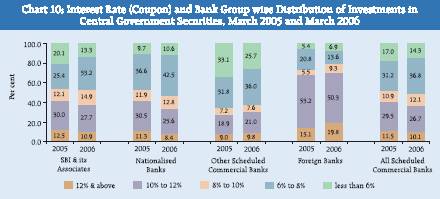
In case of OSCBs, the share of Central Government securities with coupon less than 6 per cent decreased from 33.1 per cent in 2005 to 25.7 per cent as at end-March 2006, and that of securities with interest rate ranges of ‘6 to 8 per cent’ and ‘10 to 12 per cent’ moved up. In respect of Foreign Banks, the proportion of Central Government securities with the interest rate of ‘10 to 12 per cent’ was 50.3 per cent of investment in March 2006; the share in the previous year was 53.2 per cent.
In the case of State Government securities held by different bank groups, major portion of the holdings was in interest rate range of ‘6 per cent to 8 per cent’ for SBI and its associates (51.9 per cent), Nationalised Banks (41.4 per cent) and OSCBs (44.1 per cent) (Chart 11). Compared to investments of other bank groups, the Foreign Banks had negligible amount of investment in State Government securities and their investment was entirely in the interest range of ‘11 per cent and above’. II.7 Classification of Investment Portfolio of Banks into HTM, AFS and HFT Categories- Bank Group-wise
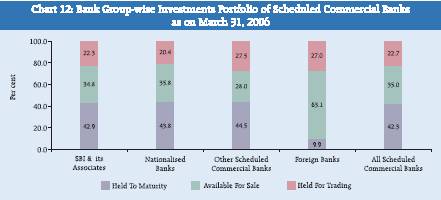
The SCBs’ investment in different types of securities, as on March 31, 2006, as classified into three categories, viz., held to maturity (HTM), available for sale (AFS) and held for trading (HFT) for each bank group are depicted in Chart 12. All the bank groups, except Foreign Banks, held major part of their investment portfolio (in the range of 42.9 per cent to 44.5 per cent), under HTM category. AFS category for the SBI and its associates, Nationalised Banks and OSCBs accounted for 34.8 per cent, 35.8 per cent and 28.0 per cent, respectively. Foreign Banks held 63.1 per cent of the investments in AFS category and 27.0 per cent under HFT category. The shares of securities in HFT category was the lowest for Nationalised Banks (20.4 per cent), followed by SBI and its associates (22.3 per cent) and about 27.5 per cent for OSCB and Foreign Banks. 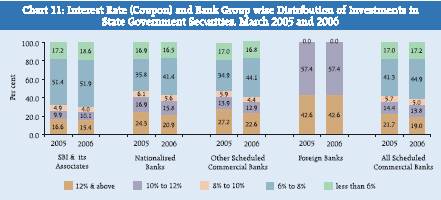
III. Investment of Scheduled Commercial Banks in State-level Securities
The state-wise investment of SCBs in various state-level securities as on March 31, 2005 and 2006 are presented in Statement 8. State-level securities consisted of securities floated by the State Governments, bonds of state-level bodies guaranteed by the State Governments, share capital of RRBs and debentures of cooperative institutions. SCBs’ investments in such securities declined by 4.1 per cent to Rs 1,23,930 crore as at end March 2006. The decline in investment was seen across the securities issued by different state level bodies, except investment in RRBs. Majority of such investments were in State Government securities (State Development Loans - SDL), accounting for 91.7 per cent of the total amount of State-level securities as on March 31, 2006 (89.1 per cent as on March 31, 2005). Other important state-level securities in which banks invested were State Electricity Boards (3.3 per cent), other Government and Quasi-Government bodies (2.0 per cent) and State Financial Corporations (SFCs) (1.3 per cent). Banks’ investment in six States, viz., Uttar Pradesh, West Bengal, Andhra Pradesh, Maharashtra, Rajasthan and Tamil Nadu accounted for more than 50 per cent (52.4 per cent) of their investment in various state-level securities in 2006 (52.1 per cent as on March 31, 2005).
State-wise investment of banks as on March 31, 2006 in the State Government securities (SDL) was the highest in Uttar Pradesh (Rs.14,976 crore), followed by West Bengal (Rs.10,642 crore) and Andhra Pradesh (Rs.10,062 crore). The investment of SCBs in the bonds of SEBs was at Rs.4,129 crore as on March 31, 2006 and the state of Madhya Pradesh was the largest recipient (Rs.587 crore) followed by West Bengal (Rs.541 crore). SCBs’ investment in SFCs amounted to Rs.1,656 crore as on March 31, 2006 and were the highest in Uttar Pradesh (Rs.343 crore), followed by Rajasthan (Rs.151 crore). Banks’ investment in securities of State Industrial Development Corporations (SIDCs) amounted to Rs.598 crore as on March 31, 2006 and of this amount, investment in Tamil Nadu (Rs.167 crore) was the highest. Banks’ investment in RRBs amounted to Rs.723 crore as on March 31, 2006 constituting 0.6 per cent of total investment in state level securities.
SCBs’ investment in interest-bearing State Government securities (SDLs) as on March 31, 2005 and 2006 are presented in Statement 9. Of the total outstanding State Government securities of Rs.2,35,173 crore, SCBs holdings amounted to Rs. 1,13,622 crore indicating the proportion (absorption rate) of investment of SCBs, at the aggregate level at 48.3 per cent of the total outstanding amount of interest-bearing state securities as at end-March 2006 ( 54.8 per cent as at end-March 2005).
Bank group-wise pattern of investment in the State Government securities, shares, bonds, debentures, etc., issued by state level bodies, for the years 2005 and 2006 is presented in Statement 10. Of the total investments of Rs.1,23,930 crore in state-level securities as on March 31, 2006, the Nationalised Banks accounted for the highest share at 63.6 per cent, followed by the SBI and its Associates at 32.2 per cent. Their respective shares were 62.1 per cent and 33.7 per cent, as at March 31, 2005. Specifically, with respect to investment in state-level securities in North-Eastern States, the SBI and its Associates accounted for the highest share among all bank groups. These banks contributed, in the respective State level securities, 58.0 per cent in Mizoram, 56.6 per cent in Manipur, 55.7 per cent in Nagaland and 51.7 per cent in Tripura. In Uttaranchal and Sikkim, this bank group’s share stood at 55.1 per cent and 45.9 per cent, respectively.
IV. Summary
During 2005-06 total investment of SCBs increased merely by Rs.3,103 crore or 0.4 per cent to Rs. 8,54,657 crore as on March 31, 2006; the increase was substantially higher at Rs.70,060 crore in 2004-05. The fall in these investments of SCBs, could also reflect the rebalancing of their portfolio to meet expanding credit needs of the growing economy. The incremental investment in Government securities in 2005-06 at Rs.8,022 crore was significantly low compared with that in 2004-05 (Rs. 69,075 crore). Of the total incremental investment Rs.9,616 crore in Central Government securities in 2005-06, OSCBs and Foreign banks had a positive contribution of Rs. 27,158 crore and Rs.8,378 crore, respectively, while the SBI and its Associates and Nationalised Banks showed a decline in their Central Government securities portfolio to the extent of Rs.25,507 crore and Rs.414 crore, respectively.
Share of investments of SCBs under the HTM category stood at 42.3 per cent as on March 31, 2006 compared with a lower share of 30.4 per cent as on March 31, 2005. The share of investments classified under AFS and HFT categories declined from 39.8 per cent and 29.8 per cent in 2005 to 35.0 per cent and 22.7 per cent in 2006, respectively. In the case of Government securities, the share of investments classified under HTM category in 2005-06 increased to 48.9 per cent from 33.8 per cent a year ago.
Over two-fifths (40.9 per cent) of the Government securities (Central and State securities taken together) held by SCBs were in the maturity bracket 2010-2015, while 19.7 per cent had maturity between 2015-2020 and 33.4 per cent of securities were maturing up to 2010 (i.e., residual maturity less than 4 years). As regards holding of State Governments securities, SCBs are holdings 62.2 per cent in the maturity bracket 2010-2015.
SCBs’ investments in State-level securities (securities floated by the State Governments, bonds of state-level bodies guaranteed by the State Governments, share capital of RRBs and debentures of cooperative institutions, etc.) declined by 4.1 per cent to Rs 1,23,930 crore as at end- March 2006. The decline in investment was spread across the securities issued by different state level bodies, except investment in RRBs. State Government securities (State Development Loans - SDLs), constituted the major part, accounting for 91.7 per cent of the total investments in State-level securities. State-wise investment of banks as on March 31, 2006, in the State Government securities (SDL) was highest in Uttar Pradesh (Rs.14,976 crore), followed by West Bengal (Rs.10,642 crore) and Andhra Pradesh (Rs.10,062 crore). The investment of SCBs in the bonds of State Electricity Boards (SEBs) was Rs.4,129 crore, as on March 31, 2006, as against Rs. 5,034 crore as on March 31, 2005. SCBs’ investment in State Financial Corporations (SFCs) amounted to Rs.1,656 crore as on March 31, 2006, as against Rs. 2,871 crore as on March 31, 2005. Banks’ investment in securities of State Industrial Developmentb Corporations (SIDCs) amounted to Rs.598 crore as on March 31, 2006, as against Rs. 858 crore as on March 31, 2005. Banks’ investment in RRBs amounted to Rs.723 crore as on March 31, 2006 constituting 0.6 per cent of total investment in State level securities.
Statement 1 : Investments of Scheduled Commercial Banks (As at End-March) |
(Amount in Rs. lakh) |
Category |
|
|
Absolute
Variation |
Percentage Variation |
|
2005 |
2006 |
2005 over |
2006 over |
2005 over |
2006 over |
|
|
|
2004 |
2005 |
2004 |
2005 |
1 |
2 |
3 |
4 |
5 |
6 |
7 |
I. |
Investment by offices in India |
837559,19 |
840376,03 |
69685,65 |
2816,84 |
9.1 |
0.3 |
|
|
|
(98.4) |
(98.3) |
(99.5) |
(90.8) |
|
|
|
A. |
Indian Government Securities |
653496,70 |
661518,31 |
69075,10 |
8021,61 |
11.8 |
1.2 |
|
|
|
|
(76.7) |
(77.4) |
(98.6) |
(258.5) |
|
|
|
|
(i) |
Central Government |
538091,36 |
547896,67 |
62570,72 |
9805,31 |
13.2 |
1.8 |
|
|
|
|
(63.2) |
(64.1) |
(89.3) |
(316.0) |
|
|
|
|
(ii) |
State Government |
115216,12 |
113621,64 |
7963,30 |
–1594,48 |
7.4 |
–1.4 |
|
|
|
|
(13.5) |
(13.3) |
(11.4) |
(-51.4) |
|
|
|
|
(iii) |
Others * |
189,22 |
— |
–1458,92 |
–189,22 |
–88.5 |
–100.0 |
|
|
|
|
— |
|
(–2.1) |
— |
|
|
|
B. |
Other Domestic Securities, |
183244,96 |
176156,80 |
2918,61 |
–7088,16 |
1.6 |
–3.9 |
|
|
Bonds, Shares, etc. |
(21.5) |
(20.6) |
(4.2) |
(–228.4) |
|
|
|
|
(i) |
Other Trustee Securities |
18864,55 |
14993,68 |
–1637,84 |
–3870,87 |
–8.0 |
–20.5 |
|
|
|
(excluding units of UTI) |
(2.2) |
(1.8) |
(–2.3) |
(–124.8) |
|
|
|
|
(ii) |
Fixed Deposits |
19630,70 |
15779,13 |
503,28 |
–3851,57 |
2.6 |
–19.6 |
|
|
|
|
(2.3) |
(1.8) |
(0.7) |
(–124.1) |
|
|
|
|
(iii) |
Shares and Debentures of joint |
103531,31 |
91092,55 |
–2103,32 |
–12438,76 |
–2.0 |
–12.0 |
|
|
|
Stock companies(Market Value) |
(12.2) |
(10.7) |
(–3.0) |
(–400.9) |
|
|
|
|
(iv) |
Initial Contribution to share |
3,61 |
3,47 |
2,48 |
–14 |
219.5 |
–3.9 |
|
|
|
capital of UTI |
— |
— |
— |
— |
|
|
|
|
(v) |
Units of UTI |
19,00 |
29,17 |
2,28 |
10,17 |
13.6 |
53.5 |
|
|
|
|
— |
— |
— |
(0.3) |
|
|
|
|
(vi) |
Certificate of Deposits and |
3449,80 |
8457,10 |
1154,12 |
5007,30 |
50.3 |
145.1 |
|
|
|
Commercial Papers. |
(0.4) |
(1.0) |
(1.6) |
(161.4) |
|
|
|
|
(vii) |
Mutual Funds |
10480,43 |
11454,62 |
935,32 |
974,19 |
9.8 |
9.3 |
|
|
|
|
(1.2) |
(1.3) |
(1.3) |
(31.4) |
|
|
|
|
(viii) Others @ |
27265,56 |
34347,08 |
4062,29 |
7081,52 |
17.5 |
26.0 |
|
|
|
|
(3.2) |
(4.0) |
(5.8) |
(228.2) |
|
|
|
C. |
Foreign Securities |
817,53 |
2700,92 |
–2308,06 |
1883,39 |
–73.8 |
230.4 |
|
|
|
(0.1) |
(0.3) |
(-3.3) |
(60.7) |
|
|
|
|
(i) |
Foreign Government Securities |
25 |
1 |
–81,52 |
–24 |
–99.7 |
–96.0 |
|
|
|
|
— |
— |
(–0.1) |
— |
|
|
|
|
(ii) |
Other Foreign Investments |
817,28 |
2700,91 |
–2226,54 |
1883,63 |
–73.1 |
230.5 |
|
|
|
|
(0.1) |
(0.3) |
(–3.2) |
(60.7) |
|
|
II. |
Investments by Foreign Offices |
13995,34 |
14281,30 |
373,92 |
285,96 |
2.7 |
2.0 |
|
of Indian Banks |
(1.6) |
(1.7) |
(0.5) |
(9.2) |
|
|
|
(i) |
Indian securities |
0 |
131,68 |
— |
131,68 |
— |
— |
|
|
|
|
— |
— |
|
(4.2) |
|
|
|
(ii) |
Foreign Countries Securities |
3353,13 |
2583,48 |
433,10 |
–769,65 |
14.8 |
–23.0 |
|
|
|
|
(0.4) |
(0.3) |
(0.6) |
(–24.8) |
|
|
|
(iii) |
Other Investments |
10642,21 |
11566,14 |
–59,18 |
923,93 |
–0.6 |
8.7 |
|
|
|
|
(1.2) |
(1.4) |
(–0.1) |
(29.8) |
|
|
Total |
851554,53 |
854657,33 |
70059,57 |
3102,80 |
9.0 |
0.4 |
|
(100.0) |
(100.0) |
(100.0) |
(100.0) |
|
|
— : Nil or Negligible.
* : Includes Postal Savings Deposits Certificates and Other Postal Obligations.
@ : Includes Investments in Debentures and Bonds of Quasi - Govt.Bodies, Venture Capital Funds, etc.
Note : Figures in brackets indicate percentages to ‘Total’. |
Statement 2: Bank Group-Wise Investments by Types of Securities |
(Amount in Rs. lakh) |
Bank Group |
Year |
Investments of Indian offices |
|
(end -
March) |
Indian Govt.
Securities |
Other Trustee Securities |
|
|
Central |
State |
Total |
of which |
|
|
Government |
Government |
|
All India |
|
|
Securities@ |
Securities |
|
Bodies |
1 |
2 |
3 |
4 |
5 |
6 |
1. |
State Bank of India & Associates |
2005 |
174163,79 |
40892,72 |
5222,89 |
2765,44 |
|
|
|
|
|
(69.6) |
(16.3) |
(2.1) |
(1.1) |
|
|
|
|
2006 |
148656,86 |
37740,95 |
4803,62 |
2710,97 |
|
|
|
|
|
(69.3) |
(17.6) |
(2.2) |
(1.3) |
|
Variation in 2006
over 2005 |
|
|
|
|
|
|
|
(a) Absolute |
|
–25506,93 |
–3151,77 |
–419,27 |
–54,47 |
|
|
(b) Percentage |
|
(–14.6) |
(–7.7) |
(-8.0) |
(–2.0) |
|
|
|
|
|
|
|
|
|
2. |
Nationalised Banks |
2005 |
239062,38 |
70319,28 |
11318,30 |
6522,66 |
|
|
|
|
|
(58.3) |
(17.1) |
(2.8) |
(1.6) |
|
|
|
|
2006 |
238648,78 |
71796,72 |
9466,82 |
5764,67 |
|
|
|
|
|
(59.1) |
(17.8) |
(2.3) |
(1.4) |
|
Variation in 2006
over 2005 |
|
|
|
|
|
|
|
(a) |
Absolute |
|
–413,60 |
1477,44 |
–1851,48 |
–757,99 |
|
|
(b) |
Percentage |
|
(–0.2) |
(2.1) |
(–16.4) |
(–11.6) |
|
|
|
|
|
|
|
|
|
3. |
Other Scheduled
Commercial Banks |
2005 |
92213,59 |
3993,78 |
624,00 |
315,42 |
|
|
|
|
|
(62.2) |
(2.7) |
(0.4) |
(0.2) |
|
|
|
|
2006 |
119371,76 |
4073,63 |
482,52 |
274,13 |
|
|
|
|
|
(65.4) |
(2.2) |
(0.3) |
(0.2) |
|
Variation in 2006
over 2005 |
|
|
|
|
|
|
|
(a) |
Absolute |
|
27158,17 |
79,85 |
–141,48 |
–41,29 |
|
|
(b) |
Percentage |
|
(29.5) |
(2.0) |
(-22.7) |
(-13.1) |
|
|
|
|
|
|
|
|
|
4. |
Foreign Banks |
2005 |
32840,82 |
10,34 |
1718,36 |
1715,87 |
|
|
|
|
|
(76.5) |
— |
(4.0) |
(4.0) |
|
|
|
|
2006 |
41219,27 |
10,34 |
269,89 |
269,50 |
|
|
|
|
|
(76.6) |
— |
(0.5) |
(0.5) |
|
Variation in 2006
over 2005 |
|
|
|
|
|
|
|
(a) |
Absolute |
|
8378,45 |
— |
–1448,47 |
–1446,37 |
|
|
(b) |
Percentage |
|
(25.5) |
|
(–84.3) |
(–84.3) |
|
|
|
|
|
|
|
|
|
5. |
All Scheduled
Commercial Banks |
2005 |
538280,58 |
115216,12 |
18883,55 |
11319,39 |
|
|
|
|
|
(63.2) |
(13.5) |
(2.2) |
(1.3) |
|
|
|
|
2006 |
547896,67 |
113621,64 |
15022,85 |
9019,27 |
|
|
|
|
|
(64.1) |
(13.3) |
(1.8) |
(1.1) |
|
Variation in 2006
over 2005 |
|
|
|
|
|
|
|
(a) |
Absolute |
|
9616,09 |
–1594,48 |
–3860,70 |
–2300,12 |
|
|
(b) |
Percentage |
|
(1.8) |
(–1.4) |
(–20.4) |
(–20.3) |
|
|
|
|
|
|
|
|
|
— : Nil or Negligible.
@ : Inclusive of investments in Postal Savings Deposit Certificates and other postal obligations.
Note : Figures in brackets indicate percentages to ‘Total’. |
Statement 2: Bank Group-Wise Investments by Types of Securities (Concld.) |
(Amount in Rs. lakh) |
Bank Group |
Year |
Investments of
Indian offices |
Investments |
Total |
|
(end - |
Shares and |
Other |
Foreign |
of Foreign |
Investments |
|
March) |
Debentures of
Joint Stock
Companies
(Market Value) |
Domestic
Securities |
Securities |
Offices |
|
|
|
|
|
|
|
|
1 |
2 |
7 |
8 |
9 |
10 |
11 |
1. |
State Bank of India |
2005 |
19179,83 |
6560,97 |
90 |
4347,96 |
250369,06 |
|
& Associates |
|
(7.7) |
(2.6) |
— |
(1.7) |
(100.0) |
|
|
|
2006 |
10886,70 |
7298,36 |
152,59 |
4847,00 |
214386,08 |
|
|
|
|
(5.1) |
(3.4) |
(0.1) |
(2.3) |
(100.0) |
|
Variation in 2006 over 2005 |
|
|
|
|
|
|
|
(a) Absolute |
|
–8293,13 |
737,39 |
151,69 |
499,04 |
–35982,98 |
|
(b) Percentage |
|
(-43.2) |
(11.2) |
(16854.0) |
(11.5) |
(–14.4) |
|
|
|
|
|
|
|
|
|
2. |
Nationalised Banks |
2005 |
53934,48 |
26400,26 |
171,74 |
8849,21 |
410055,65 |
|
|
|
|
(13.2) |
(6.4) |
— |
(2.2) |
(100.0) |
|
|
|
2006 |
51426,36 |
25116,47 |
2011,00 |
5372,43 |
403838,58 |
|
|
|
|
(12.7) |
(6.2) |
(0.5) |
(1.3) |
(100.0) |
|
Variation in 2006
over 2005 |
|
|
|
|
|
|
|
(a) |
Absolute |
|
–2508,12 |
–1283,79 |
1839,26 |
–3476,78 |
—6217,07 |
|
(b) |
Percentage |
|
(–4.7) |
(–4.9) |
(1071.0) |
(–39.3) |
(–1.5) |
|
|
|
|
|
|
|
|
|
3. |
Other Scheduled |
2005 |
24874,60 |
25075,76 |
644,89 |
798,17 |
148224,79 |
|
Commercial Banks |
|
(16.8) |
(16.9) |
(0.4) |
(0.5) |
(100.0) |
|
|
|
2006 |
22057,94 |
32026,25 |
537,33 |
4061,87 |
182611,30 |
|
|
|
|
(12.1) |
(17.5) |
(0.3) |
(2.2) |
(100.0) |
|
Variation in 2006 over 2005 |
|
|
|
|
|
|
|
(a) |
Absolute |
|
–2816,66 |
6950,49 |
–107,56 |
3263,70 |
34386,51 |
|
(b) |
Percentage |
|
(–11.3) |
(27.7) |
(–16.7) |
(408.9) |
(23.2) |
|
|
|
|
|
|
|
|
|
4. |
Foreign Banks |
2005 |
5542,40 |
2793,11 |
— |
— |
42905,03 |
|
|
|
|
(12.9) |
(6.5) |
|
|
(100.0) |
|
|
|
2006 |
6721,55 |
5600,32 |
— |
— |
53821,37 |
|
|
|
|
(12.5) |
(10.4) |
|
|
(100.0) |
|
Variation in 2006 over 2005 |
|
|
|
|
|
|
|
(a) |
Absolute |
|
1179,15 |
2807,21 |
— |
— |
10916,34 |
|
(b) |
Percentage |
|
(21.3) |
(100.5) |
|
|
(25.4) |
|
|
|
|
|
|
|
|
|
5. |
All Scheduled |
2005 |
103531,31 |
60830,10 |
817,53 |
13995,34 |
851554,53 |
|
Commercial Banks |
|
(12.2) |
(7.1) |
(0.1) |
(1.6) |
(100.0) |
|
2006 |
91092,55 |
70041,40 |
2700,92 |
14281,30 |
854657,33 |
|
|
(10.7) |
(8.2) |
(0.3) |
(1.7) |
(100.0) |
|
Variation in
2006 over 2005 |
|
|
|
|
|
|
|
(a) |
Absolute |
|
–12438,76 |
9211,30 |
1883,39 |
285,96 |
3102,80 |
|
(b) |
Percentage |
|
(–12.0) |
(15.1) |
(230.4) |
(2.0) |
(0.4) |
Statement 3 : Bank Group-wise Classification of Investments in Other Trustee Securities |
(Amount in Rs.lakh) |
Securities / Shares /
Bonds / |
Year |
Bank Group |
All Scheduled |
Debentures issued by |
(end- |
State Bank |
Nationalised |
Other |
Foreign |
Commercial |
|
March) |
of India and its Associates |
Banks |
ScheduledCommercial Banks |
Banks |
Banks |
1 |
2 |
3 |
4 |
5 |
6 |
7 |
1. |
Local Authorities * |
2005 |
55,62 |
424,29 |
34,54 |
39 |
514,84 |
|
|
|
|
(1.1) |
(3.7) |
(5.5) |
(0.0) |
(2.7) |
|
|
|
2006 |
174,93 |
370,74 |
26,91 |
— |
572,58 |
|
|
|
|
(3.6) |
(3.9) |
(5.6) |
— |
(3.8) |
|
|
|
|
|
|
|
|
|
2. |
State Financial Corporations |
2005 |
520,17 |
1880,80 |
197,57 |
2,10 |
2600,64 |
|
|
|
|
(10.0) |
(16.6) |
(31.7) |
(0.1) |
(13.8) |
|
|
|
2006 |
305,63 |
1034,36 |
118,05 |
10 |
1458,14 |
|
|
|
|
(6.4) |
(10.9) |
(24.5) |
(0.0) |
(9.7) |
|
|
|
|
|
|
|
|
|
3. |
State Industrial Development |
2005 |
78,00 |
107,05 |
15,53 |
— |
200,58 |
|
Corporations |
|
(1.5) |
(0.9) |
(2.5) |
|
(1.1) |
|
|
|
2006 |
45,44 |
115,63 |
6,35 |
— |
167,42 |
|
|
|
|
(0.9) |
(1.2) |
(1.3) |
|
(1.1) |
|
|
|
|
|
|
|
|
|
4. |
State Electricity Boards |
2005 |
1326,38 |
1424,92 |
34,14 |
— |
2785,44 |
|
|
|
|
(25.4) |
(12.6) |
(5.5) |
|
(14.8) |
|
|
|
2006 |
1322,24 |
1342,66 |
33,39 |
— |
2698,29 |
|
|
|
|
(27.5) |
(14.2) |
(6.9) |
|
(18.0) |
|
|
|
|
|
|
|
|
|
5. |
Co-operative Institutions |
2005 |
91,10 |
89,53 |
1,25 |
— |
181,88 |
|
|
|
|
(1.7) |
(0.8) |
(0.2) |
|
(1.0) |
|
|
|
2006 |
15,31 |
47,86 |
67 |
29 |
64,13 |
|
|
|
|
(0.3) |
(0.5) |
(0.1) |
(0.1) |
(0.4) |
|
|
|
|
|
|
|
|
|
6. |
Industrial Finance Corporation |
2005 |
624,58 |
1111,69 |
70,85 |
8,49 |
1815,61 |
|
of India |
|
(12.0) |
(9.8) |
(11.4) |
(0.5) |
(9.6) |
|
|
|
2006 |
724,02 |
1111,73 |
46,95 |
8,47 |
1891,17 |
|
|
|
|
(15.1) |
(11.7) |
(9.7) |
(3.1) |
(12.6) |
|
|
|
|
|
|
|
|
|
7. |
National Bank for Agriculture |
2005 |
39,56 |
153,81 |
10,30 |
1201,00 |
1404,67 |
|
and Rural Development |
|
(0.8) |
(1.4) |
(1.7) |
(69.9) |
(7.4) |
|
|
|
2006 |
39,56 |
113,61 |
10,30 |
198,20 |
361,67 |
|
|
|
|
(0.8) |
(1.2) |
(2.1) |
(73.4) |
(2.4) |
|
|
|
|
|
|
|
|
|
8. |
Rural Electrification Corporation |
2005 |
69,96 |
245,81 |
20,25 |
— |
336,02 |
|
|
|
|
(1.3) |
(2.2) |
(3.2) |
|
(1.8) |
|
|
|
2006 |
66,96 |
151,01 |
14,35 |
— |
232,32 |
|
|
|
|
(1.4) |
(1.6) |
(3.0) |
|
(1.5) |
* : Includes Municipalities and Port Trust. ‘—’ : Nil or Negligible.
Note : Figures in brackets indicate percentages to ‘Total’. |
Statement 3 : Bank Group-wise Classification of Investments in Other Trustee Securities (Concld.) |
(Amount in Rs.lakh) |
Securities / Shares / Bonds / |
Year |
Bank Group |
All Scheduled |
Debentures issued by |
(end- |
State Bank |
Nationalised |
Other |
Foreign |
Commercial |
|
March) |
of India |
Banks |
Scheduled |
Banks |
Banks |
|
|
and its
Associates |
|
Commercial
Banks |
|
|
1 |
2 |
3 |
4 |
5 |
6 |
7 |
9. |
Export-Import Bank of India |
2005 |
57,45 |
224,21 |
13,66 |
3,70 |
299,02 |
|
|
|
(1.1) |
(2.0) |
(2.2) |
(0.2) |
(1.6) |
|
|
2006 |
50,44 |
150,07 |
13,01 |
4,20 |
217,72 |
|
|
|
(1.1) |
(1.6) |
(2.7) |
(1.6) |
(1.4) |
10. National Co-operative Devel- |
2005 |
47,75 |
349,15 |
— |
— |
396,90 |
|
opment Corporation of India |
|
(0.9) |
(3.1) |
|
|
(2.1) |
|
|
2006 |
43,75 |
324,15 |
— |
— |
367,90 |
|
|
|
(0.9) |
(3.4) |
|
|
(2.4) |
11. |
Housing and Urban
Development |
2005 |
119,59 |
285,01 |
23,00 |
45 |
428,05 |
|
Corporation of India |
|
(2.3) |
(2.5) |
(3.7) |
(0.0) |
(2.3) |
|
|
2006 |
117,42 |
244,74 |
6,60 |
45 |
369,21 |
|
|
|
(2.4) |
(2.6) |
(1.4) |
(0.2) |
(2.5) |
12. Unit Trust of India |
2005 |
— |
19,00 |
— |
— |
19,00 |
|
|
|
|
(0.2) |
|
|
(0.1) |
|
|
2006 |
— |
29,17 |
— |
— |
29,17 |
|
|
|
|
(0.3) |
|
|
(0.2) |
13. Industrial Reconstruction |
2005 |
96,58 |
304,69 |
24 |
50 |
402,01 |
|
Bank of India |
|
(1.8) |
(2.7) |
— |
— |
(2.1) |
|
|
2006 |
95,75 |
205,43 |
59 |
50 |
302,27 |
|
|
|
(2.0) |
(2.2) |
(0.1) |
(0.2) |
(2.0) |
14. |
Housing Boards |
2005 |
11,54 |
68,30 |
2,55 |
— |
82,39 |
|
|
|
(0.2) |
(0.6) |
(0.4) |
|
(0.4) |
|
|
2006 |
8,05 |
68,94 |
1,40 |
— |
78,39 |
|
|
|
(0.2) |
(0.7) |
(0.3) |
|
(0.5) |
15. |
Others |
2005 |
2084,61 |
4630,04 |
200,12 |
501,73 |
7416,50 |
|
|
|
(39.9) |
(40.9) |
(32.1) |
(29.2) |
(39.3) |
|
|
2006 |
1794,12 |
4156,72 |
203,95 |
57,68 |
6212,47 |
|
|
|
(37.3) |
(43.9) |
(42.3) |
(21.4) |
(41.4) |
16. |
Total |
2005 |
5222,89 |
11318,30 |
624,00 |
1718,36 |
18883,55 |
|
|
|
(100.0) |
(100.0) |
(100.0) |
(100.0) |
(100.0) |
|
|
2006 |
4803,62 |
9466,82 |
482,52 |
269,89 |
15022,85 |
|
|
|
(100.0) |
(100.0) |
(100.0) |
(100.0) |
(100.0) |
Statement 4: Bank Group-Wise Investments in Shares and
Debentures of Joint Stock Companies, Units and ‘Other’ Securities |
(Amount in Rs.lakh) |
Bank Group |
Year |
Shares |
Debentures |
|
(end-March) |
Face
Value |
Market
Value@ |
Face
Value |
Market
Value@ |
1 |
2 |
3 |
4 |
5 |
6 |
1. |
State Bank of India & its Associates |
2005 |
2459,59 |
3948,77 |
15210,82 |
15231,06 |
|
|
|
(13.9) |
(20.6) |
(86.1) |
(79.4) |
|
|
2006 |
2125,23 |
4267,16 |
6998,78 |
6619,54 |
|
|
|
(23.3) |
(39.2) |
(76.7) |
(60.8) |
2. |
Nationalised Banks |
2005 |
5507,37 |
7880,43 |
46366,61 |
46054,05 |
|
|
|
(10.6) |
(14.6) |
(89.4) |
(85.4) |
|
|
2006 |
5316,45 |
9228,79 |
41752,63 |
42197,57 |
|
|
|
(11.3) |
(17.9) |
(88.7) |
(82.1) |
3. |
Other Scheduled Commercial Banks |
2005 |
4154,08 |
5452,57 |
20455,53 |
19422,03 |
|
|
|
(16.9) |
(21.9) |
(83.1) |
(78.1) |
|
|
2006 |
9161,28 |
5225,89 |
17526,15 |
16832,05 |
|
|
|
(34.3) |
(23.7) |
(65.7) |
(76.3) |
4. |
Foreign Banks |
2005 |
425,58 |
430,47 |
5133,91 |
5111,93 |
|
|
|
(7.7) |
(7.8) |
(92.3) |
(92.2) |
|
|
2006 |
412,87 |
416,54 |
6439,24 |
6305,01 |
|
|
|
(6.0) |
(6.2) |
(94.0) |
(93.8) |
All Scheduled Commercial Banks |
2005 |
12546,62 |
17712,24 |
87166,87 |
85819,07 |
|
|
|
(12.6) |
(17.1) |
(87.4) |
(82.9) |
|
|
2006 |
17015,83 |
19138,38 |
72716,80 |
71954,17 |
|
|
|
(19.0) |
(21.0) |
(81.0) |
(79.0) |
@ : Investments in shares and debentures are at estimated realisable value
where market value is not available.
* : ‘Others’ includes securities such as initial contribution to share capital of UTI,
shares of DICGC, Fixed Deposits with banks and Mutual Funds, CDs and CPs.
Note : Figures in brackets indicate percentages to ‘Total’. |
Statement 4: Bank Group-Wise Investments in Shares and Debentures of Joint Stock
Companies, Units and ‘Other’ Securities (Concld.) |
(Amount in Rs.lakh) |
Bank Group |
Year |
Sub Total |
Units of UTI |
Total |
|
(end-March) |
Face
Value |
Market
Value@ |
and Others*
Face Value |
|
|
|
|
|
|
|
1 |
2 |
7 |
8 |
9 |
10 |
|
|
(3+5) |
(4+6) |
|
(8+9) |
|
|
|
|
|
|
1. |
State Bank of India &
its Associates |
2005 |
17670,41 |
19179,83 |
6560,97 |
25740,80 |
|
|
|
(100.0) |
(100.0) |
|
(15.7) |
|
|
|
|
|
|
|
|
|
2006 |
9124,01 |
10886,70 |
7298,36 |
18185,06 |
|
|
|
(100.0) |
(100.0) |
|
(11.3) |
|
|
|
|
|
|
|
2. |
Nationalised Banks |
2005 |
51873,98 |
53934,48 |
26419,26 |
80353,74 |
|
|
|
(100.0) |
(100.0) |
|
(48.9) |
|
|
|
|
|
|
|
|
|
2006 |
47069,08 |
51426,36 |
25145,64 |
76572,00 |
|
|
|
(100.0) |
(100.0) |
|
(47.5) |
|
|
|
|
|
|
|
3. |
Other Scheduled Commercial Banks |
2005 |
24609,61 |
24874,60 |
25075,76 |
49950,36 |
|
|
|
(100.0) |
(100.0) |
|
(30.4) |
|
|
|
|
|
|
|
|
|
2006 |
26687,43 |
22057,94 |
32026,25 |
54084,19 |
|
|
|
(100.0) |
(100.0) |
|
(33.6) |
|
|
|
|
|
|
|
4. |
Foreign Banks |
2005 |
5559,49 |
5542,40 |
2793,11 |
8335,51 |
|
|
|
(100.0) |
(100.0) |
|
(5.1) |
|
|
|
|
|
|
|
|
|
2006 |
6852,11 |
6721,55 |
5600,32 |
12321,87 |
|
|
|
(100.0) |
(100.0) |
|
(7.6) |
|
|
|
|
|
|
|
All Scheduled Commercial Banks |
2005 |
99713,49 |
103531,31 |
60849,10 |
164380,41 |
|
|
|
(100.0) |
(100.0) |
|
(100.0) |
|
|
|
|
|
|
|
|
|
2006 |
89732,63 |
91092,55 |
70070,57 |
161163,12 |
|
|
|
(100.0) |
(100.0) |
|
(100.0) |
Statement 5 : Scheduled Commercial Banks’ Investments in Bonds Issued by |
Public Sector Enterprises (As at end-March) |
(Amount in Rs.lakh) |
Public Sector |
State Bank of India |
Nationalised Banks |
Other Scheduled |
Enterprises/
Undertakings |
and its
Associates |
|
|
Commercial Banks |
|
|
2005 |
2006 |
2005 |
2006 |
2005 |
2006 |
1 |
|
2 |
3 |
4 |
5 |
6 |
7 |
1. |
Indian Railway Finance |
236,80 |
35,00 |
1126,65 |
1057,42 |
215,98 |
155,06 |
|
Corporation (Railway Bonds) |
|
|
|
|
|
|
2. |
National Thermal Power |
50,00 |
50,00 |
364,25 |
281,45 |
— |
10,00 |
|
Corporation (NTPC) |
|
|
|
|
|
|
3. |
National Hydro-Electric |
— |
— |
13,00 |
5,00 |
11,00 |
22,00 |
|
Power Corporation (NHPC) |
|
|
|
|
|
|
4. |
Nuclear Power Corporation |
21,00 |
10,75 |
1171,40 |
514,30 |
68,50 |
144,60 |
5. |
Power Finance Corporation |
152,10 |
148,10 |
1514,51 |
1041,39 |
776,96 |
460,14 |
6. |
Indian Telephone |
— |
— |
240,50 |
192,60 |
16,30 |
225,80 |
|
Industries (ITI) |
|
|
|
|
|
|
7. |
Neyvelli Lignite Corporation |
— |
38,00 |
30,00 |
30,00 |
— |
— |
8. |
Indian Petrochemical |
— |
— |
99 |
— |
3,33 |
7,00 |
|
Corporation Limited |
|
|
|
|
|
|
9. |
Mahanagar Telephone |
— |
— |
— |
— |
68 |
— |
|
Nigam Ltd. (MTNL) |
|
|
|
|
|
|
10. |
Rural Electrification |
168,96 |
142,96 |
3388,57 |
2632,93 |
1495,64 |
1398,02 |
|
Corporation (REC) |
|
|
|
|
|
|
11. |
Hindustan Photo Film |
3,00 |
3,00 |
— |
— |
— |
— |
|
Mfg. Co. Ltd. |
|
|
|
|
|
|
12. |
Housing & Urban |
354,57 |
318,10 |
1205,34 |
1095,97 |
685,62 |
374,98 |
|
Dev. Corp. (HUDCO) |
|
|
|
|
|
|
Total |
986,43 |
745,91 |
9055,21 |
6851,06 |
3274,01 |
2797,60 |
— : Nil or Negligible.
Note : Figures in brackets indicate percentages to ‘Total’. |
Statement 5 : Scheduled Commercial Banks’ Investments in Bonds Issued by |
Public Sector Enterprises (As at end-March) (Concld.) |
(Amount in Rs.lakh) |
Public Sector |
Foreign Banks |
|
All Scheduled |
|
Enterprises/Undertakings |
|
|
Commercial Banks |
|
|
2005 |
2006 |
2005 |
2006 |
1 |
8 |
9 |
10 |
11 |
1. |
Indian Railway Finance |
100,00 |
— |
1679,43 |
1247,48 |
|
Corporation (Railway Bonds) |
|
|
(12.3) |
(11.5) |
|
|
|
|
|
|
2. |
National Thermal Power |
97,17 |
— |
511,42 |
341,45 |
|
Corporation (NTPC) |
|
|
(3.7) |
(3.2) |
|
|
|
|
|
|
3. |
National Hydro-Electric |
— |
— |
24,00 |
27,00 |
|
Power Corporation (NHPC) |
|
|
(0.2) |
(0.2) |
|
|
|
|
|
|
4. |
Nuclear Power Corporation |
— |
— |
1260,90 |
669,65 |
|
|
|
|
(9.2) |
(6.2) |
|
|
|
|
|
|
5. |
Power Finance Corporation |
31,00 |
353,00 |
2474,57 |
2002,63 |
|
|
|
|
(18.1) |
(18.5) |
|
|
|
|
|
|
6. |
Indian Telephone |
— |
— |
256,80 |
418,40 |
|
Industries (ITI) |
|
|
(1.9) |
(3.9) |
|
|
|
|
|
|
7. |
Neyvelli Lignite Corporation |
— |
— |
30,00 |
68,00 |
|
|
|
|
(0.2) |
(0.6) |
|
|
|
|
|
|
8. |
Indian Petrochemical |
— |
— |
4,32 |
7,00 |
|
Corporation Limited |
|
|
— |
(0.1) |
|
|
|
|
|
|
9. |
Mahanagar Telephone |
— |
— |
68 |
— |
|
Nigam Ltd. (MTNL) |
|
|
— |
|
|
|
|
|
|
|
10. |
Rural Electrification |
— |
— |
5053,17 |
4173,91 |
|
Corporation (REC) |
|
|
(36.9) |
(38.6) |
|
|
|
|
|
|
11. |
Hindustan Photo Film |
— |
— |
3,00 |
3,00 |
|
Mfg. Co. Ltd. |
|
|
— |
— |
|
|
|
|
|
|
12. |
Housing & Urban |
146,84 |
76,02 |
2392,37 |
1865,07 |
|
Dev. Corp. (HUDCO) |
|
|
(17.5) |
(17.2) |
|
|
|
|
|
|
|
Total |
375,01 |
429,02 |
13690,66 |
10823,59 |
|
|
|
|
(100.0) |
(100.0) |
Statement 6 : Classification of Investments in Government Securities
According to Period of Maturity @ (As at end - March ) |
(Amount in Rs.lakh) |
Year/Period of |
State Bank of India and its Associates |
Nationalised Banks |
Maturity (during |
2005 |
2006 |
2005 |
2006 |
April-March) |
Central |
State |
Central |
State |
Central |
State |
Central |
State |
1 |
2 |
3 |
4 |
5 |
6 |
7 |
8 |
9 |
2005-06 |
25636,61 |
935,54 |
— |
— |
30546,86 |
1819,62 |
— |
— |
|
(14.7) |
(2.3) |
|
|
(12.8) |
(2.6) |
|
|
|
|
|
|
|
|
|
|
|
2006-07 |
14282,39 |
1067,90 |
16139,46 |
1075,09 |
11961,13 |
2355,07 |
26301,85 |
2359,35 |
|
(8.2) |
(2.6) |
(10.9) |
(2.8) |
(5.0) |
(3.3) |
(11.0) |
(3.3) |
|
|
|
|
|
|
|
|
|
2007-08 |
12217,88 |
2219,73 |
11787,34 |
2212,61 |
6025,22 |
4102,29 |
4725,22 |
4043,96 |
|
(7.0) |
(5.4) |
(7.9) |
(5.9) |
(2.5) |
(5.8) |
(2.0) |
(5.6) |
|
|
|
|
|
|
|
|
|
2008-09 |
11004,17 |
2070,97 |
9733,52 |
1541,82 |
12424,05 |
7079,98 |
9177,40 |
5941,53 |
|
(6.3) |
(5.1) |
(6.5) |
(4.1) |
(5.2) |
(10.1) |
(3.8) |
(8.3) |
|
|
|
|
|
|
|
|
|
2009-10 |
16949,58 |
1715,70 |
17817,01 |
2026,59 |
18237,52 |
5040,19 |
15874,98 |
5931,59 |
|
(9.7) |
(4.2) |
(12.0) |
(5.4) |
(7.6) |
(7.2) |
(6.7) |
(8.3) |
|
|
|
|
|
|
|
|
|
2010-15 |
61731,01 |
28759,49 |
63897,66 |
26448,45 |
79464,19 |
42630,45 |
89159,60 |
42104,32 |
|
(35.4) |
(70.3) |
(43.0) |
(70.1) |
(33.3) |
(60.6) |
(37.4) |
(58.6) |
|
|
|
|
|
|
|
|
|
2015-20 |
23744,97 |
4123,39 |
25504,69 |
4436,39 |
57306,64 |
7287,94 |
66666,97 |
11412,20 |
|
(13.6) |
(10.1) |
(17.2) |
(11.8) |
(24.0) |
(10.4) |
(27.9) |
(15.9) |
|
|
|
|
|
|
|
|
|
2020-25 |
8597,18 |
— |
479,68 |
— |
22968,71 |
3,74 |
14443,47 |
— |
|
(4.9) |
|
(0.3) |
|
(9.6) |
— |
(6.1) |
|
|
|
|
|
|
|
|
|
|
2025 and above |
— |
— |
3297,50 |
— |
— |
— |
12299,29 |
3,77 |
|
|
|
(2.2) |
|
|
|
(5.2) |
— |
|
|
|
|
|
|
|
|
|
Total |
174163,79 |
40892,72 |
148656,86 |
37740,95 |
238934,32 |
70319,28 |
238648,78 |
71796,72 |
|
(100.0) |
(100.0) |
(100.0) |
(100.0) |
(100.0) |
(100.0) |
(100.0) |
(100.0) |
|
|
|
|
|
|
|
|
|
— : Nil or Negligible.
@ : Excluding postal savings and other obligations.
Note : Figures in brackets indicate percentages to ‘Total’. |
Statement 6 : Classification of Investments in Government Securities According to |
Period of Maturity @ (As at end - March) (Contd.) |
(Amount in Rs.lakh) |
Year/Period of |
Other Scheduled
Commercial Banks |
Foreign Banks |
Maturity
(during April-March) |
2005 |
2006 |
2005 |
2006 |
|
Central |
State |
Central |
State |
Central |
State |
Central |
State |
1 |
10 |
11 |
12 |
13 |
14 |
15 |
16 |
17 |
2005-06 |
16941,94 |
135,89 |
— |
— |
18418,15 |
— |
— |
— |
|
(18.4) |
(3.4) |
|
|
(56.1) |
|
|
|
2006-07 |
7946,08 |
99,71 |
26652,60 |
98,78 |
5775,57 |
4,41 |
21853,06 |
4,41 |
|
(8.6) |
(2.5) |
(22.3) |
(2.4) |
(17.6) |
(42.6) |
(53.0) |
(42.6) |
|
|
|
|
|
|
|
|
|
2007-08 |
4543,87 |
291,03 |
8063,94 |
289,54 |
1814,97 |
— |
4235,37 |
— |
|
(4.9) |
(7.3) |
(6.8) |
(7.1) |
(5.5) |
|
(10.3) |
|
|
|
|
|
|
|
|
|
|
2008-09 |
2223,75 |
383,55 |
6478,47 |
341,58 |
3467,72 |
1,93 |
5250,47 |
1,93 |
|
(2.4) |
(9.6) |
(5.4) |
(8.4) |
(10.6) |
(18.7) |
(12.7) |
(18.7) |
|
|
|
|
|
|
|
|
|
2009-10 |
7527,42 |
345,00 |
8768,58 |
337,45 |
856,89 |
— |
1864,33 |
— |
|
(8.2) |
(8.6) |
(7.3) |
(8.3) |
(2.6) |
|
(4.5) |
|
|
|
|
|
|
|
|
|
|
2010-15 |
29207,47 |
2179,57 |
39993,14 |
2061,97 |
2009,26 |
4,00 |
6716,70 |
4,00 |
|
(31.7) |
(54.6) |
(33.5) |
(50.6) |
(6.1) |
(38.7) |
(16.3) |
(38.7) |
|
|
|
|
|
|
|
|
|
2015-20 |
16814,62 |
559,03 |
20381,34 |
944,31 |
398,26 |
— |
953,36 |
— |
|
(18.2) |
(14.0) |
(17.1) |
(23.2) |
(1.2) |
|
(2.3) |
|
|
|
|
|
|
|
|
|
|
2020-25 |
6947,28 |
— |
2770,50 |
— |
100,00 |
— |
47,10 |
— |
|
(7.5) |
|
(2.3) |
|
(0.3) |
|
(0.1) |
|
|
|
|
|
|
|
|
|
|
2025 and above |
— |
— |
6263,19 |
— |
— |
— |
298,88 |
— |
|
|
|
(5.2) |
|
|
|
(0.7) |
|
|
|
|
|
|
|
|
|
|
Total |
92152,43 |
3993,78 |
119371,76 |
4073,63 |
32840,82 |
10,34 |
41219,27 |
10,34 |
|
(100.0) |
(100.0) |
(100.0) |
(100.0) |
(100.0) |
(100.0) |
(100.0) |
(100.0) |
Statement 6 : Classification of Investments in Government Securities According to |
Period of Maturity @ (As at end - March) (Concld.) |
(Amount in Rs.lakh) |
Year/Period of |
|
All Scheduled
Commercial Banks |
|
Maturity (during |
2005 |
|
2006 |
|
April-March) |
Central |
State |
Central |
State |
1 |
18 |
19 |
20 |
21 |
|
|
|
|
|
2005-06 |
91543,56 |
2891,05 |
— |
— |
|
(17.0) |
(2.5) |
|
|
|
|
|
|
|
2006-07 |
39965,17 |
3527,09 |
90946,97 |
3537,63 |
|
(7.4) |
(3.1) |
(16.6) |
(3.1) |
|
|
|
|
|
2007-08 |
24601,94 |
6613,05 |
28811,87 |
6546,11 |
|
(4.6) |
(5.7) |
(5.3) |
(5.8) |
|
|
|
|
|
2008-09 |
29119,69 |
9536,43 |
30639,86 |
7826,86 |
|
(5.4) |
(8.3) |
(5.6) |
(6.9) |
|
|
|
|
|
2009-10 |
43571,41 |
7100,89 |
44324,90 |
8295,63 |
|
(8.1) |
(6.2) |
(8.1) |
(7.3) |
|
|
|
|
|
2010-15 |
172411,93 |
73573,51 |
199767,10 |
70618,74 |
|
(32.0) |
(63.9) |
(36.5) |
(62.2) |
|
|
|
|
|
2015-20 |
98264,49 |
11970,36 |
113506,36 |
16792,90 |
|
(18.3) |
(10.4) |
(20.7) |
(14.8) |
|
|
|
|
|
2020-25 |
38613,17 |
3,74 |
17740,75 |
— |
|
(7.2) |
(0.0) |
(3.2) |
|
|
|
|
|
|
2025 and above |
— |
— |
22158,86 |
3,77 |
|
|
|
(4.0) |
— |
|
|
|
|
|
Total |
538091,36 |
115216,12 |
547896,67 |
113621,64 |
|
(100.0) |
(100.0) |
(100.0) |
(100.0) |
Statement 7 : Distribution of Investments of Scheduled Commercial Banks in
Central Government@ and State Government Securities by Interest Rate |
(Amount in Rs.lakh) |
Bank Group |
Year |
Less than 6% |
6% to 8% |
8% to 10 % |
10% to 11% |
|
(end - |
Central |
State |
Central |
State |
Central |
State |
Central |
State |
|
March ) |
Govt. |
Govt. |
Govt. |
Govt. |
Govt. |
Govt. |
Govt. |
Govt. |
1 |
2 |
3 |
4 |
5 |
6 |
7 |
8 |
9 |
10 |
State Bank of India |
2005 |
33812,74 |
7024,24 |
42727,70 |
21013,32 |
20286,05 |
2005,05 |
3794,19 |
1532,28 |
and Associates |
|
(20.1) |
(17.2) |
(25.4) |
(51.4) |
(12.1) |
(4.9) |
(2.3) |
(3.7) |
|
2006 |
19235,11 |
7024,23 |
47981,11 |
19583,84 |
21482,68 |
1504,43 |
2749,42 |
1410,71 |
|
|
(13.3) |
(18.6) |
(33.2) |
(51.9) |
(14.9) |
(4.0) |
(1.9) |
(3.7) |
|
|
|
|
|
|
|
|
|
|
Nationalised Banks |
2005 |
20702,18 |
11848,19 |
78157,09 |
25177,87 |
25321,85 |
4323,73 |
29698,18 |
5076,26 |
|
|
(9.7) |
(16.9) |
(36.6) |
(35.8) |
(11.9) |
(6.1) |
(13.9) |
(7.2) |
|
2006 |
23075,49 |
11817,10 |
92100,18 |
29690,30 |
27711,73 |
4045,14 |
27645,49 |
4709,63 |
|
|
(10.6) |
(16.5) |
(42.5) |
(41.4) |
(12.8) |
(5.6) |
(12.7) |
(6.6) |
|
|
|
|
|
|
|
|
|
|
Other Scheduled |
2005 |
26467,08 |
680,67 |
25380,16 |
1394,83 |
5753,03 |
236,92 |
2987,81 |
283,32 |
Commercial Banks |
|
(33.1) |
(17.0) |
(31.8) |
(34.9) |
(7.2) |
(5.9) |
(3.7) |
(7.1) |
|
2006 |
25998,99 |
683,93 |
36369,40 |
1796,67 |
7627,28 |
180,69 |
3041,60 |
213,12 |
|
|
(25.7) |
(16.8) |
(36.0) |
(44.1) |
(7.6) |
(4.4) |
(3.0) |
(5.2) |
|
|
|
|
|
|
|
|
|
|
Foreign Banks |
2005 |
1291,06 |
— |
4954,43 |
— |
1314,80 |
— |
801,50 |
— |
|
|
(5.4) |
|
(20.8) |
|
(5.5) |
|
(3.4) |
|
|
2006 |
1924,56 |
— |
3803,01 |
— |
2609,81 |
— |
92,60 |
— |
|
|
(6.9) |
|
(13.6) |
|
(9.3) |
|
(0.3) |
|
|
|
|
|
|
|
|
|
|
|
All Scheduled |
2005 |
82273,06 |
19553,10 |
151219,38 |
47586,02 |
52675,73 |
6565,70 |
37281,68 |
6891,86 |
Commercial Banks |
|
(17.0) |
(17.0) |
(31.2) |
(41.3) |
(10.9) |
(5.7) |
(7.7) |
(6.0) |
|
2006 |
70234,15 |
19525,26 |
180253,70 |
51070,81 |
59431,50 |
5730,26 |
33529,11 |
6333,46 |
|
|
(14.3) |
(17.2) |
(36.8) |
(44.9) |
(12.1) |
(5.0) |
(6.8) |
(5.6) |
— : Nil or Negligible.
@ : Excludes Govt.of India Treasury Bills, Saving Deposits Certificates and other Postal Obligations.
Note : Figures in brackets indicate percentages to ‘Total’. |
Statement 7 : Distribution of Investments of Scheduled Commercial Banks in Central Government@ |
and State Government Securities by Interest Rate (Concld.) |
(Amount in Rs.lakh) |
Bank Group |
Year |
11% to 12 % |
12% to 13% |
13% and above |
Total |
|
(end - |
Central |
State |
Central |
State |
Central |
State |
Central |
State |
|
March ) |
Govt. |
Govt. |
Govt. |
Govt. |
Govt. |
Govt. |
Govt. |
Govt. |
1 |
2 |
3 |
4 |
5 |
6 |
7 |
8 |
9 |
10 |
|
|
|
|
|
|
|
|
|
|
State Bank of India |
2005 |
46557,41 |
2532,01 |
12444,38 |
2772,36 |
8528,82 |
4013,46 |
168151,29 |
4089,27 |
and Associates |
|
(27.7) |
(6.2) |
(7.4) |
(6.8) |
(5.1) |
(9.8) |
(100.0) |
(100.0) |
|
2006 |
37345,92 |
2414,70 |
11295,53 |
2725,06 |
4531,70 |
3077,98 |
144621,47 |
37740,95 |
|
|
(25.8) |
(6.4) |
(7.8) |
(7.2) |
(3.1) |
(8.2) |
(100.0) |
(100.0) |
|
|
|
|
|
|
|
|
|
|
Nationalised Banks |
2005 |
35393,64 |
6836,75 |
20002,12 |
9553,67 |
4153,55 |
7499,07 |
213428,61 |
70315,54 |
|
|
(16.6) |
(9.7) |
(9.4) |
(13.6) |
(1.9) |
(10.7) |
(100.0) |
(100.0) |
|
2006 |
28081,52 |
6590,17 |
16633,09 |
9300,09 |
1622,61 |
5640,52 |
216870,11 |
71792,95 |
|
|
(12.9) |
(9.2) |
(7.7) |
(13.0) |
(0.7) |
(7.9) |
(100.0) |
(100.0) |
|
|
|
|
|
|
|
|
|
|
Other Scheduled |
2005 |
12174,73 |
308,49 |
3326,44 |
672,66 |
3807,40 |
416,89 |
79896,65 |
3993,78 |
Commercial Banks |
|
(15.2) |
(7.7) |
(4.2) |
(16.8) |
(4.8) |
(10.4) |
(100.0) |
(100.0) |
|
2006 |
18130,14 |
278,37 |
6535,33 |
642,28 |
3291,43 |
278,57 |
100994,17 |
4073,63 |
|
|
(18.0) |
(6.8) |
(6.5) |
(15.8) |
(3.3) |
(6.8) |
(100.0) |
(100.0) |
|
|
|
|
|
|
|
|
|
|
Foreign Banks |
2005 |
11881,40 |
5,93 |
2128,27 |
— |
1476,75 |
4,40 |
23848,21 |
10,34 |
|
|
(49.8) |
(57.4) |
(8.9) |
|
(6.2) |
(42.6) |
(100.0) |
(100.0) |
|
2006 |
13961,37 |
5,93 |
4099,24 |
— |
1432,64 |
4,41 |
27923,23 |
10,34 |
|
|
(50.0) |
(57.4) |
(14.7) |
|
(5.1) |
(42.6) |
(100.0) |
(100.0) |
|
|
|
|
|
|
|
|
|
|
All Scheduled |
2005 |
106007,18 |
9683,18 |
37901,21 |
12998,69 |
17966,52 |
11933,83 |
485324,76 |
115212,38 |
Commercial Banks |
|
(21.8) |
(8.4) |
(7.8) |
(11.3) |
(3.7) |
(10.4) |
(100.0) |
(100.0) |
|
2006 |
97518,95 |
9289,17 |
38563,19 |
12667,43 |
10878,38 |
9001,48 |
490408,98 |
113617,87 |
|
|
(19.9) |
(8.2) |
(7.9) |
(11.1) |
(2.2) |
(7.9) |
(100.0) |
(100.0) |
Statement 8 : State-Wise Classification of
Scheduled Commercial Banks’ Investments in State |
Government Securities and State Level Bodies (As at end-March) |
(Amount in Rs. lakh) |
State / Union Territory |
State
Government |
Regional |
Co-operative |
State
Electricity |
|
Securities |
Rural Banks |
Institutions |
Boards |
|
2005 |
2006 |
2005 |
2006 |
2005 |
2006 |
2005 |
2006 |
1 |
2 |
3 |
4 |
5 |
6 |
7 |
8 |
9 |
Andhra Pradesh |
10045,32 |
10062,04 |
60,98 |
61,89 |
29,36 |
15,47 |
193,79 |
155,99 |
Arunachal Pradesh |
146,46 |
147,57 |
1,09 |
1,09 |
— |
— |
— |
— |
Assam |
2438,54 |
2291,47 |
6,31 |
6,31 |
1,08 |
8 |
182,57 |
179,97 |
Bihar |
5833,53 |
5214,93 |
89,28 |
89,28 |
— |
— |
122,53 |
122,53 |
Chhattisgarh |
1069,88 |
1028,86 |
9,42 |
15,45 |
— |
50 |
21,29 |
21,29 |
Goa |
609,15 |
585,38 |
— |
— |
— |
— |
— |
— |
Gujarat |
6685,57 |
6616,31 |
28,99 |
28,99 |
26,28 |
16,19 |
674,84 |
459,96 |
Haryana |
2950,37 |
2929,16 |
16,21 |
16,21 |
15,28 |
6,21 |
139,38 |
108,56 |
Himachal Pradesh |
2117,68 |
2141,93 |
5,40 |
5,40 |
88 |
88 |
133,09 |
105,43 |
Jammu & Kashmir |
1403,46 |
1391,94 |
15,42 |
15,42 |
58 |
63 |
56,16 |
46,16 |
Jharkhand |
1375,41 |
1416,39 |
— |
5,69 |
— |
— |
— |
— |
Karnataka |
6086,39 |
5992,80 |
41,57 |
45,89 |
44,57 |
67 |
7,33 |
16,07 |
Kerala |
5625,35 |
5793,90 |
70 |
2,94 |
85 |
— |
269,85 |
169,70 |
Madhya Pradesh |
5506,41 |
5378,16 |
105,28 |
95,33 |
13,85 |
5,22 |
581,28 |
586,62 |
Maharashtra |
8863,77 |
8783,41 |
41,36 |
45,28 |
23,02 |
12,44 |
436,26 |
402,17 |
Manipur |
336,23 |
333,52 |
35 |
35 |
— |
— |
— |
— |
Meghalaya |
439,16 |
425,74 |
91 |
91 |
— |
— |
43,59 |
41,59 |
Mizoram |
269,89 |
267,56 |
3,16 |
3,16 |
— |
— |
— |
— |
Nagaland |
636,05 |
590,50 |
1,09 |
1,09 |
— |
— |
— |
— |
Orissa |
4701,18 |
4474,45 |
44,79 |
44,79 |
— |
— |
23,70 |
23,70 |
Punjab |
4427,89 |
4578,28 |
8,88 |
8,88 |
— |
— |
253,51 |
188,15 |
Rajasthan |
8016,31 |
7601,01 |
64,11 |
64,12 |
3,32 |
2,57 |
478,95 |
308,09 |
Sikkim |
156,50 |
160,98 |
— |
— |
— |
— |
3,00 |
1,20 |
Tamil Nadu |
7068,70 |
7356,49 |
1,05 |
2,65 |
10,06 |
4,44 |
519,07 |
394,26 |
Tripura |
475,61 |
458,27 |
35 |
35 |
— |
— |
— |
— |
Uttar Pradesh |
15323,56 |
14976,43 |
124,69 |
138,91 |
— |
— |
232,93 |
257,36 |
Uttaranchal |
1943,61 |
1982,26 |
5,72 |
5,72 |
— |
— |
— |
— |
West Bengal |
10664,14 |
10641,90 |
17,01 |
17,01 |
72 |
8 |
660,76 |
540,58 |
Andaman & Nicobar Islands |
— |
— |
— |
— |
— |
— |
— |
— |
Chandigarh |
— |
— |
— |
— |
— |
— |
— |
— |
Delhi |
— |
— |
— |
— |
17,63 |
— |
— |
— |
Daman & Diu |
— |
— |
— |
— |
— |
— |
— |
— |
Lakshadweep |
— |
— |
— |
— |
— |
— |
— |
— |
Pondicherry |
— |
— |
— |
— |
15 |
— |
— |
— |
Dadra & Nagar Haveli |
— |
— |
— |
— |
— |
— |
— |
— |
|
|
|
|
|
|
|
|
|
All India |
115216,12 |
113621,64 |
694,12 |
723,11 |
187,63 |
65,38 |
5033,88 |
4129,38 |
|
(89.1) |
(91.7) |
(0.5) |
(0.6) |
(0.1) |
(0.1) |
(3.9) |
(3.3) |
— : Nil or Negligible.
Notes : 1. Figures in brackets indicate percentages to total.
2. Figures in this statement are inclusive of non-guaranteed bonds and unsecured debentures.
3. Data on State Government Securities are exclusive of loans matured but still held by the banks. |
Statement 8 : State-Wise Classification of Scheduled
Commercial Banks’ Investments in State |
Government Securities and State Level Bodies (As at end-March) (Contd.) |
(Amount in Rs. lakh) |
State / Union Territory |
Municipal Corporation |
State
Financial |
Housing |
State
Industrial |
|
Municipality and
Port Trusts |
Corporations |
Boards |
Development Corporations |
|
2005 |
2006 |
2005 |
2006 |
2005 |
2006 |
2005 |
2006 |
1 |
10 |
11 |
12 |
13 |
14 |
15 |
16 |
17 |
Andhra Pradesh |
12,00 |
3,00 |
272,86 |
139,44 |
7,53 |
7,33 |
6,53 |
13,14 |
Arunachal Pradesh |
— |
— |
— |
— |
— |
— |
— |
— |
Assam |
— |
— |
31,94 |
4,09 |
— |
— |
— |
— |
Bihar |
— |
— |
86,29 |
86,29 |
— |
— |
— |
— |
Chhattisgarh |
— |
— |
1,58 |
5,68 |
49 |
74 |
— |
— |
Goa |
— |
— |
5 |
— |
— |
— |
11,73 |
11,68 |
Gujarat |
211,48 |
166,12 |
183,16 |
50,80 |
2,05 |
1,33 |
112,57 |
19,00 |
Haryana |
— |
— |
155,19 |
68,65 |
1,10 |
1,10 |
— |
6,07 |
Himachal Pradesh |
— |
— |
15,48 |
3,97 |
— |
— |
19,00 |
3,50 |
Jammu & Kashmir |
— |
— |
45,40 |
32,91 |
— |
— |
— |
— |
Jharkhand |
— |
— |
— |
— |
— |
— |
— |
— |
Karnataka |
21,00 |
— |
290,57 |
136,49 |
1,10 |
1,50 |
29,96 |
81,48 |
Kerala |
1,58 |
1,49 |
141,98 |
121,67 |
11,69 |
10,84 |
35,95 |
27,21 |
Madhya Pradesh |
45 |
— |
208,69 |
135,45 |
13,79 |
16,46 |
11,02 |
14,95 |
Maharashtra |
137,34 |
125,66 |
153,55 |
128,08 |
11,85 |
55 |
141,35 |
70,95 |
Manipur |
— |
5,14 |
5 |
— |
— |
— |
4,21 |
4,21 |
Meghalaya |
— |
— |
— |
— |
— |
— |
— |
— |
Mizoram |
— |
— |
— |
— |
— |
— |
4,28 |
4,28 |
Nagaland |
— |
— |
— |
— |
— |
— |
4,73 |
4,73 |
Orissa |
— |
— |
145,13 |
98,59 |
— |
— |
1,10 |
3,96 |
Punjab |
1,00 |
1,00 |
145,23 |
61,22 |
— |
— |
37,70 |
10,00 |
Rajasthan |
— |
— |
234,09 |
151,17 |
22,13 |
21,93 |
69,43 |
46,98 |
Sikkim |
— |
— |
— |
— |
— |
— |
13,37 |
11,37 |
Tamil Nadu |
16,79 |
13,43 |
64,86 |
17,50 |
22,96 |
20,11 |
200,06 |
166,66 |
Tripura |
— |
— |
— |
— |
— |
— |
1,64 |
1,64 |
Uttar Pradesh |
— |
— |
516,27 |
342,53 |
— |
— |
42,80 |
26,45 |
Uttaranchal |
— |
— |
— |
— |
— |
— |
— |
— |
West Bengal |
35,78 |
25,13 |
171,83 |
68,74 |
5,55 |
5,55 |
102,37 |
61,57 |
Andaman & Nicobar Islands |
— |
— |
— |
— |
— |
— |
— |
— |
Chandigarh |
— |
— |
— |
— |
— |
— |
— |
— |
Delhi |
— |
— |
6,84 |
2,68 |
3,62 |
1,35 |
— |
— |
Daman & Diu |
— |
— |
— |
— |
— |
— |
— |
— |
Lakshadweep |
— |
— |
— |
— |
— |
— |
— |
— |
Pondicherry |
— |
— |
— |
— |
— |
— |
8,54 |
8,58 |
Dadra & Nagar Haveli |
— |
— |
— |
— |
— |
— |
— |
— |
All India |
437,42 |
340,97 |
2871,04 |
1655,95 |
103,86 |
88,79 |
858,34 |
598,41 |
|
(0.3) |
(0.3) |
(2.2) |
(1.3) |
(0.1) |
(0.1) |
(0.7) |
(0.5) |
Statement 8 : State-Wise Classification of Scheduled Commercial Banks’
Investments in State |
Government Securities and State Level Bodies (As at end-March) (Concld.) |
(Amount in Rs. lakh) |
State / Union Territory |
Road Transport |
Other Government |
Total |
|
Corporations |
& Quasi
GovernmentBodies |
|
|
|
|
|
|
2005 |
2006 |
2005 |
2006 |
2005 |
2006 |
1 |
18 |
19 |
20 |
21 |
22 |
23 |
|
|
|
|
|
|
|
Andhra Pradesh |
13,50 |
30,80 |
218,72 |
238,12 |
10860,59 |
10727,22 |
Arunachal Pradesh |
— |
— |
— |
— |
147,55 |
148,66 |
Assam |
— |
— |
10 |
10 |
2660,54 |
2482,02 |
Bihar |
— |
— |
10 |
10 |
6131,73 |
5513,13 |
Chhattisgarh |
— |
— |
— |
— |
1102,66 |
1072,52 |
Goa |
— |
— |
18,75 |
3,75 |
639,68 |
600,81 |
Gujarat |
96,54 |
62,89 |
502,86 |
303,28 |
8524,34 |
7724,87 |
Haryana |
— |
— |
4,63 |
10,83 |
3282,16 |
3146,79 |
Himachal Pradesh |
82,50 |
45,64 |
114,57 |
86,99 |
2488,60 |
2393,74 |
Jammu & Kashmir |
— |
— |
10,15 |
20,10 |
1531,17 |
1507,16 |
Jharkhand |
— |
— |
68,15 |
— |
1443,56 |
1422,08 |
Karnataka |
70 |
75 |
437,21 |
296,57 |
6960,40 |
6572,22 |
Kerala |
14,45 |
14,45 |
83,68 |
87,52 |
6186,08 |
6229,72 |
Madhya Pradesh |
17,00 |
— |
55,35 |
72,53 |
6513,12 |
6304,72 |
Maharashtra |
93,00 |
67,50 |
1073,44 |
686,89 |
10974,94 |
10322,93 |
Manipur |
— |
— |
— |
1,00 |
340,84 |
344,22 |
Meghalaya |
— |
— |
— |
2,00 |
483,66 |
470,24 |
Mizoram |
— |
— |
— |
— |
277,33 |
275,00 |
Nagaland |
— |
— |
— |
— |
641,87 |
596,32 |
Orissa |
— |
— |
3,35 |
7,10 |
4919,25 |
4652,59 |
Punjab |
3,93 |
— |
69,73 |
9,55 |
4947,87 |
4857,08 |
Rajasthan |
7,09 |
— |
68,59 |
45,93 |
8964,02 |
8241,80 |
Sikkim |
— |
— |
15,00 |
8,00 |
187,87 |
181,55 |
Tamil Nadu |
— |
— |
49,31 |
83,84 |
7952,86 |
8059,38 |
Tripura |
— |
— |
4 |
4 |
477,64 |
460,30 |
Uttar Pradesh |
— |
— |
2,42 |
13,84 |
16242,67 |
15755,52 |
Uttaranchal |
— |
— |
— |
— |
1949,33 |
1987,98 |
West Bengal |
— |
— |
668,55 |
460,55 |
12326,71 |
11821,11 |
Andaman & Nicobar Islands |
— |
— |
— |
— |
— |
— |
Chandigarh |
— |
— |
1 |
1 |
1 |
1 |
Delhi |
— |
— |
70,45 |
45,33 |
98,54 |
49,36 |
Daman & Diu |
— |
— |
— |
— |
— |
— |
Lakshadweep |
— |
— |
— |
— |
— |
— |
Pondicherry |
— |
— |
— |
— |
8,69 |
8,58 |
Dadra & Nagar Haveli |
— |
— |
— |
— |
— |
— |
|
|
|
|
|
|
|
All India |
328,71 |
222,03 |
3535,16 |
2483,97 |
129266,28 |
123929,63 |
|
(0.3) |
(0.2) |
(2.7) |
(2.0) |
(100.0) |
(100.0) |
Statement 9: Scheduled Commercial Banks’ Investments in Interest-bearing State Government |
Securities Outstanding as on End-march |
(Amount in Rs. lakh) |
State |
2005 |
2006 |
Proportion of Banks’ |
|
Out
standing |
Banks’ |
Out
standing |
Banks’ |
Investments to
Total
Securities
Outstanding |
|
Securities |
Investments |
Securities |
Investments |
2005 |
2006 |
1 |
2 |
3 |
4 |
5 |
6 |
7 |
Andhra Pradesh |
19964,07 |
10045,32 |
21920,31 |
10062,04 |
50.3 |
45.9 |
|
(9.5) |
(8.7) |
(9.3) |
(8.9) |
|
|
|
|
|
|
|
|
|
Arunachal Pradesh |
279,00 |
146,46 |
326,00 |
147,57 |
52.5 |
45.3 |
|
(0.1) |
(0.1) |
(0.1) |
(0.1) |
|
|
|
|
|
|
|
|
|
Assam |
5129,39 |
2438,54 |
6009,61 |
2291,47 |
47.5 |
38.1 |
|
(2.4) |
(2.1) |
(2.6) |
(2.0) |
|
|
|
|
|
|
|
|
|
Bihar |
10487,04 |
5833,53 |
12418,87 |
5214,93 |
55.6 |
42.0 |
|
(5.0) |
(5.1) |
(5.3) |
(4.6) |
|
|
|
|
|
|
|
|
|
Chhatisgarh |
1837,38 |
1069,88 |
1837,38 |
1028,86 |
58.2 |
56.0 |
|
(0.9) |
(0.9) |
(0.8) |
(0.9) |
|
|
|
|
|
|
|
|
|
Goa |
961,21 |
609,15 |
1044,43 |
585,38 |
63.4 |
56.0 |
|
(0.5) |
(0.5) |
(0.4) |
(0.5) |
|
|
|
|
|
|
|
|
|
Gujarat |
12658,81 |
6685,57 |
13259,23 |
6616,31 |
52.8 |
49.9 |
|
(6.0) |
(5.8) |
(5.6) |
(5.8) |
|
|
|
|
|
|
|
|
|
Haryana |
4754,85 |
2950,37 |
5275,61 |
2929,16 |
62.0 |
55.5 |
|
(2.3) |
(2.6) |
(2.2) |
(2.6) |
|
|
|
|
|
|
|
|
|
Himachal Pradesh |
3690,48 |
2117,68 |
4159,30 |
2141,93 |
57.4 |
51.5 |
|
(1.8) |
(1.8) |
(1.8) |
(1.9) |
|
|
|
|
|
|
|
|
|
Jammu & Kashmir |
2692,92 |
1403,46 |
2991,40 |
1391,94 |
52.1 |
46.5 |
|
(1.3) |
(1.2) |
(1.3) |
(1.2) |
|
|
|
|
|
|
|
|
|
Jharkhand |
2082,43 |
1375,41 |
2446,54 |
1416,39 |
66.0 |
57.9 |
|
(1.0) |
(1.2) |
(1.0) |
(1.2) |
|
|
|
|
|
|
|
|
|
Karnataka |
11762,43 |
6086,39 |
12176,93 |
5992,80 |
51.7 |
49.2 |
|
(5.6) |
(5.3) |
(5.2) |
(5.3) |
|
|
|
|
|
|
|
|
|
Kerala |
9598,36 |
5625,35 |
11405,10 |
5793,90 |
58.6 |
50.8 |
|
(4.6) |
(4.9) |
(4.8) |
(5.1) |
|
|
|
|
|
|
|
|
|
Madhya Pradesh |
9301,20 |
5506,41 |
11508,89 |
5378,16 |
59.2 |
46.7 |
|
(4.4) |
(4.8) |
(4.9) |
(4.7) |
|
|
Note : Figures in brackets indicate percentages to total. |
Statement 9: Scheduled Commercial Banks’ Investments in Interest-bearing State Government |
Securities Outstanding as on End-march (Concld.) |
(Amount in Rs. lakh) |
State |
2005 |
2006 |
Proportion of Banks’
Investments to Total |
|
Outstanding |
Banks’ |
Outstanding |
Banks’ |
Securities Outstanding |
|
Securities |
Investments |
Securities |
Investments |
2005 |
2006 |
1 |
2 |
3 |
4 |
5 |
6 |
7 |
Maharashtra |
17546,68 |
8863,77 |
19123,22 |
8783,41 |
50.5 |
45.9 |
|
(8.3) |
(7.7) |
(8.1) |
(7.7) |
|
|
|
|
|
|
|
|
|
Manipur |
597,69 |
336,23 |
802,60 |
333,52 |
56.3 |
41.6 |
|
(0.3) |
(0.3) |
(0.3) |
(0.3) |
|
|
|
|
|
|
|
|
|
Meghalaya |
824,98 |
439,16 |
983,23 |
425,74 |
53.2 |
43.3 |
|
(0.4) |
(0.4) |
(0.4) |
(0.4) |
|
|
|
|
|
|
|
|
|
Mizoram |
501,17 |
269,89 |
615,84 |
267,56 |
53.9 |
43.4 |
|
(0.2) |
(0.2) |
(0.3) |
(0.2) |
|
|
|
|
|
|
|
|
|
Nagaland |
1236,51 |
636,05 |
1490,33 |
590,50 |
51.4 |
39.6 |
|
(0.6) |
(0.6) |
(0.6) |
(0.5) |
|
|
|
|
|
|
|
|
|
Orissa |
9080,89 |
4701,18 |
10087,01 |
4474,45 |
51.8 |
44.4 |
|
(4.3) |
(4.1) |
(4.3) |
(3.9) |
|
|
|
|
|
|
|
|
|
Punjab |
7718,66 |
4427,89 |
8917,96 |
4578,28 |
57.4 |
51.3 |
|
(3.7) |
(3.8) |
(3.8) |
(4.0) |
|
|
|
|
|
|
|
|
|
Rajasthan |
14358,68 |
8016,31 |
15399,31 |
7601,01 |
55.8 |
49.4 |
|
(6.8) |
(7.0) |
(6.5) |
(6.7) |
|
|
|
|
|
|
|
|
|
Sikkim |
331,69 |
156,50 |
435,68 |
160,98 |
47.2 |
36.9 |
|
(0.2) |
(0.1) |
(0.2) |
(0.1) |
|
|
|
|
|
|
|
|
|
Tamil Nadu |
13786,36 |
7068,70 |
15405,24 |
7356,49 |
51.3 |
47.8 |
|
(6.6) |
(6.1) |
(6.6) |
(6.5) |
|
|
|
|
|
|
|
|
|
Tripura |
1024,78 |
475,61 |
1161,98 |
458,27 |
46.4 |
39.4 |
|
(0.5) |
(0.4) |
(0.5) |
(0.4) |
|
|
|
|
|
|
|
|
|
Uttar Pradesh |
26455,18 |
15323,56 |
30107,56 |
14976,43 |
57.9 |
49.7 |
|
(12.6) |
(13.3) |
(12.8) |
(13.2) |
|
|
|
|
|
|
|
|
|
Uttaranchal |
2852,27 |
1943,61 |
3420,52 |
1982,26 |
68.1 |
58.0 |
|
(1.4) |
(1.7) |
(1.5) |
(1.7) |
|
|
|
|
|
|
|
|
|
West Bengal |
18730,38 |
10664,14 |
20442,51 |
10641,90 |
56.9 |
52.1 |
|
(8.9) |
(9.3) |
(8.7) |
(9.4) |
|
|
|
|
|
|
|
|
|
Total |
210245,49 |
115216,12 |
235172,56 |
113621,64 |
54.8 |
48.3 |
|
(100.0) |
(100.0) |
(100.0) |
(100.0) |
|
|
Statement 10: Bank Group-Wise and State-Wise Classification of Scheduled Commercial Banks’ |
Investments in State Government Securities and State-level Bodies (As at End-march) |
(Amount in Rs. lakh) |
State/ |
Bank Group |
All Scheduled |
Union Territory |
State Bank of |
Nationalised |
Other
Scheduled |
Foreign
Banks |
Commercial Banks |
|
India and its |
Banks |
Commercial Banks |
|
|
|
|
|
Associates |
|
|
|
|
|
|
|
|
|
2005 |
2006 |
2005 |
2006 |
2005 |
2006 |
2005 |
2006 |
2005 |
2006 |
1 |
2 |
3 |
4 |
5 |
6 |
7 |
8 |
9 |
10 |
11 |
Andhra Pradesh |
2933,80 |
2806,24 |
7211,73 |
7147,68 |
714,06 |
772,30 |
1,00 |
1,00 |
10860,59 |
10727,22 |
|
(27.0) |
(26.2) |
(66.4) |
(66.6) |
(6.6) |
(7.2) |
— |
— |
(100.0) |
(100.0) |
Arunachal Pradesh |
70,15 |
70,89 |
75,42 |
75,79 |
1,98 |
1,98 |
— |
— |
147,55 |
148,66 |
|
(47.5) |
(47.7) |
(51.1) |
(51.0) |
(1.3) |
(1.3) |
|
|
(100.0) |
(100.0) |
Assam |
1115,34 |
1026,94 |
1526,98 |
1436,87 |
18,22 |
18,21 |
— |
— |
2660,54 |
2482,02 |
|
(41.9) |
(41.4) |
(57.4) |
(57.9) |
(0.7) |
(0.7) |
|
|
(100.0) |
(100.0) |
Bihar |
2502,06 |
2122,89 |
3575,58 |
3330,37 |
54,09 |
59,87 |
— |
— |
6131,73 |
5513,13 |
|
(40.8) |
(38.5) |
(58.3) |
(60.4) |
(0.9) |
(1.1) |
|
|
(100.0) |
(100.0) |
Chhattisgarh |
360,74 |
321,79 |
736,14 |
745,73 |
5,78 |
5,00 |
— |
— |
1102,66 |
1072,52 |
|
(32.7) |
(30.0) |
(66.8) |
(69.5) |
(0.5) |
(0.5) |
|
|
(100.0) |
(100.0) |
Goa |
159,90 |
140,67 |
464,03 |
450,84 |
15,75 |
9,30 |
— |
— |
639,68 |
600,81 |
|
(25.0) |
(23.4) |
(72.5) |
(75.0) |
(2.5) |
(1.5) |
|
|
(100.0) |
(100.0) |
Gujarat |
2601,35 |
2425,10 |
5478,11 |
5024,29 |
443,28 |
275,48 |
1,60 |
— |
8524,34 |
7724,87 |
|
(30.5) |
(31.4) |
(64.3) |
(65.0) |
(5.2) |
(3.6) |
— |
|
(100.0) |
(100.0) |
Haryana |
1019,34 |
948,85 |
2199,85 |
2118,18 |
62,97 |
79,76 |
— |
— |
3282,16 |
3146,79 |
|
(31.1) |
(30.2) |
(67.0) |
(67.3) |
(1.9) |
(2.5) |
|
|
(100.0) |
(100.0) |
Himachal Pradesh |
743,18 |
694,42 |
1690,93 |
1630,10 |
54,49 |
69,22 |
— |
— |
2488,60 |
2393,74 |
|
(29.9) |
(29.0) |
(67.9) |
(68.1) |
(2.2) |
(2.9) |
|
|
(100.0) |
(100.0) |
Jammu & Kashmir |
554,68 |
551,80 |
809,69 |
798,18 |
166,80 |
157,18 |
— |
— |
1531,17 |
1507,16 |
|
(36.2) |
(36.6) |
(52.9) |
(53.0) |
(10.9) |
(10.4) |
|
|
(100.0) |
(100.0) |
Jharkhand |
537,60 |
438,39 |
901,05 |
973,79 |
4,91 |
9,90 |
— |
— |
1443,56 |
1422,08 |
|
(37.2) |
(30.8) |
(62.4) |
(68.5) |
(0.3) |
(0.7) |
|
|
(100.0) |
(100.0) |
Karnataka |
1659,51 |
1571,22 |
4657,62 |
4420,22 |
643,17 |
580,78 |
10 |
— |
6960,40 |
6572,22 |
|
(23.8) |
(23.9) |
(66.9) |
(67.3) |
(9.2) |
(8.8) |
— |
|
(100.0) |
(100.0) |
Kerala |
1724,77 |
1574,31 |
3990,86 |
4200,01 |
470,45 |
455,40 |
— |
— |
6186,08 |
6229,72 |
|
(27.9) |
(25.3) |
(64.5) |
(67.4) |
(7.6) |
(7.3) |
|
|
(100.0) |
(100.0) |
Madhya Pradesh |
1786,42 |
1704,46 |
4595,79 |
4452,55 |
130,91 |
147,71 |
— |
— |
6513,12 |
6304,72 |
|
(27.4) |
(27.0) |
(70.6) |
(70.6) |
(2.0) |
(2.3) |
|
|
(100.0) |
(100.0) |
Maharashtra |
4217,33 |
3930,06 |
6102,90 |
5804,87 |
647,28 |
580,57 |
7,43 |
7,43 |
10974,94 |
10322,93 |
|
(38.4) |
(38.1) |
(55.6) |
(56.2) |
(5.9) |
(5.6) |
(0.1) |
(0.1) |
(100.0) |
(100.0) |
Manipur |
199,16 |
194,92 |
141,67 |
149,29 |
1 |
1 |
— |
— |
340,84 |
344,22 |
|
(58.4) |
(56.6) |
(41.6) |
(43.4) |
— |
— |
|
|
(100.0) |
(100.0) |
Meghalaya |
197,49 |
188,14 |
286,17 |
282,10 |
— |
— |
— |
— |
483,66 |
470,24 |
|
(40.8) |
(40.0) |
(59.2) |
(60.0) |
|
|
|
|
(100.0) |
(100.0) |
Mizoram |
163,05 |
159,52 |
110,96 |
112,16 |
3,32 |
3,32 |
— |
— |
277,33 |
275,00 |
|
(58.8) |
(58.0) |
(40.0) |
(40.8) |
(1.2) |
(1.2) |
|
|
(100.0) |
(100.0) |
— : Nil or Negligible.
Note : Figures in brackets indicate percentae to all Scheduled Commercial banks figures. |
Statement 10: Bank Group-Wise and State-Wise Classification of Scheduled Commercial Banks’ |
Investments in State Government Securities and State-level Bodies (As at End-march) (Concld.) |
(Amount in Rs. lakh) |
State/ |
Bank Group |
All Scheduled |
Union Territory |
State Bank of |
Nationalised |
Other
Scheduled |
Foreign
Banks |
Commercial
Banks |
|
India and its Associates |
Banks |
Commercial Banks |
|
|
|
2005 |
2006 |
2005 |
2006 |
2005 |
2006 |
2005 |
2006 |
2005 |
2006 |
|
|
|
|
|
|
|
|
|
|
|
1 |
2 |
3 |
4 |
5 |
6 |
7 |
8 |
9 |
10 |
11 |
|
|
|
|
|
|
|
|
|
|
|
Nagaland |
370,99 |
332,34 |
265,86 |
258,96 |
5,02 |
5,02 |
— |
— |
641,87 |
596,32 |
|
(57.8) |
(55.7) |
(41.4) |
(43.4) |
(0.8) |
(0.8) |
|
|
(100.0) |
(100.0) |
|
|
|
|
|
|
|
|
|
|
|
Orissa |
1654,39 |
1486,19 |
3115,08 |
3018,80 |
149,48 |
147,30 |
30 |
30 |
4919,25 |
4652,59 |
|
(33.6) |
(31.9) |
(63.3) |
(64.9) |
(3.0) |
(3.2) |
— |
— |
(100.0) |
(100.0) |
|
|
|
|
|
|
|
|
|
|
|
Punjab |
1508,13 |
1393,27 |
3287,18 |
3340,01 |
152,56 |
123,80 |
— |
— |
4947,87 |
4857,08 |
|
(30.5) |
(28.7) |
(66.4) |
(68.8) |
(3.1) |
(2.5) |
|
|
(100.0) |
(100.0) |
|
|
|
|
|
|
|
|
|
|
|
Rajasthan |
3116,82 |
2643,62 |
5511,10 |
5250,67 |
336,10 |
347,51 |
— |
— |
8964,02 |
8241,80 |
|
(34.8) |
(32.1) |
(61.5) |
(63.7) |
(3.7) |
(4.2) |
|
|
(100.0) |
(100.0) |
|
|
|
|
|
|
|
|
|
|
|
Sikkim |
82,89 |
83,25 |
102,81 |
96,13 |
2,17 |
2,17 |
— |
— |
187,87 |
181,55 |
|
(44.1) |
(45.9) |
(54.7) |
(52.9) |
(1.2) |
(1.2) |
|
|
(100.0) |
(100.0) |
|
|
|
|
|
|
|
|
|
|
|
Tamil Nadu |
1959,69 |
1766,38 |
5183,77 |
5517,41 |
809,00 |
775,59 |
40 |
— |
7952,86 |
8059,38 |
|
(24.6) |
(21.9) |
(65.2) |
(68.5) |
(10.2) |
(9.6) |
— |
|
(100.0) |
(100.0) |
|
|
|
|
|
|
|
|
|
|
|
Tripura |
240,49 |
237,78 |
232,14 |
217,51 |
5,01 |
5,01 |
— |
— |
477,64 |
460,30 |
|
(50.3) |
(51.7) |
(48.6) |
(47.3) |
(1.0) |
(1.1) |
|
|
(100.0) |
(100.0) |
|
|
|
|
|
|
|
|
|
|
|
Uttar Pradesh |
6200,78 |
5531,08 |
9792,62 |
10000,95 |
248,27 |
222,49 |
1,00 |
1,00 |
16242,67 |
15755,52 |
|
(38.2) |
(35.1) |
(60.3) |
(63.5) |
(1.5) |
(1.4) |
— |
— |
(100.0) |
(100.0) |
|
|
|
|
|
|
|
|
|
|
|
Uttaranchal |
1095,17 |
1094,46 |
845,99 |
885,35 |
8,17 |
8,17 |
— |
— |
1949,33 |
1987,98 |
|
(56.2) |
(55.1) |
(43.4) |
(44.5) |
(0.4) |
(0.4) |
|
|
(100.0) |
(100.0) |
|
|
|
|
|
|
|
|
|
|
|
West Bengal |
4761,16 |
4485,40 |
7286,54 |
7025,87 |
278,01 |
308,84 |
1,00 |
1,00 |
12326,71 |
11821,11 |
|
(38.6) |
(37.9) |
(59.1) |
(59.4) |
(2.3) |
(2.6) |
— |
— |
(100.0) |
(100.0) |
|
|
|
|
|
|
|
|
|
|
|
Andaman & Nicobar |
— |
— |
— |
— |
— |
— |
— |
— |
— |
— |
Islands |
|
|
|
|
|
|
|
|
|
|
|
|
|
|
|
|
|
|
|
|
|
Chandigarh |
— |
— |
1 |
1 |
— |
— |
— |
— |
1 |
1 |
|
|
|
(100.0) |
(100.0) |
|
|
|
|
(100.0) |
(100.0) |
|
|
|
|
|
|
|
|
|
|
|
Delhi |
4,60 |
80 |
87,19 |
42,56 |
6,75 |
6,00 |
— |
— |
98,54 |
49,36 |
|
(4.7) |
(1.6) |
(88.5) |
(86.2) |
(6.9) |
(12.2) |
|
|
(100.0) |
(100.0) |
|
|
|
|
|
|
|
|
|
|
|
Daman & Diu |
— |
— |
— |
— |
— |
— |
— |
— |
— |
— |
|
|
|
|
|
|
|
|
|
|
|
Lakshadweep |
— |
— |
— |
— |
— |
— |
— |
— |
— |
— |
|
|
|
|
|
|
|
|
|
|
|
Pondicherry |
4 |
4 |
8,65 |
8,54 |
— |
— |
— |
— |
8,69 |
8,58 |
|
(0.5) |
(0.5) |
(99.5) |
(99.5) |
|
|
|
|
(100.0) |
(100.0) |
|
|
|
|
|
|
|
|
|
|
|
Dadra & Nagar Haveli |
— |
— |
— |
— |
— |
— |
— |
— |
— |
— |
|
|
|
|
|
|
|
|
|
|
|
All India |
43541,02 |
39925,22 |
80274,42 |
78815,79 |
5438,01 |
5177,89 |
12,83 |
10,73 |
129266,28 |
123929,63 |
|
(33.7) |
(32.2) |
(62.1) |
(63.6) |
(4.2) |
(4.2) |
— |
— |
(100.0) |
(100.0) |
Annex |
Annex Table : Select Macroeconomic and Financial Indicators |
Item |
2004-05 |
2005-06 |
I. |
Growth rate (per cent) of Real GDP at Factor |
|
|
|
Cost @ (Base Year: 1999-2000) |
7.5 |
9.0 |
|
Of which (i) Agriculture & allied activities |
0.0 |
6.0 |
|
|
(ii) Industry |
8.4 |
8.0 |
|
|
(iii) Services |
10.0 |
10.3 |
II. |
Growth of Resources/Utilisation of funds of |
|
|
|
Scheduled Commercial Banks (SCBs) (in per cent)@@ |
|
|
|
(i) |
Aggregate Deposits |
13.0 |
24.0 |
|
(ii) |
Bank Credit |
30.9 |
37.0 |
|
(iii) |
Non-food Credit |
31.6 |
38.4 |
|
(iv) |
Investments in Government Securities |
9.8 |
-2.5 |
III. |
Certificates of Deposits issued by SCBs |
|
|
|
(i) |
Outstanding as on Last reporting Friday(Rs. Crore) |
12,078 |
43,568 |
|
(ii) |
Effective Discount Rate as on fortnight ended |
4.21-6.34 |
6.50-8.94 |
|
|
on last reporting Friday (per cent) |
|
|
IV. |
(i) |
Return on investments (SCBs) (per cent) |
7.6 |
7.6 |
|
(ii) |
Return on advances (SCBs) (per cent) |
7.1 |
7.2 |
V. |
Market Borrowings of Central Government (dated Securities) |
|
|
|
(i) |
Gross Borrowings (Rs. Crore) |
88,350 |
131,000 |
|
(ii) |
Net Borrowings (Rs. Crore) |
46,034 |
95,370 |
|
(iii) |
Weighted Average Maturity (in years) |
14.13 |
16.90 |
|
(iv) |
Weighted Average yield (per cent) |
6.11 |
7.34 |
VI |
Outstanding stock of Central Government (dated Securities) |
|
|
|
(i) |
Weighted Average Maturity (in years) |
9.63 |
9.92 |
|
(ii) |
Weighted Average yield (per cent) |
8.79 |
8.75 |
VII. Turnover in Government Securities Market (Face Value) |
|
|
|
Monthly average (in Rs. Crore) @@@ |
|
|
|
(i) |
Govt. of India Dated Securities |
1,47,537 |
1,12,251 |
|
(ii) |
State Govement Securities |
4,411 |
3,345 |
VIII. Market Borrowings of State Governments |
|
|
|
(i) |
Gross Borrowings (Rs. Crore) |
39,101 |
21,729 |
|
(ii) |
Net Borrowings (Rs. Crore) |
33,978 |
15,455 |
|
(iii) |
Weighted Average Maturity (in years) |
10.01 |
10.00 |
|
(iv) |
Weighted Average yield (per cent) |
6.45 |
7.63 |
|
|
|
|
|
@ : Relates to Provisional Estimates for 2004-05 and Quick Estimates for 2005-06.
@@ : Data for 2004-05 are adjusted for conversions in Banking system since October 11, 2004.
@@@ : Based on SGL outright transactions in government securities in secondary market at
Mumbai. It excludes repo transactions.
Source :
Report on Trend and Progress of Banking in India, Annual Report of the
Reserve Bank of India and Reserve Bank of India Bulletin. |
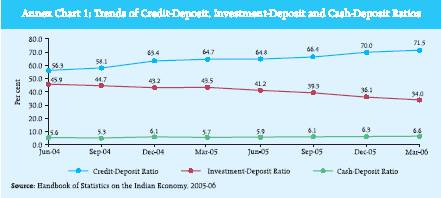
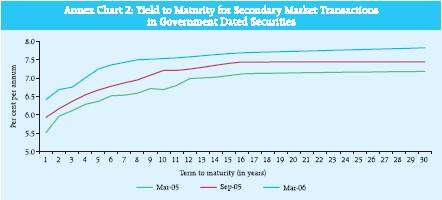 |


