
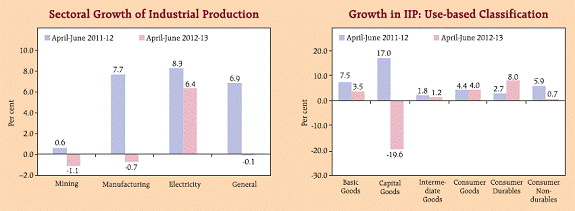
28. Group - Wise Index Numbers of Industrial Production (Base : 2004-05=100) - ఆర్బిఐ - Reserve Bank of India


28. Group - Wise Index Numbers of Industrial Production (Base : 2004-05=100)
(Base: 2004-05=100) |
|||||||||
Sr. No. |
Industry |
Weight |
Annual |
Cumulative |
Monthly |
||||
2009-10 |
2010-11 |
2011-12 P |
April-June |
June |
|||||
2011-12 |
2012-13 P |
2011 |
2012 P |
||||||
1 |
2 |
3 |
4 |
5 |
6 |
7 |
8 |
||
General Index |
100.00 |
152.9 |
165.5 |
170.3 |
167.9 |
167.8 |
171.4 |
168.3 |
|
I. |
Sectoral Classification |
||||||||
1. |
Mining and Quarrying |
14.16 |
124.5 |
131.0 |
128.5 |
127.6 |
126.2 |
123.5 |
124.3 |
2. |
Manufacturing |
75.53 |
161.3 |
175.7 |
181.0 |
178.2 |
177.0 |
184.0 |
178.1 |
3. |
Electricity |
10.32 |
130.8 |
138.0 |
149.3 |
147.9 |
157.3 |
144.3 |
157.0 |
II. |
Use-Based Classification |
||||||||
1. |
Basic Goods |
45.68 |
134.1 |
142.2 |
150.0 |
146.8 |
151.9 |
145.9 |
151.9 |
2. |
Capital Goods |
8.83 |
243.0 |
278.9 |
267.8 |
279.5 |
224.7 |
325.2 |
234.5 |
3. |
Intermediate Goods |
15.69 |
135.3 |
145.3 |
144.4 |
144.1 |
145.8 |
144.1 |
146.4 |
4. |
Consumer Goods |
29.81 |
164.3 |
178.3 |
186.1 |
179.7 |
186.8 |
179.1 |
185.4 |
4(a). |
Consumer Durables |
8.46 |
252.0 |
287.7 |
295.1 |
284.9 |
307.7 |
281.7 |
307.4 |
4(b). |
Consumer Non-Durables |
21.35 |
129.5 |
135.0 |
142.9 |
138.0 |
138.9 |
138.4 |
137.0 |
P: Provisional. |
|||||||||

ఈ పేజీని షేర్ చేయండి:


భారతీయ రిజర్వ్ బ్యాంక్ మొబైల్ అప్లికేషన్ను ఇన్స్టాల్ చేయండి మరియు తాజా వార్తలకు త్వరిత యాక్సెస్ పొందండి!


