 IST,
IST,
II. Aggregate Demand
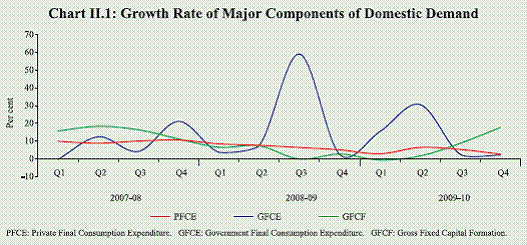
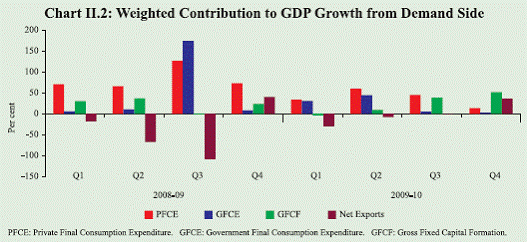
Drivers of aggregate demand changed significantly in the fourth quarter of 2009-10, suggesting increasing self-sustaining nature of the recovery process. The recovery in investment demand exhibited acceleration, which seems to have been sustained in 2010-11 so far, going by the trends in capital goods production. Private consumption demand remained subdued, though lead indicators suggest pick-up in recent months. Contribution of government consumption demand has moderated considerably and reflecting the fiscal consolidation process, the support from government spending is expected to moderate further. The positive contribution of net exports that resulted from sharper decline in imports in relation to exports during 2009-10 will revert to the normal pattern in 2010-11 as domestic demand picks up. The overall growth outlook, thus, would be largely conditioned by the strength of private consumption and investment demand in 2010-11. Domestic Demand II.1 Private consumption and investment demand had turned anaemic in the wake of the global crisis, which necessitated demand stimulating monetary and fiscal measures. Self-sustaining drivers of growth from the demand side, particularly private investment demand, exhibited a turnaround in the second half of 2009-10, which also facilitated the beginning of policy exit. With continuation of the recovery in private investment demand and stronger pick-up in private consumption demand, normalisation of monetary policy and fiscal consolidation would create the macro-economic environment that would be conducive for sustainable high growth. II.2 The evolving trends in aggregate demand provide useful insights into the major drivers of growth momentum and their sustainability over the medium-term. The growth in private consumption demand witnessed deceleration from 6.8 per cent in 2008-09 to 4.3 percent in 2009-10, reflecting the dampening impact of overall economic slowdown on the one hand and weak agriculture production and high food prices on the other. The slowdown in private consumption demand was particularly sharp during the fourth quarter of 2009-10 (Table II.1 and Chart II.1). II.3 The government final consumption expenditure, which had emerged as the dominant driver of growth in the third quarter of 2008-09, witnessed significant moderation starting from the third quarter of 2009-10. The slowdown in government consumption expenditure continued through the fourth quarter of 2009-10, reflecting the high base in the second half of the previous year owing to the crisis induced fiscal stimulus. The sluggish growth in both private and government consumption demand has led to moderation in their respective contributions to growth in aggregate demand during the fourth quarter of 2009-10 (Chart II.2).
II.4 The y-o-y growth in gross fixed capital formation during the fourth quarter of 2009-10 at 17.7 per cent represented a significant acceleration. Consequently, the contribution of investment demand to growth improved substantially to 51.5 per cent during the fourth quarter of 2009-10 as against 38.0 per cent in the preceding quarter. The pick- up in investment demand was reflective of improved overall business and investment environment and intentions to add capacity to meet the expected pick-up in demand. In addition to the fixed investment activity, there were indications of rapid inventory build up during the third and fourth quarters of 2009-10. Demand Management through Fiscal Policy Central Government Finances: 2009-10 and 2010-11 II.5 With a view to supporting the recovery momentum, fiscal policy continued its expansionary stance during 2009-10. Reflecting this, the revenue deficit (RD) and gross fiscal deficit (GFD) expanded over the previous year (RE) (Table II.2). II.6 With gradual exit from the fiscal stimulus measures through the partial rollback of indirect tax cuts and compression in the growth of non-plan expenditure, the Central Government resumed the process of fiscal consolidation during 2010-11. With these measures, alongside the expected higher growth in GDP, RD and GFD are envisaged to be brought down during 2010-11(BE) over the preceding year.
II.7 The correction in deficit indicators has been envisaged in the Union Budget for 2010-11 to come through a combination of factors, viz., higher revenue receipts, greater disinvestment proceeds, and curtailment of growth in revenue expenditure, especially in the non-plan component (Table II.3). Revenue collections from 3G/BWA spectrum auctions have turned out to be Rs.1,06,262 crore, more than three times of the budgeted amount of Rs.35,000 crore in the Union Budget for 2010-11. As a result, the non-tax revenue receipts are expected to go up by 48 per cent from the budgeted level. This additional mobilisation of resources, unless utilised for expanding expenditure, would result in an additional 1.0 percentage point reduction in both RD and GFD, compared to what has been envisaged in the Budget estimates of 2010-11, and thereby create more space for private investment. The decision taken in June 2010 to deregulate petrol prices and revise the prices of other petroleum products upwards would also help in containing the pressure on the fiscal situation, besides contributing to medium-term fiscal sustainability. Some of the tax measures announced in the Union Budget for 2010-11, such as increase in income tax slabs and the indirect tax measures, viz., concessional customs duty, exemption of excise duty and service tax would have positive impact on the private consumption and investment demand. Direct tax collections during April-June 2010 have registered strong growth reflecting, inter-alia, the rebound in economic activity.
State Finances II.8 With a view to encouraging the State governments to undertake additional capital investments and boost domestic aggregate demand, States were allowed additional market borrowing to the extent of 0.5 per cent of their GSDP in 2008-09 and further 0.5 per cent in 2009-10. Consequently, there was significant increase in aggregate spending of the State governments in 2009-10 (RE), resulting in higher deficit. In terms of the budget documents for 2010-11, the State governments have resumed the process of fiscal consolidation.1 Correction in deficit indicators is expected to be achieved mainly through significant moderation in the growth of revenue expenditure from 25.2 per cent in 2009-10 (RE) to 9.6 per cent in 2010-11 (BE), while the deceleration in the growth of capital outlay from 11.4 per cent to 3.8 per cent during the same period is also expected to aid the process. This would be supplemented by 16.6 per cent growth in own tax revenues and 19.9 per cent growth in States’ share in central taxes in 2010-11 (BE). As a result, States’ revenue deficit and gross fiscal deficit are budgeted to be lower in 2010-11 (BE). Combined Fiscal Position II.9 Reflecting the continued expansionary fiscal stance of both the Central and State Governments, the combined RD increased to 6.2 per cent, while GFD rose to 10.1 per cent of GDP during 2009-10. The combined finances are likely to improve considerably during 2010-11, on account of the envisaged path of fiscal consolidation by both the Centre and the States (Table II.4).
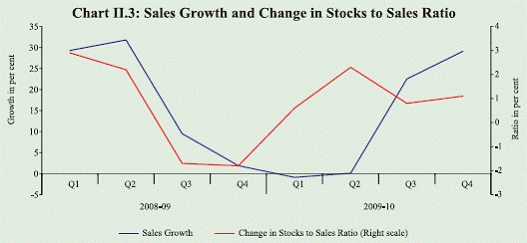
Corporate Performance II.10 The pick-up in overall economic activity was evident from the corporate sales data as well. During the fourth quarter of 2009-10, the year-on-year sales growth of select non-financial non-government listed companies was around 29 per cent, which turned out to be the highest in last six quarters (Table II.5). Net profits also increased by 44 per cent as against a sharp decline during the corresponding period of the preceding year. The increase largely emanated from manufacturing companies. The improved revenue realisation reflects besides a low base, strong recovery in economic activity and rising commodity prices. The profit margins also continued to be supported by rise in other income and the decline in interest outgo. During the fourth quarter of 2009-10, both sales and inventory demand have gone up, suggesting acceleration in industrial activity (Chart II.3). II.11 Sequentially, seasonally adjusted sales recorded improvement in the first three quarters of 2009-10, but decelerated in the fourth quarter. Project finance data from major banks/financial institutions suggested the improved strength in private corporate sector’s investment intentions. External Demand II.12 Net exports (of goods and services, at constant prices) contributed positively by 7.8 per cent to GDP growth in the demand side during 2009-10, as against a negative contribution of around 36.2 per cent in 2008-09. The positive contribution of net exports, contrary to the normal trend in the past, emanated from the relatively larger decline in imports than exports during the year. During the fourth quarter of 2009-10, contribution of net exports increased further as exports increased by 14.2 per cent, while imports declined by 3.7 per cent (see Chart II.2). Merchandise trade data for April-June 2010 suggest higher growth in imports than exports. Thus, the positive contribution of net exports can be expected to reverse in 2010-11. A detailed discussion on the external demand conditions is set out in Chapter III. II.13 To sum up, investment demand has showed a robust turnaround, which is expected to continue as suggested by the production trends in capital goods, non-oil imports and corporate profits. While private consumption demand was subdued in 2009-10, trends in corporate sales, production of consumer durables and nondurables and automobile sales point to significant pick-up in private consumption demand in recent months. The contribution of net exports to aggregate demand, however, will turn negative, reflecting higher import demand. 1 Based on the budget documents of twenty-four State governments. |
|||||||||||||||||||||||||||||||||||||||||||||||||||||||||||||||||||||||||||||||||||||||||||||||||||||||||||||||||||||||||||||||||||||||||||||||||||||||||||||||||||||||||||||||||||||||||||||||||||||||||||||||||||||||||||||||||||||||||||||||||||||||||||||||||||||||||||||||||||||||||||||||||||||||||||||||||||||||||||||||||||||||||||||||||||||||||||||||||||||||||||||||||||||||||||||||||||||||||||||||||||||||||||||||||||||||||||||||||||||||||||||||||||||||||||||||||||||||||||||||||||||||||||||||||||||||||
صفحے پر آخری اپ ڈیٹ:


