
India's Foreign Trade: 2012-13 - RBI - Reserve Bank of India


India's Foreign Trade: 2012-13
| This article reviews India’s merchandise trade performance during April-March 2012-13 on the basis of the data released by the Directorate General of Commercial Intelligence and Statistics (DGCI&S). It also analyses disaggregated commodity-wise and direction-wise details during April-December 2012. Highlights The stress on the external sector persisted in 2012-13 as India’s trade deficit continued to grow. While merchandise export performance remained subdued, import growth decelerated. However, owing to a sharp decline in exports, the trade deficit widened to US$ 190.9 billion in 2012-13 as compared with US$ 183.4 billion in 2011-12. The contraction in exports was more on account of decline in exports of manufactured goods, especially engineering goods and labour intensive sectors such as gems and jewellery. A major factor that weighed on India’s external demand was the subdued global demand conditions as export to destinations like EU and China declined considerably. In the wake of subdued global trade conditions, domestic policy efforts aimed at diversifying exports to other emerging countries also did not seem to have given much impetus to India’s exports. Major highlights of India’s trade performance during 2012-13 are set out below:
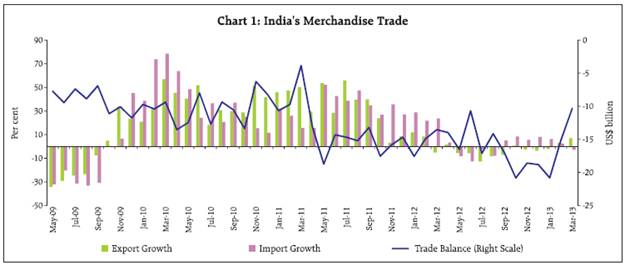
I. India’s Merchandise Trade Exports (April-March 2012-13) India’s exports showed a decline of 1.8 per cent in FY 2012-13. Owing to the global uncertainties and weak external demand, export contraction was largely evident in H1 of 2012-13. However, since December 2012, export growth has turned positive which may be reflecting the modest increase in trade activities across emerging markets and developing economies (EMDEs) as well as the impact of promotional measures undertaken by the Government (Box 1) and the Reserve Bank of India during 2012-13 (Chart 1). On a cumulative basis, however, merchandise exports stood at US$ 300.6 billion, declining by 1.8 per cent, in FY 2012-13 as compared to the export of US$ 306.0 billion in FY 2011-12 (21.8 per cent) (Table 1). Commodity-wise and Destination-wise Exports (April-December 2012) Disaggregated commodity-wise data show that exports remained subdued across all major commodity groups. Within manufacturing sector, which accounted for nearly 62 per cent of India’s exports, exports of engineering goods, textiles & textile products and gems & jewellery showed a contraction while that of chemicals & related products showed a decelerated growth during April-December 2012. Owing mainly to the subdued demand conditions in the EU countries and the US, exports of engineering goods declined by 5.0 per cent as against a rise of 17.6 per cent a year ago. Labour intensive sectors like gems and jewellery and handicrafts also recorded a negative growth of 5.5 per cent and 11.2 per cent, respectively in April-December 2012-13 as against a respective growth of 30.1 per cent and 23.1 per cent in the corresponding period of previous year. Box 1: Recent Policy Measures to Promote India’s Exports Global trade conditions remained subdued in 2012 and India’s exports were severely impacted. Keeping in view the reduced global demand in general and advanced economies in particular, the Government of India took additional measures during 2012-13 (June 5 and December 26). Measures announced in December 2012 mainly included (i) extension of interest subvention scheme for select employment oriented sectors (including SMEs in all sectors) upto end-March 2014, (ii) introduction of pilot scheme of 2 per cent interest subvention for project exports through EXIM Bank for countries of SAARC region, (iii) broadening the scope of Focus Market Scheme and Special Focus Market Scheme, Market Linked Focus Product Scheme (MLFPS) and (iv) incentive on incremental exports to USA, EU and countries of Asia during the period January-March 2013 over the base period. On April 18, 2013, a package of measures was announced by the Ministry of Commerce and Industry as part of the Foreign Trade Policy to revive investors’ interest in SEZs and to boost exports. Besides, zero duty Export Promotion Capital Goods (EPCG) scheme and 3 per cent EPCG scheme have been combined into one scheme which will be zero duty EPCG scheme covering all sectors subject to certain conditions. Other major measures announced were the following:
Among other major categories, exports of petroleum products and primary products showed substantially lower growth during April-December 2012 as compared with the corresponding period of 2011-12 (Table 2). Among the primary products, exports of iron ore continued to decline attributing to increase in freight charges, ban on mining activity in certain states, coupled with the hefty export duty levied by the government and differential freight rate imposed by the railways. Some minor sectors, however, recorded a positive growth during this year which mainly include tobacco, processed mineral, manufacture of metals and carpets. Destination-wise export data reveal that there has been a significant change in the composition of India’s trade during April-December 2012 (Table 3). Exports to major destinations such as EU, UAE, US and China showed either a decline or lower growth during this period. Decline in exports to China was evident mainly on account of substantial fall in exports of cotton, ores, iron and steel and petroleum products. However, export to countries like Iran, Iraq, Saudi Arabia, Russia and some African countries, particularly, Egypt, Kenya showed considerable uptrend. Exports to Saudi Arabia increased by 75.5 per cent mainly reflecting growing demand for items relating to mineral fuels, mineral oils and products of their distillation, bituminous substances, mineral waxes and organic chemicals.
In terms of share in India’s total merchandise exports, the share of EU and China declined significantly during April-December 2012. In contrast, the share of other important export destinations, viz. , the US and UAE, exhibited increase in April-December 2012 over the corresponding period of 2011-12. Similarly, the share of Africa and Latin America also increased. Country-wise analysis shows that impact on India’s exports was more pronounced mainly in countries where domestic growth was subdued in 2012, except Indonesia and Malaysia where domestic growth was broadly intact (Table 4). Moderation in exports to these countries was mainly evident in petroleum products; ships, boats and floating structures (only Indonesia); chemical and related products; articles of iron & steel and electrical machinery. Overall, EU and countries in developing Asia accounted for nearly threefourth of decline in India’s exports. Imports (April-March 2012-13) Merchandise imports in the FY 2012-13 recorded a marginal growth of 0.4 per cent amounting to US$ 491.5 billion compared to a growth rate of 32.3 per cent at US$ 489.3 billion. The decline was mainly led by a fall in gold and non-oil non-gold imports. Fall in non-oil non-gold was more on account of a slowdown in domestic activity and dampened demand for export related items. Notwithstanding a marginal decline in the international prices of crude oil (Indian basket), imports of POL items registered a growth of 9.3 per cent in 2012-13 reflecting growing domestic consumption of petroleum products (Table 6). Commodity-wise and Destination-wise Imports (April-December 2012) Disaggregated commodity-wise import data available for April-December 2012 show that among the principal commodities, ‘petroleum, petroleum and related material’ and gold & silver accounted for about 34 per cent and 10.8 per cent of India’s merchandise imports, respectively. A growth of 12.3 per cent in POL products was mainly on account of rise in quantum of imports given a marginal decline in the international price of crude oil (Indian basket). The decline in gold demand was witnessed mainly in H1 of 2012-13 which may be attributed to the rise in customs duty and various other measures to curb gold demand undertaken by the Government and the Reserve Bank of India. Gold imports, however, have shown a sharp pick up since November 2012 (except in March 2013). Among other components, imports of capital goods, accounting for 18.8 per cent of total merchandise imports, declined by 7.1 per cent owing to the slower investment activity in domestic economy. Import of export related items like ‘pearl precious semi-precious stones, chemicals, textile yarn and cashew nuts also recorded either a decline or a lower growth during this period (Table 7).
Destination-wise data for India’s imports show that India’s imports from EU, China, US, Australia, Hong Kong and Singapore declined during April-December 2012. In contrast, import from Saudi Arabia, UAE, Iraq and Kuwait, mainly the oil exporters, remained positive. Growth in imports from Latin American countries was significantly higher during the period as compared with corresponding period of 2011-12. For instance, increase in imports from Brazil has mainly on account of sugar and sugar confectionery, items relating to animal or vegetable fats and oils. Even though there was a decline in import from China, it continued to be the main import source accounting for 11.3 per cent of India’s merchandise imports. Other major source countries for import include UAE, Saudi Arabia, Switzerland and USA with a share of 7.8 per cent, 6.8 per cent, 5.5 per cent and 5.1 per cent, respectively. While the share of countries like USA, EU and Switzerland in India’s total imports declined in April-December 2012, the share of OPEC countries (including UAE) and Latin American showed a rise compared to the corresponding period a year ago (Table 8). Trade Deficit Sharper deceleration in merchandise export than imports led to a widening of trade deficit which increased to US$ 190.9 billion in 2012-13 as against US$ 183.4 billion in 2011-12. POL and gold together accounted for 45.4 per cent of India’s merchandise imports and 117 per cent of merchandise trade deficit during this period. Even though gold imports have shown decline in 2012-13, they were still at a high level and thus a cause for concern for India’s high trade deficit.
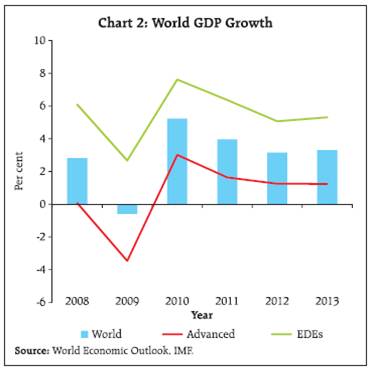
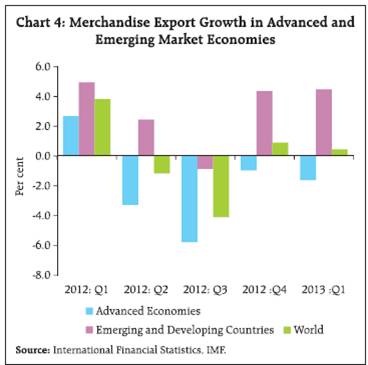
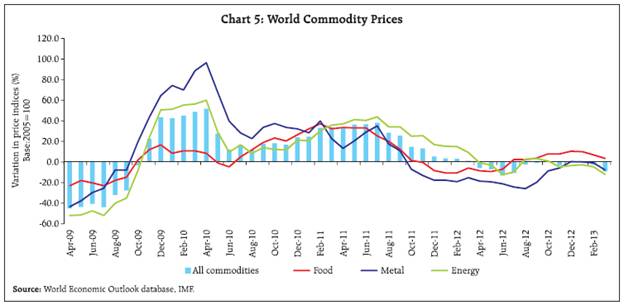
II. Trends in Global Trade As the global recovery slowed further in 2012, it mirrored in decelerating world trade growth (Chart 2). The world trade remained sluggish as the economic slowdown in global import demand in EU countries and some other major economies remained suppressed. Subdued demand conditions in EU economies affected not only intra-EU trade but also fed through other advanced countries and EMDEs. However, the global trade cycle has shown incipient signs of recovery across few EMDEs since the terminal quarter of 2012 (Chart 3). Nevertheless, overall world trade volume could grow by 2.5 per cent in 2012 as compared with 6.0 per cent in 2011. Going forward, trade prospects are expected to improve moderately. According to the IMF (2013), the world trade volume (goods and services) is projected to grow by 3.6 per cent in 2013. Similarly, the WTO projects a growth of 3.3 per cent in world goods trade volume in 2013 (2.2 per cent in 2012). However, such forecasts are subject to risks that may emanate from divergent economic outlook for the US and EU. Chart 4 illustrates the divergent trade performances of advanced and EMDEs economies over the course of 2012 and in Q1 of 2013. Slow growth in the advanced economies (AEs) continued to remain a weak link in global trade expansion, while EMDEs seem to be contributing to global trade through increased intraindustry and South-South trade. While the EMDEs seem to have maintained export growth momentum in Q1 of 2013, the decline in export growth in AEs has become more pronounced as compared with the previous quarter. Even though there were incipient signs of strengthening of some major economies, international prices of most industrial commodities have eased since mid-February 2013 (Chart 5). International crude oil prices softened in Q1 of 2013 largely due to improved supplies from the North Sea basin and slowing demand from European refineries approaching their seasonal maintenance cycle. Similarly, the prices of basic metal have reversed their upward trend reflecting oversupply and growing inventories in recent months. Although international food prices have followed mixed trends in Q1 of 2013, better-than-expected global stocks reported by the US Department of Agriculture and improved production prospects of wheat led to easing in grain prices in recent months. III. Outlook As mentioned earlier, India’s exports have shown positive growth since December 2012. However, the sustenance of the positive export growth momentum would continue to depend on demand and growth prospects of trading partner economies. According to the WTO assessment on world trade prospects, indicators of production and business sentiment in the first quarter of 2013 present a mixed picture of current economic conditions. Since the global growth is projected to pick up only marginally and key risks to global economy still prevail, India’s export growth is projected to pick up at a modest pace at best. Softening trend in international prices of POL and gold, supplemented by various measures undertaken by the Government and the Reserve Bank to reduce imports of these two items may bode well for containing import growth. Since the signs of global recovery are not so certain, sustaining Indian export recovery would be a challenge that needs efforts to raise productivity-based competitiveness. Detailed information on monthly commodity-wise and country-wise data on merchandise exports and imports for 2011-12 and 2012-13 can be accessed at /en/web/rbi/press-releases. * Prepared in the Division of International Trade and Finance, Department of Economic and Policy Research. The previous issue of the article was published in the Reserve Bank Bulletin, April 2013. |
|||||||||||||||||||||||||||||||||||||||||||||||||||||||||||||||||||||||||||||||||||||||||||||||||||||||||||||||||||||||||||||||||||||||||||||||||||||||||||||||||||||||||||||||||||||||||||||||||||||||||||||||||||||||||||||||||||||||||||||||||||||||||||||||||||||||||||||||||||||||||||||||||||||||||||||||||||||||||||||||||||||||||||||||||||||||||||||||||||||||||||||||||||||||||||||||||||||||||||||||||||||||||||||||||||||||||||||||||||||||||||||||||||||||||||||||||||||||||||||||||||||||||||||||||||||||||||||||||||||||||||||||||||||||||||||||||||||||||||||||||||||||||||||||||||||||||||||||||||||||||||||||||||||||||||||||||||||||||||||||||||||||||||||||||||||||||


Share this page:


Install the RBI mobile application and get quick access to the latest news!


