This article reviews India’s merchandise trade performance during April-December 2014 on the basis of data released by the Directorate General of Commercial Intelligence and Statistics (DGCI&S). It also provides a disaggregated commodity-wise and direction-wise analysis for this period. I. Exports
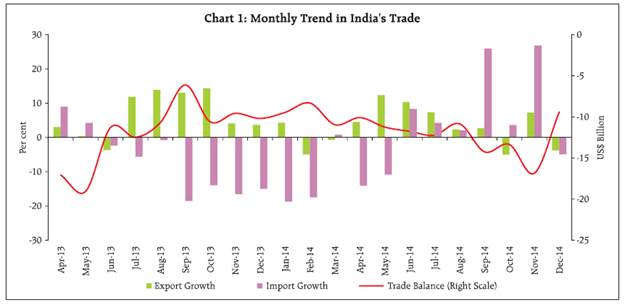
With uneven performance across months (Chart 1), exports grew modestly by 4.0 per cent during April-December 2014 with headwinds from sluggish global growth and declining unit value realisations, particularly exports of petroleum products and iron ore (Table 1). Although the demand from the United States (US) and the United Arab Emirates (UAE) improved, exports destined for the European Union (EU), China and a few gulf countries contracted considerably (Table 2).
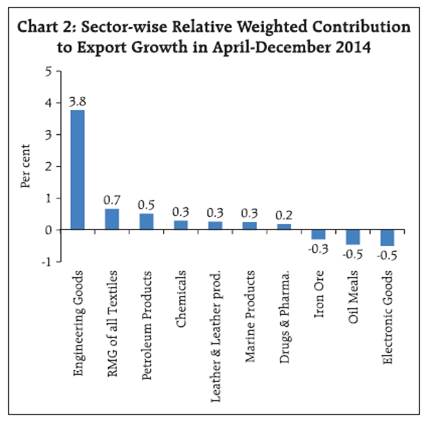
In terms of relative weighted contribution, engineering goods and readymade garments were the top contributors to export growth; iron ore, oil meals and electronic goods were negative contributors (Chart 2). Iron ore exports suffered due to domestic supply-side constraints and lower external demand for indigenous quality of ore and the protracted fall in international prices of iron ore which shifted demand to high quality ore from other countries. Similarly, a sharp fall in exports of oil meals reflected diversion of demand (particularly for bird and animal feed) to South American countries, including Brazil and Argentina; elevated prices of soyabean in the domestic market also eroded international competitiveness of this sector.
| Table 1: India’s Merchandise Trade |
| (US$ billion) |
| Item |
April-December |
| 2013-14R |
2014-15P |
| Exports |
231.8 |
241.2 |
| |
6.6 |
4.0 |
| Of which: Oil |
48.0 |
49.2 |
| |
7.4 |
2.5 |
| Non-oil |
183.8 |
191.9 |
| |
6.4 |
4.4 |
| Gold |
6.6 |
25.8 |
| |
-52.8 |
11.7 |
| Non-Oil Non-Gold |
177.2 |
184.5 |
| |
11.7 |
4.2 |
| Imports |
338.9 |
351.2 |
| |
-7.0 |
3.6 |
| Of which: Oil |
122.2 |
116.5 |
| |
0.3 |
-4.7 |
| Non-oil |
216.7 |
234.7 |
| |
-10.6 |
8.3 |
| Gold |
23.4 |
25.8 |
| |
-38.5 |
10.5 |
| Non-Oil Non-Gold |
193.3 |
208.1 |
| |
-5.4 |
8.1 |
| Trade Deficit |
-107.1 |
-110.1 |
| Of which: Oil |
-74.2 |
-67.3 |
| Non-oil |
-32.9 |
-42.8 |
| Non-Oil Non-Gold |
-16.2 |
-24.4 |
R: Revised; P: Provisional.
Note:Figures in italics are growth rates (y-o-y basis).
Source:Compiled from DGCI&S |
II. Imports
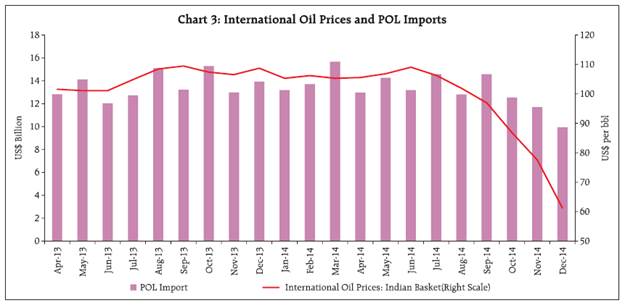
Helped by a decline in international commodity prices, imports recorded only a modest increase of 3.6 per cent during April-December 2014 as compared with a decline of 7 per cent in the corresponding period of the preceding year (Table 1 and Chart 1). POL imports declined by 4.7 per cent in April- December 2014 reflecting the fall in international crude oil prices by about 10 per cent (y-o-y basis) (Chart 3).
| Table 2: India’s Exports to Principal Regions |
| (Share in Per cent) |
| Region/Country |
April-March |
April-December |
| 2012-13 |
2013-14 |
2013-14R |
2014-15P |
| I. OECD Countries |
34.2 |
34.6 |
34.6 |
35.2 |
| European Union |
16.8 |
16.5 |
16.4 |
15.9 |
| North America |
12.7 |
13.1 |
13.2 |
14.5 |
| Of which: US |
12.0 |
12.4 |
12.6 |
13.8 |
| Asia and Oceania |
2.9 |
3.0 |
3.0 |
2.7 |
| Other OECD Countries |
1.8 |
2.1 |
2.0 |
2.1 |
| II. OPEC |
20.9 |
19.3 |
19.1 |
20.0 |
| III. Eastern Europe |
1.3 |
1.2 |
1.1 |
1.1 |
| IV. Developing Countries |
41.6 |
41.3 |
41.1 |
42.8 |
| Asia |
28.7 |
28.9 |
28.9 |
28.5 |
| SAARC |
5.0 |
5.6 |
5.3 |
6.5 |
| Other Asian Developing |
23.6 |
23.3 |
23.6 |
22.1 |
| Countries |
|
|
|
|
| Of which: China |
4.5 |
4.8 |
4.7 |
3.9 |
| Africa |
8.1 |
8.4 |
8.3 |
9.4 |
| Latin American Countries |
4.9 |
4.0 |
3.9 |
5.0 |
| V. Others / Unspecified |
1.9 |
3.7 |
4.0 |
0.9 |
| Total Exports |
100 |
100 |
100 |
100 |
R:Revised; P:Provisional.
Source:Compiled from DGCI&S data. |
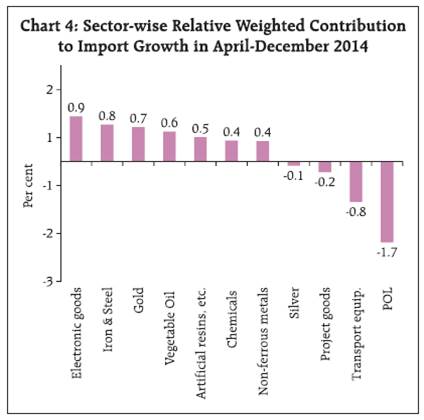
Non-oil non-gold imports increased by 8.1 per cent in April-December 2014. In terms of relative weighted contribution, import growth was mainly driven by higher demand for electronic goods, followed by iron and steel, gold and vegetable oils (Chart 4).
With domestic capacity in chemical industry remaining inadequate, the demand-supply gap continued to be bridged through imports of chemical products1. Similarly, with underutilisation of capacity in domestic steel industry caused by shortages of basic inputs (e.g., iron ore), domestic demand for finished steel products was met through higher imports, particularly from China. China, with a share of 13.1 per cent remained the top source of India’s imports, followed by Saudi Arabia (6.6 per cent), the UAE (6.0 per cent), Switzerland (4.9 per cent) and the US (4.6 per cent) while the EU countries together accounted for 10.5 per cent of India’s imports (Table 3). According to the DGCI&S data available up to November 2014, the volume of imports rose by 9.2 per cent during April-November 2014, almost at the same pace as was recorded in April- November 2013.
| Table 3: Shares of Groups/Countries in India’s Imports |
| (Share in Per cent) |
| Region/Country |
April-March |
April-December |
| 2012-13 |
2013-14 |
2013-14R |
2014-15P |
| I. OECD Countries |
28.8 |
25.6 |
26.1 |
25.9 |
| European Union |
10.6 |
11.1 |
11.2 |
10.5 |
| Of which: France |
0.9 |
0.8 |
0.8 |
0.8 |
| Germany |
2.9 |
2.9 |
2.9 |
2.8 |
| UK |
1.3 |
1.3 |
1.5 |
1.1 |
| North America |
5.7 |
5.7 |
5.9 |
5.5 |
| Of which: US |
5.1 |
5.0 |
5.2 |
4.6 |
| Asia and Oceania |
5.3 |
4.4 |
4.5 |
4.6 |
| Other OECD Countries |
7.1 |
4.5 |
4.6 |
5.4 |
| Of which: Switzerland |
6.5 |
4.1 |
4.3 |
4.9 |
| II. OPEC |
38.3 |
39.4 |
39.3 |
35.9 |
| III. Eastern Europe |
1.6 |
1.7 |
1.7 |
1.7 |
| IV. Developing Countries |
30.8 |
32 |
32.1 |
34.8 |
| Asia |
23.5 |
24.8 |
25.0 |
26.6 |
| SAARC |
0.5 |
0.6 |
0.5 |
0.6 |
| Other Asian Developing |
23.0 |
24.2 |
24.5 |
26.0 |
| Countries |
|
|
|
|
| of which: China |
10.7 |
11.4 |
11.5 |
13.1 |
| Africa |
3.9 |
3.3 |
3.5 |
4.2 |
| Latin American Countries |
3.4 |
3.9 |
3.6 |
4.0 |
| V. Others / Unspecified |
0.5 |
1.3 |
0.8 |
1.7 |
| Total Imports |
100 |
100 |
100 |
100 |
R:Revised; P:Provisional.
Source:Compiled from DGCI&S data. |
III. Trade Deficit
With imports outpacing exports in April-December 2014, India’s trade deficit widened, albeit only modestly. Improvement in terms of trade in recent months on account of the fall in import prices being larger than in export prices, helped in containing the size of the trade deficit. Bilateral trade data reveal that India’s trade deficit vis-a-vis China and Switzerland widened significantly as imports sourced from these countries rose sharply and exports declined significantly. IV. Outlook
The trade deficit remained contained largely due to fall in international oil prices compressing the overall import bill and compensating for the contraction in exports. Although the sharp fall in international prices of key commodities (e.g., crude oil, iron ore and other primary commodities) has resulted in terms of trade gains for India, continuing geopolitical uncertainties with adverse implications for oil production in the Middle East and cut in oil production in the US remain contingent risks to the outlook. Further, domestic production shortages in certain sectors need to be addressed through capacity additions and other policy measures so as to gradually reduce dependence on imports. From the medium-term perspective, a policy focus on enhancing productivity and competitiveness is required for the revival of exports on an enduring basis so that resilience to external shocks is gradually built.
|