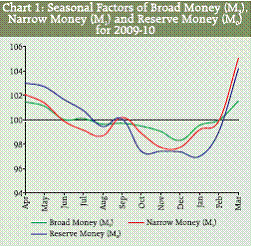
Monthly Seasonal Factors of Selected Economic Time Series* Analysis of seasonal behaviour of different economic time series is considered important by the policymakers, as it enables them to differentiate between the changes, which are seasonal from those, which are long-run in nature. In the recent period, with the availability and usage of high frequency data, the analysis of seasonal factors has in fact become essential for policy design, especially those of short duration of less than a year. This article presents the monthly seasonal factors of selected 77 economic/financial time series. Over the years, the intra-year seasonal variations of aggregate deposits and non-food credit of scheduled commercial banks exhibited almost similar movements. Within the WPI-All Commodities group, WPIPrimary Articles indicated higher seasonal fluctuations as compared to WPI-Manufactured Products group. Among the Food Articles group, the prices of ‘Fruits and Vegetables’ group exhibited high seasonal variation during the reference period. The seasonal variations of CPI-Industrial Workers are higher than those of WPI-All Commodities. A comparison of seasonal factors of IIP, according to the use-based classification, reveals that the seasonal variation was highest in respect of Capital Goods. Among the selected transport services indicators, the range of seasonal variations of ‘Revenue on Railway Freight Traffic’ was higher as compared to that of ‘Cargo Handled at Major Ports’. Over the reference period, Exports exhibited higher seasonal variations than Non-Oil Import. The intra-year seasonal variation in Broad Money (M3) and WPI-All Commodities had narrowed down from 2003-04 onwards. The ranges of seasonal factors of Bank Credit (SCBs) and IIP exhibited similar movements over the reference period. 1. Introduction 1.1 Economic time series, when measured at an interval of less than a year, exhibit seasonal fluctuations around its annual trend path. These fluctuations may arise due to certain factors such as peculiarities of production cycle, seasonal nature of activity, and other causes like weather, festivals, etc. While the seasonal variations occur regularly, yet they may vary in magnitude from year to year. The study of direction and magnitude of seasonal fluctuations helps in providing suitable treatment to seasonality, which in turn is useful in interpretation of movements in economic variables. Moreover, the seasonal adjustment estimates and removes seasonal effects from a time series, and thus provides better information on certain non-seasonal features. From the policy perspective, the information on seasonal factors of an economic variable is useful as it enables the policymaker to differentiate between the seasonal changes and long-run changes in the variable and thereby design appropriate policy responses. In the recent period, with the availability and usage of high frequency data, the analysis of seasonal factors has, in fact, become essential for policy design, especially of short duration of less than a year. In this backdrop, monthly seasonal factors for selected economic and financial time series of the Indian economy are being regularly published in the Reserve Bank of India Bulletin from 1980 onwards. 2. Data Coverage and Methodology 2.1 The present article covers monthly data from April 1994 to March 2010 (reference period) with respect to 77 economic/ financial series, including four new series, for the estimation of seasonal factors (Annex). The seasonal factors of these 77 time series are classified into six major groups, namely, A. Monetary and Banking Indicators (22 series); B. Wholesale Price Index (WPI) (21 series); C. Consumer Price Index (CPI) (4 series); D. Industrial Production (25 series); E. Services Sector Indicators (2 series); F. External Trade (3 series). 2.2 The seasonal factors for external trade variables are generated using data in US dollar terms. The data related to the series under study, except those of ‘Cement Production’, ‘Steel Production’, ‘Production of Commercial Motor Vehicles’ and ‘Services Sector Indicators’ are taken from the RBI Monthly Bulletin and the definitions of the series are the same as those in the ‘Notes on Tables’ of the RBI Monthly Bulletin. The data related to ‘Cement Production’, ‘Steel Production’, ‘Production of Commercial Motor Vehicles’ and ‘Services Sector Indicators’ are taken from Central Statistical Organisation (CSO) Monthly Capsule Report (on Infrastructure Sector Performance). 2.3 The seasonal factors have been estimated on the basis of X-12 ARIMA1 methodology, developed by the US Bureau of Census. The monthly seasonal factors for the year 2009-10, the average monthly seasonal factors for the period 1994-95 to 2009-10 and the forecasts of monthly seasonal factors for 2010-11 are presented in Table 1. The peak and trough values of the seasonal factors along with their respective months of occurrence are also presented in Table 1. Table 2 presents the dispersion of the seasonal factors, during the last 16 years, in terms of ranges (difference between peak and trough values) of seasonal factors for all the 77 variables. Monthly seasonal factors, for the last 16 years, for some of the important series are presented in the Table 3. The peak/trough months of selected series and classification of variables as per range of seasonal factor, during 2009-10, are provided in Tables 4 and 5, respectively. The salient features of variations in seasonal factors of some selected series during the last sixteen years in general, and for 2009-10 in particular, are briefly discussed in the subsequent paragraphs. 3. Salient Features 3.1 Monetary and Banking Aggregates As a part of Monetary and Banking aggregates, 22 important indicators were selected to analyse the intra-year seasonal variations over the reference period. 3.1.1 Seasonal Factors 3.1.1.1 The seasonal factors of Reserve Money (M0 ), Narrow Money (M1 ) and Broad Money (M3 ), during 2009-10, had their peaks in the month of March, whereas, the troughs occurred in the months of January, November and December, respectively (Table 1 and Chart 1).
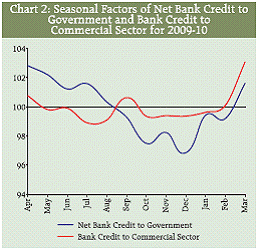
3.1.1.2 From the sources side of Broad Money, the Net Bank Credit to Government exhibited seasonal peak and trough in April and December, respectively, during 2009-10, whereas, the Bank Credit to Commercial Sector had peak and trough in the months of March and July, respectively (Table 1 and Chart 2).
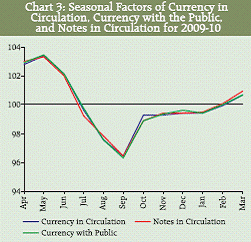
3.1.1.3 During 2009-10, the seasonal factors of ‘Currency with the Public’, ‘Currency in Circulation’ and ‘Notes in Circulation’ observed similar movements having seasonal peaks and troughs in May and September, respectively (Table 1 and Chart 3).
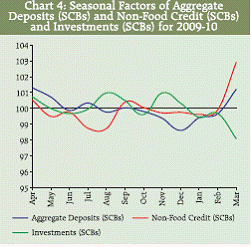
3.1.1.4 During 2009-10, the peaks of Aggregate Deposits (SCBs) and Non-Food Credit (SCBs) occurred during the months of April and March, respectively, whereas, the troughs occurred during the months of December and August, respectively (Table 1 and Chart 4). The seasonal peak and trough of Investments (SCBs) occurred during the months of August and March, respectively. The seasonal variations in Aggregate Deposits (SCBs) appear to be relatively much less, as compared to those in Non-Food Credit (SCBs).
3.1.2 Range of Seasonal Factors 3.1.2.1 Over the years, the intra-year seasonal variations, measured in terms of range (i.e., difference between peak and trough values) of seasonal factors of Aggregate Deposits (SCBs) and Non-Food Credit (SCBs) exhibited almost similar movements; having lower seasonal variations during the period 1999- 2000 to 2002-03. During the last three years (viz., 2007-08 to 2009-10), the seasonal variations of Non-Food Credit (SCBs) showed downward movement, whereas, the variations in Aggregate Deposits (SCBs) and Investments (SCBs) moved within the narrow band of 2.5 to 2.9 (Chart 5 and Table 2).
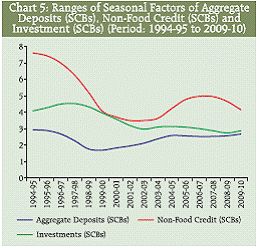 |
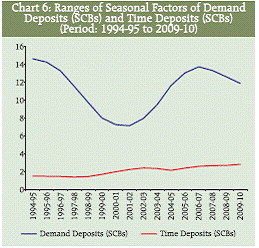
3.1.2.2 During the reference period, i.e., 1994-95 to 2009-10, Demand Deposits (SCBs) have shown greater seasonal fluctuations than Time Deposits (SCBs) (Chart 6). The seasonal fluctuations in Demand Deposits (SCBs) gradually declined upto 2001-02, and thereafter, started rising upto 2006-07 and thereafter has exhibited a declining trend. On the other hand, in the reference period, the seasonal variation of Time Deposits (SCBs) moved within the range of 1.4 to 2.8.
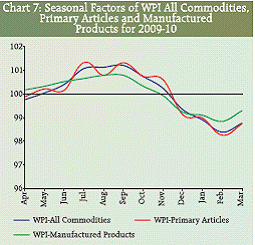
3.2. Price Indices 3.2.1 In order to investigate the seasonal movements of the price indices over the reference period, both Wholesale Price Indices (WPI) and Consumer Price Indices (CPI) were taken into account. From WPI group, 21 important series (commodities) were selected including food articles like cereals, wheat, rice and pulses. Three new series, viz., WPI of Potatoes, Onions, and Milk under the Food Articles group have been introduced in this article. Seasonal factors for major groups like Primary Articles and Manufactured Products were also worked out. From CPI group, all four series based on occupations, viz., CPIAgricultural Labourers (CPI-AL), CPI-Rural Labourers (CPI-RL), CPI-Industrial Workers (CPI-IW) and CPI-Urban Non-Manual Employees (CPI-UNME) were selected. 3.2.2 Seasonal Factors 3.2.2.1 During 2009-10, the seasonal factors of WPI-All Commodities registered peak in September and trough in February, which is similar to the average peak and trough months (Table 1). In case of the two main groups of All Commodities, viz., ‘Manufactured Products’ and ‘Primary Articles’, troughs occurred in the same month of February in 2009-10, whereas, the peaks occurred during August and July, respectively (Table 1 and Chart 7). The seasonal variations of ‘Manufactured Products’ prices were relatively much lower, as compared to ‘Primary Articles’.
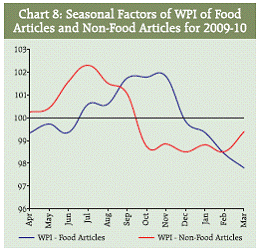
3.2.2.2 During 2009-10, the seasonal peaks of the prices for Food Articles and Non-Food Articles occurred during the months of November and July respectively, whereas, the troughs occurred in the months of March and December (Chart 8). The seasonal variation of WPI-Food Articles was lower than that of WPI-Non-Food Articles, during this year.
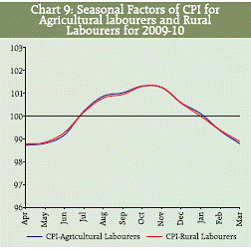
3.2.2.3 The Consumer Price Index (CPI) for both Agricultural and Rural Labourers, observed the similar pattern of seasonal movements and had seasonal peaks and troughs in October and April, respectively, during the year 2009-10 (Table 1 and Chart 9). Over the reference period, the peaks of these two series varied over October and November, while the troughs varied over March, April and May, respectively.
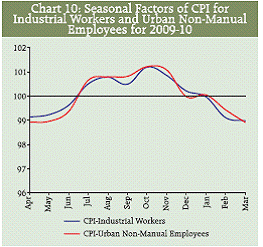
3.2.2.4 During 2009-10, the seasonal movement for other two Consumer Price series, viz., CPI-IW and CPI-UNME followed the same patterns as was observed throughout the reference period. The seasonal peaks and troughs for both CPI-IW and CPI-UNME occurred in the months of October and March, respectively (Table 1 and Chart 10).
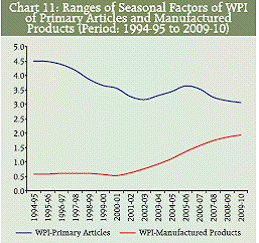
3.2.3 Range of Seasonal Factors 3.2.3.1 The range (i.e., difference between peak and trough values) of seasonal factors of WPI-All Commodities declined from 1.8 in 1994-95 to 1.2 in 2001-02, and thereafter, witnessed a steady increase from 1.2 in 2002-03 to 2.8 in 2009-10 (Table 2). 3.2.3.2 Between the two broad groups of WPI-All Commodities, viz., WPI-Primary Articles and WPI-Manufactured Products, the range of seasonal factors for Primary Articles prices indicated higher seasonal fluctuations. The intra-year seasonal variation in these two price series had narrowed down substantially from 2007-08 onwards (Table 2 and Chart 11).
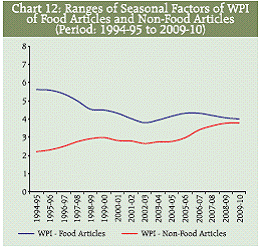
3.2.3.3 Within the Primary Articles group, the prices of Food Articles observed substantial reduction in the intra-year seasonal variation throughout the reference period. In case of WPI-Non-Food Articles, a steady increase in seasonal fluctuation was observed from 2005-06 onwards. The intra-year seasonal variation in WPI of ‘Food Articles’ and ‘Non- Food Articles’ had narrowed down throughout the reference period (Table 2 and Chart 12).
 |
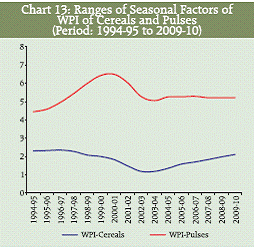
3.2.3.4 Within the Food Articles, the Pulses group displayed more seasonal variation, in terms of range of seasonal factors, than the Cereals group. The seasonal fluctuations of WPI-Pulses showed mixed patterns of movements during the reference period. During 2001-02 to 2003-04, the range of seasonal factors for WPI-Pulses had decreased considerably (Table 2 and Chart 13), whereas from 2004-05 onwards, it moved within the narrow band of 5.2 to 5.3. In the case of WPICereals, the range of seasonal factors increased from 1.4 in 2004-05 to 2.1 in 2009-10. Among the Cereals group, seasonal fluctuations of WPI-Rice had steadily decreased, over the reference period, except for the last two years (Table 2).
 |
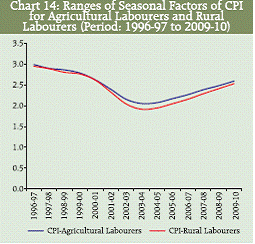
3.2.3.5 Among the Food Articles group, the prices of ‘Fruits and Vegetables’ group exhibited high seasonal variation, with the average range of 18.7, during the reference period. From 1998-99 onwards, the range of seasonal factors of ‘WPI-Fruits and Vegetables’ showed declining movement. Among the ‘Fruits and Vegetables’ group, the prices of ‘Potatoes’ and ‘Onions’ observed almost similar movement in seasonal variations, over the reference period. From 2003-04 onwards, the seasonal variation of WPI-Onions was lower than that of WPI-Potatoes (Table 2). 3.2.3.6 In the case of CPI for Agricultural and Rural labourers, similar seasonal variations had been observed during the reference period. During the period 1999- 00 to 2003-04, both the series showed sharp decline in the range of seasonal factors, and thereafter, from 2004-05 onwards, an increase in seasonal variation was exhibited for both the series (Table 2 and Chart 14).
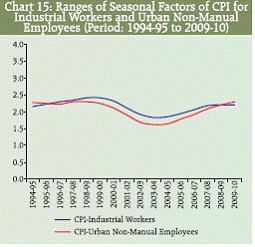
3.2.3.7 During the period 1998-99 to 2007-08, CPI-IW exhibited more seasonal variation than CPI-UNME. Although, from 2004-05 onwards, the range of seasonal factors for both the series was steadily increasing, some moderation in seasonal variation of CPIIndustrial Workers was also noticed during the last three years (Table 2 and Chart 15).
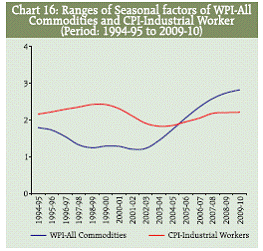
3.2.3.8 A comparison between the WPI-All Commodities and CPI-Industrial Workers, in terms of seasonal variation, over the reference period, reveals that, from 1994- 95 to 2004-05, the seasonal variations of CPIIW continued to be higher than that of WPIAll Commodities (Table 2 and Chart 16). Although the degree of divergence in the seasonal variations of the two series had narrowed during the period 2000-01 to 2004-05, the indications of widening of the gap was visible from 2005-06 onwards.
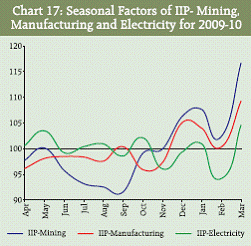
3.3. Index of Industrial Production (IIP) 3.3.1 In the case of Index of Industrial Production (IIP), both sectoral and use-based classifications were considered for analysing the intra-year seasonal variation. Among the 17 manufacturing industry groups of sectoral classification, 12 industry groups, which exhibited seasonality, were selected for analysis purpose. Apart from these industries, ‘Production of Steel’, ‘Production of Cement’ and ‘Production of Commercial Motor Vehicles’ were also selected for the study. 3.3.2 Seasonal Factors 3.3.2.1 During 2009-10, IIP-General Index had observed its peak in March and trough in April (Table 1). Although the peak of IIPGeneral Index in March had remained same over the years, the trough varied in the months of April, June and October (Table 3). During the reference period, the seasonal peaks of most of the industrial production series converged in the month of March, whereas the seasonal troughs were varied in the months of February, April and October. The major driver of industrial sector, namely, Manufacturing exhibited its seasonal peak in the month of March, during 2009-10, and trough in October (Table 1 and Chart 17). The other two sectors, viz., Mining and Electricity, both exhibited peaks in March and troughs in September and February, respectively. Over the years, the peak of these three series has occurred in the month of March.
 |
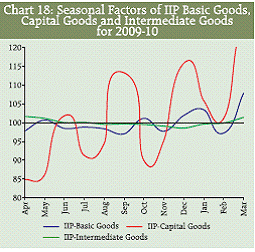
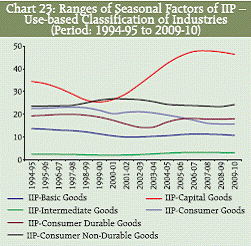
3.3.2.2 In respect of use-based classification, during 2009-10, IIP of Basic Goods and Capital Goods industries exhibited peaks in March, and Intermediate Goods in April and these industries exhibited troughs in the months of September, April and December respectively, (Table 1 and Chart 18). Among these three industrial goods, the seasonal fluctuations were the highest in respect of Capital Goods.
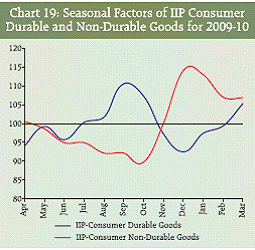
3.3.2.3 During 2009-10, the peaks of IIP Consumer Durable and Consumer Non- Durable Goods occurred in the months of September and December, respectively, whereas, troughs occurred in December and October (Table 1 and Chart 19). Over the reference period, the Consumer Non-Durable Goods registered peaks in January, whereas, those of Consumer Durable Goods varied between the months of March and October.
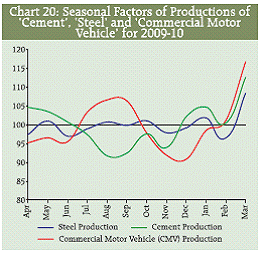
3.3.2.4 During 2009-10, Cement, Steel and Commercial Motor Vehicle Productions exhibited high degree of seasonal fluctuations. The peaks of all the three occurred in the same month of March, whereas, the troughs occurred in the months of August, February and December, respectively (Table 1 and Chart 20).
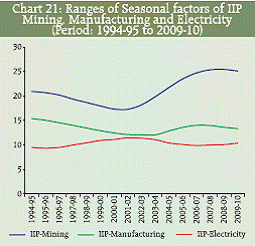
3.3.3 Range of Seasonal Factors 3.3.3.1 The range of seasonal factors of IIPGeneral Index had declined during the period 1994-95 to 2003-04, and thereafter, it showed upward movement (Table 2). Among the three major sectors of IIP, viz., Mining, Manufacturing and Electricity, IIPMining exhibited the highest seasonal variation, whereas, IIP-Electricity exhibited the lowest seasonal variation (Table 2 and Chart 21). During the period 2002-03 to 2006-07, the seasonal variation of IIPMining increased substantially as compared to that of IIP-Manufacturing. However, IIPElectricity witnessed a declining seasonal variation during this period. During the last two years, the three industries showed moderate seasonal fluctuations.
 |
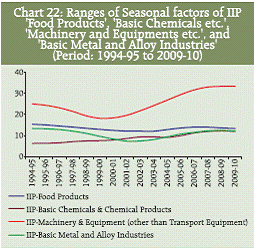
3.3.3.2 Among the selected sub-groups of the Manufacturing sector, ‘Food Products’ had shown much higher seasonal variations than the other sectors, whereas, ‘Cotton Textiles’ had the lowest seasonal variation. The four industries, viz., ‘Food Products’ (weight: 9.1 per cent), ‘Basic Chemicals & Chemical Products (except products of Petroleum & Coal)’ (weight: 14.0 per cent), ‘Machinery and Equipment other than Transport equipment’ (weight: 9.6 per cent) and ‘Basic Metal and Alloy Industries’ (weight: 7.5 per cent), covers 50 per cent of Manufacturing industry. During last three years, the seasonal variation among these industries had remained almost at the same level (Table 2 and Chart 22).
 |
3.3.3.3 Among the use-based classification of industries, ‘Intermediate Goods’ industries experienced the lowest seasonal variations, throughout the reference period. However, IIP-Capital Goods exhibited the highest seasonal variations in all the years, except in 1999-00 and 2000-01 (Table 2 and Chart 23).
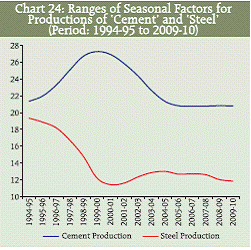
3.3.3.4 The ranges of seasonal variations of productions of ‘Cement’ and ‘Steel’ exhibited opposite movements, over the reference period. Among these two industries, the magnitude of seasonality is higher in Cement production (Table 2 and Chart 24). For the last three years, the indication of widening of the gap between seasonal variations of these two series was observed.
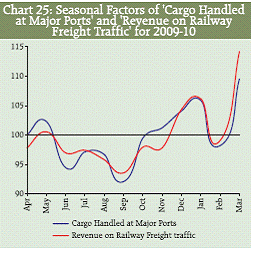
3.3.3.5 The seasonal variations in ‘Production of Commercial Motor Vehicles’, which increased during 1994-95 to 1999-00, declined from 2000-01 to 2005-06. However, some moderate increase in seasonal variations of ‘Production of Commercial Motor Vehicles’ was observed in the last four years (Table 2). 3.4. Services Sector Indicators 3.4.1 Seasonal Factors 3.4.1.1 Seasonal factors in respect of select Services Sector indicators, viz., ‘Cargo Handled at Major Ports’ and ‘Revenue on Railway Freight Traffic’ exhibited peaks in March during 2009-10, whereas, the troughs occurred in September (Table 1 and Chart 25). Over the reference period, the peak of these indicators occurred during March.
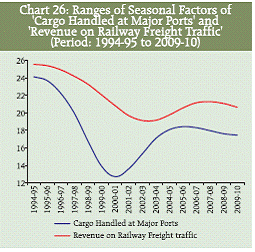
3.4.2 Range of Seasonal Factors 3.4.2.1 The seasonal variations, in terms of range of seasonal factors, for ‘Revenue on Railway Freight Traffic’ was more as compared to that of ‘Cargo Handled at Major Ports’, over the reference period (Table 2 and Chart 26). Although, from 2001-02 to 2006-07, ‘Cargo Handled at Major Ports’ showed sharp rise in range, a moderate decline in range was observed, thereafter. ‘Revenue on Railway Freight Traffic’ also showed a moderate decline in the range of seasonal factors in last two years.
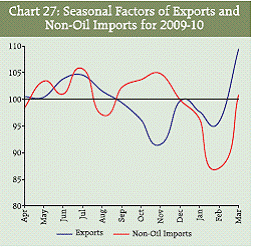
3.5. External Trade 3.5.1 Seasonal Factors 3.5.1.1 During 2009-10, the peaks of Exports and Non-Oil Imports occurred in the months of March and July, respectively, whereas, the troughs occurred in the months of November and February (Table 1 and Chart 27). Over the reference period under study, the peaks and troughs of Exports occurred in the month of March and November, respectively. In the case of Non- Oil Imports, the seasonal patterns varied over the reference period (Table 1).
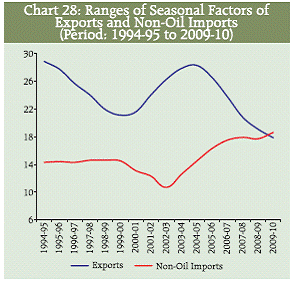
3.5.2 Range of Seasonal Factors 3.5.2.1 Over the reference period, Exports exhibited higher seasonal variations than Non-Oil Imports (Table 2 and Chart 28). Although the ranges of the seasonal variations for Exports and Non-Oil Imports had narrowed down in two occasions, i.e., ‘1994-95 to 1999-00’ and ‘2004-05 to 2008- 09’, the seasonal variation of Non-Oil Imports exceeded that of Exports, for the first time during the reference period in 2009-10.
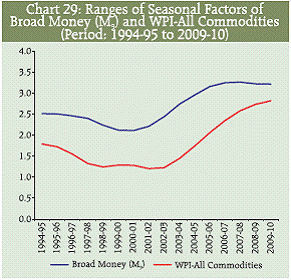
3.6. Inter-Sectoral Comparison of Seasonal Factors 3.6.1 Apart from the evaluation of the salient features (in terms of magnitude and direction) of seasonal factors for the selected series, a comparative study was done for throwing some light on the intersectoral performance among monetary and banking sectors, prices, industrial and external sectors. Some of the salient features, in terms of the movements of range of seasonal factors throughout the reference period, are discussed in this section. 3.6.2 The ranges of seasonal factors of Broad Money (M3 ) and WPI-All Commodities revealed similar movements from 1994-95 to 2002-03 (Table 2 and Chart 29). From 2003-04 onwards, the increase in degree of seasonality of Broad Money was more than that in WPI-All Commodities. The intra-year seasonal variation in these two series had narrowed down from 2003-04 onwards.
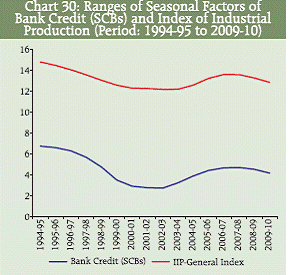
3.6.3 The ranges of seasonal factors of Bank Credit (SCBs) and Index of Industrial Production exhibited similar movements over the reference period (Table 2 and Chart 30). Further, Index of Industrial Production had higher seasonal variation than that of Bank Credit (SCBs). During the last two years, both the series exhibited a slight downward movement in seasonal variation.
3.6.4 During 1994-95 to 1998-99, the ranges of seasonal factors for Exports, Imports and Index of Industrial Production showed declining movement. Although, from 1999- 2000 onwards, the stability in seasonal variation of Index of Industrial Production was noticed, Imports exhibited steady increase in seasonal variation. In the case of Exports, after a steady increase during 2000-01 to 2004-05, the range of seasonal factors declined moderately during 2005-06 to 2009-10 (Table 2 and Chart 31).
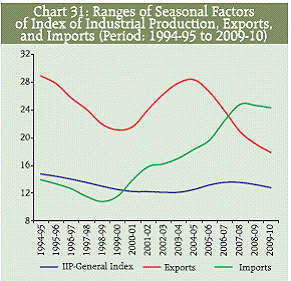 |
Table 1: Monthly Seasonal Factors of Selected Economic Time Series (April-March) |
|
Year |
Apr. |
May |
Jun. |
Jul. |
Aug. |
Sep. |
Oct. |
Nov. |
1 |
2 |
3 |
4 |
5 |
6 |
7 |
8 |
9 |
10 |
A.1.1 Broad Money (M3 ) |
|
2009-10 |
101.5 |
101.1 |
100.0 |
100.1 |
99.7 |
99.7 |
99.5 |
99.1 |
|
Average |
101.5 |
101.0 |
100.6 |
100.0 |
99.6 |
99.9 |
99.8 |
99.4 |
|
2010-11 |
101.4 |
101.1 |
100.0 |
100.1 |
99.6 |
99.6 |
99.5 |
99.0 |
A.1.1.1 Net Bank Credit to Government |
|
2009-10 |
102.8 |
102.2 |
101.2 |
101.6 |
100.3 |
99.3 |
97.5 |
98.2 |
|
Average |
101.6 |
101.5 |
101.5 |
102.2 |
100.2 |
99.2 |
99.4 |
99.6 |
|
2010-11 |
102.8 |
102.4 |
101.3 |
101.5 |
100.2 |
99.2 |
97.3 |
98.1 |
A.1.1.2 Bank Credit to Commercial Sector |
|
2009-10 |
100.7 |
99.8 |
99.9 |
98.9 |
99.1 |
100.6 |
99.3 |
99.4 |
|
Average |
101.5 |
100.3 |
99.7 |
99.1 |
98.5 |
99.6 |
99.5 |
99.1 |
|
2010-11 |
100.7 |
99.8 |
100.1 |
98.9 |
99.1 |
100.5 |
99.4 |
99.4 |
A.1.2 Narrow Money (M1 ) |
|
2009-10 |
102.1 |
101.4 |
99.9 |
99.2 |
98.7 |
100.2 |
98.9 |
97.8 |
|
Average |
103.1 |
102.4 |
101.5 |
99.2 |
98.1 |
98.7 |
98.9 |
98.5 |
|
2010-11 |
102.0 |
101.6 |
99.9 |
99.3 |
98.8 |
100.2 |
98.9 |
97.6 |
A.1.2.1 Currency with Public |
|
2009-10 |
103.0 |
103.4 |
102.2 |
99.7 |
97.6 |
96.3 |
98.9 |
99.4 |
|
Average |
103.3 |
104.4 |
102.6 |
99.7 |
97.8 |
96.2 |
98.5 |
99.8 |
|
2010-11 |
102.8 |
103.5 |
102.3 |
99.8 |
97.6 |
96.3 |
99.0 |
99.4 |
A.1.3 Reserve Money (M0 ) |
|
2009-10 |
103.0 |
102.7 |
101.7 |
100.8 |
99.5 |
100.1 |
97.4 |
97.4 |
|
Average |
103.3 |
102.6 |
101.8 |
99.9 |
98.7 |
97.7 |
99.1 |
98.7 |
|
2010-11 |
102.7 |
103.0 |
101.9 |
100.8 |
99.5 |
100.0 |
97.4 |
97.4 |
A.1.3.1 Currency in Circulation |
|
2009-10 |
102.8 |
103.4 |
102.2 |
99.6 |
97.5 |
96.5 |
99.3 |
99.3 |
|
Average |
103.1 |
104.4 |
102.9 |
99.6 |
97.8 |
96.2 |
98.6 |
99.7 |
|
2010-11 |
102.7 |
103.5 |
102.2 |
99.6 |
97.5 |
96.5 |
99.3 |
99.3 |
A.1.3.1.1 Notes in Circulation |
|
2009-10 |
103.0 |
103.3 |
102.0 |
99.2 |
97.8 |
96.5 |
98.9 |
99.4 |
|
Average |
103.3 |
104.5 |
102.6 |
99.2 |
97.8 |
96.3 |
98.5 |
99.7 |
|
2010-11 |
103.0 |
103.3 |
102.0 |
99.2 |
97.8 |
96.5 |
98.9 |
99.4 |
A.2.1 Deposits (Banking Department) |
|
2009-10 |
99.8 |
95.9 |
96.3 |
100.6 |
101.4 |
108.4 |
103.2 |
96.9 |
|
Average |
100.1 |
96.4 |
100.2 |
106.2 |
98.6 |
104.7 |
99.8 |
98.5 |
|
2010-11 |
100.3 |
96.5 |
96.4 |
100.5 |
101.5 |
108.4 |
103.7 |
96.8 |
A.2.2 Liabilities to the Banking System (SCBs) |
|
2009-10 |
101.8 |
100.9 |
104.3 |
100.9 |
100.9 |
99.2 |
100.4 |
95.2 |
|
Average |
102.1 |
101.0 |
101.0 |
99.4 |
99.6 |
100.0 |
100.2 |
98.6 |
|
2010-11 |
101.9 |
101.1 |
104.7 |
101.1 |
100.9 |
98.7 |
100.1 |
95.2 |
Table 1: Monthly Seasonal Factors of Selected Economic Time Series (April-March) (Contd.) |
|
Year |
Dec. |
Jan. |
Feb. |
Mar. |
Peak
Month |
Peak
Value |
Trough
Month |
Trough
Value |
1 |
2 |
11 |
12 |
13 |
14 |
15 |
16 |
17 |
18 |
A.1.1 Broad Money (M3 ) |
|
2009-10 |
98.3 |
99.6 |
100.0 |
101.5 |
Mar |
101.5 |
Dec |
98.3 |
|
Average |
98.9 |
99.1 |
99.3 |
100.9 |
Apr |
101.5 |
Dec |
98.9 |
|
2010-11 |
98.3 |
99.6 |
100.0 |
101.5 |
Mar |
101.5 |
Dec |
98.3 |
A.1.1.1 Net Bank Credit to Government |
|
2009-10 |
96.9 |
99.4 |
99.2 |
101.6 |
Apr |
102.8 |
Dec |
96.9 |
|
Average |
98.1 |
98.8 |
98.6 |
99.4 |
Jul |
102.2 |
Dec |
98.1 |
|
2010-11 |
96.9 |
99.5 |
99.3 |
101.8 |
Apr |
102.8 |
Dec |
96.9 |
A.1.1.2 Bank Credit to Commercial Sector |
|
2009-10 |
99.4 |
99.6 |
100.1 |
103.1 |
Mar |
103.1 |
Jul |
98.9 |
|
Average |
99.7 |
100.1 |
100.3 |
102.6 |
Mar |
102.6 |
Aug |
98.5 |
|
2010-11 |
99.3 |
99.6 |
100.1 |
103.1 |
Mar |
103.1 |
Jul |
98.9 |
A.1.2 Narrow Money (M1 ) |
|
2009-10 |
97.8 |
99.2 |
100.0 |
105.1 |
Mar |
105.1 |
Nov |
97.8 |
|
Average |
98.6 |
98.6 |
99.3 |
103.5 |
Mar |
103.5 |
Aug |
98.1 |
|
2010-11 |
97.7 |
99.2 |
99.9 |
105.0 |
Mar |
105.0 |
Nov |
97.6 |
A.1.2.1 Currency with Public |
|
2009-10 |
99.6 |
99.4 |
100.0 |
100.7 |
May |
103.4 |
Sep |
96.3 |
|
Average |
99.3 |
99.3 |
100.0 |
99.6 |
May |
104.4 |
Sep |
96.2 |
|
2010-11 |
99.6 |
99.3 |
100.0 |
100.7 |
May |
103.5 |
Sep |
96.3 |
A.1.3 Reserve Money (M0 ) |
|
2009-10 |
97.4 |
97.0 |
99.1 |
104.2 |
Mar |
104.2 |
Jan |
97.0 |
|
Average |
98.1 |
98.1 |
98.9 |
103.4 |
Mar |
103.4 |
Sep |
97.7 |
|
2010-11 |
97.4 |
96.9 |
99.1 |
104.3 |
Mar |
104.3 |
Jan |
96.9 |
A.1.3.1 Currency in Circulation |
|
2009-10 |
99.5 |
99.4 |
100.0 |
100.7 |
May |
103.4 |
Sep |
96.5 |
|
Average |
99.2 |
99.2 |
99.8 |
99.9 |
May |
104.4 |
Sep |
96.2 |
|
2010-11 |
99.5 |
99.3 |
100.0 |
100.7 |
May |
103.5 |
Sep |
96.5 |
A.1.3.1.1 Notes in Circulation |
|
2009-10 |
99.5 |
99.5 |
100.1 |
100.9 |
May |
103.3 |
Sep |
96.5 |
|
Average |
99.2 |
99.3 |
99.9 |
100.0 |
May |
104.5 |
Sep |
96.3 |
|
2010-11 |
99.5 |
99.5 |
100.1 |
100.9 |
May |
103.3 |
Sep |
96.5 |
A.2.1 Deposits (Banking Department) |
|
2009-10 |
101.2 |
94.7 |
97.3 |
104.0 |
Sep |
108.4 |
Jan |
94.7 |
|
Average |
99.3 |
95.8 |
97.1 |
104.5 |
Jul |
106.2 |
Jan |
95.8 |
|
2010-11 |
100.9 |
94.3 |
97.2 |
103.8 |
Sep |
108.4 |
Jan |
94.3 |
A.2.2 Liabilities to the Banking System (SCBs) |
|
2009-10 |
100.1 |
94.4 |
97.4 |
104.7 |
Mar |
104.7 |
Jan |
94.4 |
|
Average |
99.6 |
97.2 |
96.7 |
104.6 |
Mar |
104.6 |
Feb |
96.7 |
|
2010-11 |
100.0 |
94.4 |
97.8 |
104.4 |
Jun |
104.7 |
Jan |
94.4 |
Table 1: Monthly Seasonal Factors of Selected Economic Time Series (April-March) (Contd.) |
|
Year |
Apr. |
May |
Jun. |
Jul. |
Aug. |
Sep. |
Oct. |
Nov. |
1 |
2 |
3 |
4 |
5 |
6 |
7 |
8 |
9 |
10 |
A.2.3 Aggregate Deposits (SCBs) |
|
2009-10 |
101.3 |
100.7 |
99.9 |
100.3 |
99.8 |
100.0 |
99.8 |
99.4 |
|
Average |
101.1 |
100.3 |
100.1 |
100.1 |
100.0 |
100.7 |
100.0 |
99.6 |
|
2010-11 |
101.4 |
100.7 |
99.8 |
100.3 |
99.8 |
99.9 |
99.9 |
99.4 |
A.2.3.1 Demand Deposits (SCBs) |
|
2009-10 |
100.2 |
97.7 |
97.6 |
97.8 |
98.5 |
103.9 |
99.7 |
97.4 |
|
Average |
102.4 |
99.4 |
99.8 |
97.7 |
97.3 |
102.0 |
99.3 |
97.4 |
|
2010-11 |
100.6 |
98.0 |
97.6 |
98.0 |
99.0 |
103.9 |
99.7 |
97.3 |
A.2.3.2 Time Deposits (SCBs) |
|
2009-10 |
101.4 |
101.2 |
100.3 |
100.5 |
100.0 |
99.5 |
100.1 |
99.7 |
|
Average |
100.7 |
100.5 |
100.2 |
100.4 |
100.3 |
100.6 |
100.2 |
99.9 |
|
2010-11 |
101.5 |
101.1 |
100.2 |
100.4 |
99.9 |
99.3 |
100.1 |
99.7 |
A.3.1 Balances held Abroad (RBI) |
|
2009-10 |
94.3 |
93.6 |
97.8 |
102.1 |
104.8 |
103.8 |
103.8 |
103.8 |
|
Average |
99.0 |
95.5 |
96.4 |
100.1 |
99.2 |
99.0 |
98.1 |
103.1 |
|
2010-11 |
93.6 |
93.2 |
97.2 |
102.0 |
104.9 |
104.0 |
104.5 |
104.0 |
A.3.2 Investments (RBI) |
|
2009-10 |
98.8 |
102.0 |
107.0 |
101.2 |
83.1 |
110.5 |
111.0 |
95.6 |
|
Average |
97.6 |
96.5 |
111.4 |
112.5 |
93.4 |
109.1 |
100.6 |
98.4 |
|
2010-11 |
100.5 |
106.3 |
108.3 |
102.7 |
82.8 |
109.3 |
112.4 |
96.1 |
A.3.3 Cash in Hand and Balances with RBI (SCBs) |
|
2009-10 |
101.5 |
93.9 |
96.7 |
103.1 |
100.0 |
108.5 |
95.8 |
98.1 |
|
Average |
103.3 |
98.2 |
100.1 |
101.1 |
98.9 |
102.0 |
99.0 |
100.3 |
|
2010-11 |
102.4 |
94.1 |
97.1 |
102.9 |
100.1 |
108.5 |
96.0 |
97.9 |
A.3.4 Assets with the Banking System (SCBs) |
|
2009-10 |
102.4 |
101.9 |
102.8 |
97.6 |
96.7 |
99.0 |
99.9 |
94.6 |
|
Average |
101.4 |
99.2 |
99.2 |
98.4 |
100.2 |
102.6 |
99.5 |
95.9 |
|
2010-11 |
103.0 |
102.5 |
103.1 |
97.7 |
96.2 |
98.2 |
99.6 |
94.5 |
A.3.5 Bank Credit (SCBs) |
|
2009-10 |
100.6 |
99.6 |
100.0 |
98.8 |
98.8 |
100.3 |
99.7 |
99.7 |
|
Average |
101.5 |
100.3 |
99.6 |
98.9 |
98.2 |
99.3 |
99.5 |
99.3 |
|
2010-11 |
100.8 |
99.6 |
100.1 |
99.1 |
98.8 |
100.2 |
99.8 |
99.5 |
A.3.5.1 Loans, Cash, Credits and Overdrafts (SCBs) |
|
2009-10 |
100.4 |
99.5 |
100.0 |
99.0 |
98.7 |
100.4 |
99.5 |
99.8 |
|
Average |
100.6 |
99.7 |
99.7 |
99.1 |
98.4 |
99.9 |
99.9 |
99.5 |
|
2010-11 |
100.5 |
99.7 |
100.1 |
99.0 |
98.7 |
100.2 |
99.6 |
99.8 |
A.3.5.2 Food Credit (SCBs) |
|
2009-10 |
99.9 |
107.6 |
112.9 |
99.2 |
97.9 |
92.2 |
92.8 |
96.9 |
|
Average |
95.4 |
108.8 |
111.1 |
104.5 |
99.9 |
92.9 |
95.5 |
99.3 |
|
2010-11 |
100.7 |
107.7 |
113.0 |
99.5 |
98.2 |
92.5 |
92.7 |
96.8 |
Table 1: Monthly Seasonal Factors of Selected Economic Time Series (April-March) (Contd.) |
|
Year |
Dec. |
Jan. |
Feb. |
Mar. |
Peak
Month |
Peak
Value |
Trough
Month |
Trough
Value |
1 |
2 |
11 |
12 |
13 |
14 |
15 |
16 |
17 |
18 |
A.2.3 Aggregate Deposits (SCBs) |
|
2009-10 |
98.6 |
99.4 |
99.7 |
101.2 |
Apr |
101.3 |
Dec |
98.6 |
|
Average |
99.0 |
99.1 |
99.2 |
100.6 |
Apr |
101.1 |
Dec |
99.0 |
|
2010-11 |
98.6 |
99.5 |
99.7 |
101.2 |
Apr |
101.4 |
Dec |
98.6 |
A.2.3.1 Demand Deposits (SCBs) |
|
2009-10 |
98.7 |
99.3 |
99.6 |
109.3 |
Mar |
109.3 |
Nov |
97.4 |
|
Average |
99.8 |
98.5 |
99.0 |
108.2 |
Mar |
108.2 |
Aug |
97.3 |
|
2010-11 |
98.2 |
99.4 |
99.4 |
109.0 |
Mar |
109.0 |
Nov |
97.3 |
A.2.3.2 Time Deposits (SCBs) |
|
2009-10 |
98.6 |
99.3 |
99.8 |
99.9 |
Apr |
101.4 |
Dec |
98.6 |
|
Average |
99.1 |
99.3 |
99.4 |
99.3 |
Apr |
100.7 |
Dec |
99.1 |
|
2010-11 |
98.6 |
99.4 |
99.8 |
100.0 |
Apr |
101.5 |
Dec |
98.6 |
A.3.1 Balances held Abroad (RBI) |
|
2009-10 |
99.2 |
97.9 |
100.8 |
98.9 |
Aug |
104.8 |
May |
93.6 |
|
Average |
100.5 |
100.9 |
102.8 |
105.3 |
Mar |
105.3 |
May |
95.5 |
|
2010-11 |
99.6 |
98.4 |
100.4 |
98.4 |
Aug |
104.9 |
May |
93.2 |
A.3.2 Investments (RBI) |
|
2009-10 |
125.9 |
80.1 |
83.1 |
105.6 |
Dec |
125.9 |
Jan |
80.1 |
|
Average |
108.6 |
94.2 |
87.1 |
98.7 |
Jul |
112.5 |
Feb |
87.1 |
|
2010-11 |
122.6 |
77.9 |
84.1 |
104.7 |
Dec |
122.6 |
Jan |
77.9 |
A.3.3 Cash in Hand and Balances with RBI (SCBs) |
|
2009-10 |
100.9 |
99.1 |
101.7 |
99.9 |
Sep |
108.5 |
May |
93.9 |
|
Average |
99.1 |
100.5 |
102.7 |
95.4 |
Apr |
103.3 |
Mar |
95.4 |
|
2010-11 |
100.5 |
98.5 |
101.4 |
100.2 |
Sep |
108.5 |
May |
94.1 |
A.3.4 Assets with the Banking System (SCBs) |
|
2009-10 |
102.7 |
93.8 |
100.2 |
109.1 |
Mar |
109.1 |
Jan |
93.8 |
|
Average |
100.2 |
97.8 |
97.4 |
108.5 |
Mar |
108.5 |
Nov |
95.9 |
|
2010-11 |
102.7 |
93.7 |
100.8 |
108.9 |
Mar |
108.9 |
Jan |
93.7 |
A.3.5 Bank Credit (SCBs) |
|
2009-10 |
99.8 |
99.6 |
100.0 |
102.9 |
Mar |
102.9 |
Aug |
98.8 |
|
Average |
100.0 |
100.3 |
100.4 |
102.6 |
Mar |
102.6 |
Aug |
98.2 |
|
2010-11 |
99.7 |
99.6 |
99.9 |
102.8 |
Mar |
102.8 |
Aug |
98.8 |
A.3.5.1 Loans, Cash, Credits and Overdrafts (SCBs) |
|
2009-10 |
100.0 |
99.6 |
100.0 |
102.9 |
Mar |
102.9 |
Aug |
98.7 |
|
Average |
100.3 |
100.4 |
100.2 |
102.3 |
Mar |
102.3 |
Aug |
98.4 |
|
2010-11 |
99.8 |
99.6 |
100.0 |
102.8 |
Mar |
102.8 |
Aug |
98.7 |
A.3.5.2 Food Credit (SCBs) |
|
2009-10 |
102.3 |
95.6 |
102.0 |
101.3 |
Jun |
112.9 |
Sep |
92.2 |
|
Average |
100.5 |
98.4 |
99.1 |
97.0 |
Jun |
111.1 |
Sep |
92.9 |
|
2010-11 |
102.2 |
95.3 |
101.8 |
100.8 |
Jun |
113.0 |
Sep |
92.5 |
Table 1: Monthly Seasonal Factors of Selected Economic Time Series (April-March) (Contd.) |
|
Year |
Apr. |
May |
Jun. |
Jul. |
Aug. |
Sep. |
Oct. |
Nov. |
1 |
2 |
3 |
4 |
5 |
6 |
7 |
8 |
9 |
10 |
A.3.5.3 Non-Food Credit (SCBs) |
|
2009-10 |
100.5 |
99.5 |
99.8 |
98.8 |
98.7 |
100.4 |
100.1 |
99.7 |
|
Average |
101.9 |
99.9 |
99.0 |
98.6 |
98.1 |
99.4 |
99.8 |
99.3 |
|
2010-11 |
100.7 |
99.6 |
99.9 |
99.0 |
98.8 |
100.3 |
100.1 |
99.6 |
A.3.6 Investments (SCBs) |
|
2009-10 |
100.7 |
100.0 |
99.7 |
100.0 |
101.0 |
100.5 |
99.6 |
101.0 |
|
Average |
100.7 |
100.0 |
99.9 |
100.8 |
101.5 |
100.8 |
100.2 |
100.3 |
|
2010-11 |
100.6 |
100.0 |
99.8 |
99.9 |
101.0 |
100.7 |
99.5 |
101.1 |
B. WPI (Base: 1993-94=100) All Commodities |
|
2009-10 |
99.8 |
100.0 |
100.4 |
101.1 |
101.1 |
101.2 |
100.7 |
100.2 |
|
Average |
99.9 |
100.0 |
100.3 |
100.5 |
100.6 |
100.6 |
100.5 |
100.3 |
|
2010-11 |
99.8 |
100.0 |
100.4 |
101.1 |
101.2 |
101.2 |
100.7 |
100.2 |
B.1 WPI - Primary Articles |
|
2009-10 |
99.9 |
100.2 |
100.2 |
101.3 |
100.8 |
101.3 |
100.7 |
100.6 |
|
Average |
99.6 |
99.9 |
100.8 |
101.1 |
101.3 |
101.2 |
101.2 |
100.7 |
|
2010-11 |
99.9 |
100.1 |
100.1 |
101.3 |
100.8 |
101.2 |
100.7 |
100.6 |
B.1.1 WPI - Food Articles |
|
2009-10 |
99.3 |
99.7 |
99.4 |
100.6 |
100.6 |
101.7 |
101.8 |
101.8 |
|
Average |
99.6 |
99.8 |
100.6 |
100.8 |
101.4 |
101.3 |
101.8 |
101.4 |
|
2010-11 |
99.3 |
99.5 |
99.3 |
100.6 |
100.6 |
101.7 |
101.8 |
101.9 |
B.1.1.1 WPI - Food Grains (Cereals+Pulses) |
|
2009-10 |
99.4 |
99.1 |
98.9 |
99.5 |
99.6 |
99.7 |
100.5 |
101.0 |
|
Average |
99.4 |
99.2 |
99.5 |
100.2 |
100.6 |
100.4 |
100.1 |
100.4 |
|
2010-11 |
99.4 |
99.1 |
98.9 |
99.5 |
99.5 |
99.6 |
100.4 |
101.1 |
B.1.1.1.1 WPI - Cereals |
|
2009-10 |
99.6 |
99.2 |
99.0 |
99.3 |
99.3 |
99.6 |
100.1 |
100.6 |
|
Average |
99.5 |
99.2 |
99.5 |
100.2 |
100.5 |
100.4 |
99.9 |
100.1 |
|
2010-11 |
99.6 |
99.1 |
99.0 |
99.3 |
99.2 |
99.6 |
100.1 |
100.6 |
B.1.1.1.1.1 WPI - Wheat |
|
2009-10 |
98.8 |
97.3 |
97.4 |
98.4 |
98.6 |
99.3 |
99.7 |
101.6 |
|
Average |
98.7 |
97.1 |
97.3 |
98.4 |
98.7 |
98.9 |
99.3 |
101.3 |
|
2010-11 |
98.9 |
97.3 |
97.5 |
98.4 |
98.6 |
99.2 |
99.7 |
101.6 |
B.1.1.1.1.2 WPI - Rice |
|
2009-10 |
100.2 |
99.7 |
99.3 |
99.4 |
99.3 |
100.1 |
100.3 |
100.5 |
|
Average |
99.6 |
100.1 |
100.4 |
100.9 |
101.4 |
101.4 |
100.9 |
100.4 |
|
2010-11 |
100.2 |
99.7 |
99.2 |
99.3 |
99.2 |
100.1 |
100.3 |
100.5 |
B.1.1.1.2 WPI - Pulses |
|
2009-10 |
99.0 |
98.0 |
98.2 |
100.7 |
101.9 |
101.6 |
102.2 |
102.4 |
|
Average |
99.0 |
99.4 |
99.7 |
100.3 |
101.1 |
100.6 |
101.5 |
102.6 |
|
2010-11 |
98.7 |
97.9 |
98.0 |
100.8 |
101.9 |
101.7 |
102.2 |
102.4 |
Table 1: Monthly Seasonal Factors of Selected Economic Time Series (April-March) (Contd.) |
|
Year |
Dec. |
Jan. |
Feb. |
Mar. |
Peak
Month |
Peak
Value |
Trough
Month |
Trough
Value |
1 |
2 |
11 |
12 |
13 |
14 |
15 |
16 |
17 |
18 |
A.3.5.3 Non-Food Credit (SCBs) |
|
2009-10 |
99.8 |
99.6 |
99.9 |
102.9 |
Mar |
9102. |
Aug |
98.7 |
|
Average |
100.1 |
100.4 |
100.5 |
103.0 |
Mar |
103.0 |
Aug |
98.1 |
|
2010-11 |
99.7 |
99.6 |
99.9 |
102.8 |
Mar |
102.8 |
Aug |
98.8 |
A.3.6 Investments (SCBs) |
|
2009-10 |
100.3 |
99.4 |
99.7 |
98.1 |
Aug |
101.0 |
Mar |
98.1 |
|
Average |
99.7 |
99.0 |
99.0 |
98.1 |
Aug |
101.5 |
Mar |
98.1 |
|
2010-11 |
100.3 |
99.4 |
99.6 |
98.1 |
Nov |
101.1 |
Mar |
98.1 |
B. WPI (Base: 1993-94=100) All Commodities |
|
2009-10 |
99.3 |
98.9 |
98.4 |
98.8 |
Sep |
101.2 |
Feb |
98.4 |
|
Average |
99.6 |
99.2 |
99.1 |
99.2 |
Sep |
100.6 |
Feb |
99.1 |
|
2010-11 |
99.3 |
98.9 |
98.4 |
98.8 |
Sep |
101.2 |
Feb |
98.4 |
B.1 WPI - Primary Articles |
|
2009-10 |
99.1 |
99.0 |
98.3 |
98.7 |
Jul |
101.3 |
Feb |
98.3 |
|
Average |
99.3 |
98.6 |
98.3 |
98.0 |
Aug |
101.3 |
Mar |
98.0 |
|
2010-11 |
99.1 |
99.0 |
98.2 |
98.8 |
Jul |
101.3 |
Feb |
98.2 |
B.1.1 WPI - Food Articles |
|
2009-10 |
99.8 |
99.3 |
98.4 |
97.8 |
Nov |
101.8 |
Mar |
97.8 |
|
Average |
99.4 |
98.3 |
98.0 |
97.7 |
Oct |
101.8 |
Mar |
97.7 |
|
2010-11 |
99.9 |
99.4 |
98.4 |
97.8 |
Nov |
101.9 |
Mar |
97.8 |
B.1.1.1 WPI - Food Grains (Cereals+Pulses) |
|
2009-10 |
100.9 |
100.8 |
100.7 |
100.1 |
Nov |
101.0 |
Jun |
98.9 |
|
Average |
100.2 |
99.9 |
100.3 |
99.8 |
Aug |
100.6 |
May |
99.2 |
|
2010-11 |
100.9 |
100.9 |
100.7 |
100.1 |
Nov |
101.1 |
Jun |
98.9 |
B.1.1.1.1 WPI - Cereals |
|
2009-10 |
100.8 |
101.1 |
101.1 |
100.5 |
Feb |
101.1 |
Jun |
99.0 |
|
Average |
100.0 |
100.0 |
100.5 |
100.2 |
Aug |
100.5 |
May |
99.2 |
|
2010-11 |
100.8 |
101.1 |
101.2 |
100.5 |
Feb |
101.2 |
Jun |
99.0 |
B.1.1.1.1.1 WPI - Wheat |
|
2009-10 |
102.4 |
102.8 |
102.8 |
100.9 |
Jan |
102.8 |
May |
97.3 |
|
Average |
102.2 |
102.7 |
103.8 |
101.7 |
Feb |
103.8 |
May |
97.1 |
|
2010-11 |
102.4 |
102.8 |
102.8 |
101.0 |
Jan |
102.8 |
May |
97.3 |
B.1.1.1.1.2 WPI - Rice |
|
2009-10 |
100.2 |
100.3 |
100.5 |
100.4 |
Nov |
100.5 |
Jun |
99.3 |
|
Average |
99.0 |
98.5 |
98.7 |
99.1 |
Sep |
101.4 |
Jan |
98.5 |
|
2010-11 |
100.3 |
100.4 |
100.6 |
100.5 |
Feb |
100.6 |
Aug |
99.2 |
B.1.1.1.2 WPI - Pulses |
|
2009-10 |
101.2 |
99.4 |
98.7 |
97.2 |
Nov |
102.4 |
Mar |
97.2 |
|
Average |
101.1 |
99.7 |
97.9 |
97.5 |
Nov |
102.6 |
Mar |
97.5 |
|
2010-11 |
101.3 |
99.5 |
98.7 |
97.2 |
Nov |
102.4 |
Mar |
97.2 |
Table 1: Monthly Seasonal Factors of Selected Economic Time Series (April-March) (Contd.) |
|
Year |
Apr. |
May |
Jun. |
Jul. |
Aug. |
Sep. |
Oct. |
Nov. |
1 |
2 |
3 |
4 |
5 |
6 |
7 |
8 |
9 |
10 |
B.1.1.2 WPI - Fruits & Vegetables |
|
2009-10 |
99.6 |
101.1 |
98.6 |
101.1 |
101.1 |
107.9 |
106.7 |
107.4 |
|
Average |
99.9 |
99.3 |
101.4 |
101.1 |
103.4 |
105.9 |
109.9 |
107.7 |
|
2010-11 |
99.6 |
100.7 |
98.7 |
101.2 |
101.2 |
107.6 |
106.6 |
107.5 |
B.1.1.2.1 WPI - Potatoes |
|
2009-10 |
86.8 |
91.7 |
100.6 |
111.0 |
114.0 |
119.8 |
126.3 |
125.5 |
|
Average |
88.1 |
100.7 |
112.4 |
117.2 |
115.9 |
118.3 |
123.0 |
119.9 |
|
2010-11 |
86.5 |
91.3 |
99.7 |
111.1 |
114.5 |
120.3 |
126.5 |
125.8 |
B.1.1.2.2 WPI - Onions |
|
2009-10 |
84.0 |
80.1 |
82.9 |
88.9 |
96.1 |
106.1 |
114.2 |
121.8 |
|
Average |
83.6 |
83.0 |
86.9 |
93.5 |
100.4 |
111.6 |
125.1 |
132.6 |
|
2010-11 |
84.4 |
79.9 |
82.3 |
88.3 |
95.5 |
104.7 |
112.9 |
122.0 |
B.1.1.3 WPI - Milk |
|
2009-10 |
99.9 |
100.2 |
100.3 |
100.1 |
100.2 |
99.8 |
99.8 |
100.2 |
|
Average |
99.9 |
101.3 |
101.5 |
100.5 |
100.6 |
100.1 |
100.1 |
99.5 |
|
2010-11 |
99.9 |
100.2 |
100.3 |
100.1 |
100.1 |
99.8 |
99.8 |
100.2 |
B.1.2 WPI - Non-Food Articles |
|
2009-10 |
100.2 |
100.4 |
101.6 |
102.3 |
101.5 |
101.0 |
98.7 |
98.9 |
|
Average |
99.7 |
100.1 |
100.8 |
101.5 |
101.5 |
100.6 |
99.6 |
99.2 |
|
2010-11 |
100.4 |
100.6 |
101.7 |
102.3 |
101.4 |
101.0 |
98.6 |
98.9 |
B.1.2.1 WPI - Fibres |
|
2009-10 |
98.4 |
98.7 |
101.0 |
103.7 |
103.5 |
103.0 |
99.3 |
99.0 |
|
Average |
99.5 |
99.7 |
100.9 |
102.1 |
101.8 |
101.6 |
99.5 |
99.5 |
|
2010-11 |
98.3 |
98.7 |
101.0 |
103.7 |
103.3 |
102.9 |
99.3 |
99.0 |
B.1.2.1.1 WPI - Raw Cotton |
|
2009-10 |
98.3 |
98.8 |
101.2 |
104.3 |
104.2 |
103.5 |
99.3 |
98.9 |
|
Average |
98.8 |
99.3 |
100.7 |
102.1 |
102.6 |
102.4 |
100.0 |
99.8 |
|
2010-11 |
98.1 |
98.9 |
101.2 |
104.4 |
104.1 |
103.4 |
99.2 |
98.9 |
B.1.2.2 WPI - Oil Seeds |
|
2009-10 |
99.6 |
100.0 |
102.0 |
102.4 |
101.2 |
100.3 |
98.5 |
98.9 |
|
Average |
99.0 |
100.2 |
101.5 |
102.6 |
102.7 |
102.0 |
99.1 |
98.6 |
|
2010-11 |
99.6 |
100.0 |
102.0 |
102.3 |
101.1 |
100.2 |
98.5 |
99.1 |
B.2 WPI - Manufactured Products |
|
2009-10 |
100.2 |
100.3 |
100.5 |
100.7 |
100.8 |
100.8 |
100.3 |
99.9 |
|
Average |
100.1 |
100.2 |
100.2 |
100.4 |
100.3 |
100.3 |
100.1 |
99.9 |
|
2010-11 |
100.2 |
100.3 |
100.6 |
100.7 |
100.8 |
100.8 |
100.3 |
99.9 |
B.2.1 WPI - Food Products |
|
2009-10 |
99.8 |
99.8 |
100.1 |
100.2 |
100.4 |
100.1 |
99.3 |
99.9 |
|
Average |
99.7 |
99.7 |
100.2 |
100.7 |
100.7 |
100.7 |
100.2 |
99.9 |
|
2010-11 |
99.8 |
99.8 |
100.1 |
100.1 |
100.4 |
100.1 |
99.3 |
99.9 |
Table 1: Monthly Seasonal Factors of Selected Economic Time Series (April-March) (Contd.) |
|
Year |
Dec. |
Jan. |
Feb. |
Mar. |
Peak
Month |
Peak
Value |
Trough
Month |
Trough
Value |
1 |
2 |
11 |
12 |
13 |
14 |
15 |
16 |
17 |
18 |
B.1.1.2 WPI - Fruits & Vegetables |
|
2009-10 |
97.7 |
96.0 |
92.9 |
91.7 |
Sep |
107.9 |
Mar |
91.7 |
|
Average |
98.7 |
93.0 |
91.3 |
91.1 |
Oct |
109.9 |
Mar |
91.1 |
|
2010-11 |
97.8 |
96.2 |
92.9 |
91.6 |
Sep |
107.6 |
Mar |
91.6 |
B.1.1.2.1 WPI - Potatoes |
|
2009-10 |
100.2 |
82.1 |
78.0 |
81.3 |
Oct |
126.3 |
Feb |
78.0 |
|
Average |
96.0 |
76.9 |
72.8 |
80.5 |
Oct |
123.0 |
Feb |
72.8 |
|
2010-11 |
100.7 |
82.4 |
78.0 |
80.7 |
Oct |
126.5 |
Feb |
78.0 |
B.1.1.2.2 WPI - Onions |
|
2009-10 |
115.3 |
119.9 |
110.5 |
95.0 |
Sep |
121.8 |
May |
80.1 |
|
Average |
116.6 |
104.8 |
93.1 |
86.8 |
Sep |
132.6 |
May |
83.0 |
|
2010-11 |
117.0 |
120.5 |
111.0 |
95.2 |
Sep |
122.0 |
May |
79.9 |
B.1.1.3 WPI - Milk |
|
2009-10 |
99.9 |
99.7 |
99.8 |
100.2 |
Jun |
100.3 |
Jan |
99.7 |
|
Average |
99.0 |
98.5 |
99.5 |
99.7 |
Jun |
101.5 |
Jan |
98.5 |
|
2010-11 |
100.0 |
99.8 |
99.8 |
100.3 |
Mar |
100.3 |
Jan |
99.8 |
B.1.2 WPI - Non-Food Articles |
|
2009-10 |
98.5 |
98.8 |
98.5 |
99.4 |
Jul |
102.3 |
Dec |
98.5 |
|
Average |
99.2 |
99.8 |
99.1 |
98.9 |
Jul |
101.5 |
Mar |
98.9 |
|
2010-11 |
98.5 |
98.8 |
98.4 |
99.4 |
Jul |
102.3 |
Feb |
98.4 |
B.1.2.1 WPI - Fibres |
|
2009-10 |
99.0 |
99.6 |
97.3 |
97.8 |
Jul |
103.7 |
Feb |
97.3 |
|
Average |
98.9 |
99.8 |
98.4 |
98.2 |
Jul |
102.1 |
Mar |
98.2 |
|
2010-11 |
99.2 |
99.6 |
97.4 |
97.8 |
Jul |
103.7 |
Feb |
97.4 |
B.1.2.1.1 WPI - Raw Cotton |
|
2009-10 |
98.7 |
99.2 |
96.8 |
97.3 |
Jul |
104.3 |
Feb |
96.8 |
|
Average |
98.9 |
99.7 |
98.0 |
97.6 |
Aug |
102.6 |
Mar |
97.6 |
|
2010-11 |
98.9 |
99.2 |
96.9 |
97.3 |
Jul |
104.4 |
Feb |
96.9 |
B.1.2.2 WPI - Oil Seeds |
|
2009-10 |
98.4 |
100.1 |
100.1 |
98.6 |
Jul |
102.4 |
Dec |
98.4 |
|
Average |
98.2 |
99.6 |
98.8 |
98.0 |
Aug |
102.7 |
Mar |
98.0 |
|
2010-11 |
98.5 |
100.1 |
100.1 |
98.6 |
Jul |
102.3 |
Oct |
98.5 |
B.2 WPI - Manufactured Products |
|
2009-10 |
99.2 |
99.1 |
98.8 |
99.3 |
Aug |
100.8 |
Feb |
98.8 |
|
Average |
99.7 |
99.6 |
99.5 |
99.7 |
Jul |
100.4 |
Feb |
99.5 |
|
2010-11 |
99.2 |
99.1 |
98.8 |
99.3 |
Aug |
100.8 |
Feb |
98.8 |
B.2.1 WPI - Food Products |
|
2009-10 |
99.3 |
100.4 |
100.5 |
100.3 |
Feb |
100.5 |
Dec |
99.3 |
|
Average |
99.6 |
99.8 |
99.4 |
99.5 |
Sep |
100.7 |
Feb |
99.4 |
|
2010-11 |
99.3 |
100.5 |
100.6 |
100.3 |
Feb |
100.6 |
Dec |
99.3 |
Table 1: Monthly Seasonal Factors of Selected Economic Time Series (April-March) (Contd.) |
|
Year |
Apr |
May. |
Jun. |
Jul. |
Aug. |
Sep. |
Oct. |
Nov. |
1 |
2 |
3 |
4 |
5 |
6 |
7 |
8 |
9 |
10 |
B.2.1.1 WPI - Grain Mill Products |
|
2009-10 |
98.6 |
98.3 |
97.7 |
98.3 |
98.9 |
99.3 |
100.7 |
102.1 |
|
Average |
98.2 |
95.9 |
96.4 |
98.4 |
99.2 |
99.8 |
101.0 |
102.3 |
|
2010-11 |
98.9 |
98.6 |
98.0 |
98.2 |
98.9 |
99.3 |
100.6 |
102.0 |
B.2.1.2 WPI - Sugar |
|
2009-10 |
100.7 |
99.9 |
98.9 |
99.5 |
100.2 |
101.0 |
100.8 |
100.0 |
|
Average |
100.2 |
100.4 |
99.8 |
100.0 |
100.4 |
100.5 |
100.5 |
100.1 |
|
2010-11 |
100.6 |
99.8 |
98.7 |
99.5 |
100.2 |
101.1 |
100.9 |
100.0 |
B.2.1.3 WPI - Edible Oils |
|
2009-10 |
99.2 |
99.5 |
100.0 |
100.8 |
100.8 |
100.3 |
99.5 |
99.7 |
|
Average |
99.2 |
99.3 |
99.0 |
100.8 |
101.1 |
101.0 |
100.3 |
100.2 |
|
2010-11 |
99.2 |
99.5 |
100.0 |
100.8 |
100.8 |
100.2 |
99.5 |
99.7 |
C.1 Consumer Price Index for Industrial Workers (Base: 2001=100) |
|
2009-10 |
99.1 |
99.2 |
99.6 |
100.5 |
100.8 |
100.5 |
101.2 |
100.9 |
|
Average |
99.2 |
99.5 |
99.9 |
100.7 |
100.8 |
100.5 |
101.1 |
100.7 |
|
2010-11 |
99.1 |
99.2 |
99.6 |
100.5 |
100.8 |
100.5 |
101.2 |
100.9 |
C.2 Consumer Price Index for Urban Non-Manual Employees (Base: 1984-85=100) |
|
2009-10 |
98.9 |
99.0 |
99.4 |
100.7 |
100.8 |
100.8 |
101.2 |
101.1 |
|
Average |
99.2 |
99.4 |
99.8 |
100.8 |
100.8 |
100.6 |
101.0 |
100.7 |
|
2010-11 |
98.9 |
98.8 |
99.3 |
100.7 |
100.8 |
100.8 |
101.2 |
101.1 |
C.3 Consumer Price Index for Agricultural Labourers (Base: 1986-87=100) |
|
2009-10 |
98.7 |
98.8 |
99.2 |
100.2 |
100.9 |
101.0 |
101.3 |
101.2 |
|
Average |
98.8 |
99.0 |
99.6 |
100.3 |
100.7 |
100.9 |
101.3 |
101.2 |
|
2010-11 |
98.7 |
98.7 |
99.1 |
100.2 |
100.9 |
101.1 |
101.3 |
101.3 |
C.4 Consumer Price Index for Rural Labourers (Base: 1986-87=100) |
|
2009-10 |
98.8 |
98.8 |
99.3 |
100.2 |
100.8 |
100.9 |
101.3 |
101.3 |
|
Average |
98.9 |
99.1 |
99.6 |
100.3 |
100.6 |
100.8 |
101.2 |
101.2 |
|
2010-11 |
98.7 |
98.7 |
99.2 |
100.2 |
100.8 |
101.0 |
101.3 |
101.3 |
D. IIP - General Index |
|
2009-10 |
96.6 |
98.8 |
98.0 |
98.2 |
97.5 |
99.6 |
96.7 |
97.3 |
|
Average |
97.4 |
99.0 |
96.7 |
97.8 |
97.3 |
97.8 |
96.9 |
98.3 |
|
2010-11 |
96.7 |
98.4 |
98.1 |
98.3 |
97.6 |
99.8 |
96.6 |
97.3 |
D.1.1 IIP - Basic Goods Industries |
|
2009-10 |
97.7 |
100.7 |
98.5 |
98.8 |
98.4 |
97.0 |
101.1 |
97.7 |
|
Average |
96.9 |
100.3 |
97.5 |
99.0 |
98.6 |
96.8 |
100.4 |
98.5 |
|
2010-11 |
97.9 |
100.6 |
98.6 |
98.9 |
98.4 |
97.1 |
101.1 |
97.6 |
D.1.2 IIP - Capital Goods Industries |
|
2009-10 |
84.8 |
86.0 |
101.8 |
91.3 |
94.4 |
113.3 |
89.9 |
95.3 |
|
Average |
90.2 |
92.6 |
96.7 |
93.8 |
95.8 |
104.2 |
95.2 |
99.0 |
|
2010-11 |
85.5 |
83.9 |
102.1 |
91.2 |
94.2 |
114.3 |
89.4 |
94.7 |
Table 1: Monthly Seasonal Factors of Selected Economic Time Series (April-March) (Contd.) |
|
Year |
Dec. |
Jan. |
Feb. |
Mar. |
Peak
Month |
Peak
Value |
Trough
Month |
Trough
Value |
1 |
2 |
11 |
12 |
13 |
14 |
15 |
16 |
17 |
18 |
B.2.1.1 WPI - Grain Mill Products |
|
2009-10 |
101.7 |
101.5 |
101.4 |
101.1 |
Nov |
102.1 |
Jun |
97.7 |
|
Average |
102.9 |
102.6 |
102.7 |
100.7 |
Dec |
102.9 |
May |
95.9 |
|
2010-11 |
101.6 |
101.4 |
101.2 |
101.1 |
Nov |
102.0 |
Jun |
98.0 |
B.2.1.2 WPI - Sugar |
|
2009-10 |
98.7 |
99.9 |
100.4 |
100.2 |
Sep |
101.0 |
Dec |
98.7 |
|
Average |
99.3 |
99.5 |
99.5 |
99.8 |
Oct |
100.5 |
Dec |
99.3 |
|
2010-11 |
98.7 |
99.8 |
100.5 |
100.2 |
Sep |
101.1 |
Dec |
98.7 |
B.2.1.3 WPI - Edible Oils |
|
2009-10 |
100.6 |
100.6 |
99.5 |
99.5 |
Jul |
100.8 |
Apr |
99.2 |
|
Average |
100.5 |
100.2 |
99.3 |
99.0 |
Aug |
101.1 |
Mar |
99.0 |
|
2010-11 |
100.6 |
100.6 |
99.4 |
99.5 |
Jul |
100.8 |
Apr |
99.2 |
C.1 Consumer Price Index for Industrial Workers (Base: 2001=100) |
|
2009-10 |
100.2 |
100.0 |
99.1 |
99.0 |
Oct |
101.2 |
Mar |
99.0 |
|
Average |
99.9 |
99.7 |
99.0 |
99.0 |
Oct |
101.1 |
Feb |
99.0 |
|
2010-11 |
100.2 |
100.0 |
99.1 |
99.0 |
Oct |
101.2 |
Mar |
99.0 |
C.2 Consumer Price Index for Urban Non-Manual Employees (Base: 1984-85=100) |
|
2009-10 |
100.0 |
100.0 |
99.4 |
98.9 |
Oct |
101.2 |
Mar |
98.9 |
|
Average |
99.8 |
99.7 |
99.3 |
99.0 |
Oct |
101.0 |
Mar |
99.0 |
|
2010-11 |
100.0 |
100.1 |
99.4 |
98.9 |
Oct |
101.2 |
May |
98.8 |
C.3 Consumer Price Index for Agricultural Labourers (Base: 1986-87=100) |
|
2009-10 |
100.6 |
100.1 |
99.4 |
98.8 |
Oct |
101.3 |
Apr |
98.7 |
|
Average |
100.4 |
99.7 |
99.2 |
99.0 |
Oct |
101.3 |
Apr |
98.8 |
|
2010-11 |
100.6 |
100.1 |
99.4 |
98.7 |
Oct |
101.3 |
Apr |
98.7 |
C.4 Consumer Price Index for Rural Labourers (Base: 1986-87=100) |
|
2009-10 |
100.6 |
100.0 |
99.4 |
98.9 |
Oct |
101.3 |
Apr |
98.8 |
|
Average |
100.4 |
99.6 |
99.4 |
98.9 |
Nov |
101.2 |
Apr |
98.9 |
|
2010-11 |
100.6 |
100.0 |
99.4 |
98.9 |
Oct |
101.3 |
Apr |
98.7 |
D. IIP - General Index |
|
2009-10 |
104.8 |
104.0 |
100.0 |
109.4 |
Mar |
109.4 |
Apr |
96.6 |
|
Average |
104.9 |
104.7 |
100.7 |
109.3 |
Mar |
109.3 |
Jun |
96.7 |
|
2010-11 |
104.8 |
104.0 |
100.1 |
109.2 |
Mar |
109.2 |
Oct |
96.6 |
D.1.1 IIP - Basic Goods Industries |
|
2009-10 |
101.9 |
103.4 |
97.2 |
107.8 |
Mar |
107.8 |
Sep |
97.0 |
|
Average |
102.9 |
104.2 |
97.3 |
108.0 |
Mar |
108.0 |
Sep |
96.8 |
|
2010-11 |
101.8 |
103.3 |
97.3 |
107.7 |
Mar |
107.7 |
Sep |
97.1 |
D.1.2 IIP - Capital Goods Industries |
|
2009-10 |
115.8 |
105.9 |
101.1 |
131.2 |
Mar |
131.2 |
Apr |
84.8 |
|
Average |
107.6 |
101.8 |
102.4 |
126.3 |
Mar |
126.3 |
Apr |
90.2 |
|
2010-11 |
116.2 |
106.3 |
101.7 |
130.9 |
Mar |
130.9 |
May |
83.9 |
Table 1: Monthly Seasonal Factors of Selected Economic Time Series (April-March) (Contd.) |
|
Year |
Apr. |
May |
Jun. |
Jul. |
Aug. |
Sep. |
Oct. |
Nov. |
1 |
2 |
3 |
4 |
5 |
6 |
7 |
8 |
9 |
10 |
D.1.3 IIP - Intermediate Goods Industries |
|
2009-10 |
101.7 |
101.2 |
100.0 |
100.1 |
99.6 |
99.7 |
99.5 |
99.1 |
|
Average |
101.5 |
101.0 |
100.6 |
100.0 |
99.6 |
99.9 |
99.8 |
99.4 |
|
2010-11 |
101.6 |
101.2 |
101.8 |
103.7 |
101.3 |
99.6 |
97.2 |
96.6 |
D.1.4 IIP - Consumer Goods Industries |
|
2009-10 |
99.2 |
98.6 |
95.0 |
96.1 |
94.5 |
96.6 |
94.0 |
99.3 |
|
Average |
100.5 |
97.8 |
93.5 |
94.2 |
93.4 |
95.3 |
92.9 |
98.8 |
|
2010-11 |
99.1 |
98.2 |
95.1 |
96.3 |
94.5 |
96.7 |
93.8 |
99.3 |
D.1.4.1 IIP - Consumer Durable Goods Industries |
|
2009-10 |
94.0 |
99.2 |
95.7 |
100.3 |
101.7 |
110.5 |
107.3 |
97.3 |
|
Average |
93.3 |
97.8 |
95.8 |
98.4 |
99.3 |
104.1 |
103.6 |
99.3 |
|
2010-11 |
95.2 |
98.8 |
95.6 |
101.1 |
101.4 |
110.8 |
107.0 |
97.0 |
D.1.4.2 IIP - Consumer Non-Durable Goods Industries |
|
2009-10 |
100.6 |
98.6 |
94.9 |
94.9 |
92.2 |
92.2 |
89.8 |
100.0 |
|
Average |
102.9 |
97.5 |
92.6 |
93.2 |
91.5 |
92.4 |
90.1 |
98.4 |
|
2010-11 |
100.2 |
98.2 |
95.1 |
95.0 |
92.2 |
92.0 |
89.7 |
100.1 |
D.2.1 IIP - Mining |
|
2009-10 |
97.8 |
100.1 |
95.7 |
93.2 |
92.5 |
91.6 |
99.1 |
99.9 |
|
Average |
95.6 |
99.5 |
95.6 |
96.2 |
94.4 |
93.1 |
99.3 |
99.9 |
|
2010-11 |
97.8 |
99.9 |
95.7 |
93.1 |
92.6 |
91.8 |
99.1 |
99.9 |
D.2.2 IIP - Manufacturing |
|
2009-10 |
96.2 |
98.1 |
98.5 |
98.4 |
97.6 |
100.4 |
95.9 |
97.3 |
|
Average |
97.4 |
98.4 |
96.9 |
97.7 |
97.4 |
98.3 |
96.3 |
98.2 |
|
2010-11 |
96.3 |
97.7 |
98.6 |
98.5 |
97.6 |
100.5 |
95.8 |
97.4 |
D.2.2.1 IIP - Food Products |
|
2009-10 |
102.3 |
83.5 |
75.5 |
74.3 |
73.5 |
74.1 |
75.7 |
103.7 |
|
Average |
110.9 |
89.7 |
81.5 |
76.7 |
74.3 |
76.3 |
76.8 |
100.3 |
|
2010-11 |
101.9 |
83.2 |
75.2 |
74.2 |
73.9 |
74.2 |
76.1 |
103.9 |
D.2.2.2 IIP - Cotton Textiles |
|
2009-10 |
98.9 |
101.6 |
100.0 |
101.8 |
101.0 |
99.5 |
98.4 |
98.9 |
|
Average |
98.5 |
100.5 |
99.4 |
103.0 |
100.6 |
99.4 |
98.3 |
97.7 |
|
2010-11 |
98.8 |
101.6 |
100.0 |
101.8 |
100.9 |
99.5 |
98.4 |
99.0 |
D.2.2.3 IIP - Textile Products (including Wearing Apparel) |
|
2009-10 |
103.0 |
103.0 |
96.7 |
102.8 |
101.8 |
99.7 |
95.2 |
97.5 |
|
Average |
102.6 |
102.6 |
96.4 |
100.3 |
101.1 |
100.0 |
97.6 |
97.9 |
|
2010-11 |
102.9 |
103.1 |
96.9 |
102.7 |
101.6 |
99.4 |
95.2 |
97.9 |
D.2.2.4 IIP - Leather and Leather & Fur Products |
|
2009-10 |
87.4 |
108.8 |
108.3 |
110.5 |
101.4 |
97.1 |
93.5 |
97.9 |
|
Average |
94.2 |
100.0 |
105.4 |
107.9 |
103.5 |
97.2 |
94.7 |
101.0 |
|
2010-11 |
87.1 |
108.8 |
108.4 |
110.8 |
101.4 |
96.8 |
93.3 |
97.8 |
Table 1: Monthly Seasonal Factors of Selected Economic Time Series (April-March) (Contd.) |
|
Year |
Dec. |
Jan. |
Feb. |
Mar. |
Peak
Month |
Peak
Value |
Trough
Month |
Trough
Value |
1 |
2 |
11 |
12 |
13 |
14 |
15 |
16 |
17 |
18 |
D.1.3 IIP - Intermediate Goods Industries |
|
2009-10 |
98.5 |
99.6 |
99.9 |
101.4 |
Apr |
101.7 |
Dec |
98.5 |
|
Average |
98.9 |
99.2 |
99.3 |
100.9 |
Apr |
101.5 |
Dec |
98.9 |
|
2010-11 |
100.1 |
98.3 |
95.4 |
104.7 |
Mar |
104.7 |
Feb |
95.4 |
D.1.4 IIP - Consumer Goods Industries |
|
2009-10 |
107.6 |
109.8 |
104.9 |
106.2 |
Jan |
109.8 |
Oct |
94.0 |
|
Average |
108.4 |
111.4 |
106.9 |
109.7 |
Jan |
111.4 |
Oct |
92.9 |
|
2010-11 |
107.9 |
109.8 |
105.0 |
106.3 |
Jan |
109.8 |
Oct |
93.8 |
D.1.4.1 IIP - Consumer Durable Goods Industries |
|
2009-10 |
92.5 |
97.4 |
99.3 |
105.3 |
Sep |
110.5 |
Dec |
92.5 |
|
Average |
98.0 |
101.6 |
100.0 |
109.5 |
Mar |
109.5 |
Apr |
93.3 |
|
2010-11 |
92.7 |
97.0 |
99.3 |
105.0 |
Sep |
110.8 |
Dec |
92.7 |
D.1.4.2 IIP - Consumer Non-Durable Goods Industries |
|
2009-10 |
114.0 |
113.0 |
107.0 |
106.8 |
Dec |
114.0 |
Oct |
89.8 |
|
Average |
112.2 |
114.4 |
109.3 |
110.1 |
Jan |
114.4 |
Oct |
90.1 |
|
2010-11 |
114.5 |
113.0 |
107.1 |
106.9 |
Dec |
114.5 |
Oct |
89.7 |
D.2.1 IIP - Mining |
|
2009-10 |
106.2 |
107.6 |
102.4 |
116.7 |
Mar |
116.7 |
Sep |
91.6 |
|
Average |
105.9 |
107.6 |
101.0 |
114.0 |
Mar |
114.0 |
Sep |
93.1 |
|
2010-11 |
106.3 |
107.5 |
102.4 |
116.5 |
Mar |
116.5 |
Sep |
91.8 |
D.2.2 IIP - Manufacturing |
|
2009-10 |
105.0 |
104.0 |
100.3 |
109.3 |
Mar |
109.3 |
Oct |
95.9 |
|
Average |
105.1 |
104.5 |
101.4 |
109.3 |
Mar |
109.3 |
Oct |
96.3 |
|
2010-11 |
105.1 |
104.0 |
100.5 |
109.1 |
Mar |
109.1 |
Oct |
95.8 |
D.2.2.1 IIP - Food Products |
|
2009-10 |
158.6 |
160.9 |
143.9 |
133.1 |
Jan |
160.9 |
Aug |
73.5 |
|
Average |
139.7 |
146.7 |
138.2 |
134.7 |
Jan |
146.7 |
Aug |
74.3 |
|
2010-11 |
159.0 |
161.5 |
144.0 |
131.7 |
Jan |
161.5 |
Aug |
73.9 |
D.2.2.2 IIP - Cotton Textiles |
|
2009-10 |
102.5 |
100.2 |
96.3 |
100.9 |
Dec |
102.5 |
Feb |
96.3 |
|
Average |
103.5 |
101.0 |
97.0 |
101.4 |
Dec |
103.5 |
Feb |
97.0 |
|
2010-11 |
102.5 |
100.3 |
96.4 |
100.8 |
Dec |
102.5 |
Feb |
96.4 |
D.2.2.3 IIP - Textile Products (including Wearing Apparel) |
|
2009-10 |
100.2 |
96.8 |
98.4 |
105.2 |
Mar |
105.2 |
Oct |
95.2 |
|
Average |
103.7 |
97.7 |
96.7 |
103.4 |
Dec |
103.7 |
Jun |
96.4 |
|
2010-11 |
99.9 |
96.7 |
98.4 |
105.6 |
Mar |
105.6 |
Oct |
95.2 |
D.2.2.4 IIP - Leather and Leather & Fur Products |
|
2009-10 |
109.4 |
101.8 |
94.5 |
92.8 |
Jul |
110.5 |
Apr |
87.4 |
|
Average |
106.4 |
99.3 |
97.1 |
94.2 |
Jul |
107.9 |
Apr |
94.2 |
|
2010-11 |
109.7 |
102.0 |
94.8 |
92.6 |
Jul |
110.8 |
Apr |
87.1 |
Table 1: Monthly Seasonal Factors of Selected Economic Time Series (April-March) (Contd.) |
|
Year |
Apr. |
May |
Jun. |
Jul. |
Aug. |
Sep. |
Oct. |
Nov. |
1 |
2 |
3 |
4 |
5 |
6 |
7 |
8 |
9 |
10 |
D.2.2.5 IIP - Basic Chemicals & Chemical Products (except products of Petroleum & Coal) |
|
2009-10 |
100.9 |
104.7 |
103.8 |
106.3 |
103.2 |
101.3 |
94.4 |
94.8 |
|
Average |
96.9 |
101.3 |
100.6 |
103.2 |
103.5 |
101.9 |
98.5 |
97.3 |
|
2010-11 |
100.8 |
104.2 |
103.9 |
106.4 |
103.2 |
100.9 |
94.3 |
94.7 |
D.2.2.6 IIP - Rubber, Plastic, Petroleum and Coal Products |
|
2009-10 |
97.8 |
102.6 |
101.7 |
101.3 |
98.8 |
97.3 |
95.7 |
97.9 |
|
Average |
97.2 |
103.5 |
101.0 |
101.3 |
99.5 |
98.5 |
97.3 |
97.3 |
|
2010-11 |
97.9 |
102.4 |
101.7 |
101.1 |
99.1 |
97.2 |
95.6 |
98.1 |
D.2.2.7 IIP - Non-metallic Mineral Products |
|
2009-10 |
99.8 |
101.6 |
100.2 |
100.4 |
96.6 |
96.7 |
97.7 |
95.1 |
|
Average |
100.2 |
103.0 |
99.9 |
98.7 |
97.2 |
95.9 |
98.2 |
95.7 |
|
2010-11 |
99.9 |
101.7 |
100.2 |
100.6 |
96.7 |
96.5 |
97.7 |
95.1 |
D.2.2.8 IIP - Basic Metal and Alloy Industries |
|
2009-10 |
95.8 |
98.4 |
97.4 |
99.8 |
100.7 |
99.7 |
102.2 |
98.7 |
|
Average |
96.3 |
98.6 |
97.1 |
99.6 |
100.1 |
98.8 |
101.2 |
99.2 |
|
2010-11 |
95.9 |
98.6 |
97.6 |
100.1 |
100.9 |
99.7 |
102.0 |
98.5 |
D.2.2.9 IIP - Metal Products & Parts (except Machinery & Equipments) |
|
2009-10 |
83.8 |
98.1 |
91.4 |
99.5 |
101.8 |
109.8 |
105.6 |
94.8 |
|
Average |
91.9 |
99.5 |
96.5 |
99.5 |
102.5 |
98.8 |
103.0 |
95.5 |
|
2010-11 |
83.4 |
98.3 |
91.0 |
99.8 |
100.9 |
110.2 |
105.4 |
95.0 |
D.2.2.10 IIP -Machinery & Equipment (other than Transport Equipment) |
|
2009-10 |
87.6 |
91.8 |
101.4 |
94.9 |
97.8 |
108.0 |
94.4 |
97.3 |
|
Average |
92.0 |
94.2 |
96.6 |
95.5 |
97.7 |
103.4 |
98.3 |
99.8 |
|
2010-11 |
87.9 |
90.5 |
101.5 |
95.1 |
97.4 |
108.4 |
94.1 |
97.2 |
D.2.2.11 IIP - Transport Equipment & Parts |
|
2009-10 |
94.8 |
99.3 |
97.1 |
100.6 |
101.5 |
103.5 |
103.1 |
97.7 |
|
Average |
91.0 |
98.5 |
97.5 |
99.5 |
98.5 |
103.5 |
99.7 |
98.4 |
|
2010-11 |
95.8 |
99.0 |
97.2 |
101.0 |
101.7 |
103.4 |
102.8 |
97.4 |
D.2.2.12 IIP - Other Manufacturing Industries |
|
2009-10 |
80.9 |
89.4 |
95.9 |
94.3 |
92.8 |
121.8 |
98.2 |
106.2 |
|
Average |
93.2 |
96.2 |
95.8 |
97.1 |
97.3 |
107.9 |
96.6 |
99.7 |
|
2010-11 |
79.9 |
88.8 |
96.4 |
94.3 |
92.5 |
123.2 |
99.1 |
106.1 |
D.2.3 IIP - Electricity |
|
2009-10 |
100.7 |
103.5 |
99.2 |
100.4 |
100.9 |
98.6 |
102.1 |
96.1 |
|
Average |
99.8 |
102.9 |
97.4 |
99.1 |
99.8 |
98.4 |
100.9 |
97.0 |
|
2010-11 |
100.8 |
103.2 |
99.3 |
100.5 |
101.0 |
98.7 |
102.1 |
96.1 |
Table 1: Monthly Seasonal Factors of Selected Economic Time Series (April-March) (Contd.) |
|
Year |
Dec. |
Jan. |
Feb. |
Mar. |
Peak
Month |
Peak
Value |
Trough
Month |
Trough
Value |
1 |
2 |
11 |
12 |
13 |
14 |
15 |
16 |
17 |
18 |
D.2.2.5 IIP - Basic Chemicals & Chemical Products (except products of Petroleum & Coal) |
|
2009-10 |
96.1 |
99.9 |
94.3 |
101.8 |
Jul |
106.3 |
Feb |
94.3 |
|
Average |
99.0 |
101.1 |
95.7 |
100.8 |
Aug |
103.5 |
Feb |
95.7 |
|
2010-11 |
96.3 |
100.0 |
94.7 |
101.8 |
Jul |
106.4 |
Oct |
94.3 |
D.2.2.6 IIP - Rubber, Plastic, Petroleum and Coal Products |
|
2009-10 |
102.3 |
101.6 |
97.3 |
106.3 |
Mar |
106.3 |
Oct |
95.7 |
|
Average |
101.3 |
100.6 |
97.1 |
106.0 |
Mar |
106.0 |
Feb |
97.1 |
|
2010-11 |
102.2 |
101.4 |
97.6 |
106.5 |
Mar |
106.5 |
Oct |
95.6 |
D.2.2.7 IIP - Non-metallic Mineral Products |
|
2009-10 |
103.6 |
101.6 |
97.6 |
109.7 |
Mar |
109.7 |
Nov |
95.1 |
|
Average |
102.1 |
100.8 |
99.4 |
109.9 |
Mar |
109.9 |
Nov |
95.7 |
|
2010-11 |
103.5 |
101.8 |
97.7 |
109.5 |
Mar |
109.5 |
Nov |
95.1 |
D.2.2.8 IIP - Basic Metal and Alloy Industries |
|
2009-10 |
101.1 |
101.1 |
97.1 |
107.9 |
Mar |
107.9 |
Apr |
95.8 |
|
Average |
102.3 |
102.7 |
97.5 |
106.9 |
Mar |
106.9 |
Apr |
96.3 |
|
2010-11 |
100.9 |
101.0 |
97.2 |
107.8 |
Mar |
107.8 |
Apr |
95.9 |
D.2.2.9 IIP - Metal Products & Parts (except Machinery & Equipments) |
|
2009-10 |
105.3 |
114.0 |
83.7 |
112.7 |
Jan |
114.0 |
Feb |
83.7 |
|
Average |
109.3 |
106.5 |
86.5 |
110.8 |
Mar |
110.8 |
Feb |
86.5 |
|
2010-11 |
105.9 |
114.7 |
83.4 |
112.5 |
Jan |
114.7 |
Apr |
83.4 |
D.2.2.10 IIP -Machinery & Equipment (other than Transport Equipment) |
|
2009-10 |
104.1 |
104.2 |
102.4 |
121.0 |
Mar |
121.0 |
Apr |
87.6 |
|
Average |
104.3 |
102.1 |
101.4 |
117.0 |
Mar |
117.0 |
Apr |
92.0 |
|
2010-11 |
104.2 |
104.4 |
102.9 |
121.0 |
Mar |
121.0 |
Apr |
87.9 |
D.2.2.11 IIP - Transport Equipment & Parts |
|
2009-10 |
92.9 |
101.2 |
98.2 |
110.3 |
Mar |
110.3 |
Dec |
92.9 |
|
Average |
97.0 |
102.1 |
101.9 |
113.5 |
Mar |
113.5 |
Apr |
91.0 |
|
2010-11 |
93.1 |
101.0 |
98.1 |
110.0 |
Mar |
110.0 |
Dec |
93.1 |
D.2.2.12 IIP - Other Manufacturing Industries |
|
2009-10 |
130.1 |
90.1 |
92.9 |
119.6 |
Dec |
130.1 |
Apr |
80.9 |
|
Average |
108.9 |
95.0 |
98.9 |
118.4 |
Mar |
118.4 |
Apr |
93.2 |
|
2010-11 |
130.4 |
89.7 |
92.8 |
119.3 |
Dec |
130.4 |
Apr |
79.9 |
D.2.3 IIP - Electricity |
|
2009-10 |
99.3 |
100.9 |
94.2 |
104.6 |
Mar |
104.6 |
Feb |
94.2 |
|
Average |
102.0 |
102.8 |
94.9 |
105.2 |
Mar |
105.2 |
Feb |
94.9 |
|
2010-11 |
99.1 |
100.7 |
94.2 |
104.8 |
Mar |
104.8 |
Feb |
94.2 |
Table 1: Monthly Seasonal Factors of Selected Economic Time Series (April-March) (Contd.) |
|
Year |
Apr |
May |
Jun. |
Jul. |
Aug. |
Sep. |
Oct. |
Nov. |
1 |
2 |
3 |
4 |
5 |
6 |
7 |
8 |
9 |
10 |
D.3 Cement Production |
|
2009-10 |
104.6 |
103.5 |
100.7 |
97.4 |
91.8 |
92.5 |
97.6 |
94.0 |
|
Average |
104.3 |
105.0 |
102.5 |
96.6 |
91.6 |
91.4 |
97.2 |
94.6 |
|
2010-11 |
104.7 |
103.5 |
100.7 |
97.5 |
91.8 |
92.5 |
97.4 |
93.9 |
D.4 Steel Production |
|
2009-10 |
97.4 |
101.0 |
97.0 |
98.9 |
100.7 |
99.9 |
101.1 |
97.9 |
|
Average |
96.5 |
98.3 |
96.3 |
98.8 |
100.2 |
98.4 |
100.6 |
98.8 |
|
2010-11 |
97.4 |
101.5 |
97.4 |
99.1 |
100.8 |
100.0 |
100.7 |
97.7 |
D.5 Production of Commercial Motor Vehicles |
|
2009-10 |
95.2 |
96.5 |
95.5 |
103.4 |
106.6 |
106.3 |
97.8 |
91.9 |
|
Average |
84.1 |
94.6 |
96.0 |
97.9 |
95.8 |
99.7 |
98.9 |
98.4 |
|
2010-11 |
96.4 |
96.2 |
97.1 |
104.1 |
107.6 |
106.6 |
97.5 |
90.7 |
E.1 Cargo handled at Major Ports |
|
2009-10 |
100.0 |
102.3 |
94.5 |
97.1 |
96.7 |
92.1 |
99.5 |
101.2 |
|
Average |
99.4 |
101.3 |
93.5 |
97.5 |
95.6 |
93.8 |
100.9 |
99.8 |
|
2010-11 |
100.3 |
102.0 |
94.8 |
97.2 |
96.9 |
92.0 |
99.3 |
101.0 |
E.2 Revenue on Railway Freight Traffic |
|
2009-10 |
97.8 |
100.5 |
97.0 |
97.4 |
95.8 |
93.5 |
97.9 |
97.8 |
|
Average |
95.6 |
99.9 |
96.8 |
97.6 |
95.5 |
93.4 |
98.8 |
99.0 |
|
2010-11 |
97.7 |
100.4 |
97.0 |
97.6 |
95.9 |
93.7 |
98.0 |
97.7 |
F.1 Exports* |
|
2009-10 |
100.5 |
100.4 |
103.8 |
104.5 |
101.6 |
99.4 |
96.1 |
91.6 |
|
Average |
98.4 |
98.1 |
97.1 |
99.6 |
99.8 |
100.4 |
98.9 |
93.7 |
|
2010-11 |
101.2 |
99.7 |
104.1 |
104.9 |
101.6 |
99.4 |
96.4 |
91.5 |
F.2 Imports* |
|
2009-10 |
99.5 |
105.0 |
102.8 |
107.7 |
105.5 |
109.8 |
105.9 |
100.1 |
|
Average |
96.3 |
105.3 |
97.2 |
102.5 |
99.4 |
103.1 |
103.2 |
98.5 |
|
2010-11 |
99.8 |
104.0 |
102.9 |
108.1 |
106.0 |
109.8 |
105.8 |
100.2 |
F.2.1 Non-Oil Imports* |
|
2009-10 |
98.3 |
103.4 |
101.0 |
105.7 |
97.1 |
102.2 |
103.7 |
104.8 |
|
Average |
97.0 |
104.6 |
95.9 |
104.1 |
96.6 |
100.4 |
102.3 |
100.3 |
|
2010-11 |
98.1 |
102.7 |
101.3 |
105.6 |
97.5 |
102.5 |
102.7 |
105.4 |
Table 1: Monthly Seasonal Factors of Selected Economic Time Series (April-March) (Concld.) |
|
Year |
Dec. |
Jan. |
Feb. |
Mar. |
Peak
Month |
Peak
Value |
Trough
Month |
Trough
Value |
1 |
2 |
11 |
12 |
13 |
14 |
15 |
16 |
17 |
18 |
D.3 Cement Production |
|
2009-10 |
102.2 |
104.7 |
100.5 |
112.6 |
Mar |
112.6 |
Aug |
91.8 |
|
Average |
100.3 |
103.7 |
100.9 |
114.1 |
Mar |
114.1 |
Sep |
91.4 |
|
2010-11 |
102.2 |
104.6 |
100.7 |
112.6 |
Mar |
112.6 |
Aug |
91.8 |
D.4 Steel Production |
|
2009-10 |
99.2 |
101.8 |
96.5 |
108.4 |
Mar |
108.4 |
Feb |
96.5 |
|
Average |
102.4 |
103.2 |
97.4 |
109.5 |
Mar |
109.5 |
Jun |
96.3 |
|
2010-11 |
98.8 |
101.9 |
96.5 |
108.3 |
Mar |
108.3 |
Feb |
96.5 |
D.5 Production of Commercial Motor Vehicles |
|
2009-10 |
90.9 |
98.5 |
101.1 |
116.7 |
Mar |
116.7 |
Dec |
90.9 |
|
Average |
101.1 |
109.6 |
105.8 |
123.2 |
Mar |
123.2 |
Apr |
84.1 |
|
2010-11 |
90.3 |
97.6 |
101.3 |
117.1 |
Mar |
117.1 |
Dec |
90.3 |
E.1 Cargo handled at Major Ports |
|
2009-10 |
104.1 |
105.9 |
98.2 |
109.5 |
Mar |
109.5 |
Sep |
92.1 |
|
Average |
104.6 |
105.3 |
98.9 |
110.7 |
Mar |
110.7 |
Jun |
93.5 |
|
2010-11 |
104.1 |
106.0 |
98.2 |
109.4 |
Mar |
109.4 |
Sep |
92.0 |
E.2 Revenue on Railway Freight Traffic |
|
2009-10 |
104.3 |
106.1 |
99.1 |
114.2 |
Mar |
114.2 |
Sep |
93.5 |
|
Average |
104.5 |
105.9 |
99.5 |
115.2 |
Mar |
115.2 |
Sep |
93.4 |
|
2010-11 |
104.4 |
106.1 |
99.0 |
114.1 |
Mar |
114.1 |
Sep |
93.7 |
F.1 Exports* |
|
2009-10 |
99.7 |
97.7 |
95.8 |
109.4 |
Mar |
109.4 |
Nov |
91.6 |
|
Average |
98.8 |
100.4 |
98.4 |
117.6 |
Mar |
117.6 |
Nov |
93.7 |
|
2010-11 |
99.8 |
97.6 |
96.0 |
108.9 |
Mar |
108.9 |
Nov |
91.5 |
F.2 Imports* |
|
2009-10 |
93.9 |
92.9 |
85.6 |
94.0 |
Sep |
109.8 |
Feb |
85.6 |
|
Average |
98.8 |
99.6 |
92.2 |
103.7 |
May |
105.3 |
Feb |
92.2 |
|
2010-11 |
94.2 |
92.4 |
85.8 |
94.0 |
Sep |
109.8 |
Feb |
85.8 |
F.2.1 Non-Oil Imports* |
|
2009-10 |
99.9 |
96.3 |
87.1 |
100.8 |
Jul |
105.7 |
Feb |
87.1 |
|
Average |
101.5 |
98.1 |
94.3 |
104.4 |
May |
104.6 |
Feb |
94.3 |
|
2010-11 |
100.3 |
96.2 |
87.2 |
100.7 |
Jul |
105.6 |
Feb |
87.2 |
* Valued in US Dollar.
Notes: 1. Average figures relate to the sample period of 1994-95 to 2009-10.
2. Figures for 2010-11 are the forecasts of seasonal factors. |
Table 2: Range (Difference Between Peak and Trough) of Seasonal Factors |
Year |
1994-95 |
1995-96 |
1996-97 |
1997-98 |
1998-99 |
1999-00 |
2000-01 |
2001-02 |
2002-03 |
1 |
2 |
3 |
4 |
5 |
6 |
7 |
8 |
9 |
10 |
A.1.1 |
Broad Money (M3 ) |
2.5 |
2.5 |
2.5 |
2.4 |
2.2 |
2.1 |
2.1 |
2.2 |
2.4 |
A.1.1.1 |
Net Bank Credit to Government |
5.2 |
5.1 |
4.9 |
4.6 |
4.3 |
4.1 |
3.8 |
3.7 |
3.9 |
A.1.1.2 |
Bank Credit to Commercial Sector |
5.7 |
5.6 |
5.4 |
4.9 |
4.3 |
3.7 |
3.2 |
2.9 |
3.0 |
A.1.2 |
Narrow Money (M1) |
5.3 |
5.4 |
5.4 |
5.4 |
5.4 |
5.3 |
5.4 |
5.5 |
5.4 |
A.1.2.1 |
Currency with Public |
10.2 |
10.1 |
9.9 |
9.6 |
9.2 |
8.8 |
8.3 |
7.8 |
7.4 |
A.1.3 |
Reserve Money (M0 ) |
7.2 |
6.9 |
6.6 |
6.5 |
6.4 |
6.1 |
6.1 |
6.0 |
6.5 |
A.1.3.1 |
Currency in Circulation |
10.2 |
10.1 |
9.9 |
9.6 |
9.2 |
8.8 |
8.3 |
7.9 |
7.5 |
A.1.3.1.1 |
Notes in Circulation |
10.1 |
10.0 |
9.9 |
9.7 |
9.4 |
9.0 |
8.5 |
8.0 |
7.6 |
A.2.1 |
Deposits (Banking Department) |
12.2 |
12.3 |
13.0 |
13.2 |
13.0 |
12.3 |
13.4 |
14.0 |
13.8 |
A.2.2 |
Liabilities to the Banking System (SCBs) |
12.9 |
12.1 |
10.6 |
8.9 |
7.4 |
7.6 |
7.8 |
7.1 |
7.2 |
A.2.3 |
Aggregate Deposits (SCBs) |
2.9 |
2.9 |
2.7 |
2.3 |
1.8 |
1.7 |
1.8 |
2.0 |
2.1 |
A.2.3.1 |
Demand Deposits (SCBs) |
14.6 |
14.2 |
13.3 |
11.5 |
9.7 |
8.0 |
7.2 |
7.1 |
7.9 |
A.2.3.2 |
Time Deposits (SCBs) |
1.5 |
1.5 |
1.5 |
1.4 |
1.4 |
1.7 |
2.0 |
2.2 |
2.4 |
A.3.1 |
Balances held Abroad |
12.0 |
12.8 |
14.0 |
15.1 |
15.9 |
16.6 |
15.9 |
13.8 |
11.1 |
A.3.2 |
Investments (RBI) |
36.2 |
36.3 |
36.2 |
34.6 |
32.4 |
31.5 |
30.9 |
28.7 |
27.3 |
A.3.3 |
Cash in Hand and Balances with RBI (SCBs) |
11.9 |
11.5 |
10.6 |
10.3 |
10.0 |
9.8 |
10.4 |
10.9 |
10.6 |
A.3.4 |
Assets with the Banking System (SCBs) |
17.0 |
15.7 |
15.7 |
15.0 |
13.8 |
12.7 |
12.2 |
11.1 |
10.2 |
A.3.5 |
Bank Credit (SCBs) |
6.7 |
6.6 |
6.3 |
5.6 |
4.7 |
3.5 |
2.9 |
2.7 |
2.7 |
A.3.5.1 |
Loans, Cash, Credits and Overdrafts (SCBs) Overdrafts (SCBs) |
6.3 |
6.1 |
5.8 |
5.1 |
4.2 |
3.3 |
2.4 |
1.9 |
1.7 |
A.3.5.2 |
Food Credit (SCBs) |
23.1 |
22.7 |
21.8 |
20.4 |
19.0 |
18.5 |
17.6 |
16.4 |
15.4 |
A.3.5.3 |
Non-Food Credit (SCBs) |
7.6 |
7.4 |
7.0 |
6.3 |
5.2 |
4.1 |
3.7 |
3.5 |
3.5 |
A.3.6 |
Investments (SCBs) |
4.1 |
4.3 |
4.5 |
4.5 |
4.3 |
4.0 |
3.6 |
3.2 |
3.0 |
B. |
WPI (Base: 1993-94=100) All Commodities |
1.8 |
1.7 |
1.5 |
1.3 |
1.2 |
1.3 |
1.3 |
1.2 |
1.2 |
B.1 |
WPI - Primary Articles |
4.5 |
4.5 |
4.4 |
4.2 |
3.9 |
3.7 |
3.6 |
3.3 |
3.2 |
B.1.1 |
WPI - Food Articles |
5.6 |
5.6 |
5.4 |
5.0 |
4.5 |
4.5 |
4.3 |
4.0 |
3.8 |
B.1.1.1 |
WPI - Food Grains(Cereals+Pulses) |
2.0 |
2.0 |
2.0 |
2.0 |
1.9 |
1.8 |
1.8 |
1.6 |
1.5 |
Table 2: Range (Difference Between Peak and Trough) of Seasonal Factors (Contd.) |
Year |
2003-04 |
2004-05 |
2005-06 |
2006-07 |
2007-08 |
2008-09 |
2009-10 |
Average
Range |
Standard
Deviation |
1 |
11 |
12 |
13 |
14 |
15 |
16 |
17 |
18 |
19 |
A.1.1 |
Broad Money (M3 ) |
2.7 |
3.0 |
3.2 |
3.2 |
3.3 |
3.2 |
3.2 |
2.7 |
0.4 |
A.1.1.1 |
Net Bank Credit to Government |
4.1 |
4.4 |
4.9 |
5.3 |
5.7 |
5.9 |
6.0 |
4.7 |
0.7 |
A.1.1.2 |
Bank Credit to Commercial Sector |
3.3 |
3.7 |
4.0 |
4.2 |
4.3 |
4.3 |
4.2 |
4.2 |
0.9 |
A.1.2 |
Narrow Money (M1) |
5.5 |
5.6 |
6.1 |
6.5 |
6.9 |
7.2 |
7.3 |
5.8 |
0.7 |
A.1.2.1 |
Currency with Public |
7.1 |
7.0 |
7.0 |
7.1 |
7.1 |
7.2 |
7.1 |
8.2 |
1.3 |
A.1.3 |
Reserve Money (M0 ) |
6.8 |
6.7 |
6.5 |
6.6 |
6.5 |
6.6 |
7.2 |
6.6 |
0.3 |
A.1.3.1 |
Currency in Circulation |
7.2 |
7.1 |
7.0 |
7.0 |
6.9 |
6.9 |
6.9 |
8.2 |
1.3 |
A.1.3.1.1 |
Notes in Circulation |
7.3 |
7.2 |
7.1 |
7.1 |
7.0 |
6.9 |
6.8 |
8.2 |
1.3 |
A.2.1 |
Deposits (Banking Department) |
12.3 |
12.5 |
12.9 |
12.5 |
13.3 |
13.0 |
13.7 |
13.0 |
0.6 |
A.2.2 |
Liabilities to the Banking System (SCBs) |
7.9 |
7.7 |
7.4 |
8.6 |
10.1 |
10.7 |
10.3 |
9.0 |
1.9 |
A.2.3 |
Aggregate Deposits (SCBs) |
2.4 |
2.6 |
2.6 |
2.5 |
2.5 |
2.6 |
2.7 |
2.4 |
0.4 |
A.2.3.1 |
Demand Deposits (SCBs) |
9.5 |
11.6 |
13.0 |
13.7 |
13.3 |
12.6 |
11.9 |
11.2 |
2.6 |
A.2.3.2 |
Time Deposits (SCBs) |
2.3 |
2.1 |
2.4 |
2.6 |
2.7 |
2.7 |
2.8 |
2.1 |
0.5 |
A.3.1 |
Balances held Abroad |
9.4 |
7.7 |
6.7 |
7.9 |
9.2 |
10.6 |
11.2 |
11.9 |
3.2 |
A.3.2 |
Investments (RBI) |
27.4 |
35.2 |
46.1 |
54.1 |
53.9 |
50.0 |
45.8 |
37.9 |
9.1 |
A.3.3 |
Cash in Hand and Balances with RBI (SCBs) |
10.1 |
8.6 |
7.6 |
10.3 |
12.9 |
14.3 |
14.7 |
10.9 |
1.9 |
A.3.4 |
Assets with the Banking System (SCBs) |
10.0 |
11.6 |
12.5 |
13.7 |
15.4 |
15.9 |
15.2 |
13.6 |
2.2 |
A.3.5 |
Bank Credit (SCBs) |
3.2 |
3.9 |
4.4 |
4.6 |
4.7 |
4.5 |
4.1 |
4.4 |
1.3 |
A.3.5.1 |
Loans, Cash, Credits and Overdrafts (SCBs) |
2.2 |
2.8 |
3.5 |
4.0 |
4.3 |
4.3 |
4.2 |
3.9 |
1.5 |
A.3.5.2 |
Food Credit (SCBs) |
16.0 |
16.9 |
18.1 |
19.1 |
20.0 |
20.4 |
20.6 |
19.1 |
2.3 |
A.3.5.3 |
Non-Food Credit (SCBs) |
3.6 |
4.2 |
4.8 |
5.0 |
5.0 |
4.7 |
4.2 |
5.0 |
1.4 |
A.3.6 |
Investments (SCBs) |
3.1 |
3.1 |
3.1 |
3.0 |
2.9 |
2.8 |
2.9 |
3.5 |
0.6 |
B. |
WPI (Base 1993-94=100) All Commodities |
1.4 |
1.7 |
2.1 |
2.3 |
2.6 |
2.7 |
2.8 |
1.8 |
0.6 |
B.1 |
WPI - Primary Articles |
3.3 |
3.4 |
3.6 |
3.5 |
3.3 |
3.1 |
3.1 |
3.7 |
0.5 |
B.1.1 |
WPI - Food Articles |
3.9 |
4.2 |
4.3 |
4.3 |
4.2 |
4.1 |
4.0 |
4.5 |
0.6 |
B.1.1.1 |
WPI - Food Grains (Cereals+Pulses) |
1.5 |
1.4 |
1.4 |
1.5 |
1.7 |
2.0 |
2.1 |
1.8 |
0.2 |
Table 2: Range (Difference Between Peak and Trough) of Seasonal Factors (Contd.) |
Year |
1994-95 |
1995-96 |
1996-97 |
1997-98 |
1998-99 |
1999-00 |
2000-01 |
2001-02 |
2002-03 |
1 |
2 |
3 |
4 |
5 |
6 |
7 |
8 |
9 |
10 |
B.1.1.1.1 |
WPI - Cereals |
2.3 |
2.3 |
2.4 |
2.3 |
2.1 |
2.0 |
1.8 |
1.5 |
1.2 |
B.1.1.1.1.1 |
WPI - Wheat |
8.8 |
8.9 |
9.0 |
8.7 |
8.1 |
7.1 |
6.1 |
5.5 |
5.4 |
B.1.1.1.1.2 |
WPI - Rice |
4.7 |
4.7 |
4.7 |
4.6 |
4.5 |
4.3 |
4.0 |
3.7 |
3.4 |
B.1.1.1.2 |
WPI - Pulses |
4.4 |
4.6 |
5.0 |
5.4 |
6.0 |
6.4 |
6.5 |
6.0 |
5.3 |
B.1.1.2 |
WPI - Fruits & Vegetables |
20.0 |
20.8 |
22.1 |
22.6 |
22.5 |
21.6 |
20.7 |
19.2 |
18.5 |
B.1.1.2.1 |
WPI - Potatoes |
56.6 |
56.8 |
56.8 |
55.4 |
54.0 |
53.1 |
52.1 |
48.6 |
46.5 |
B.1.1.2.1 |
WPI - Onions |
58.4 |
59.4 |
59.4 |
58.9 |
57.6 |
58.3 |
56.9 |
53.7 |
49.6 |
B.1.1.2.1 |
WPI - Milk |
5.3 |
5.4 |
5.6 |
5.8 |
5.6 |
5.0 |
4.0 |
3.1 |
2.3 |
B.1.2 |
WPI - Non-Food Articles |
2.2 |
2.3 |
2.5 |
2.8 |
2.9 |
3.0 |
2.8 |
2.8 |
2.7 |
B.1.2.1 |
WPI - Fibres |
2.6 |
2.5 |
2.3 |
2.4 |
3.0 |
3.6 |
4.4 |
5.1 |
5.3 |
B.1.2.1.1 |
WPI - Raw Cotton |
4.2 |
4.1 |
4.3 |
4.5 |
4.8 |
4.7 |
5.1 |
5.7 |
6.1 |
B.1.2.2 |
WPI - Oil Seeds |
6.5 |
6.5 |
6.4 |
6.4 |
6.1 |
5.8 |
5.4 |
5.3 |
4.9 |
B.2 |
WPI - Manufactured Products |
0.6 |
0.6 |
0.6 |
0.6 |
0.6 |
0.6 |
0.5 |
0.6 |
0.8 |
B.2.1 |
WPI - Food Products |
2.2 |
2.1 |
1.9 |
1.8 |
1.7 |
1.7 |
1.8 |
1.8 |
2.0 |
B.2.1.1 |
WPI - Grain Mill Products |
10.2 |
10.1 |
9.8 |
9.3 |
8.6 |
8.0 |
7.4 |
7.0 |
6.8 |
B.2.1.2 |
WPI - Sugar |
2.1 |
2.0 |
1.9 |
1.8 |
1.7 |
1.5 |
1.7 |
1.8 |
1.6 |
B.2.1.3 |
WPI - Edible Oils |
3.2 |
3.2 |
3.2 |
3.1 |
3.1 |
3.2 |
3.3 |
3.4 |
3.0 |
C.1 |
Consumer Price Index for Industrial Workers (2001=100) |
2.2 |
2.2 |
2.3 |
2.3 |
2.4 |
2.4 |
2.3 |
2.1 |
1.9 |
C.2 |
Consumer Price Index for Urban Non-Manual Employees (Base: 1984-85=100) |
2.3 |
2.3 |
2.2 |
2.3 |
2.3 |
2.2 |
2.1 |
1.9 |
1.7 |
C.3 |
Consumer Price Index for Agricultural Labourers (Base: 1986-87=100) |
|
|
3.0 |
2.9 |
2.9 |
2.8 |
2.6 |
2.4 |
2.2 |
C.4 |
Consumer Price Index for Rural Labourers (Base: 1986-87=100) |
|
|
2.9 |
2.9 |
2.8 |
2.8 |
2.6 |
2.3 |
2.0 |
D. |
IIP - General Index |
14.8 |
14.4 |
14.0 |
13.5 |
13.0 |
12.5 |
12.3 |
12.2 |
12.1 |
D.1.1 |
IIP - Basic Goods Industries |
13.8 |
13.5 |
13.1 |
12.9 |
12.3 |
11.4 |
10.6 |
10.0 |
10.1 |
D.1.2 |
IIP - Capital Goods Industries |
34.5 |
33.5 |
31.6 |
28.9 |
26.3 |
25.4 |
26.5 |
29.1 |
33.3 |
D.1.3 |
IIP - Intermediate Goods Industries |
2.5 |
2.5 |
2.5 |
2.4 |
2.2 |
2.1 |
2.1 |
2.2 |
2.3 |
D.1.4 |
IIP - Consumer Goods Industries |
22.6 |
22.7 |
23.0 |
23.2 |
22.9 |
21.8 |
20.3 |
20.9 |
21.1 |
D.1.4.1 |
IIP - Consumer Durable Goods Industries |
19.3 |
19.6 |
19.9 |
20.0 |
19.6 |
18.8 |
17.4 |
15.7 |
14.3 |
D.1.4.1 |
IIP - Consumer Non-Durable Goods Industries |
23.6 |
23.6 |
23.8 |
24.0 |
25.0 |
26.2 |
26.8 |
26.7 |
26.4 |
Table 2: Range (Difference Between Peak and Trough) of Seasonal Factors (Contd.) |
Year |
2003-04 |
2004-05 |
2005-06 |
2006-07 |
2007-08 |
2008-09 |
2009-10 |
Average
Range |
Standard
Deviation |
1 |
11 |
12 |
13 |
14 |
15 |
16 |
17 |
18 |
19 |
B.1.1.1.1 WPI - Cereals |
1.2 |
1.3 |
1.6 |
1.7 |
1.8 |
2.0 |
2.1 |
1.8 |
0.4 |
B.1.1.1.1.1 WPI - Wheat |
5.7 |
6.0 |
6.1 |
6.0 |
5.8 |
5.6 |
5.5 |
6.8 |
1.4 |
B.1.1.1.1.2 WPI - Rice |
3.0 |
2.6 |
2.0 |
1.4 |
0.9 |
1.0 |
1.2 |
3.2 |
1.5 |
B.1.1.1.2 WPI - Pulses |
5.1 |
5.3 |
5.3 |
5.3 |
5.2 |
5.2 |
5.2 |
5.4 |
0.6 |
B.1.1.2 WPI - Fruits & Vegetables |
18.6 |
18.3 |
17.7 |
16.8 |
16.7 |
16.6 |
16.3 |
19.3 |
2.2 |
B.1.1.2.1 WPI - Potatoes |
46.6 |
46.6 |
46.7 |
46.4 |
47.1 |
47.4 |
48.2 |
50.6 |
4.2 |
B.1.1.2.1 WPI - Onions |
46.2 |
43.5 |
41.3 |
40.7 |
40.6 |
41.2 |
41.7 |
50.5 |
8.0 |
B.1.1.2.1 WPI - Milk |
1.6 |
1.3 |
1.2 |
1.1 |
0.9 |
0.7 |
0.6 |
3.1 |
2.1 |
B.1.2 WPI - Non-Food Articles |
2.7 |
2.8 |
3.0 |
3.4 |
3.6 |
3.8 |
3.8 |
2.9 |
0.5 |
B.1.2.1 WPI - Fibres |
5.3 |
5.2 |
5.9 |
6.3 |
6.7 |
6.4 |
6.4 |
4.6 |
1.6 |
B.1.2.1.1 WPI - Raw Cotton |
6.3 |
6.7 |
7.5 |
7.8 |
8.1 |
7.8 |
7.6 |
6.0 |
1.5 |
B.1.2.2 WPI - Oil Seeds |
4.4 |
4.0 |
4.0 |
4.2 |
4.1 |
4.1 |
3.9 |
5.1 |
1.0 |
B.2 WPI - Manufactured Products |
0.9 |
1.1 |
1.4 |
1.6 |
1.7 |
1.9 |
1.9 |
1.0 |
0.5 |
B.2.1 WPI - Food Products |
2.0 |
1.8 |
1.5 |
1.4 |
1.3 |
1.2 |
1.2 |
1.7 |
0.3 |
B.2.1.1 WPI - Grain Mill Products |
6.6 |
6.6 |
6.4 |
6.1 |
5.6 |
5.1 |
4.4 |
7.4 |
1.8 |
B.2.1.2 WPI - Sugar |
1.8 |
1.9 |
1.9 |
1.8 |
2.0 |
2.1 |
2.3 |
1.9 |
0.2 |
B.2.1.3 WPI - Edible Oils |
2.6 |
1.9 |
1.6 |
1.5 |
1.6 |
1.5 |
1.6 |
2.6 |
0.8 |
C.1 Consumer Price Index for Industrial Workers(2001=100) |
1.8 |
1.8 |
2.0 |
2.1 |
2.2 |
2.2 |
2.2 |
2.2 |
0.2 |
C.2 Consumer Price Index for Urban Non-Manual Employees(Base: 1984-85=100) |
1.6 |
1.6 |
1.8 |
1.9 |
2.1 |
2.2 |
2.3 |
2.0 |
0.3 |
C.3 Consumer Price Index for Agricultural Labourers (Base: 1986-87=100) |
2.1 |
2.1 |
2.2 |
2.3 |
2.4 |
2.5 |
2.6 |
2.5 |
0.3 |
C.4 Consumer Price Index for Rural Labourers (Base: 1986-87=100) |
1.9 |
1.9 |
2.0 |
2.2 |
2.3 |
2.4 |
2.5 |
2.4 |
0.4 |
D. IIP - General Index |
12.1 |
12.5 |
13.2 |
13.6 |
13.5 |
13.2 |
12.8 |
13.1 |
0.8 |
D.1.1 IIP - Basic Goods Industries |
10.4 |
10.6 |
11.1 |
11.4 |
11.3 |
11.1 |
10.8 |
11.5 |
1.2 |
D.1.2 IIP - Capital Goods Industries |
37.8 |
42.2 |
45.6 |
47.6 |
47.9 |
47.4 |
46.4 |
36.5 |
8.4 |
D.1.3 IIP - Intermediate Goods Industries |
2.6 |
2.9 |
3.2 |
3.3 |
3.3 |
3.2 |
3.1 |
2.7 |
0.4 |
D.1.4 IIP - Consumer Goods Industries |
20.6 |
19.7 |
18.7 |
17.4 |
16.1 |
15.8 |
15.8 |
20.2 |
2.7 |
D.1.4.1 IIP - Consumer Durable Goods Industries |
14.4 |
16.6 |
17.9 |
18.2 |
17.9 |
17.9 |
18.0 |
17.9 |
1.8 |
D.1.4.1 IIP - Consumer Non-Durable Goods Industries |
25.6 |
24.4 |
24.0 |
23.8 |
23.6 |
23.4 |
24.3 |
24.7 |
1.2 |
Table 2: Range (Difference Between Peak and Trough) of Seasonal Factors (Contd.) |
Year |
1994-95 |
1995-96 |
1996-97 |
1997-98 |
1998-99 |
1999-00 |
2000-01 |
2001-02 |
2002-03 |
1 |
2 |
3 |
4 |
5 |
6 |
7 |
8 |
9 |
10 |
D.2.1 |
IIP - Mining |
20.9 |
20.7 |
20.2 |
19.3 |
18.6 |
18.0 |
17.3 |
17.3 |
18.2 |
D.2.2 |
IIP - Manufacturing |
15.4 |
15.0 |
14.5 |
14.0 |
13.4 |
12.9 |
12.4 |
12.1 |
12.1 |
D.2.2.1 |
IIP - Food Products |
64.4 |
64.3 |
64.4 |
64.5 |
66.7 |
69.9 |
72.0 |
72.5 |
73.0 |
D.2.2.2 |
IIP - Cotton Textiles |
7.0 |
6.9 |
6.6 |
6.6 |
6.6 |
6.8 |
6.9 |
6.9 |
6.6 |
D.2.2.3 |
IIP - Textile Products (including Wearing Apparel) |
11.9 |
11.5 |
11.2 |
10.6 |
9.7 |
8.5 |
7.6 |
7.4 |
8.0 |
D.2.2.4 |
IIP - Leather and Leather & Fur Products |
15.5 |
15.2 |
14.3 |
12.2 |
13.3 |
14.5 |
15.6 |
15.6 |
15.0 |
D.2.2.5 |
IIP - Basic Chemicals & Chemical Products (except products of Petroleum & Coal) |
6.3 |
6.3 |
6.6 |
7.1 |
7.4 |
7.6 |
7.9 |
8.6 |
9.4 |
D.2.2.6 |
IIP - Rubber, Plastic, Petroleum and Coal Products |
8.4 |
8.8 |
9.1 |
9.2 |
9.2 |
9.5 |
9.4 |
9.3 |
8.9 |
D.2.2.7 |
IIP - Non-metallic Mineral Products |
14.2 |
14.1 |
13.6 |
14.3 |
15.4 |
16.4 |
16.1 |
15.4 |
14.5 |
D.2.2.8 |
IIP - Basic Metal and Alloy Industries |
13.4 |
13.2 |
12.8 |
12.1 |
11.0 |
9.6 |
8.3 |
7.3 |
7.4 |
D.2.2.9 |
IIP - Metal Products & Parts (except Machinery & Equipments) |
24.8 |
23.8 |
23.1 |
23.7 |
24.2 |
25.6 |
26.6 |
27.2 |
25.7 |
D.2.2.10 |
IIP -Machinery & Equipment (other than Transport Equipment) |
25.1 |
24.3 |
23.1 |
21.4 |
19.4 |
18.2 |
18.4 |
19.7 |
21.8 |
D.2.2.11 |
IIP - Transport Equipment & Parts |
27.0 |
27.0 |
27.0 |
26.8 |
26.5 |
25.5 |
24.3 |
23.0 |
21.7 |
D.2.2.12 |
IIP - Other Manufacturing Industries |
23.8 |
22.1 |
19.7 |
19.8 |
19.8 |
19.6 |
19.3 |
20.2 |
22.5 |
D.2.3 |
IIP - Electricity |
9.5 |
9.3 |
9.5 |
10.0 |
10.4 |
10.9 |
11.1 |
11.5 |
11.4 |
D.3 |
Cement Production |
21.3 |
22.0 |
23.3 |
25.1 |
26.7 |
27.3 |
26.9 |
25.8 |
24.4 |
D.4 |
Steel Production |
19.3 |
18.9 |
18.2 |
16.7 |
14.8 |
12.2 |
11.4 |
11.6 |
12.3 |
D.5 |
Production of Commercial Motor Vehicles |
35.9 |
37.4 |
40.6 |
45.7 |
50.2 |
53.5 |
53.3 |
51.6 |
47.1 |
E.1 |
Cargo handled at Major Ports |
24.1 |
23.7 |
22.2 |
19.9 |
16.8 |
13.9 |
12.7 |
13.6 |
15.3 |
E.2 |
Revenue on Railway Freight Traffic |
25.5 |
25.4 |
24.9 |
24.2 |
23.3 |
22.1 |
20.8 |
19.7 |
19.1 |
F.1 |
Exports* |
28.9 |
27.7 |
25.7 |
24.0 |
21.9 |
21.1 |
21.6 |
24.0 |
26.3 |
F.2 |
Imports* |
13.9 |
13.3 |
12.6 |
11.5 |
10.8 |
11.6 |
14.0 |
15.8 |
16.2 |
F.2.1 |
Non-Oil Imports* |
14.3 |
14.4 |
14.3 |
14.6 |
14.6 |
14.5 |
13.1 |
12.3 |
10.7 |
Table 2: Range (Difference Between Peak and Trough) of Seasonal Factors (Concld.) |
Year |
2003-04 |
2004-05 |
2005-06 |
2006-07 |
2007-08 |
2008-09 |
2009-10 |
Average
Range |
Standard
Deviation |
1 |
11 |
12 |
13 |
14 |
15 |
16 |
17 |
18 |
19 |
D.2.1 |
IIP - Mining |
19.8 |
21.7 |
23.5 |
24.7 |
25.3 |
25.4 |
25.1 |
21.0 |
2.9 |
D.2.2 |
IIP - Manufacturing |
12.1 |
12.9 |
13.6 |
14.0 |
14.0 |
13.6 |
13.3 |
13.5 |
1.0 |
D.2.2.1 |
IIP - Food Products |
73.1 |
75.1 |
78.6 |
82.7 |
85.1 |
86.8 |
87.5 |
73.8 |
8.2 |
D.2.2.2 |
IIP - Cotton Textiles |
6.5 |
6.3 |
6.5 |
6.4 |
6.4 |
6.3 |
6.2 |
6.6 |
0.2 |
D.2.2.3 |
IIP - Textile Products |
8.1 |
8.4 |
8.3 |
8.2 |
7.9 |
9.0 |
10.0 |
9.1 |
1.5 |
|
(including Wearing Apparel) |
|
|
|
|
|
|
|
|
|
D.2.2.4 |
IIP - Leather and Leather |
|
|
|
|
|
|
|
|
|
|
& Fur Products |
14.4 |
14.8 |
16.2 |
17.5 |
19.5 |
21.6 |
23.1 |
16.1 |
2.9 |
D.2.2.5 |
IIP - Basic Chemicals & Chemical Products (except products of Petroleum & Coal) |
9.4 |
9.1 |
10.0 |
11.3 |
11.9 |
12.2 |
11.9 |
8.9 |
2.1 |
D.2.2.6 |
IIP - Rubber, Plastic, Petroleum and Coal Products |
8.8 |
8.8 |
8.9 |
9.3 |
9.6 |
10.0 |
10.5 |
9.2 |
0.5 |
D.2.2.7 |
IIP - Non-metallic Mineral Products |
14.1 |
13.8 |
14.1 |
14.6 |
14.9 |
14.9 |
14.6 |
14.7 |
0.8 |
D.2.2.8 |
IIP - Basic Metal and Alloy Industries |
8.1 |
9.4 |
10.7 |
11.5 |
12.2 |
12.5 |
12.2 |
10.7 |
2.1 |
D.2.2.9 |
IIP - Metal Products & Parts (except Machinery & Equipments) |
24.2 |
24.6 |
25.2 |
27.1 |
27.9 |
28.6 |
30.3 |
25.8 |
2.0 |
D.2.2.10 |
IIP -Machinery & Equipment (other than Transport Equipment) |
24.3 |
26.9 |
29.5 |
31.7 |
33.0 |
33.4 |
33.4 |
25.2 |
5.5 |
D.2.2.11 |
IIP - Transport Equipment & Parts |
20.9 |
20.5 |
20.3 |
19.5 |
18.5 |
18.0 |
17.3 |
22.7 |
3.6 |
D.2.2.12 |
IIP - Other Manufacturing Industries |
25.0 |
28.4 |
31.6 |
35.5 |
39.7 |
45.9 |
49.2 |
27.6 |
9.9 |
D.2.3 |
IIP - Electricity |
11.1 |
10.4 |
10.1 |
9.9 |
10.0 |
10.1 |
10.4 |
10.3 |
0.7 |
D.3 |
Cement Production |
22.7 |
21.3 |
20.8 |
20.8 |
20.8 |
20.8 |
20.8 |
23.2 |
2.5 |
D.4 |
Steel Production |
12.9 |
13.0 |
12.7 |
12.7 |
12.6 |
12.0 |
11.8 |
14.0 |
2.7 |
D.5 |
Production of Commercial Motor Vehicles |
42.3 |
36.6 |
32.6 |
28.5 |
25.6 |
25.2 |
25.8 |
39.5 |
10.1 |
E.1 |
Cargo handled at Major Ports |
17.1 |
18.1 |
18.4 |
18.3 |
18.0 |
17.6 |
17.5 |
18.0 |
3.3 |
E.2 |
Revenue on Railway Freight Traffic |
19.2 |
19.8 |
20.6 |
21.2 |
21.3 |
21.1 |
20.6 |
21.8 |
2.2 |
F.1 |
Exports* |
27.9 |
28.3 |
26.5 |
23.7 |
20.8 |
19.1 |
17.8 |
24.1 |
3.4 |
F.2 |
Imports* |
17.1 |
18.3 |
19.6 |
22.5 |
24.7 |
24.6 |
24.3 |
16.9 |
4.9 |
| F.2.1 |
Non-Oil Imports* |
12.6 |
14.5 |
16.3 |
17.5 |
17.9 |
17.7 |
18.6 |
14.9 |
2.2 |
| * Valued in US Dollar |
Table 3: Seasonal Factors of Selected Series for the Last Sixteen Years |
Year |
Apr. |
May |
Jun. |
Jul. |
Aug. |
Sep. |
Oct. |
Nov. |
Dec. |
Jan. |
Feb. |
Mar. |
1 |
2 |
3 |
4 |
5 |
6 |
7 |
8 |
9 |
10 |
11 |
12 |
13 |
1. Broad Money (M3) |
|
|
|
|
|
|
|
|
|
|
|
|
1994-95 |
101.4 |
101.0 |
100.5 |
99.9 |
99.2 |
100.1 |
100.1 |
99.5 |
98.9 |
99.2 |
98.9 |
101.1 |
1995-96 |
101.4 |
101.0 |
100.5 |
99.9 |
99.3 |
100.1 |
100.1 |
99.5 |
98.9 |
99.2 |
99.0 |
101.1 |
1996-97 |
101.4 |
101.0 |
100.5 |
99.9 |
99.3 |
100.1 |
100.1 |
99.5 |
98.9 |
99.2 |
99.0 |
101.0 |
1997-98 |
101.4 |
100.9 |
100.6 |
99.9 |
99.4 |
100.1 |
100.0 |
99.6 |
99.0 |
99.2 |
99.1 |
100.9 |
1998-99 |
101.3 |
100.9 |
100.6 |
99.9 |
99.5 |
100.0 |
99.9 |
99.6 |
99.0 |
99.2 |
99.1 |
100.8 |
1999-00 |
101.2 |
100.9 |
100.7 |
99.9 |
99.6 |
99.9 |
99.9 |
99.7 |
99.1 |
99.1 |
99.1 |
100.6 |
2000-01 |
101.2 |
101.0 |
100.8 |
100.0 |
99.7 |
99.8 |
99.8 |
99.6 |
99.2 |
99.1 |
99.1 |
100.5 |
2001-02 |
101.3 |
101.0 |
101.0 |
100.1 |
99.8 |
99.6 |
99.7 |
99.5 |
99.2 |
99.1 |
99.2 |
100.4 |
2002-03 |
101.4 |
101.1 |
101.0 |
100.1 |
99.8 |
99.6 |
99.7 |
99.4 |
99.1 |
99.0 |
99.2 |
100.4 |
2003-04 |
101.7 |
101.1 |
100.9 |
100.1 |
99.9 |
99.7 |
99.6 |
99.3 |
99.0 |
98.9 |
99.3 |
100.6 |
2004-05 |
101.8 |
101.1 |
100.7 |
100.0 |
99.9 |
99.8 |
99.6 |
99.2 |
98.9 |
98.9 |
99.4 |
100.8 |
2005-06 |
101.9 |
101.1 |
100.5 |
100.0 |
99.8 |
100.0 |
99.6 |
99.1 |
98.8 |
98.9 |
99.6 |
101.0 |
2006-07 |
101.9 |
101.1 |
100.3 |
100.0 |
99.8 |
100.0 |
99.5 |
99.1 |
98.6 |
99.1 |
99.7 |
101.2 |
2007-08 |
101.8 |
101.1 |
100.1 |
100.0 |
99.7 |
100.0 |
99.5 |
99.1 |
98.5 |
99.2 |
99.8 |
101.4 |
2008-09 |
101.6 |
101.1 |
100.1 |
100.1 |
99.7 |
99.9 |
99.5 |
99.1 |
98.4 |
99.4 |
99.9 |
101.5 |
2009-10 |
101.5 |
101.1 |
100.0 |
100.1 |
99.7 |
99.7 |
99.5 |
99.1 |
98.3 |
99.6 |
100.0 |
101.5 |
2. Reserve Money (M0 ) |
|
|
|
|
|
|
|
|
|
|
|
|
1994-95 |
103.2 |
102.8 |
102.8 |
100.9 |
98.7 |
97.1 |
99.5 |
98.5 |
97.9 |
96.6 |
98.7 |
103.8 |
1995-96 |
103.1 |
102.9 |
102.8 |
100.8 |
98.5 |
97.1 |
99.6 |
98.5 |
98.0 |
96.8 |
98.8 |
103.8 |
1996-97 |
103.0 |
103.0 |
102.7 |
100.4 |
98.2 |
97.1 |
99.7 |
98.6 |
98.2 |
97.2 |
98.9 |
103.8 |
1997-98 |
102.8 |
103.0 |
102.5 |
100.0 |
97.9 |
97.1 |
99.9 |
98.8 |
98.5 |
97.6 |
99.0 |
103.6 |
1998-99 |
102.6 |
103.1 |
102.2 |
99.5 |
97.8 |
97.1 |
100.0 |
99.1 |
98.7 |
98.0 |
99.1 |
103.5 |
1999-00 |
102.5 |
103.1 |
101.9 |
99.2 |
97.9 |
97.0 |
100.1 |
99.3 |
98.7 |
98.4 |
99.1 |
103.2 |
2000-01 |
102.6 |
103.0 |
101.7 |
99.0 |
98.1 |
96.9 |
100.0 |
99.4 |
98.6 |
98.7 |
99.1 |
103.0 |
2001-02 |
102.9 |
102.9 |
101.6 |
99.0 |
98.4 |
96.9 |
99.7 |
99.5 |
98.5 |
98.9 |
98.9 |
102.9 |
2002-03 |
103.2 |
102.7 |
101.6 |
99.1 |
98.6 |
96.8 |
99.4 |
99.5 |
98.4 |
99.1 |
98.8 |
102.8 |
2003-04 |
103.7 |
102.4 |
101.6 |
99.2 |
98.8 |
96.9 |
99.0 |
99.4 |
98.2 |
99.2 |
98.7 |
102.8 |
2004-05 |
104.1 |
102.2 |
101.4 |
99.5 |
98.9 |
97.4 |
98.7 |
99.2 |
98.0 |
99.1 |
98.7 |
102.9 |
2005-06 |
104.3 |
101.9 |
101.2 |
99.9 |
99.1 |
98.1 |
98.4 |
98.7 |
97.8 |
98.9 |
98.8 |
103.1 |
2006-07 |
104.2 |
101.9 |
101.1 |
100.2 |
99.3 |
98.8 |
98.0 |
98.3 |
97.6 |
98.4 |
98.9 |
103.4 |
2007-08 |
103.9 |
102.1 |
101.2 |
100.5 |
99.4 |
99.5 |
97.8 |
97.9 |
97.5 |
97.8 |
99.0 |
103.7 |
2008-09 |
103.5 |
102.4 |
101.4 |
100.7 |
99.4 |
99.9 |
97.6 |
97.6 |
97.4 |
97.3 |
99.1 |
104.0 |
2009-10 |
103.0 |
102.7 |
101.7 |
100.8 |
99.5 |
100.1 |
97.4 |
97.4 |
97.4 |
97.0 |
99.1 |
104.2 |
3 Aggregate Deposits (SCBs) |
|
|
|
|
|
|
|
|
|
|
|
|
1994-95 |
100.8 |
99.9 |
99.4 |
99.2 |
99.7 |
101.4 |
100.4 |
99.7 |
99.1 |
99.1 |
99.3 |
102.0 |
1995-96 |
100.8 |
99.9 |
99.4 |
99.2 |
99.7 |
101.4 |
100.4 |
99.7 |
99.1 |
99.2 |
99.3 |
102.0 |
1996-97 |
100.8 |
99.9 |
99.5 |
99.3 |
99.8 |
101.3 |
100.4 |
99.7 |
99.0 |
99.2 |
99.3 |
101.7 |
1997-98 |
100.8 |
99.8 |
99.7 |
99.4 |
99.9 |
101.1 |
100.3 |
99.7 |
99.0 |
99.3 |
99.3 |
101.3 |
1998-99 |
100.8 |
99.9 |
100.0 |
99.6 |
100.0 |
100.9 |
100.3 |
99.8 |
99.1 |
99.3 |
99.2 |
100.8 |
1999-00 |
100.8 |
100.0 |
100.3 |
99.9 |
100.1 |
100.6 |
100.2 |
99.9 |
99.2 |
99.3 |
99.1 |
100.2 |
2000-01 |
100.9 |
100.1 |
100.6 |
100.1 |
100.1 |
100.4 |
100.1 |
100.0 |
99.3 |
99.2 |
99.0 |
99.7 |
2001-02 |
101.0 |
100.3 |
100.9 |
100.3 |
100.2 |
100.2 |
100.1 |
99.9 |
99.3 |
99.2 |
99.0 |
99.4 |
2002-03 |
101.1 |
100.5 |
100.9 |
100.5 |
100.2 |
100.2 |
100.0 |
99.7 |
99.2 |
99.1 |
99.0 |
99.3 |
2003-04 |
101.3 |
100.7 |
100.8 |
100.5 |
100.2 |
100.5 |
99.9 |
99.5 |
99.1 |
99.0 |
99.0 |
99.5 |
2004-05 |
101.5 |
100.8 |
100.6 |
100.6 |
100.2 |
100.8 |
99.8 |
99.3 |
99.0 |
98.9 |
99.0 |
99.8 |
2005-06 |
101.5 |
100.8 |
100.4 |
100.5 |
100.1 |
100.9 |
99.7 |
99.2 |
98.9 |
98.9 |
99.1 |
100.2 |
2006-07 |
101.4 |
100.8 |
100.2 |
100.5 |
99.9 |
100.9 |
99.7 |
99.3 |
98.9 |
99.0 |
99.2 |
100.6 |
2007-08 |
101.4 |
100.8 |
100.0 |
100.4 |
99.8 |
100.7 |
99.7 |
99.3 |
98.8 |
99.1 |
99.4 |
100.9 |
2008-09 |
101.3 |
100.8 |
99.9 |
100.4 |
99.8 |
100.4 |
99.7 |
99.4 |
98.7 |
99.3 |
99.5 |
101.1 |
2009-10 |
101.3 |
100.7 |
99.9 |
100.3 |
99.8 |
100.0 |
99.8 |
99.4 |
98.6 |
99.4 |
99.7 |
101.2 |
4. Bank Credit (SCBs) |
|
|
|
|
|
|
|
|
|
|
|
|
1994-95 |
102.5 |
100.7 |
98.9 |
98.7 |
97.3 |
98.8 |
99.2 |
99.0 |
99.3 |
101.1 |
100.9 |
104.0 |
1995-96 |
102.3 |
100.7 |
99.0 |
98.8 |
97.4 |
98.7 |
99.1 |
98.9 |
99.2 |
101.2 |
101.0 |
103.9 |
1996-97 |
102.2 |
100.7 |
99.1 |
98.9 |
97.6 |
98.5 |
99.1 |
98.7 |
99.3 |
101.2 |
101.0 |
103.8 |
1997-98 |
102.0 |
100.7 |
99.1 |
99.0 |
97.8 |
98.5 |
99.3 |
98.6 |
99.4 |
101.1 |
101.0 |
103.5 |
1998-99 |
101.9 |
100.6 |
99.1 |
99.1 |
98.1 |
98.5 |
99.6 |
98.6 |
99.7 |
100.8 |
100.8 |
102.8 |
1999-00 |
101.7 |
100.7 |
99.3 |
99.2 |
98.5 |
98.6 |
99.7 |
98.8 |
100.1 |
100.5 |
100.5 |
101.9 |
2000-01 |
101.5 |
100.7 |
99.7 |
99.4 |
98.8 |
98.7 |
99.7 |
99.1 |
100.3 |
100.2 |
100.2 |
101.3 |
2001-02 |
101.4 |
100.8 |
100.1 |
99.6 |
98.9 |
98.6 |
99.8 |
99.4 |
100.2 |
100.0 |
100.0 |
101.1 |
2002-03 |
101.4 |
100.7 |
100.4 |
99.5 |
98.7 |
98.7 |
99.8 |
99.7 |
100.2 |
100.0 |
99.9 |
101.3 |
2003-04 |
101.5 |
100.6 |
100.3 |
99.2 |
98.4 |
99.0 |
99.9 |
99.9 |
100.3 |
100.1 |
99.9 |
101.6 |
2004-05 |
101.6 |
100.3 |
99.9 |
98.8 |
98.1 |
99.6 |
99.8 |
99.9 |
100.6 |
100.2 |
100.0 |
102.0 |
2005-06 |
101.5 |
99.9 |
99.5 |
98.7 |
98.1 |
100.2 |
99.6 |
99.7 |
100.8 |
100.1 |
100.1 |
102.4 |
2006-07 |
101.1 |
99.7 |
99.4 |
98.5 |
98.2 |
100.6 |
99.4 |
99.6 |
100.8 |
99.9 |
100.2 |
102.9 |
2007-08 |
100.8 |
99.6 |
99.5 |
98.4 |
98.5 |
100.7 |
99.4 |
99.7 |
100.5 |
99.7 |
100.2 |
103.1 |
2008-09 |
100.6 |
99.6 |
99.8 |
98.5 |
98.7 |
100.4 |
99.6 |
99.8 |
100.1 |
99.6 |
100.1 |
103.0 |
2009-10 |
100.6 |
99.6 |
100.0 |
98.8 |
98.8 |
100.3 |
99.7 |
99.7 |
99.8 |
99.6 |
100.0 |
102.9 |
Table 3: Seasonal Factors of Selected Series for the Last Sixteen Years (Contd.) |
Year |
Apr. |
May |
Jun. |
Jul. |
Aug. |
Sep. |
Oct. |
Nov. |
Dec. |
Jan. |
Feb. |
Mar. |
1 |
2 |
3 |
4 |
5 |
6 |
7 |
8 |
9 |
10 |
11 |
12 |
13 |
5. WPI - All Commodities |
|
|
|
|
|
|
|
|
|
|
|
|
1994-95 |
100.1 |
100.1 |
100.3 |
100.8 |
100.7 |
100.3 |
100.2 |
100.1 |
99.7 |
99.5 |
99.4 |
99.0 |
1995-96 |
100.1 |
100.1 |
100.3 |
100.7 |
100.6 |
100.3 |
100.2 |
100.1 |
99.7 |
99.4 |
99.4 |
99.0 |
1996-97 |
100.1 |
100.1 |
100.3 |
100.7 |
100.5 |
100.3 |
100.3 |
100.2 |
99.8 |
99.4 |
99.4 |
99.1 |
1997-98 |
100.1 |
100.1 |
100.3 |
100.6 |
100.4 |
100.3 |
100.4 |
100.3 |
99.8 |
99.3 |
99.3 |
99.3 |
1998-99 |
100.1 |
100.1 |
100.3 |
100.4 |
100.3 |
100.2 |
100.5 |
100.4 |
99.8 |
99.3 |
99.3 |
99.4 |
1999-00 |
100.0 |
100.1 |
100.3 |
100.3 |
100.3 |
100.2 |
100.6 |
100.5 |
99.8 |
99.3 |
99.3 |
99.5 |
2000-01 |
100.0 |
100.0 |
100.3 |
100.2 |
100.3 |
100.2 |
100.6 |
100.5 |
99.7 |
99.3 |
99.3 |
99.6 |
2001-02 |
100.0 |
100.0 |
100.2 |
100.2 |
100.3 |
100.3 |
100.5 |
100.5 |
99.7 |
99.3 |
99.3 |
99.6 |
2002-03 |
100.0 |
100.0 |
100.2 |
100.2 |
100.4 |
100.5 |
100.5 |
100.4 |
99.7 |
99.3 |
99.3 |
99.5 |
2003-04 |
99.9 |
100.0 |
100.2 |
100.2 |
100.4 |
100.6 |
100.5 |
100.4 |
99.6 |
99.3 |
99.2 |
99.4 |
2004-05 |
99.9 |
100.0 |
100.2 |
100.3 |
100.5 |
100.8 |
100.6 |
100.4 |
99.6 |
99.3 |
99.1 |
99.2 |
2005-06 |
99.8 |
100.0 |
100.3 |
100.5 |
100.6 |
101.0 |
100.6 |
100.4 |
99.5 |
99.2 |
98.9 |
99.0 |
2006-07 |
99.7 |
100.0 |
100.3 |
100.7 |
100.7 |
101.1 |
100.7 |
100.4 |
99.5 |
99.1 |
98.7 |
98.9 |
2007-08 |
99.7 |
100.0 |
100.3 |
100.8 |
100.9 |
101.2 |
100.7 |
100.3 |
99.4 |
99.0 |
98.6 |
98.8 |
2008-09 |
99.7 |
100.1 |
100.4 |
101.0 |
101.0 |
101.2 |
100.8 |
100.3 |
99.4 |
98.9 |
98.5 |
98.8 |
2009-10 |
99.8 |
100.0 |
100.4 |
101.1 |
101.1 |
101.2 |
100.7 |
100.2 |
99.3 |
98.9 |
98.4 |
98.8 |
6. WPI - Food Articles |
|
|
|
|
|
|
|
|
|
|
|
|
1994-95 |
99.2 |
99.4 |
101.3 |
101.8 |
102.6 |
101.1 |
101.2 |
100.9 |
99.2 |
98.1 |
98.1 |
97.0 |
1995-96 |
99.3 |
99.4 |
101.3 |
101.8 |
102.6 |
101.0 |
101.4 |
101.0 |
99.3 |
98.0 |
98.0 |
97.0 |
1996-97 |
99.5 |
99.4 |
101.1 |
101.8 |
102.5 |
101.0 |
101.6 |
101.1 |
99.4 |
97.8 |
97.8 |
97.1 |
1997-98 |
99.6 |
99.5 |
101.0 |
101.7 |
102.3 |
100.9 |
101.8 |
101.1 |
99.5 |
97.7 |
97.6 |
97.3 |
1998-99 |
99.9 |
99.6 |
101.0 |
101.5 |
102.1 |
100.9 |
102.0 |
101.1 |
99.6 |
97.6 |
97.5 |
97.6 |
1999-00 |
100.0 |
99.8 |
101.1 |
101.2 |
101.7 |
100.8 |
102.0 |
101.1 |
99.5 |
97.6 |
97.5 |
97.9 |
2000-01 |
100.1 |
99.9 |
101.1 |
100.8 |
101.4 |
100.9 |
102.0 |
101.2 |
99.4 |
97.7 |
97.7 |
98.1 |
2001-02 |
100.0 |
100.1 |
101.1 |
100.5 |
101.1 |
101.0 |
101.9 |
101.3 |
99.3 |
97.9 |
97.9 |
98.3 |
2002-03 |
99.9 |
100.1 |
101.0 |
100.1 |
100.9 |
101.1 |
101.9 |
101.5 |
99.2 |
98.2 |
98.1 |
98.2 |
2003-04 |
99.6 |
100.1 |
100.8 |
100.0 |
100.8 |
101.3 |
102.0 |
101.8 |
99.3 |
98.4 |
98.2 |
98.0 |
2004-05 |
99.5 |
100.1 |
100.5 |
100.1 |
100.8 |
101.4 |
102.0 |
101.9 |
99.3 |
98.5 |
98.2 |
97.8 |
2005-06 |
99.4 |
100.1 |
100.2 |
100.2 |
100.7 |
101.6 |
102.0 |
101.9 |
99.4 |
98.7 |
98.2 |
97.7 |
2006-07 |
99.4 |
100.1 |
99.9 |
100.4 |
100.7 |
101.7 |
102.0 |
101.8 |
99.5 |
98.9 |
98.2 |
97.6 |
2007-08 |
99.4 |
100.0 |
99.7 |
100.5 |
100.6 |
101.8 |
101.9 |
101.8 |
99.6 |
99.1 |
98.3 |
97.7 |
2008-09 |
99.4 |
99.9 |
99.5 |
100.6 |
100.6 |
101.8 |
101.8 |
101.8 |
99.7 |
99.2 |
98.4 |
97.7 |
2009-10 |
99.3 |
99.7 |
99.4 |
100.6 |
100.6 |
101.7 |
101.8 |
101.8 |
99.8 |
99.3 |
98.4 |
97.8 |
7. Consumer Price Index for Industrial Workers |
|
|
|
|
|
|
|
|
|
|
|
|
1994-95 |
99.1 |
99.4 |
100.1 |
100.8 |
100.9 |
100.7 |
101.0 |
100.6 |
99.9 |
99.6 |
99.0 |
98.9 |
1995-96 |
99.1 |
99.4 |
100.0 |
100.8 |
100.9 |
100.7 |
101.1 |
100.7 |
99.9 |
99.6 |
99.0 |
98.9 |
1996-97 |
99.1 |
99.4 |
100.0 |
100.8 |
100.9 |
100.7 |
101.1 |
100.7 |
99.9 |
99.6 |
98.9 |
98.9 |
1997-98 |
99.1 |
99.4 |
100.0 |
100.7 |
100.8 |
100.6 |
101.2 |
100.8 |
100.0 |
99.6 |
98.9 |
98.9 |
1998-99 |
99.1 |
99.5 |
100.0 |
100.7 |
100.8 |
100.5 |
101.3 |
100.8 |
100.0 |
99.6 |
98.8 |
98.9 |
1999-00 |
99.1 |
99.5 |
100.0 |
100.8 |
100.8 |
100.5 |
101.2 |
100.8 |
99.9 |
99.6 |
98.8 |
99.0 |
2000-01 |
99.2 |
99.6 |
100.0 |
100.8 |
100.8 |
100.4 |
101.2 |
100.7 |
99.8 |
99.6 |
98.9 |
99.1 |
2001-02 |
99.3 |
99.7 |
100.0 |
100.9 |
100.7 |
100.4 |
101.1 |
100.6 |
99.7 |
99.6 |
98.9 |
99.2 |
2002-03 |
99.3 |
99.7 |
100.0 |
100.9 |
100.7 |
100.4 |
101.0 |
100.5 |
99.7 |
99.6 |
99.0 |
99.3 |
2003-04 |
99.4 |
99.6 |
100.0 |
100.8 |
100.7 |
100.4 |
100.9 |
100.5 |
99.7 |
99.7 |
99.1 |
99.3 |
2004-05 |
99.3 |
99.6 |
99.9 |
100.8 |
100.7 |
100.4 |
101.0 |
100.5 |
99.7 |
99.8 |
99.1 |
99.2 |
2005-06 |
99.3 |
99.5 |
99.8 |
100.7 |
100.8 |
100.5 |
101.1 |
100.6 |
99.8 |
99.8 |
99.1 |
99.1 |
2006-07 |
99.2 |
99.5 |
99.7 |
100.7 |
100.8 |
100.5 |
101.1 |
100.7 |
100.0 |
99.9 |
99.1 |
99.1 |
2007-08 |
99.2 |
99.4 |
99.7 |
100.6 |
100.8 |
100.5 |
101.2 |
100.7 |
100.1 |
99.9 |
99.1 |
99.0 |
2008-09 |
99.2 |
99.3 |
99.6 |
100.6 |
100.8 |
100.5 |
101.2 |
100.8 |
100.2 |
99.9 |
99.1 |
99.0 |
2009-10 |
99.1 |
99.2 |
99.6 |
100.5 |
100.8 |
100.5 |
101.2 |
100.9 |
100.2 |
100.0 |
99.1 |
99.0 |
8. IIP - General Index |
|
|
|
|
|
|
|
|
|
|
|
|
1994-95 |
98.7 |
98.7 |
96.1 |
97.3 |
96.8 |
96.2 |
95.8 |
98.7 |
105.1 |
105.4 |
101.7 |
110.6 |
1995-96 |
98.7 |
98.7 |
96.1 |
97.3 |
96.8 |
96.2 |
95.9 |
98.8 |
105.0 |
105.3 |
101.7 |
110.3 |
1996-97 |
98.8 |
98.8 |
96.1 |
97.3 |
96.8 |
96.4 |
96.0 |
98.8 |
104.9 |
105.1 |
101.7 |
110.0 |
1997-98 |
98.7 |
99.0 |
96.1 |
97.3 |
97.0 |
96.6 |
96.1 |
99.0 |
105.0 |
104.8 |
101.6 |
109.6 |
1998-99 |
98.5 |
99.1 |
96.2 |
97.3 |
97.1 |
96.8 |
96.2 |
99.2 |
105.1 |
104.6 |
101.5 |
109.2 |
1999-00 |
98.2 |
99.1 |
96.2 |
97.3 |
97.3 |
97.0 |
96.5 |
99.3 |
105.2 |
104.6 |
101.4 |
108.8 |
2000-01 |
97.8 |
98.9 |
96.2 |
97.5 |
97.5 |
97.3 |
96.7 |
99.3 |
105.3 |
104.7 |
101.3 |
108.5 |
2001-02 |
97.4 |
98.7 |
96.1 |
97.7 |
97.7 |
97.6 |
97.1 |
99.0 |
105.3 |
104.8 |
101.1 |
108.4 |
2002-03 |
96.9 |
98.6 |
96.2 |
98.0 |
97.7 |
98.0 |
97.5 |
98.7 |
105.2 |
104.9 |
100.8 |
108.3 |
2003-04 |
96.6 |
98.6 |
96.4 |
98.2 |
97.7 |
98.3 |
97.9 |
98.2 |
105.0 |
104.9 |
100.3 |
108.5 |
2004-05 |
96.4 |
98.9 |
96.7 |
98.3 |
97.6 |
98.6 |
98.0 |
97.7 |
104.8 |
104.8 |
100.0 |
108.9 |
2005-06 |
96.3 |
99.3 |
97.0 |
98.2 |
97.5 |
98.9 |
97.9 |
97.4 |
104.6 |
104.5 |
99.7 |
109.4 |
2006-07 |
96.2 |
99.5 |
97.4 |
98.1 |
97.4 |
99.1 |
97.6 |
97.2 |
104.5 |
104.3 |
99.6 |
109.8 |
2007-08 |
96.3 |
99.5 |
97.7 |
98.0 |
97.4 |
99.4 |
97.2 |
97.1 |
104.6 |
104.1 |
99.7 |
109.8 |
2008-09 |
96.4 |
99.2 |
97.9 |
98.1 |
97.5 |
99.5 |
96.9 |
97.1 |
104.7 |
104.0 |
99.9 |
109.6 |
2009-10 |
96.6 |
98.8 |
98.0 |
98.2 |
97.5 |
99.6 |
96.7 |
97.3 |
104.8 |
104.0 |
100.0 |
109.4 |
Table 3: Seasonal Factors of Selected Series for the Last Sixteen Years (Contd.) |
Year |
Apr. |
May |
Jun. |
Jul. |
Aug. |
Sep. |
Oct. |
Nov. |
Dec. |
Jan. |
Feb. |
Mar. |
1 |
2 |
3 |
4 |
5 |
6 |
7 |
8 |
9 |
10 |
11 |
12 |
13 |
9. IIP - Manufacturing |
|
|
|
|
|
|
|
|
|
|
|
|
1994-95 |
99.1 |
98.2 |
96.3 |
97.4 |
96.8 |
96.3 |
95.2 |
98.8 |
105.2 |
104.9 |
102.3 |
110.6 |
1995-96 |
99.1 |
98.2 |
96.4 |
97.4 |
96.7 |
96.4 |
95.3 |
98.8 |
105.2 |
104.9 |
102.3 |
110.3 |
1996-97 |
99.1 |
98.2 |
96.4 |
97.3 |
96.7 |
96.6 |
95.4 |
98.8 |
105.1 |
104.8 |
102.3 |
110.0 |
1997-98 |
99.0 |
98.4 |
96.5 |
97.2 |
96.8 |
96.9 |
95.6 |
98.8 |
105.1 |
104.5 |
102.3 |
109.6 |
1998-99 |
98.8 |
98.5 |
96.5 |
97.2 |
96.9 |
97.2 |
95.7 |
98.9 |
105.2 |
104.4 |
102.4 |
109.2 |
1999-00 |
98.5 |
98.5 |
96.6 |
97.2 |
97.1 |
97.4 |
95.9 |
99.0 |
105.3 |
104.4 |
102.3 |
108.8 |
2000-01 |
98.0 |
98.4 |
96.5 |
97.4 |
97.3 |
97.6 |
96.1 |
98.9 |
105.4 |
104.6 |
102.3 |
108.5 |
2001-02 |
97.5 |
98.2 |
96.3 |
97.6 |
97.6 |
97.9 |
96.5 |
98.8 |
105.5 |
104.7 |
102.1 |
108.4 |
2002-03 |
96.9 |
98.0 |
96.2 |
97.9 |
97.7 |
98.3 |
96.9 |
98.5 |
105.4 |
104.9 |
101.7 |
108.3 |
2003-04 |
96.4 |
98.0 |
96.4 |
98.1 |
97.8 |
98.8 |
97.3 |
98.1 |
105.3 |
105.0 |
101.1 |
108.5 |
2004-05 |
96.0 |
98.2 |
96.7 |
98.2 |
97.9 |
99.2 |
97.4 |
97.6 |
105.1 |
104.8 |
100.6 |
108.9 |
2005-06 |
95.8 |
98.6 |
97.1 |
98.2 |
97.8 |
99.6 |
97.3 |
97.3 |
104.9 |
104.5 |
100.2 |
109.4 |
2006-07 |
95.7 |
98.9 |
97.5 |
98.1 |
97.7 |
99.9 |
97.0 |
97.1 |
104.7 |
104.2 |
100.0 |
109.7 |
2007-08 |
95.8 |
98.9 |
98.0 |
98.1 |
97.6 |
100.1 |
96.6 |
97.1 |
104.8 |
104.1 |
100.0 |
109.8 |
2008-09 |
95.9 |
98.6 |
98.3 |
98.2 |
97.6 |
100.2 |
96.2 |
97.1 |
104.9 |
104.0 |
100.2 |
109.5 |
2009-10 |
96.2 |
98.1 |
98.5 |
98.4 |
97.6 |
100.4 |
95.9 |
97.3 |
105.0 |
104.0 |
100.3 |
109.3 |
10. Cement Production |
|
|
|
|
|
|
|
|
|
|
|
|
1994-95 |
104.9 |
100.7 |
99.0 |
96.0 |
96.1 |
93.0 |
96.1 |
93.2 |
98.6 |
103.8 |
106.4 |
114.3 |
1995-96 |
104.4 |
101.5 |
99.4 |
95.9 |
95.5 |
92.7 |
95.9 |
93.4 |
98.8 |
104.0 |
106.0 |
114.7 |
1996-97 |
103.9 |
102.6 |
100.4 |
95.7 |
94.2 |
92.1 |
95.6 |
93.8 |
98.9 |
104.4 |
104.9 |
115.4 |
1997-98 |
103.2 |
103.9 |
102.0 |
95.7 |
92.6 |
91.3 |
95.7 |
94.5 |
98.7 |
104.3 |
103.3 |
116.4 |
1998-99 |
103.0 |
105.4 |
103.8 |
95.9 |
90.8 |
90.3 |
96.0 |
95.4 |
98.5 |
103.8 |
101.8 |
117.0 |
1999-00 |
102.9 |
106.7 |
105.2 |
96.4 |
89.6 |
89.6 |
96.4 |
96.0 |
98.7 |
102.8 |
100.4 |
116.9 |
2000-01 |
103.5 |
107.6 |
105.8 |
97.0 |
89.1 |
89.3 |
96.6 |
96.1 |
99.3 |
102.0 |
99.6 |
116.0 |
2001-02 |
104.0 |
107.7 |
105.8 |
97.7 |
89.0 |
89.8 |
97.1 |
96.0 |
99.6 |
101.6 |
98.9 |
114.9 |
2002-03 |
104.7 |
107.8 |
105.1 |
97.7 |
89.4 |
90.3 |
97.6 |
95.5 |
100.1 |
101.9 |
98.8 |
113.8 |
2003-04 |
105.0 |
107.3 |
103.9 |
97.4 |
90.0 |
91.0 |
98.0 |
95.0 |
101.0 |
102.8 |
98.6 |
112.7 |
2004-05 |
105.2 |
106.8 |
102.8 |
96.8 |
90.8 |
91.4 |
98.2 |
94.5 |
101.7 |
104.0 |
98.7 |
112.2 |
2005-06 |
105.1 |
105.6 |
102.0 |
96.5 |
91.2 |
91.9 |
98.6 |
94.4 |
101.9 |
104.7 |
98.7 |
112.0 |
2006-07 |
105.0 |
104.9 |
101.5 |
96.4 |
91.5 |
92.1 |
98.7 |
94.2 |
102.0 |
105.0 |
99.1 |
112.3 |
2007-08 |
104.8 |
104.1 |
101.1 |
96.7 |
91.7 |
92.3 |
98.4 |
94.1 |
102.1 |
105.0 |
99.5 |
112.4 |
2008-09 |
104.7 |
103.9 |
100.9 |
97.1 |
91.8 |
92.4 |
97.9 |
94.0 |
102.1 |
104.9 |
100.0 |
112.6 |
2009-10 |
104.6 |
103.5 |
100.7 |
97.4 |
91.8 |
92.5 |
97.6 |
94.0 |
102.2 |
104.7 |
100.5 |
112.6 |
11. Production of Commercial Motor Vehicles |
|
|
|
|
|
|
|
|
|
|
|
|
1994-95 |
88.4 |
96.6 |
99.0 |
101.6 |
95.9 |
97.6 |
93.7 |
94.2 |
107.4 |
106.5 |
100.1 |
124.3 |
1995-96 |
87.6 |
96.9 |
98.9 |
100.9 |
95.6 |
96.6 |
93.4 |
95.1 |
108.0 |
108.4 |
100.9 |
125.0 |
1996-97 |
86.3 |
96.3 |
98.6 |
99.9 |
94.9 |
95.3 |
92.7 |
96.8 |
108.8 |
111.6 |
102.5 |
126.8 |
1997-98 |
83.8 |
95.3 |
97.9 |
97.9 |
94.3 |
94.0 |
93.2 |
98.2 |
109.0 |
115.9 |
104.5 |
129.5 |
1998-99 |
80.9 |
93.6 |
97.4 |
95.7 |
92.9 |
93.8 |
94.6 |
99.7 |
108.0 |
118.5 |
108.3 |
131.1 |
1999-00 |
78.1 |
92.6 |
97.1 |
92.8 |
91.7 |
94.3 |
98.1 |
100.7 |
106.0 |
119.4 |
111.2 |
131.6 |
2000-01 |
76.2 |
91.3 |
97.0 |
91.6 |
90.7 |
96.5 |
101.0 |
101.7 |
103.9 |
117.3 |
113.4 |
129.6 |
2001-02 |
75.7 |
91.2 |
97.1 |
92.0 |
90.5 |
98.3 |
103.3 |
102.0 |
101.9 |
114.2 |
113.8 |
127.3 |
2002-03 |
76.5 |
91.3 |
96.7 |
93.8 |
90.7 |
100.6 |
104.2 |
101.9 |
100.4 |
110.8 |
112.8 |
123.6 |
2003-04 |
78.6 |
92.7 |
96.2 |
95.9 |
91.4 |
101.3 |
104.3 |
102.0 |
99.3 |
109.2 |
109.9 |
120.8 |
2004-05 |
81.5 |
93.8 |
94.4 |
97.7 |
93.3 |
102.2 |
103.5 |
101.8 |
98.4 |
108.3 |
106.2 |
118.1 |
2005-06 |
84.6 |
95.6 |
92.9 |
99.4 |
96.3 |
102.7 |
102.3 |
100.5 |
96.8 |
107.2 |
103.3 |
117.2 |
2006-07 |
88.1 |
96.5 |
91.7 |
100.4 |
99.8 |
104.1 |
101.3 |
98.1 |
94.8 |
104.9 |
101.9 |
116.6 |
2007-08 |
91.1 |
97.0 |
92.4 |
101.4 |
102.6 |
105.0 |
100.1 |
95.7 |
92.8 |
102.5 |
101.3 |
116.8 |
2008-09 |
93.7 |
97.0 |
93.6 |
102.3 |
105.0 |
105.9 |
99.0 |
93.6 |
91.6 |
100.2 |
101.2 |
116.7 |
2009-10 |
95.2 |
96.5 |
95.5 |
103.4 |
106.6 |
106.3 |
97.8 |
91.9 |
90.9 |
98.5 |
101.1 |
116.7 |
12. Cargo Handled at Major Ports |
|
|
|
|
|
|
|
|
|
|
|
|
1994-95 |
103.5 |
102.5 |
89.2 |
94.8 |
92.6 |
93.1 |
98.8 |
101.9 |
105.7 |
106.7 |
100.5 |
113.4 |
1995-96 |
103.1 |
102.0 |
89.4 |
95.0 |
92.9 |
93.3 |
99.1 |
101.8 |
105.7 |
106.4 |
100.5 |
113.1 |
1996-97 |
102.1 |
101.3 |
90.2 |
95.7 |
93.6 |
94.0 |
99.6 |
100.9 |
105.5 |
105.7 |
100.6 |
112.4 |
1997-98 |
100.7 |
100.8 |
91.3 |
96.8 |
94.3 |
94.7 |
100.2 |
99.5 |
105.6 |
105.3 |
100.3 |
111.2 |
1998-99 |
99.1 |
100.3 |
93.1 |
97.9 |
95.3 |
95.4 |
100.8 |
98.1 |
105.5 |
104.6 |
99.9 |
109.9 |
1999-00 |
98.2 |
99.9 |
94.8 |
98.8 |
96.4 |
95.5 |
101.2 |
97.3 |
105.6 |
104.1 |
99.1 |
108.7 |
2000-01 |
97.8 |
99.6 |
96.3 |
99.5 |
97.1 |
95.6 |
101.5 |
96.9 |
105.2 |
103.8 |
98.7 |
108.3 |
2001-02 |
97.8 |
99.7 |
96.9 |
99.7 |
97.1 |
94.9 |
102.1 |
97.2 |
104.9 |
104.1 |
98.3 |
108.6 |
2002-03 |
97.8 |
100.0 |
96.5 |
99.4 |
96.9 |
94.3 |
102.5 |
97.9 |
104.1 |
104.5 |
98.2 |
109.6 |
2003-04 |
97.9 |
100.5 |
95.4 |
98.6 |
96.6 |
93.7 |
102.8 |
99.2 |
103.6 |
105.0 |
98.1 |
110.8 |
2004-05 |
97.9 |
101.2 |
94.2 |
97.9 |
96.3 |
93.5 |
102.6 |
100.1 |
103.2 |
105.4 |
98.1 |
111.6 |
2005-06 |
97.8 |
102.1 |
93.4 |
97.5 |
95.9 |
93.3 |
102.1 |
100.7 |
103.3 |
105.7 |
98.1 |
111.7 |
2006-07 |
98.1 |
102.6 |
93.2 |
97.1 |
95.9 |
93.0 |
101.3 |
101.1 |
103.5 |
105.8 |
97.9 |
111.3 |
2007-08 |
98.8 |
102.8 |
93.5 |
96.9 |
96.3 |
92.6 |
100.4 |
101.3 |
103.9 |
105.8 |
97.9 |
110.5 |
2008-09 |
99.5 |
102.7 |
94.0 |
96.9 |
96.4 |
92.3 |
99.8 |
101.3 |
104.1 |
105.9 |
98.0 |
109.9 |
2009-10 |
100.0 |
102.3 |
94.5 |
97.1 |
96.7 |
92.1 |
99.5 |
101.2 |
104.1 |
105.9 |
98.2 |
109.5 |
Table 3: Seasonal Factors of Selected Series for the Last Sixteen Years (Concld.) |
Year |
Apr. |
May |
Jun. |
Jul. |
Aug. |
Sep. |
Oct. |
Nov. |
Dec. |
Jan. |
Feb. |
Mar. |
1 |
2 |
3 |
4 |
5 |
6 |
7 |
8 |
9 |
10 |
11 |
12 |
13 |
13. Revenue on Railway Freight Traffic |
|
|
|
|
|
|
|
|
|
|
|
|
1994-95 |
93.7 |
97.9 |
94.8 |
97.5 |
95.9 |
93.2 |
99.2 |
99.5 |
104.6 |
106.8 |
100.8 |
118.8 |
1995-96 |
93.6 |
97.9 |
94.9 |
97.6 |
95.9 |
93.2 |
99.3 |
99.4 |
104.5 |
106.7 |
100.7 |
118.6 |
1996-97 |
93.7 |
97.8 |
95.3 |
97.7 |
96.0 |
93.3 |
99.5 |
99.1 |
104.5 |
106.3 |
100.5 |
118.2 |
1997-98 |
93.7 |
97.9 |
95.9 |
97.8 |
96.1 |
93.3 |
99.6 |
99.0 |
104.4 |
106.0 |
100.2 |
117.4 |
1998-99 |
93.8 |
98.3 |
96.9 |
97.7 |
95.9 |
93.3 |
99.7 |
99.0 |
104.5 |
105.7 |
99.9 |
116.5 |
1999-00 |
93.8 |
98.9 |
97.4 |
97.8 |
95.6 |
93.4 |
99.7 |
99.2 |
104.5 |
105.5 |
99.5 |
115.4 |
2000-01 |
94.1 |
99.5 |
97.8 |
97.9 |
95.4 |
93.5 |
99.5 |
99.5 |
104.6 |
105.3 |
99.3 |
114.3 |
2001-02 |
94.6 |
100.2 |
97.7 |
98.0 |
95.2 |
93.7 |
99.2 |
99.7 |
104.7 |
105.1 |
98.9 |
113.4 |
2002-03 |
95.3 |
100.9 |
97.6 |
98.0 |
95.1 |
93.9 |
98.8 |
99.6 |
104.8 |
105.1 |
98.8 |
113.0 |
2003-04 |
96.1 |
101.4 |
97.3 |
97.8 |
95.1 |
93.9 |
98.4 |
99.4 |
104.7 |
105.2 |
98.7 |
113.1 |
2004-05 |
97.1 |
101.6 |
97.1 |
97.5 |
95.2 |
93.6 |
98.1 |
99.1 |
104.5 |
105.4 |
98.9 |
113.4 |
2005-06 |
97.7 |
101.7 |
97.1 |
97.2 |
95.2 |
93.3 |
97.8 |
98.8 |
104.3 |
105.7 |
99.0 |
113.9 |
2006-07 |
98.0 |
101.6 |
97.1 |
97.0 |
95.2 |
93.1 |
97.7 |
98.5 |
104.2 |
106.2 |
99.1 |
114.3 |
2007-08 |
98.0 |
101.3 |
97.1 |
97.0 |
95.3 |
93.1 |
97.7 |
98.2 |
104.2 |
106.4 |
99.1 |
114.4 |
2008-09 |
98.0 |
100.9 |
97.0 |
97.2 |
95.6 |
93.3 |
97.8 |
98.0 |
104.3 |
106.3 |
99.1 |
114.3 |
2009-10 |
97.8 |
100.5 |
97.0 |
97.4 |
95.8 |
93.5 |
97.9 |
97.8 |
104.3 |
106.1 |
99.1 |
114.2 |
14. Steel Production |
|
|
|
|
|
|
|
|
|
|
|
|
1994-95 |
96.2 |
98.0 |
93.5 |
98.9 |
102.2 |
100.3 |
98.5 |
97.0 |
102.8 |
103.5 |
97.6 |
112.8 |
1995-96 |
96.3 |
97.9 |
93.6 |
99.0 |
102.1 |
99.9 |
98.5 |
97.1 |
103.1 |
103.5 |
97.6 |
112.5 |
1996-97 |
96.5 |
97.9 |
93.8 |
99.3 |
102.0 |
99.0 |
98.7 |
97.1 |
103.4 |
103.6 |
97.7 |
112.0 |
1997-98 |
96.8 |
97.9 |
94.3 |
99.4 |
101.7 |
98.1 |
98.8 |
97.4 |
103.6 |
103.5 |
97.9 |
111.0 |
1998-99 |
97.0 |
98.2 |
95.3 |
99.3 |
101.0 |
97.3 |
99.2 |
97.9 |
103.7 |
103.5 |
97.9 |
110.1 |
1999-00 |
97.0 |
98.3 |
96.6 |
99.0 |
100.1 |
96.9 |
99.5 |
98.8 |
103.5 |
103.5 |
97.9 |
108.8 |
2000-01 |
96.7 |
98.4 |
98.0 |
98.9 |
99.2 |
96.9 |
100.0 |
99.4 |
103.3 |
103.7 |
98.0 |
108.1 |
2001-02 |
96.2 |
98.1 |
98.7 |
99.0 |
98.6 |
97.2 |
100.5 |
100.1 |
102.9 |
103.8 |
98.1 |
107.8 |
2002-03 |
95.7 |
97.7 |
98.9 |
98.9 |
98.3 |
97.6 |
101.1 |
100.4 |
102.8 |
103.9 |
97.8 |
108.0 |
2003-04 |
95.5 |
97.1 |
98.5 |
98.9 |
98.4 |
97.8 |
101.6 |
100.7 |
102.7 |
103.8 |
97.7 |
108.4 |
2004-05 |
95.7 |
96.9 |
97.7 |
98.5 |
98.8 |
98.0 |
102.3 |
100.4 |
102.7 |
103.4 |
97.4 |
108.7 |
2005-06 |
96.2 |
97.3 |
96.7 |
98.2 |
99.5 |
98.5 |
102.6 |
100.0 |
102.3 |
102.9 |
97.1 |
108.9 |
2006-07 |
96.8 |
98.1 |
96.2 |
97.9 |
100.1 |
98.8 |
102.6 |
99.5 |
101.6 |
102.5 |
96.7 |
108.9 |
2007-08 |
97.2 |
99.1 |
96.2 |
98.1 |
100.4 |
99.2 |
102.2 |
98.9 |
100.7 |
102.2 |
96.6 |
108.8 |
2008-09 |
97.4 |
100.1 |
96.5 |
98.5 |
100.6 |
99.5 |
101.7 |
98.4 |
99.9 |
101.9 |
96.5 |
108.5 |
2009-10 |
97.4 |
101.0 |
97.0 |
98.9 |
100.7 |
99.9 |
101.1 |
97.9 |
99.2 |
101.8 |
96.5 |
108.4 |
15. Exports* |
|
|
|
|
|
|
|
|
|
|
|
|
1994-95 |
103.4 |
96.1 |
94.6 |
96.8 |
99.4 |
97.5 |
98.4 |
93.2 |
103.1 |
100.3 |
98.3 |
122.0 |
1995-96 |
102.9 |
95.8 |
94.5 |
97.4 |
99.2 |
97.8 |
98.5 |
93.6 |
102.8 |
100.3 |
98.8 |
121.3 |
1996-97 |
101.6 |
95.4 |
94.4 |
98.8 |
99.1 |
98.4 |
98.5 |
94.2 |
102.2 |
100.3 |
99.6 |
119.9 |
1997-98 |
100.2 |
95.3 |
94.3 |
99.9 |
99.4 |
99.4 |
98.8 |
94.8 |
101.0 |
100.1 |
100.2 |
118.3 |
1998-99 |
98.4 |
95.5 |
94.6 |
100.5 |
99.8 |
100.7 |
99.5 |
95.4 |
99.2 |
100.0 |
100.5 |
116.6 |
1999-00 |
97.6 |
96.1 |
94.8 |
100.6 |
100.5 |
101.5 |
100.6 |
95.7 |
97.1 |
100.1 |
100.1 |
115.9 |
2000-01 |
97.0 |
97.0 |
95.1 |
100.3 |
100.6 |
102.2 |
101.8 |
95.4 |
95.4 |
100.4 |
99.7 |
116.6 |
2001-02 |
96.7 |
98.2 |
95.3 |
99.4 |
99.8 |
102.6 |
102.2 |
95.0 |
94.6 |
101.4 |
99.4 |
118.6 |
2002-03 |
96.3 |
99.0 |
95.7 |
97.9 |
98.7 |
102.7 |
102.1 |
94.4 |
94.7 |
102.2 |
99.3 |
120.6 |
2003-04 |
95.9 |
99.3 |
96.2 |
97.2 |
98.1 |
102.4 |
100.9 |
93.9 |
95.7 |
102.8 |
99.1 |
121.8 |
2004-05 |
95.5 |
99.6 |
96.9 |
97.2 |
98.2 |
101.8 |
99.5 |
93.2 |
97.2 |
102.2 |
98.5 |
121.4 |
2005-06 |
95.4 |
100.2 |
98.5 |
98.1 |
99.0 |
101.2 |
97.5 |
92.8 |
98.5 |
101.2 |
97.6 |
119.3 |
2006-07 |
96.2 |
100.8 |
100.4 |
99.5 |
100.1 |
100.4 |
96.3 |
92.3 |
99.5 |
99.9 |
96.5 |
116.1 |
2007-08 |
97.7 |
100.9 |
102.1 |
101.6 |
101.2 |
99.7 |
95.6 |
92.0 |
99.7 |
98.9 |
95.7 |
112.8 |
2008-09 |
99.3 |
100.8 |
103.1 |
103.4 |
101.6 |
99.4 |
96.0 |
91.6 |
99.8 |
98.0 |
95.5 |
110.7 |
2009-10 |
100.5 |
100.4 |
103.8 |
104.5 |
101.6 |
99.4 |
96.1 |
91.6 |
99.7 |
97.7 |
95.8 |
109.4 |
16. Imports* |
|
|
|
|
|
|
|
|
|
|
|
|
1994-95 |
93.6 |
104.6 |
94.9 |
98.7 |
96.7 |
96.4 |
103.2 |
100.3 |
101.6 |
103.9 |
99.3 |
107.6 |
1995-96 |
93.8 |
104.3 |
95.0 |
99.6 |
96.2 |
96.7 |
103.0 |
100.0 |
101.9 |
103.4 |
99.2 |
107.2 |
1996-97 |
93.9 |
103.8 |
95.3 |
101.1 |
96.0 |
97.3 |
102.1 |
99.7 |
102.1 |
102.9 |
99.0 |
106.5 |
1997-98 |
94.7 |
103.1 |
95.2 |
102.7 |
96.1 |
98.6 |
101.2 |
99.3 |
101.9 |
101.8 |
98.5 |
106.2 |
1998-99 |
95.2 |
102.7 |
95.3 |
104.3 |
96.6 |
99.7 |
100.6 |
98.7 |
101.6 |
100.9 |
97.3 |
106.0 |
1999-00 |
96.1 |
102.9 |
94.8 |
105.1 |
97.5 |
101.0 |
100.9 |
98.3 |
100.7 |
100.4 |
95.2 |
106.4 |
2000-01 |
96.7 |
103.8 |
94.7 |
104.8 |
98.5 |
101.5 |
101.6 |
97.8 |
100.1 |
100.3 |
93.0 |
107.0 |
2001-02 |
97.3 |
105.0 |
94.8 |
103.3 |
98.7 |
101.8 |
102.7 |
97.8 |
99.3 |
100.5 |
91.6 |
107.4 |
2002-03 |
97.3 |
106.5 |
95.4 |
101.2 |
99.0 |
102.0 |
103.4 |
97.3 |
99.5 |
100.7 |
91.2 |
107.4 |
2003-04 |
96.9 |
107.3 |
96.2 |
99.7 |
99.1 |
103.3 |
104.0 |
96.8 |
99.2 |
100.7 |
90.2 |
106.5 |
2004-05 |
96.6 |
107.8 |
97.6 |
99.1 |
99.7 |
104.9 |
104.1 |
96.5 |
98.6 |
100.0 |
89.5 |
104.7 |
2005-06 |
96.3 |
107.5 |
99.0 |
100.2 |
100.5 |
107.5 |
104.2 |
97.0 |
97.0 |
98.7 |
87.9 |
101.8 |
2006-07 |
97.0 |
107.6 |
100.3 |
102.1 |
102.2 |
109.1 |
104.2 |
97.7 |
95.5 |
97.0 |
86.6 |
99.0 |
2007-08 |
97.7 |
107.0 |
101.3 |
104.5 |
103.7 |
110.1 |
104.8 |
98.7 |
94.2 |
95.3 |
85.4 |
96.4 |
2008-09 |
98.9 |
106.3 |
102.2 |
106.4 |
104.7 |
109.9 |
105.6 |
99.5 |
93.8 |
93.8 |
85.3 |
94.9 |
2009-10 |
99.5 |
105.0 |
102.8 |
107.7 |
105.5 |
109.8 |
105.9 |
100.1 |
93.9 |
92.9 |
85.6 |
94.0 |
* Valued in US Dollar |
Table 4: Peak/Trough Month During 2009-10 |
Name of Variable |
Peak/Trough |
Apr. |
May |
Jun. |
Jul. |
Aug. |
Sep. |
Oct. |
Nov. |
Dec. |
Jan. |
Feb. |
Mar. |
1 |
2 |
3 |
4 |
5 |
6 |
7 |
8 |
9 |
10 |
11 |
12 |
13 |
A. |
Monetary and Banking Aggregates |
|
|
|
|
|
|
|
|
|
|
|
|
A.1.1 |
Broad Money (M3 ) |
|
|
|
|
|
|
|
|
T |
|
|
P |
A.1.1.1 |
Net Bank Credit to Government |
P |
|
|
|
|
|
|
|
T |
|
|
|
A.1.1.2 |
Bank Credit to Commercial Sector |
|
|
|
T |
|
|
|
|
|
|
|
P |
A.1.2 |
Narrow Money (M1 ) |
|
|
|
|
|
|
|
T |
|
|
|
P |
A.1.2.1 |
Currency with Public |
|
P |
|
|
|
T |
|
|
|
|
|
|
A.1.3 |
Reserve Money (M0 ) |
|
|
|
|
|
|
|
|
|
T |
|
P |
A.1.3.1 |
Currency in Circulation |
|
P |
|
|
|
T |
|
|
|
|
|
|
A.1.3.1.1 |
Notes in Circulation |
|
P |
|
|
|
T |
|
|
|
|
|
|
A.2.1 |
Deposits (Banking Department) |
|
|
|
|
|
P |
|
|
|
T |
|
|
A.2.2 |
Liabilities to the Banking System (SCBs) |
|
|
|
|
|
|
|
|
|
T |
|
P |
A.2.3 |
Aggregate Deposits (SCBs) |
P |
|
|
|
|
|
|
|
T |
|
|
|
A.2.3.1 |
Demand Deposits (SCBs) |
|
|
|
|
|
|
|
T |
|
|
|
P |
A.2.3.2 |
Time Deposits (SCBs) |
P |
|
|
|
|
|
|
|
T |
|
|
|
A.3.1 |
Balances held Abroad |
|
T |
|
|
P |
|
|
|
|
|
|
|
A.3.2 |
Investments (RBI) |
|
|
|
|
|
|
|
|
P |
T |
|
|
A.3.3 |
Cash in Hand and Balances with RBI (SCBs) |
|
T |
|
|
|
P |
|
|
|
|
|
|
A.3.4 |
Assets with Banking System (SCBs) |
|
|
|
|
|
|
|
|
|
T |
|
P |
A.3.5 |
Bank Credit (SCBs) |
|
|
|
|
T |
|
|
|
|
|
|
P |
A.3.5.1 |
Loans, Cash, Credits and Overdrafts (SCBs) |
|
|
|
|
T |
|
|
|
|
|
|
P |
A.3.5.2 |
Food Credit (SCBs) |
|
|
P |
|
|
T |
|
|
|
|
|
|
A.3.5.3 |
Non-Food Credit (SCBs) |
|
|
|
|
T |
|
|
|
|
|
|
P |
A.3.6 |
Investments (SCBs) |
P |
|
|
|
|
|
|
|
T |
|
|
|
B. |
WPI (Base 1993-94=100) All Commodities |
|
|
|
|
|
P |
|
|
|
|
T |
|
B.1 |
WPI - Primary Article |
|
|
|
P |
|
|
|
|
|
|
T |
|
B.1.1 |
WPI - Food Articles |
|
|
|
|
|
|
|
P |
|
|
|
T |
B.1.1.1 |
WPI - Food Grains (Cereals+Pulses) |
|
|
T |
|
|
|
|
P |
|
|
|
|
B.1.1.1.1 |
WPI - Cereals |
|
|
T |
|
|
|
|
|
|
|
P |
|
B.1.1.1.1.1 |
WPI - Rice |
|
|
T |
|
|
|
|
P |
|
|
|
|
B.1.1.1.1.2 |
WPI - Wheat |
|
T |
|
|
|
|
|
|
|
P |
|
|
B.1.1.1.2 |
WPI - Pulses |
|
|
|
|
|
|
|
P |
|
|
|
T |
B.1.1.2 |
WPI - Fruits & Vegetables |
|
|
|
|
|
P |
|
|
|
|
|
T |
B.1.1.2.1 |
WPI - Potatoes |
|
|
|
|
|
|
P |
|
|
|
T |
|
B.1.1.2.2 |
WPI - Onions |
|
T |
|
|
|
P |
|
|
|
|
|
|
B.1.1.3 |
WPI - Milk |
|
|
P |
|
|
|
|
|
|
T |
|
|
B.1.2 |
WPI - Non-Food Articles |
|
|
|
P |
|
|
|
|
T |
|
|
|
B.1.2.1 |
WPI - Fibres |
|
|
|
P |
|
|
|
|
|
|
T |
|
B.1.2.1.1 |
WPI - Raw Cotton |
|
|
|
P |
|
|
|
|
|
|
T |
|
B.1.2.2 |
WPI - Oil Seeds |
|
|
|
P |
|
|
|
|
T |
|
|
|
B.2 |
WPI - Manufactured Products |
|
|
|
|
P |
|
|
|
|
|
T |
|
B.2.1 |
WPI - Food Products |
|
|
|
|
|
|
|
|
T |
|
P |
|
B.2.1.1 |
WPI - Grain Mill Products |
|
|
T |
|
|
|
|
P |
|
|
|
|
B.2.1.2 |
WPI - Sugar |
|
|
|
|
|
P |
|
|
T |
|
|
|
B.2.1.3 |
WPI - Edible Oils |
T |
|
|
P |
|
|
|
|
|
|
|
|
Table 4: Peak/Trough Month During 2009-10 (Concld.) |
Name of Variable |
Peak/Trough |
Apr. |
May |
Jun. |
Jul. |
Aug. |
Sep. |
Oct. |
Nov. |
Dec. |
Jan. |
Feb. |
Mar. |
1 |
2 |
3 |
4 |
5 |
6 |
7 |
8 |
9 |
10 |
11 |
12 |
13 |
C.1 |
Consumer Price Index for Industrial Workers (2001=100) |
|
|
|
|
|
|
P |
|
|
|
|
T |
C.2 |
Consumer Price Index for Urban Non-Manual Employees (Base: 1984-85=100) |
|
|
|
|
|
|
P |
|
|
|
|
T |
C.3 |
Consumer Price Index for Agricultural Labourers (Base: 1986-87=100) |
T |
|
|
|
|
|
P |
|
|
|
|
|
C.4 |
Consumer Price Index for Rural Labourers (Base: 1986-87=100) |
T |
|
|
|
|
|
P |
|
|
|
|
|
D. |
IIP - General Index |
T |
|
|
|
|
|
|
|
|
|
|
P |
D.1.1 |
IIP - Basic Goods Industries |
|
|
|
|
|
T |
|
|
|
|
|
P |
D.1.2 |
IIP - Capital Goods Industries |
T |
|
|
|
|
|
|
|
|
|
|
P |
D.1.3 |
IIP - Intermediate Goods Industries |
P |
|
|
|
|
|
|
|
T |
|
|
|
D.1.4 |
IIP - Consumer Goods Industries |
|
|
|
|
|
|
T |
|
|
P |
|
|
D.1.4.1 |
IIP - Consumer Durable Goods Industries |
|
|
|
|
|
P |
|
|
T |
|
|
|
D.1.4.2 |
IIP - Consumer Non-Durable Goods Industries |
|
|
|
|
|
|
T |
|
P |
|
|
|
D.2.1 |
IIP - Mining |
|
|
|
|
|
T |
|
|
|
|
|
P |
D.2.2 |
IIP- Manufacturing |
|
|
|
|
|
|
T |
|
|
|
|
P |
D.2.2.1 |
IIP - Food Products |
|
|
|
|
T |
|
|
|
|
P |
|
|
D.2.2.2 |
IIP - Cotton Textiles |
|
|
|
|
|
|
|
|
P |
|
T |
|
D.2.2.3 |
IIP - Textile Products (including Wearing Apparel) |
|
|
|
|
|
|
T |
|
|
|
|
P |
D.2.2.4 |
IIP - Leather and Leather & Fur Products |
T |
|
|
P |
|
|
|
|
|
|
|
|
D.2.2.5 |
IIP - Basic Chemicals & Chemical Products (except products of Petroleum & Coal) |
|
|
|
P |
|
|
|
|
|
|
T |
|
D.2.2.6 |
IIP - Rubber, Plastic, Petroleum and Coal Products |
|
|
|
|
|
|
T |
|
|
|
|
P |
D.2.2.7 |
IIP - Non-metallic Mineral Products |
|
|
|
|
|
|
|
T |
|
|
|
P |
D.2.2.8 |
IIP - Basic Metal and Alloy Industries |
T |
|
|
|
|
|
|
|
|
|
|
P |
D.2.2.9 |
IIP - Metal Products & Parts (except Machinery & Equipments) |
|
|
|
|
|
|
|
|
|
P |
T |
|
D.2.2.10 |
IIP -Machinery & Equipment (other than Transport Equipment) |
T |
|
|
|
|
|
|
|
|
|
|
P |
D.2.2.11 |
IIP - Transport Equipment & Parts |
|
|
|
|
|
|
|
|
T |
|
|
P |
D.2.2.12 |
IIP - Other Manufacturing Industries |
T |
|
|
|
|
|
|
|
P |
|
|
|
D.2.3 |
IIP - Electricity |
|
|
|
|
|
|
|
|
|
|
T |
P |
D.3 |
Cement Production |
|
|
|
|
T |
|
|
|
|
|
|
P |
D.4 |
Steel Production |
|
|
|
|
|
|
|
|
|
|
T |
P |
D.5 |
Production of Commercial Motor Vehicles |
|
|
|
|
|
|
|
|
T |
|
|
P |
E.1 |
Cargo handled at Major Ports |
|
|
|
|
|
T |
|
|
|
|
|
P |
E.2 |
Revenue on Railway Freight Traffic |
|
|
|
|
|
T |
|
|
|
|
|
P |
F. |
External Trade |
|
|
|
|
|
|
|
|
|
|
|
|
F.1 |
Exports* |
|
|
|
|
|
|
|
T |
|
|
|
P |
F.2 |
Imports* |
|
|
|
|
|
P |
|
|
|
|
T |
|
F.2.1 |
Non-Oil Imports* |
|
|
|
P |
|
|
|
|
|
|
T |
|
Total Counts |
|
|
|
|
|
|
|
|
|
|
|
|
Peak |
5 |
3 |
2 |
9 |
2 |
8 |
5 |
5 |
4 |
4 |
2 |
28 |
Trough |
9 |
4 |
4 |
1 |
5 |
8 |
5 |
4 |
13 |
6 |
13 |
5 |
P- Peak Month
T - Trough Month |
Table 5: Classification of Variables as per Seasonal Variation in 2009-10 (Range) and
Change in Seasonal Variation over Time (Trend) |
Name of Variable |
Range Value - 2009-10 |
0-5 |
5-10 |
10-20 |
20-30 |
>30 |
Trend |
1 |
2 |
3 |
4 |
5 |
6 |
7 |
A. |
Monetary and Banking Aggregates |
|
|
|
|
|
|
A.1.1 |
Broad Money (M3 ) |
3.2 |
|
|
|
|
U |
A.1.1.1 |
Net Bank Credit to Government |
|
6.0 |
|
|
|
U |
A.1.1.2 |
Bank Credit to Commercial Sector |
4.2 |
|
|
|
|
U |
A.1.2 |
Narrow Money (M1 ) |
|
7.3 |
|
|
|
U |
A.1.2.1 |
Currency with Public |
|
7.1 |
|
|
|
D |
A.1.3 |
Reserve Money (M0 ) |
|
7.2 |
|
|
|
U |
A.1.3.1 |
Currency in Circulation |
|
6.9 |
|
|
|
D |
A.1.3.1.1 |
Notes in Circulation |
|
6.8 |
|
|
|
D |
A.2.1 |
Deposits (Banking Department) |
|
|
13.7 |
|
|
U |
A.2.2 |
Liabilities to the Banking System (SCBs) |
|
|
10.3 |
|
|
U |
A.2.3 |
Aggregate Deposits (SCBs) |
2.7 |
|
|
|
|
U |
A.2.3.1 |
Demand Deposits (SCBs) |
|
|
11.9 |
|
|
U |
A.2.3.2 |
Time Deposits (SCBs) |
2.8 |
|
|
|
|
U |
A.3.1 |
Balances held Abroad |
|
|
11.2 |
|
|
D |
A.3.2 |
Investments (RBI) |
|
|
|
|
45.8 |
U |
A.3.3 |
Cash in Hand and Balances with RBI (SCBs) |
|
|
14.7 |
|
|
U |
A.3.4 |
Assets with Banking System (SCBs) |
|
|
15.2 |
|
|
U |
A.3.5 |
Bank Credit (SCBs) |
4.1 |
|
|
|
|
U |
A.3.5.1 |
Loans, Cash, Credits and Overdrafts (SCBs) |
4.2 |
|
|
|
|
U |
A.3.5.2 |
Food Credit (SCBs) |
|
|
|
20.6 |
|
U |
A.3.5.3 |
Non-Food Credit (SCBs) |
4.2 |
|
|
|
|
U |
A.3.6 |
Investments (SCBs) |
3.0 |
|
|
|
|
D |
B. |
WPI (Base 1993-94=100) All Commodities |
2.8 |
|
|
|
|
U |
B.1 |
WPI - Primary Article |
3.1 |
|
|
|
|
D |
B.1.1 |
WPI - Food Articles |
4.0 |
|
|
|
|
D |
B.1.1.1 |
WPI - Food Grains (Cereals+Pulses) |
2.1 |
|
|
|
|
U |
B.1.1.1.1 |
WPI - Cereals |
2.1 |
|
|
|
|
U |
B.1.1.1.1.1 |
WPI - Rice |
1.2 |
|
|
|
|
D |
B.1.1.1.1.2 |
WPI - Wheat |
|
5.5 |
|
|
|
D |
B.1.1.1.2 |
WPI - Pulses |
|
5.2 |
|
|
|
D |
B.1.1.2 |
WPI - Fruits & Vegetables |
|
|
16.3 |
|
|
D |
B.1.1.2.1 |
WPI - Potatoes |
|
|
|
|
48.2 |
D |
B.1.1.2.2 |
WPI - Onions |
|
|
|
|
41.7 |
D |
B.1.1.3 |
WPI - Milk |
0.6 |
|
|
|
|
D |
B.1.2 |
WPI - Non-Food Articles |
3.8 |
|
|
|
|
U |
B.1.2.1 |
WPI - Fibres |
|
6.4 |
|
|
|
U |
B.1.2.1.1 |
WPI - Raw Cotton |
|
7.6 |
|
|
|
U |
B.1.2.2 |
WPI - Oil Seeds |
3.9 |
|
|
|
|
D |
B.2 |
WPI - Manufactured Products |
1.9 |
|
|
|
|
U |
B.2.1 |
WPI - Food Products |
1.2 |
|
|
|
|
D |
B.2.1.1 |
WPI - Grain Mill Products |
4.4 |
|
|
|
|
D |
B.2.1.2 |
WPI - Sugar |
2.3 |
|
|
|
|
U |
B.2.1.3 |
WPI - Edible Oils |
1.6 |
|
|
|
|
D |
Table 5: Classification of Variables as per seasonal variation in 2009-10 (Range) and change in seasonal variation over time (trend) (Concld.) |
Name of Variable |
Range Value - 2009-10 |
0-5 |
5-10 |
10-20 |
20-30 |
>30 |
Trend |
1 |
2 |
3 |
4 |
5 |
6 |
7 |
C.1 |
Consumer Price Index for Industrial Workers (2001=100) |
1.9 |
|
|
|
|
D |
C.2 |
Consumer Price Index for Urban Non-Manual Employees (Base: 1984-85=100) |
2.3 |
|
|
|
|
U |
C.3 |
Consumer Price Index for Agricultural Labourers (Base: 1986-87=100) |
2.6 |
|
|
|
|
U |
C.4 |
Consumer Price Index for Rural Labourers (Base: 1986-87=100) |
2.5 |
|
|
|
|
U |
D. |
IIP - General Index |
|
|
12.8 |
|
|
U |
D.1.1 |
IIP - Basic Goods Industries |
|
|
10.8 |
|
|
U |
D.1.2 |
IIP - Capital Goods Industries |
|
|
|
|
46.4 |
U |
D.1.3 |
IIP - Intermediate Goods Industries |
3.1 |
|
|
|
|
U |
D.1.4 |
IIP - Consumer Goods Industries |
|
|
15.8 |
|
|
D |
D.1.4.1 |
IIP - Consumer Durable Goods Industries |
|
|
18.0 |
|
|
U |
D.1.4.2 |
IIP - Consumer Non-Durable Goods Industries |
|
|
|
24.3 |
|
D |
D.2.1 |
IIP - Mining |
|
|
|
25.1 |
|
U |
D.2.2 |
IIP - Manufacturing |
|
|
13.3 |
|
|
U |
D.2.2.1 |
IIP - Food Products |
|
|
|
|
87.5 |
U |
D.2.2.2 |
IIP - Cotton Textiles |
|
6.2 |
|
|
|
D |
D.2.2.3 |
IIP - Textile Products (including Wearing Apparel) |
|
10.0 |
|
|
|
U |
D.2.2.4 |
IIP - Leather and Leather & Fur Products |
|
|
|
23.1 |
|
U |
D.2.2.5 |
IIP - Basic Chemicals & Chemical Products (except products of Petroleum & Coal) |
|
|
11.9 |
|
|
U |
D.2.2.6 |
IIP - Rubber, Plastic, Petroleum and Coal Products |
|
|
10.5 |
|
|
U |
D.2.2.7 |
IIP - Non-metallic Mineral Products |
|
|
14.6 |
|
|
D |
D.2.2.8 |
IIP - Basic Metal and Alloy Industries |
|
|
12.2 |
|
|
U |
D.2.2.9 |
IIP - Metal Products & Parts (except Machinery & Equipments) |
|
|
|
|
30.3 |
U |
D.2.2.10 |
IIP -Machinery & Equipment (other than Transport Equipment) |
|
|
|
|
33.4 |
U |
D.2.2.11 |
IIP - Transport Equipment & Parts |
|
|
17.3 |
|
|
D |
D.2.2.12 |
IIP - Other Manufacturing Industries |
|
|
|
|
49.2 |
U |
D.2.3 |
IIP - Electricity |
|
|
10.4 |
|
|
D |
D.3 |
Cement Production |
|
|
|
20.8 |
|
D |
D.4 |
Steel Production |
|
|
11.8 |
|
|
D |
D.5 |
Production of Commercial Motor Vehicles |
|
|
|
25.8 |
|
D |
E.1 |
Cargo handled at Major Ports |
|
|
17.5 |
|
|
U |
E.2 |
Revenue on Railway Freight Traffic |
|
|
|
20.6 |
|
U |
F. |
External Trade |
|
|
|
|
|
|
F.1 |
Exports* |
|
|
17.8 |
|
|
D |
F.2 |
Imports* |
|
|
|
24.3 |
|
U |
F.2.1 |
Non-Oil Imports* |
|
|
18.6 |
|
|
U |
Total |
|
26 |
10 |
23 |
9 |
9 |
D: 29 |
| |
|
|
|
|
|
|
U:48
|
D - Decreasing Trend
U - Upward Trend |
Annex |
Sl. No. |
Name of the Series |
Monetary and Banking Aggregates |
1 |
Broad Money (M3 ) |
2 |
Net Bank Credit to Government |
3 |
Bank Credit to Commercial Sector |
4 |
Narrow Money (M1 ) |
5 |
Currency with Public |
6 |
Reserve Money (M0 ) |
7 |
Currency in Circulation |
8 |
Notes in Circulation |
9 |
Deposits (Banking Department) |
10 |
Liabilities to the Banking System (SCBs) |
11 |
Aggregate Deposits (SCBs) |
12 |
Demand Deposits (SCBs) |
13 |
Time Deposits (SCBs) |
14 |
Balances held Abroad (RBI) |
15 |
Investments (RBI) |
16 |
Cash in Hand and Balances with RBI (SCBs) |
17 |
Assets with Banking System (SCBs) |
18 |
Bank Credit (SCBs) |
19 |
Loans, Cash, Credits and Overdrafts (SCBs) |
20 |
Food Credit (SCBs) |
21 |
Non-Food Credit (SCBs) |
22 |
Investments (SCBs) |
Wholesale Price Index (WPI) |
23 |
WPI (Base: 1993-94=100) All Commodities |
24 |
WPI - Primary Article |
25 |
WPI - Food Articles |
26 |
WPI - Food Grains (Cereals+Pulses) |
27 |
WPI - Cereals |
28 |
WPI - Wheat |
29 |
WPI - Rice |
30 |
WPI - Pulses |
31 |
WPI - Fruits & Vegetables |
32 |
WPI - Potatoes** |
33 |
WPI - Onions** |
34 |
WPI - Milk** |
35 |
WPI - Non-Food Articles |
36 |
WPI - Fibres |
37 |
WPI - Raw Cotton |
38 |
WPI - Oil Seeds |
39 |
WPI - Manufactured Products |
40 |
WPI - Food Products |
41 |
WPI - Grain Mill Products |
42 |
WPI - Sugar |
43 |
WPI - Edible Oils |
Annex (Concld.) |
Sl. No. |
Name of the Series |
Consumer Price Index (CPI) |
44 |
Consumer Price Index for Industrial Workers (Base: 2001=100) |
45 |
Consumer Price Index for Urban Non-Manual Employees (Base: 1984-85=100) |
46 |
Consumer Price Index for Agricultural Labourers (Base: 1986-87=100) |
47 |
Consumer Price Index for Rural Labourers (Base: 1986-87=100) |
Industrial Production |
48 |
IIP - General Index |
49 |
IIP - Basic Goods Industries |
50 |
IIP - Capital Goods Industries |
51 |
IIP - Intermediate Goods Industries |
52 |
IIP - Consumer Goods Industries |
53 |
IIP - Consumer Durable Goods Industries |
54 |
IIP - Consumer Non-Durable Goods Industries |
55 |
IIP - Mining |
56 |
IIP - Manufacturing |
57 |
IIP - Food Products |
58 |
IIP - Cotton Textiles |
59 |
IIP - Textile Products (including Wearing Apparel) |
60 |
IIP - Leather and Leather & Fur Products |
61 |
IIP - Basic Chemicals & Chemical Products (except products of Petroleum & Coal) |
62 |
IIP - Rubber, Plastic, Petroleum and Coal Products |
63 |
IIP - Non-metallic Mineral Products |
64 |
IIP - Basic Metal and Alloy Industries |
65 |
IIP - Metal Products & Parts (except Machinery & Equipments) |
66 |
IIP - Machinery & Equipment (other than Transport Equipment) |
67 |
IIP - Transport Equipment & Parts |
68 |
IIP - Other Manufacturing Industries |
69 |
IIP - Electricity |
70 |
Cement Production |
71 |
Steel Production |
72 |
Production of Commercial Motor Vehicles |
Services Sector Indicators |
73 |
Cargo handled at Major Ports |
74 |
Revenue on Railway Freight Traffic |
External Trade |
75 |
Exports* |
76 |
Imports* |
77 |
Non-Oil Imports* |
* Valued in US Dollar
** New Series Added |
* Prepared in the Forecasting Division of the Department of Statistics and Information Management. The previous study in this series was published in the September 2009 issue of the Reserve Bank of India Bulletin. 1 For methodological details, kindly refer to the technical note annexed with the article ‘Monthly Seasonal Factors of Selected Economic Time Series’, Reserve Bank of India Bulletin, December 1999, Vol. LIII. Number 12, pp 1329 to 1331. |