Railway Budget 2009-10: Review and Assessment* The article presents an overview of the Railway Budget for 2009-10 and a review of performance of the Railways during 2008-09. The Railway Budget 2009-10 continued with the competitive pricing strategy to improve passenger earnings. The Budget undertook various policy initiatives focussing on expansion of connectivity, improvement of passenger amenities and revenue augmentation of the Railways. It accorded priority to upgradation of stations, technological upgradation, expansion of wagon capacity, multi-functional complexes, ticketing and reservation, safety, and customer service. The Budget proposed specific measures such as construction and operation of freight terminals and multi-modal logistic parks to improve the freight business. Passenger fares and freight charges were unchanged. The financial performance of Indian Railways which deteriorated in the revised estimates for 2008-09 is slated to deteriorate further during 2009-10. Overview
The Railway Budget for 2009-10 was presented to Parliament on July 3, 2009. The Budget provided estimates for 2009-10 while retaining the revised estimates for 2008-09 as provided in the Interim Railway Budget. Several measures in respect of passenger amenities and freight initiatives have been announced in the Budget. The Railway Budget 2009-10 envisages moderate growth of gross traffic receipts in passenger and freight segments while aiming for the improved quality of services. Budget accords priority to technological up-gradation, expansion of wagon capacity, safety, multifunctional complexes, ticketing and reservation, and customer services. In order to expand the revenue from freight, the Budget proposed to increase their share in traffic streams like automobiles, iron ore, cement, fertilisers and foodgrains.
The revenue targets set out in the Railway Budget 2009-101 were based against the expected deceleration in the growth of freight loading and passenger travels. The revenue earning originating from freight traffic is expected to increase by 32 million tonnes to 882 million tonnes (by 3.8 per cent) in 2009-10 from 850 million tonnes in 2008-09. The originating passenger traffic is estimated to go up by about 6.0 per cent. However, with the freight and passenger fares kept unchanged, the projected growth of 7.3 per cent in gross traffic receipts in 2009-10 would be lower than the growth of 14.9 per cent in the previous year. The increase in working expenses are budgeted to moderate to 12.7 per cent from 33.1 per cent in the previous year primarily on account of lower provision to the depreciation reserve fund. However, due to lower growth in gross traffic earnings, the operating ratio, i.e., the ratio of total working expenses to gross traffic earnings, is estimated to go up to 92.5 per cent during 2009-10 from 88.3 per cent during 2008-09 (RE). The revised estimates have placed the gross traffic receipts in 2008-09 at Rs.82,393 crore, higher than the budget estimates of Rs.81,901 crore. The total working expenses in 2008-09 are placed at Rs.72,490 crore, which is higher by 8.9 per cent than the budget estimate of Rs.66,590 crore. As a result, the operating ratio in 2008-09 deteriorated to 88.3 per cent from the budgeted level of 81.4 per cent.
The note is organised into four sections. Section I sets out the major policy initiatives announced in the Budget. Sections II and III discuss the revised estimates for 2008-09 and the Budget estimates for 2009-10, respectively. The note concludes with an overall assessment of the Railway Budget 2009-10.
Section I: Major Policy Initiatives
The Railway Budget 2009-10 proposes to continue with the process of improving the quality of passenger services, modernisation, technological upgradation, greater application of information technology and enhancement of safety and security measures (Box 1). It also proposes to improve capacity utilisation without changing the basic fare structure.
Upgradation of Station
The Budget has proposed to develop about 50 stations as world class stations with international level facilties. These will be developed, through innovative financing and in Public Private Partnership mode. Further, 309 stations are identified to be developed as ‘Adarsh’ stations with all basic facilities. Box 1: Major Policy Initiatives/Proposed New Projects 1. Priority areas are perceptible improvement in Cleanliness, Quality of Railway Catering, Safety and Security and Punctuality. All Railway zones have been instructed to give priority to provision of good quality food, drinking water and toilet facilities and ensure cleanliness on trains and stations. 50 stations would be developed as world class stations with international level facilities. Railways will extend a helping hand to Physically Challenged persons and aged persons by providing standard ramps, earmarked parking lots, specially designed coaches in each mail and express train, lifts and escalators in a phased manner.
2. Railways would explore the possibility to depute at least one doctor in long distance trains.
3. The number of Unreserved Ticketing System terminals would be expanded from 5000 to 8000. Automatic Vending Machines would be installed at 200 large and medium sized stations. Efforts will be made to provide SMS update on waitlisted tickets and indicate berth numbers on confirmed ticket by the end of the financial year. Mobile ticketing vans “Mushkil Aasaan” would be introduced for issuing reserved and unreserved tickets in both urban and rural areas.
4. High capacity air conditioned double-decker coaches would be introduced for intercity travel. For improved safety, timely track renewal, modernisation of signals and use of various safety equipment like digital ultrasonic flaw detecting machines and wheel impact load detecters would be undertaken. Installation of Anti collision device (ACD) will be expanded.
5. For Railway employees, improvement of staff and colonies would be undertaken. Scholarships for higher education of girl children has been proposed. Further, medical colleges are planned to be established through PPP.
6. A Committee would be constituted to suggest further innovations and to utilise the optic fiber cables network of the railway and take information technology to the door steps in remote areas.‘
7. Several measures are being taken to improve the proportion of freight traffic movement on Railways. Private ownership of special purpose rolling stock for commodities and private operation of freight terminals would be encouraged. Railways would encourage creation of facilities for setting up cold storage and temperature controlled perishable cargo centres and its transportation through public private partnership mode. Railways would seek to increase their share in new traffic streams like automobiles, fly ash etc. Technological Upgradation
The Railway Ministry has proposed to constitute an Expert Committee (Chairman: Shri Sam Pitroda) to suggest further innovations for utilising the optic fibre cables network of the Railways for ensuring the reach of information technology to remote areas.
Expansion of Wagon Capacity
During the year 2009-10 Railways have planned to acquire 18,000 wagons under rolling stock programme as against 11,000 in 2008-09. In view of the growing demand of wagons it has been proposed to initiate the process of taking over wagon units of Burn Standard and Braithwaite.
Multi-functional Complexes
The Railway Budget has announced for construction of multi-functional complexes in station premises for providing rail users facilities like shopping, food stalls and restaurants, book stalls, PCO/STD/ISD/Fax booths, medicine and variety stores, budget hotels, and underground parking, etc. The development of these facilities would be entrusted to Indian Railway Construction Corporation and Rail Land Development Authority. Special trains are proposed to be introduced for perishable goods like fruits and vegetables.
Ticketing and Reservation
At present Indian Railways Passenger Reservation System (PRS) covers 800 locations with 6,872 terminals. An additional 200 new towns and cities and 800 new locations in cities and towns already having PRS facilities would be covered. The number of Unreserved Ticketing System (UTS) terminals would be expanded from 5,000 to 8,000. Automatic Vending Machines would be installed at 200 large and medium sized stations. The e-ticketing has been proposed to be expanded. Cancellation of confirmed e-tickets after preparation of charts is proposed to be further simplified. Efforts have been initiated to provide SMS update on waitlisted tickets and to indicate berth numbers on confirmed ticket by the end of the financial year.
Safety
At present safety measures include timely track renewal, modernisation of signals, use of various safety equipments like digital ultrasonic flaw detecting machines and wheel impact load detectors (WILD). A target of 3,500 kms has been kept for 2009-10 for track renewal. Out of 66,565 kms of broad gauge track, 57,345 kms has been brought under mechanised maintenance. Anti Collision Device (ACD) to prevent incidents of train collisions has been made operational on 1,736 Kms of North Frontier Railway. It has been proposed to extend this system on three railway zones viz., Southern, South Central and South Western Railways covering 1,700 Kms in the next two years.
Freight Business
Several measures have been undertaken to improve the proportion of freight traffic moving on Railways.
- Railways seek to increase their share in new traffic streams like automobiles, fly ash besides improving the loading of coal, iron ore, cement, fertilisers and foodgrains.
- Permission to access private sidings would be given to containers which would help in attracting piecemeal traffic at present not being carried by Railways.
- A premium service for container movement with assured transit time would be considered for time sensitive cargo.
- Private ownership of special purpose rolling stock for commodities and private operation of freight terminals would be encouraged.
- A new policy would be unveiled to allow construction and operation of private freight terminals and multi-modal logistic parks.
- Railways are also in the process of bringing together state governments and major logistics players to set up logistics parks co-habited by multiple players through participative funding.
- Mega logistics hubs are being planned alongside the proposed Eastern and Western Dedicated Freight Corridors.
Passenger Fare and Freight Proposals
There was no increase in passenger and freight rates. Some of the other concessions announced in the Budget include: a new scheme known as ‘Izzat’, under which, a uniformally priced monthly season ticket of Rs.25 would be available free of all surcharges for travel up to 100 kms for members of the unorganised sector with monthly income not exceeding Rs.1,500; concession of 30 per cent for press correspondents would be increased to 50 per cent and permission to travel with spouse at 50 per cent concession would be given once in a year; the free monthly season tickets for second class travel between school and home for girl students up to graduation and for boy students up to 12th standard would be extended to students attending Madrasa, High Madrasa and Senior Madrasa; and ‘Yuva Trains’ dedicated for the young generation would be introduced.
Kisan-Vision Project
Railways would encourage creation of facilities of setting up cold storage and temperature controlled perishable cargo centres and its transportation through public private partnership mode for transport of fruits and vegetables. In order to accomplish this task, the Ministry would associate professional agency to identify locations and designing proper services. With a view to promoting small industries sector, it was proposed to facilitate movement of village handicraft, cottage industry and textile products from production clusters like Tirupur, Dhanekhali and Shantipur to consumption centres.
Section II: Revised Estimates: 2008-092
The passenger earnings for 2008-09 in the Revised Estimates (RE) at Rs.22,330 crore and freight earnings at Rs.54,293 crore were higher than the Budget Estimates (BE) by 3.0 per cent each. Earnings from other coaching (including parcel and luggage) were estimated to be same (Rs.2,420 crore). Thus, the gross traffic receipts in 2008-09 were estimated at Rs.82,393 crore (0.6 per cent higher than the budgeted level). However, the total working expenses are expected to increase by 8.9 per cent to Rs.72,490 crore on account of increase in net ordinary working expenses (10.0 per cent) and appropriation to the pension fund (9.4 per cent) arising from the implementation of the Sixth Pay Commission award. Consequently, the surplus of the Railways declined to Rs.6,355 crore in the RE of 2008-09 from Rs.11,787 crore projected in the BE. As a result, appropriation to capital fund declined by Rs.5,875 crore from Rs.10,840 crore in the BE. There was also deterioration in the operating ratio to 88.3 per cent in the RE from 81.4 per cent in the BE. The net return on capital investment went down to 10.6 per cent in the RE from 15.8 per cent in the BE (Statement 1). It may be indicated that the deceleration in the financial ratios was on account of provision made for implementing Sixth Pay Commission award, which in the RE turned out to be much larger than in the BE.
Section III: Budget Estimates: 2009-103
The major thrust of the Annual Plan for 2009-10 has been on modernisation, infrastructure improvement and enhancement of freight capacity. The momentum of investment has been maintained by allocating significant amount for the Annual Plan.
Gross Traffic Receipts
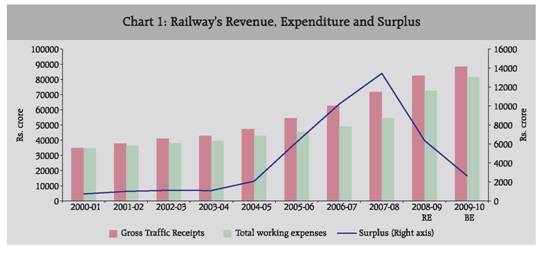
The gross traffic receipts for 2009-10, budgeted at Rs. 88,419 crore, would increase by 7.3 per cent over the RE for 2008-09 (14.9 per cent a year ago) (Chart 1). All the components would record a lower growth than the previous year. Freight earnings at Rs.58,525 crore would grow by 7.8 per cent (14.5 per cent in the previous year). Passenger earnings at Rs.24,309 crore, are budgeted to show an increase of 8.9 per cent over the RE (12.5 per cent in the previous year) (Statement 1). Working Expenses
Total working expenses for 2009-10 budgeted at Rs.81,665 crore would increase by 12.7 per cent, much lower than 33.1 per cent in 2008-09. Ordinary net working expenses at Rs.62,900 crore would show a growth of 14.4 per cent, while appropriation to pension fund at Rs.13,440 crore would increase by 28.1 per cent over the RE of 2008-09. Appropriation to depreciation reserve fund, however would decline by 23.9 per cent to Rs.5,325 crore (Statement 1). The allocation for repairs and maintenance is estimated to be 34.1 per cent of the total net ordinary working expenses for 2009-10 (Statement 2).
 |
Net Financial Results
The net revenue (total receipt minus total expenditure) of the Railways has been budgeted to decline by 26.6 per cent to Rs.8,121 crore, which would be on top of a decline by 39.6 per cent to Rs.11,066 crore in 2008-09 (RE). The operating ratio has also been budgeted to increase further to 92.5 per cent in 2009-10 from 88.3 per cent in 2008-09. The total dividend payment, however, has been budgeted to increase by 16.3 per cent in 2009-10 to Rs.5,479 crore as against a decline of 3.9 per cent to Rs.4,711 crore in the previous year. Consequently, the net surplus (net revenue less total dividend payable) for 2009-10 budgeted at Rs.2,642 crore would be 58.4 per cent lower than that of 2008-09 (RE). The return on capital (i.e., ratio of net revenue to Capital-at-Charge and Investment from Capital Fund) budgeted at 6.6 per cent would also be lower than 10.6 per cent in 2008-09 (RE) (Table 1).
Plan Outlay The Annual Plan outlay has been placed at Rs. 40,745 crore for 2009-10, 8.7 per cent higher than the previous year. Of the total outlay, 38.5 per cent (Rs.15,675 crore) would be financed through internal generation of resources as against 56.0 per cent in the BE of preceding year reflecting the deteriorating financial performance of the Railways. The budgetary support would finance 38.8 per cent (Rs.15,800 crore) as against 21.0 per cent in the preceding year. The remaining 22.7 per cent would be financed through extra-budgetary resources.
Table 1: Major Financial Ratios |
(Per cent) |
Items |
Operating Ratio |
Net Railway Revenue
as percentage of
Capital-at-Charge |
1 |
2 |
3 |
2000-01 |
98.3 |
2.5 |
2001-02 |
96.0 |
5.0 |
2002-03 |
92.3 |
7.5 |
2003-04 |
92.1 |
8.0 |
2004-05 |
91.0 |
8.9 |
2005-06 |
83.2 |
15.4 |
2006-07 |
78.7 |
19.6 |
2007-08 |
75.9 |
20.7 |
2008-09 RE |
88.3 |
10.6 |
2009-10 BE |
92.5 |
6.6 |
Note: Due to changed accounting of lease charges, from 2005-06 onwards only the interest portion has been charged to Ordinary Working Expenses and the principal portion to Plan Expenditure. |
Section IV: Overall Assessment
The finances of the Railways in terms of gross traffic earnings during 2008-09 RE showed robust performance. However, due to Sixth Pay Commission related expenditures, the working expenses grew substantially leading to deterioration in key indicators of financial performance. These financial performance ratios are slated to deteriorate further during 2009-10. Both the freight loading and passenger travels are expected to decelerate during 2009-10, while the freight rates and passenger fare would remain unchanged. In view of the worsening financial performance, there would be a substantial fall in the contribution from internal generation of resources to the annual plan outlay for 2009-10. The Railway Budget 2009-10 emphasised improving the services to the passengers in terms of safety, security and amenities while focussing on the commercial operations. It has been proposed to develop 50 world class stations. The Railway Budget announced measures for establishing multifunctional complexes at stations and on surplus lands and also expanding the rail network. Several measures have also been initiated to improve freight business and technological upgradation. Railways need to emphasise to improve its financial performance and generate larger resources internally for its plan outlays.
Statement 1: Financial Results of Railways |
(Rs. crore) |
Items |
2007-08
(Actuals) |
2008-09
(Budget Estimates) |
2008-09
(Revised Estimates) |
2009-10
(Budget Estimates) |
1 |
2 |
3 |
4 |
5 |
1. |
Gross Traffic Receipts(a to e) |
71,720 |
81,901 |
82,393 |
88,419 |
|
(a) Passenger Earnings |
19,844 |
21,681 |
22,330 |
24,309 |
|
(b) Freight (Goods) Earnings |
47,435 |
52,700 |
54,293 |
58,525 |
|
(c) Sundry Other Earnings |
2,565 |
5,000 |
3,250 |
2,760 |
|
(d) Other Coaching |
1,800 |
2,420 |
2,420 |
2,750 |
|
(e) Suspense |
75 |
100 |
100 |
75 |
2. |
Total Miscellaneous Receipts (a to d) |
1,557 |
1,796 |
1,840 |
2,207 |
|
(a) Interest on Fund Balances |
0 |
0 |
0 |
0 |
|
(b) Receipts from Safety Surcharge on Passengers Fares |
0 |
0 |
0 |
0 |
|
(c) Subsidy from General Revenues towards dividend relief & other concessions |
1,468 |
1,708 |
1,735 |
2,086 |
|
(d) Other Miscellaneous Receipts |
89 |
88 |
105 |
121 |
3. |
Total Receipts (1+2) |
73,277 |
83,697 |
84,233 |
90,626 |
4. |
Net Ordinary Working Expenses |
41,033 |
50,000 |
55,000 |
62,900 |
5. |
Appropriation to Pension Fund |
7,979 |
9,590 |
10,490 |
13,440 |
6. |
Appropriation to Depreciation Reserve Fund |
5,450 |
7,000 |
7,000 |
5,325 |
7. |
Total Working Expenses {4+5+6} |
54,462 |
66,590 |
72,490 |
81,665 |
8. |
Total Miscellaneous Expenditure |
480 |
684 |
677 |
840 |
|
(a) Appropriation to Special Railway Safety Fund |
0 |
0 |
0 |
0 |
|
(b) O.L.W.R. (Open Line Works Revenue) |
47 |
60 |
58 |
60 |
|
(c) Other Miscellaneous Expenditure |
434 |
624 |
619 |
780 |
9. |
Total Expenditure (7+8) |
54,942 |
67,274 |
73,167 |
82,505 |
10 |
Net Revenue (3-9) |
18,335 |
16,423 |
11,066 |
8,121 |
11 |
(a) Dividend Payable to General Revenue |
4,239 |
4,636 |
4,711 |
5,479 |
|
(b) Payment of Deferred Dividend |
664 |
0 |
0 |
0 |
|
(c) Total Dividend Payment (a+b) |
4,903 |
4,636 |
4,711 |
5,479 |
12 |
Surplus [10-11(c)] |
13,432 |
11,787 |
6,355 |
2,642 |
13 |
Appropriation to Development Fund |
2,359 |
947 |
1,391 |
2,000 |
14 |
Appropriation to Capital Fund |
11,072 |
10,840 |
4,965 |
642 |
15 |
Appropriation to Railway Safety Fund |
0 |
0 |
0 |
0 |
16 |
Appropriation to Special Railway Safety Fund |
0 |
0 |
0 |
0 |
17 |
Operating Ratio |
75.9 |
81.4 |
88.3 |
92.5 |
18 |
Ratio of Net Revenue to Capital-at-Charge and Investment from Capital Fund |
20.7 |
15.8 |
10.6 |
6.6 |
Source : Explanatory Memorandum on the Railway Budget, 2009-10. |
Statement 1: Financial Results of Railways (Concld.) |
(Rs. crore) |
Items |
Variations |
Col.4 over Col. 3 |
Col.4 over Col. 2 |
Col.5 over Col. 4 |
Amount |
Per cent |
Amount |
Per cent |
Amount |
Per cent |
1 |
6 |
7 |
8 |
9 |
10 |
11 |
1 |
Gross Traffic Receipts(a to e) |
492 |
0.6 |
10,673 |
14.9 |
6,026 |
7.3 |
|
(a) |
Passenger Earnings |
649 |
3.0 |
2,486 |
12.5 |
1,979 |
8.9 |
|
(b) |
Freight (Goods) Earnings |
1,593 |
3.0 |
6,858 |
14.5 |
4,232 |
7.8 |
|
(c) |
Sundry Other Earnings |
-1,750 |
-35.0 |
685 |
26.7 |
-490 |
-15.1 |
|
(d) |
Other Coaching |
0 |
0.0 |
620 |
34.4 |
330 |
13.6 |
|
(e) |
Suspense |
0 |
0.0 |
25 |
33.3 |
-25 |
-25.0 |
2 |
Total Miscellaneous Receipts (a to d) |
44 |
2.4 |
283 |
18.2 |
367 |
19.9 |
|
(a) |
Interest on Fund Balances |
0 |
- |
0 |
- |
0 |
- |
|
(b) |
Receipts from Safety Surcharge on Passengers Fares |
0 |
- |
0 |
- |
0 |
- |
|
(c) |
Subsidy from General Revenues towards dividend relief & other concessions |
27 |
1.6 |
267 |
18.2 |
351 |
20.2 |
|
(d) |
Other Miscellaneous Receipts |
17 |
19.3 |
16 |
18.0 |
16 |
15.2 |
3 |
Total Receipts (1+2) |
536 |
0.6 |
10,956 |
15.0 |
6,393 |
7.6 |
4 |
Net Ordinary Working Expenses |
5,000 |
10.0 |
13,967 |
34.0 |
7,900 |
14.4 |
5 |
Appropriation to Pension Fund |
900 |
9.4 |
2,511 |
31.5 |
2,950 |
28.1 |
6 |
Appropriation to Depreciation Reserve Fund |
0 |
0.0 |
1,550 |
28.4 |
-1,675 |
-23.9 |
7 |
Total Working Expenses {4+5+6} |
5,900 |
8.9 |
18,028 |
33.1 |
9,175 |
12.7 |
8 |
Total Miscellaneous Expenditure |
-7 |
-1.0 |
197 |
41.0 |
163 |
24.1 |
|
(a) |
Appropriation to Special Railway Safety Fund |
0 |
- |
0 |
- |
0 |
- |
|
(b) |
O.L.W.R. (Open Line Works Revenue) |
-2 |
-3.3 |
11 |
23.4 |
2 |
3.4 |
|
(c) |
Other Miscellaneous Expenditure |
-5 |
-0.8 |
185 |
42.6 |
161 |
26.0 |
9 |
Total Expenditure (7+8) |
5,893 |
8.8 |
18,225 |
33.2 |
9,338 |
12.8 |
10 |
Net Revenue (3-9) |
-5,357 |
-32.6 |
-7,269 |
-39.6 |
-2,945 |
-26.6 |
11 |
(a) |
Dividend Payable to General Revenue |
75 |
1.6 |
472 |
11.1 |
768 |
16.3 |
|
(b) |
Payment of Deferred Dividend |
0 |
- |
-664 |
-100.0 |
0 |
- |
|
(c) |
Total Dividend Payment (a+b) |
75 |
1.6 |
-192 |
-3.9 |
768 |
16.3 |
12 |
Surplus [10-11(c)] |
-5,432 |
-46.1 |
-7,077 |
-52.7 |
-3,713 |
-58.4 |
13 |
Appropriation to Development Fund |
444 |
46.9 |
-968 |
-41.0 |
609 |
43.8 |
14 |
Appropriation to Capital Fund |
-5,875 |
-54.2 |
-6,107 |
-55.2 |
-4,323 |
-87.1 |
15. |
Appropriation to Railway Safety Fund |
0 |
0.0 |
0 |
- |
0 |
- |
16. |
Appropriation to Special Railway Safety Fund |
0 |
- |
0 |
- |
0 |
- |
17. |
Operating Ratio |
7 |
8.5 |
12 |
16.3 |
4 |
4.8 |
18. |
Ratio of Net Revenue to Capital-at-Charge and Investment from Capital Fund |
-5 |
-32.9 |
-10 |
-48.8 |
-4 |
-37.7 |
Statement 2: Ordinary Working Expenses of Indian Railways |
(Rs. crore) |
Items |
2007-08 (Actuals) |
2008-09 (Budget Estimates) |
2008-09 (Revised Estimates) |
2009-10 (Budget Estimates) |
Variations |
col.4 over col.3 |
col.4 over col.2 |
col.5 over col.4 |
Amount |
Per cent |
Amount |
Per cent |
Amount |
Per cent |
1 |
2 |
3 |
4 |
5 |
6 |
7 |
8 |
9 |
10 |
11 |
Net Ordinary Working Expenses |
41,033 |
50,000 |
55,000 |
62,900 |
5,000 |
10.0 |
13,967 |
34.0 |
7,900 |
14.4 |
(a to h) |
(100.0) |
(100.0) |
(100.0) |
(100.0) |
|
|
|
|
|
|
a) |
General Superintendence and Services |
2,291 |
3,141 |
3,562 |
4,372 |
421 |
13.4 |
1,271 |
55.5 |
810 |
22.7 |
|
(5.6) |
(6.3) |
(6.5) |
(7.0) |
|
|
|
|
|
|
b) |
Repairs and Maintenance |
12,982 |
16,173 |
18,033 |
21,420 |
1,860 |
11.5 |
5,051 |
38.9 |
3,387 |
18.8 |
|
(31.6) |
(32.3) |
(32.8) |
(34.1) |
|
|
|
|
|
|
c) |
Operating Expenses (Traffic) |
6,602 |
8,509 |
9,539 |
10,994 |
1,030 |
12.1 |
2,937 |
44.5 |
1,455 |
15.3 |
|
(16.1) |
(17.0) |
(17.3) |
(17.5) |
|
|
|
|
|
|
d) |
Operating Expenses (Fuel) |
12,150 |
13,618 |
14,218 |
14,656 |
600 |
4.4 |
2,068 |
17.0 |
438 |
3.1 |
|
(29.6) |
(27.2) |
(25.9) |
(23.3) |
|
|
|
|
|
|
e) |
Operating Expenses
(Rolling Stock and Equipment) |
3,249 |
3,914 |
4,458 |
5,141 |
544 |
13.9 |
1,209 |
37.2 |
683 |
15.3 |
|
(7.9) |
(7.8) |
(8.1) |
(8.2) |
|
|
|
|
|
|
f) |
Staff Welfare and Amenities |
1,845 |
2,313 |
2,597 |
3,178 |
284 |
12.3 |
752 |
40.8 |
581 |
22.4 |
|
(4.5) |
(4.6) |
(4.7) |
(5.1) |
|
|
|
|
|
|
g) |
Suspense |
56.0 |
-35.0 |
-146.0 |
-93.0 |
-111 |
317.1 |
-202 |
-360.7 |
53 |
-36.3 |
|
(0.1) |
(-0.1) |
(-0.3) |
(-0.1) |
|
|
|
|
|
|
h) |
Others* |
1,858 |
2,367 |
2,739 |
3,232 |
372 |
15.7 |
881 |
47.4 |
493 |
18.0 |
|
(4.5) |
(4.7) |
(5.0) |
(5.1) |
|
|
|
|
|
|
* Includes miscellaneous working expenses, Provident Fund, Pension and Other Retirement Benefits.
Note : Figures in brackets represent percentage to total.
Source : Explanatory Memorandum on the Railway Budget, 2009-10. |
Statement 3 : Developmental Expenditure of Railways |
(Rs. crore) |
Items |
2007-08
(Actuals) |
2008-09
(Budget
Estimates) |
2008-09
(Revised
Estimates) |
2009-10
(Budget
Estimates) |
1 |
2 |
3 |
4 |
5 |
|
Total @ |
30,145 |
37,500 |
36,773 |
40,745 |
|
of which |
|
|
|
|
(a) |
Track Renewals |
4,479 |
4,700 |
4,719 |
5,135 |
|
|
(14.9) |
(12.5) |
(12.8) |
(12.6) |
(b) |
Rolling Stock |
8,437 |
11,545 |
11,365 |
12,393 |
|
|
(28.0) |
(30.8) |
(30.9) |
(30.4) |
(c) |
Electrification |
465 |
628 |
780 |
744 |
|
Projects |
(1.5) |
(1.7) |
(2.1) |
(1.8) |
(d) |
Workshop including |
500 |
1,762 |
1,118 |
1,797 |
|
Production Units |
(1.7) |
(4.7) |
(3.0) |
(4.4) |
(e) |
New Lines |
2,671 |
1,701 |
2,963 |
2,922 |
|
|
(8.9) |
(4.5) |
(8.1) |
(7.2) |
(f) |
Lines Doubling |
1,685 |
2,524 |
1,803 |
1,906 |
|
|
(5.6) |
(6.7) |
(4.9) |
(4.7) |
(g) |
Traffic Facilities |
829 |
989 |
1,131 |
1,291 |
|
|
(2.8) |
(2.6) |
(3.1) |
(3.2) |
(h) |
Signalling and |
1,345 |
1,530 |
1,433 |
1,061 |
|
Telecommunication works |
(4.5) |
(4.1) |
(3.9) |
(2.6) |
@ Grand total includes Rs. 4604.43 cr. (Actuals 2007-08), Rs.6907 cr. (Budget Estimates 2008-09), Rs.6907 cr. (Revised Estimates 2008-09) and Rs.9000 cr. (Budget Estimates 2009-10), to be raised through borrowing by IRFC for financing railway plan. Rs.240 cr. (Actuals 2007-08), Rs.293 cr. (Budget Estimates 2008-09), Rs.283 cr. (Revised Estimates 2008-09), Rs.170 cr. (Budget Estimates 2009-10), to be raised by Rail Vikas Nigam Limited for investment in various Railway Projects; Rs.520 cr. (Actuals 2007-08), Rs.500 cr. (Budget Estimates 2008-09), as investment through “Wagon Investment Scheme” (WIS) and Rs.800 cr. (Budget Estimates 2008-09) and Rs.100 cr. (Budget Estimates 2009-10) as investment through “Public Private Partnership”, it also includes Rs.179 cr. (Actuals 2007-08), Rs.190 cr. (Budget Estimates 2008-09), Rs.251.5 cr. (Revised Estimates 2008-09), and Rs.298 cr. (Budget Estimates 2009-10) as loan given to Konkan Railway Corporation (KRC) and also loan of Rs.5 cr. given to Bharat Wagon Engineering Limited (Revised Estimates 2008-09), also includes Rs.1231.39 cr. (Actuals 2007-08), and Rs.1299.5 cr. (Revised Estimates 2008-09) as additional grant under capital for new lines and Gauge Conversion planheads aimed at progressing execution of certain projects under these planheads identified as National Projects.
Note : Figures in brackets represent percentages to total.
Source : Explanatory Memorandum on the Railway Budget, 2009-10 and Part I of Railway Minister’s Budget Speech. |
Statement 3 : Developmental Expenditure of Railways (Concld.) |
(Rs. crore) |
Items |
Variations |
Col.4 over Col. 3 |
Col.4 over Col. 2 |
Col.5 over Col. 4 |
Amount |
Per cent |
Amount |
Per cent |
Amount |
Per cent |
1 |
6 |
7 |
8 |
9 |
10 |
11 |
Total @ |
-727 |
-1.9 |
6,628 |
22.0 |
3,972 |
10.8 |
of which |
|
|
|
|
|
|
(a) |
Track Renewals |
19 |
0.4 |
240 |
5.4 |
416 |
8.8 |
(b) |
Rolling Stock |
-180 |
-1.6 |
2,928 |
34.7 |
1,028 |
9.0 |
(c) |
Electrification Projects |
152 |
24.2 |
315 |
67.7 |
-36 |
-4.6 |
(d) |
Workshop including Production Units |
-644 |
-36.5 |
618 |
123.6 |
679 |
60.7 |
(e) |
New Lines |
1,262 |
74.2 |
292 |
10.9 |
-41 |
-1.4 |
(f) |
Lines Doubling |
-721 |
-28.6 |
118 |
7.0 |
103 |
5.7 |
(g) |
Traffic Facilities |
142 |
14.4 |
302 |
36.4 |
160 |
14.1 |
(h) |
Signalling and Telecommunication works |
-97 |
-6.3 |
88 |
6.5 |
-372 |
-26.0 |
Statement 4 : Freight and Passenger Traffic of Railways |
Items |
2007-08
(Actuals) |
2008-09
(Budget Estimates) |
2008-09
(Revised Estimates) |
2009-10
(Budget Estimates) |
1 |
2 |
3 |
4 |
5 |
I. |
Freight Traffic (Million Tonnes) |
|
|
|
|
|
1. |
Coal |
337 |
355 |
374 |
404 |
|
|
|
(42.4) |
(41.8) |
(44.0) |
(45.8) |
|
2. |
Raw Materials to Steel Plants |
11 |
13 |
11 |
11 |
|
|
|
(1.4) |
(1.5) |
(1.3) |
(1.2) |
|
3. |
Pig Iron and Finished Steel for |
26 |
30 |
27 |
29 |
|
|
Steel Plants |
(3.3) |
(3.5) |
(3.2) |
(3.3) |
|
4. |
Iron ore for Exports |
137 |
151 |
133 |
131 |
|
|
|
(17.3) |
(17.8) |
(15.6) |
(14.9) |
|
5. |
Cement |
79 |
82 |
87 |
92 |
|
|
|
(9.9) |
(9.6) |
(10.2) |
(10.4) |
|
6. |
Food Grains |
38 |
36 |
34 |
33 |
|
|
|
(4.8) |
(4.2) |
(4.0) |
(3.7) |
|
7. |
Fertilizers |
36 |
42 |
43 |
43 |
|
|
|
(4.5) |
(4.9) |
(5.1) |
(4.9) |
|
8. |
Others |
130 |
141 |
141 |
139 |
|
|
|
(16.4) |
(16.6) |
(16.6) |
(15.8) |
|
Tot al ( 1 to 8) |
794 |
850 |
850 |
882 |
II. |
No. of Passengers
(in Millions) |
|
|
|
|
|
1. |
Suburban * |
3,701 |
3,879 |
3,814 |
3,930 |
|
|
|
(56.6) |
(55.0) |
(54.7) |
(53.2) |
|
2. |
Non-Suburban |
2,835 |
3,177 |
3,153 |
3,454 |
|
|
|
(43.4) |
(45.0) |
(45.3) |
(46.8) |
|
Total (1 + 2) |
6,536 |
7,056 |
6,967 |
7,384 |
* Includes passengers on Metro Railway, Kolkata
Note : Figures in brackets represent percentages to total.
Source : Explanatory Memorandum on the Railway Budget, 2009-10. |
Statement 4 : Freight and Passenger Traffic of Railways (Concld.) |
Items |
Variations |
Col.4 over Col. 3 |
Col.4 over Col. 2 |
Col.5 over Col. 4 |
Amount |
Per cent |
Amount |
Per cent |
Amount |
Per cent |
1 |
6 |
7 |
8 |
9 |
10 |
11 |
I. |
Freight Traffic (Million Tonnes) |
|
|
|
|
|
|
|
1. |
Coal |
19 |
5.4 |
37 |
11.0 |
30 |
8.0 |
|
2. |
Raw Materials to Steel Plants |
-2 |
-15.4 |
0 |
0.0 |
0 |
0.0 |
|
3. |
Pig Iron and Finished Steel for Steel Plants |
-3 |
-10.0 |
1 |
3.8 |
2 |
7.4 |
|
4. |
Iron ore for Exports |
-18 |
-11.9 |
-4 |
-2.9 |
-2 |
-1.5 |
|
5. |
Cement |
5 |
6.1 |
8 |
10.1 |
5 |
5.7 |
|
6. |
Food Grains |
-2 |
-5.6 |
-4 |
-10.5 |
-1 |
-2.9 |
|
7. |
Fertilizers |
1 |
2.4 |
7 |
19.4 |
0 |
0.0 |
|
8. |
Others |
0 |
0.0 |
11 |
8.5 |
-2 |
-1.4 |
|
Total (1 to 8) |
0 |
0.0 |
56 |
7.1 |
32 |
3.8 |
II. |
No. of Passengers
(in Millions) |
|
|
|
|
|
|
|
1. |
Suburban * |
-65 |
-1.7 |
113 |
3.1 |
116 |
3.0 |
|
2. |
Non-Suburban |
-24 |
-0.8 |
318 |
11.2 |
301 |
9.5 |
|
Total (1 + 2) |
-89 |
-1.3 |
431 |
6.6 |
417 |
6.0 |
Statement 5 : Indian Railways - Selected Performance Indicators (A Statistical Profile) |
Items |
Unit |
1990-91 |
1997-98 |
1998-99 |
1999-2000 |
2000-01 |
2001-02 |
1 |
2 |
3 |
4 |
5 |
6 |
7 |
8 |
1. |
Capital-at Charge & investment from Capital Fund * |
Rs. Crore |
16,126 |
33,846 |
36,829 |
39,772 |
43,052 |
47,147 |
2. |
Route Kilometres-Total |
Kilometres |
62,367 |
62,495 |
62,809 |
62,759 |
63,028 |
63,140 |
|
of which: |
|
|
|
|
|
|
|
|
Electrified |
Kilometres |
9,968 |
13,490 |
13,765 |
14,261 |
14,856 |
15,994 |
3. |
Number of Stations |
|
7,100 |
6,929 |
6,896 |
6,867 |
6,843 |
6,856 |
4. |
Employees (As on 31 March) |
Thousands |
1,652 |
1,579 |
1,578 |
1,577 |
1,545 |
1,511 |
5. |
Wage Bill |
Rs. Crore |
5,166 |
14,141 |
15,611 |
16,289 |
18,841 |
19,037 |
6. |
Number of Passengers Originating |
Millions |
3,858 |
4,348 |
4,411 |
4,585 |
4,833 |
5,093 |
7. |
Passengers Kilometres |
Millions |
295,644 |
379,897 |
403,884 |
430,666 |
457,022 |
493,488 |
8. |
Average Lead of Passenger Traffic |
Kilometres |
77 |
87 |
92 |
94 |
95 |
97 |
9. |
Average Rate per Passenger Kilometre |
Paise |
11 |
20 |
21 |
22 |
23 |
23 |
10. |
Originating Revenue-Earning Freight Traffic |
Million Tonnes |
318 |
429 |
421 |
456 |
474 |
493 |
11. |
Revenue-Earning Freight Traffic-Net Tonne Kilometres |
Millions |
235,785 |
284,249 |
281,513 |
305,201 |
312,371 |
333,228 |
12. |
Average Lead of Revenue-Earning Freight Traffic |
Kilometres |
711 |
644 |
644 |
644 |
626 |
644 |
13. |
Average Rate Per Tonne Kilometre |
Paise |
35 |
69 |
70 |
71 |
74 |
74 |
14. |
Revenue-Gross Receipts** |
Rs. Crore |
12,452 |
29,134 |
30,234 |
33,856 |
36,011 |
39,358 |
15. |
Operating Ratio |
Per cent |
92.0 |
90.9 |
93.3 |
93.3 |
98.3 |
96.0 |
16. |
Surplus(+)/Deficit(-) |
Rs. Crore |
176 |
1,535 |
399 |
846 |
764 |
1,000 |
* Capital-at-charge excludes Capital Outlay on Metropolitan Transport Projects and Circular Railway(Eastern Railway) and disinvestments.
** Includes Total Miscellaneous Receipts.
Note: 1. Capital-at-charge means capital contributed by General Revenues for investment in Railways.
2. Operating Ratio means ratio of total working expenses to gross traffic receipts.
Source: 1. Indian Railways Year Books.
2. Indian Railways Annual Report and Accounts. |
Statement 5 : Indian Railways - Selected Performance Indicators (A Statistical Profile) (Concld.) |
Items |
Unit |
2002-03 |
2003-04 |
2004-05 |
2005-06 |
2006-07 |
2007-08 |
1 |
2 |
9 |
10 |
11 |
12 |
13 |
14 |
1. |
Capital-at Charge & investment |
Rs. Crore |
51,099 |
56,062 |
59,347 |
65,878 |
76,031 |
88,521 |
|
from Capital Fund * |
|
|
|
|
|
|
|
2. |
Route Kilometres-Total |
Kilometres |
63,122 |
63,221 |
63,465 |
63,332 |
63,327 |
63,273 |
|
Of which: |
|
|
|
|
|
|
|
|
Electrified |
Kilometres |
16,272 |
16,776 |
17,495 |
17,907 |
17,786 |
18,274 |
3. |
Number of Stations |
|
6,906 |
7,031 |
7,146 |
6,974 |
6,909 |
7,025 |
4. |
Employees (As on 31 March) |
Thousands |
1,472 |
1,442 |
1,424 |
1,412 |
1,398 |
1,395 |
5. |
Wage Bill |
Rs. Crore |
19,915 |
20,929 |
22,553 |
23,920 |
24,159 |
25,892 |
6. |
Number of Passengers Originating |
Millions |
4,971 |
5,112 |
5,378 |
5,725 |
6,219 |
6,524 |
7. |
Passengers Kilometres |
Millions |
515,044 |
541,208 |
575,702 |
615,614 |
694,764 |
769,956 |
8. |
Average Lead of Passenger Traffic |
Kilometres |
104 |
106 |
107 |
108 |
112 |
118 |
9. |
Average Rate per Passenger Kilometre |
Paise |
24 |
25 |
24 |
25 |
25 |
26 |
10. |
Originating Revenue-Earning Freight Traffic |
Million Tonnes |
519 |
557 |
602 |
667 |
728 |
794 |
11. |
Revenue-Earning Freight Traffic-Net Tonne Kilometres |
Millions |
353,194 |
381,241 |
407,398 |
439,596 |
480,993 |
521,371 |
12. |
Average Lead of Revenue-Earning Freight Traffic |
Kilometres |
656 |
661 |
657 |
647 |
649 |
651 |
13. |
Average Rate Per Tonne Kilometre |
Paise |
74 |
72 |
75 |
81 |
85 |
89 |
14. |
Revenue-Gross Receipts** |
Rs. Crore |
42,741 |
44,911 |
49,047 |
56,316 |
64,786 |
73,277 |
15. |
Operating Ratio |
Per cent |
92.3 |
92.1 |
91.0 |
83.7 |
78.7 |
75.9 |
16. |
Surplus(+)/Deficit(-) |
Rs. Crore |
1,115 |
1,091 |
2,074 |
4,338 |
10,206 |
13,431 |
* Prepared in the Division of Central Finances of the Department of Economic Analysis and Policy. This article is based on the Railway Budget 2009-10 presented to Parliament on July 3, 2009. The article on Railway Budget 2009-10 (Vote-on-Account) had appeared in April issue of the RBI Bulletin.
1 In this note all references to the fiscal 2009-10 relate to budget estimates and all comparisons are with respect to the revised estimates for 2008-09, unless otherwise stated.
2 In this section, all comparisons are with respect to the budget estimates for 2008-09 unless stated otherwise. 3 In this Section, all references to the fiscal 2009-10 relate to budget estimates and all comparisons are with respect to the revised estimates for 2008-09, unless stated otherwise. |


