Amarendra Sahoo and J.K. Khundrakpam* This paper reviews whether the rapid growth in banking indicators in the North Eastern region of India following nationalisation of 14 major banks in 1969 and another six in 1980 based on social banking was sustained or not. It finds a phenomenon of retarding trend in almost all the banking parameters in the region since the beginning of the 1990s. It then attempts to reason out the impediments typically affecting the region, which has given rise to such a situation and makes a number of suggestions that would enhance the financial intermediary role of scheduled commercial banks in the region.
JEL Classification : G21
Keywords : Scheduled Commercial Banks, Credit, Deposit, Branch Network
Introduction
Modern banking in some of the north eastern states is only a post-nationalisation phenomenon since 1969. As on June 1969, not a single branch of scheduled commercial banks (SCBs) existed in Arunachal Pradesh and Mizoram, a situation akin to only some pockets like island Union Territories of Dadra and Nagar Haveli and Lakshadweep at that time. Only two branches each of SCBs served the entire State in Manipur and Nagaland on that date, while as late as June 1975, only one SCB branch served the entire State of Mizoram. Assam with a longer history of tea and oil industry was better served by banks among the States in the region. This low level of banking development had much to do with the socio-economic and geographical reasons. Except the plain areas of Assam and Barak Valley (Assam), Tripura Valley and Imphal Valley, the rest are hilly States inhabited by more than one hundred different tribes each one differing in terms of dialect, traditions and other social features. A much larger percentage of population live in the rural areas, which was as high as 85.0 per cent as per 2001 census as compared to the national average of 72.0 per cent, while it was over 90.0 per cent in 1971, as compared to the national average of 80.0 per cent. Besides factors leading to inaccessibility such as poor transport and communication network in hilly terrains with sparse settlement of population, the subsistence nature of a traditional tribal economy has limited the demand for modern financial services. Furthermore, the typical financial institutions have neither customised the types of financial services they provide to the indigenous inhabitants nor innovated to suit the local demands. Is the low level of economic development in the region due to low level of banking penetration? Since the influential works of McKinnon (1973) and Shaw (1973), showing the positive correlation between financial intermediation and economic growth, a number of studies have attempted to investigate the relative importance of financial intermediation among the determinants of growth. Many of them have assigned a greater role to financial intermediation than other determinants in the process of economic growth (Gorton and Winton, 2002; Boyreau-Debray, 2001; Levine, 1997; and Levine et al, 1999). While financial intermediation and economic growth are correlated, does the former cause the latter or the vice versa that the demand factors are equally important? This is an unsettled issue, though a number of studies have found that financial development lead to economic growth in a supply leading sequence (King and Levine, 1993; Benhabib and Spigel, 2000). For the region typified by large infrastructural bottlenecks, was the expansion of modern banking system based on social banking since the nationalisation of major banks in 1969 sustainable? It has been highlighted that though financial intermediation in supply leading framework leads to economic development, without real sector development in terms of physical infrastructure and improvement in supply elasticities, the financial sector can even misallocate resources, potentially generate bubbles and possibly amplify risks (Reddy, 2006). At the same time, provision of physical infrastructure, particularly in the rural areas, is equally important for generation of demand for financial services. This is so as improvements in availability of electricity, roads and telecommunications, warehouses in rural areas would lead to better supply chain management, enhance productivity and greater value addition to agriculture (Mohan, 2006). The unique socio-economic conditions and culture of the region would also warrant that without financial innovations to suit local demand conditions the process may not be sustained. Thus, the paper analyses the trend in some select banking indicators capturing the extent of financial intermediation by the scheduled commercial banks in the region vis-à-vis the national pattern and at the same time brings out the divergence among the States. These banking parameters are: branch network, the percentage of adult population resorting to banking transactions, credit and deposit growth, level of per capita deposit and credit, the proportion of deposit and credit in state domestic product, credit-deposit ratio, and sectoral deployment of credit. It then attempts to reason out the cause for the observed trend and list out the impediments required to be removed. The rest of the paper is organised as follows. Section II analyses the trend in the various banking indicators. In section III, an attempt is made to provide explanation for the observed trend and find out the various impediments to flow of credit in the region. Summary and concluding observations are contained in section IV.
Section II: Trends in Banking Indicators
Expansion in Branch Network Starting from a low base, during the 1970s and 1980s, branch network of scheduled commercial banks in the region expanded much more rapidly. Consequently, the average population per branch (APPBO) in all the States declined much faster than the national level during these two decades. The APPBO in 1973 ranged from about 59 thousand (Meghalaya) to 359 thousand (Mizoram), with a regional average of over 90 thousand, as against the national average of 35 thousand. In 1981, it had declined to a range of 18 thousand (Nagaland) to 41 thousand (Mizoram) with a regional average of 32 thousand, and narrowed the gap from the national average of 18 thousand. By 1991, the regional APPBO was less than 17 thousand while the national average was 13.7 thousand. Significantly, the APPBO dropped below the national average in Arunachal Pradesh (12.7 thousand), Meghalaya (11.2 thousand) and Mizoram (9.5 thousand). A similar trend decline was observed in the rural APPBO with the notable feature that in Arunachal Pradesh and Mizoram they were lower than the total average APPBO in the respective States.
The 1990s show a reversal in the trend and rise in the APPBO in the country. Though the same phenomenon is also observed in the region, and in each of the States, it rose much more in the region, particularly in Manipur and Nagaland. Further, while the APPBO at the national level has again resumed a declining trend during the first half of the current decade (2001-2005), the rising trend observed since 1991 continues in many of the States in the region. Though the rural APPBO rose in all the States since 1991, in Manipur and Nagaland they increased alarmingly to over 47 thousand by 2005, more than doubled the level of 1991 and twice the national average (Table 1).
In hilly terrains characterised by sparse population distribution and transport bottlenecks, despite a lower APPBO, a large section of the population, however, may not be effectively served by the existing bank branches. This would be the case in Arunanchal Pradesh, Meghalaya and Mizoram where APPBO is lower, but the average area per bank branch range from 121 square kms. to 1,232 square kms.; far higher than national average of 47 square kms. In the case of Manipur and Nagaland, the very high APPBO coupled with larger area per bank branch (227 to 286 square Kms.) indicates the extremely low level of banking penetration, particularly in the rural areas (Table 1).
States |
Table 1: APPBO and Area Covered |
Area per
SCB Branch
Sq. Kms. |
Total APPBO |
Rural APPBO |
1973 |
1981 |
1991 |
2001 |
2005 |
1973 |
1981 |
1991 |
2001 |
2005 |
1 |
2 |
3 |
4 |
5 |
6 |
7 |
8 |
9 |
10 |
11 |
12 |
A.P |
82826 |
28720 |
12714 |
15813 |
16211 |
79678 |
26837 |
11424 |
15508 |
17294 |
1232 |
Assam |
89906 |
36308 |
18135 |
21008 |
20960 |
194279 |
59301 |
22747 |
28422 |
30678 |
62 |
Manipur |
126111 |
36435 |
21871 |
28436 |
29791 |
164173 |
45456 |
23777 |
38686 |
46931 |
286 |
Meghalaya |
59432 |
21203 |
11233 |
12741 |
12658 |
182776 |
30402 |
12455 |
14257 |
15536 |
121 |
Mizoram |
359429 |
41146 |
9449 |
11279 |
11278 |
n.a. |
46493 |
5812 |
7377 |
7883 |
276 |
Nagaland |
93287 |
18451 |
17036 |
28009 |
27990 |
252227 |
26188 |
21767 |
44211 |
49272 |
227 |
Tripura |
96747 |
19553 |
15318 |
17438 |
17429 |
184179 |
26107 |
18536 |
22067 |
23701 |
56 |
N E Region |
90523 |
32018 |
16870 |
19894 |
19885 |
188566 |
48318 |
20123 |
25629 |
27796 |
131 |
All India |
34982 |
18062 |
13711 |
15209 |
14949 |
102270 |
27820 |
17996 |
22722 |
24856 |
47 |
Source : Compiled from Various Issues of BSR, RBI, Basic Statistics, NEC and Census Data. |
Gaps in Deposit and Credit Accounts per 100 Adult Population Branch expansion and decline in APPBO should lead to increased recourse to banking transaction by the adult population, i.e., a higher current and savings accounts, and credit accounts per 100 adult population.1 Reflecting the positive impact of higher branch expansion and the decline in APPBO, the number of current and savings accounts per 100 adult population increased at a much faster rate in the region than at the national level during 1973 to 1991. However, because of the low base, the gap in this measure of banking penetration from the national average remained glaring in 1991, excepting Meghalaya. Till 1991, the States with the fastest branch expansion also recorded a faster growth in the number of current and savings accounts per 100 adult population and the ratio was higher in those States where the APPBO was lower, viz., Arunachal Pradesh, Meghalaya and Mizoram.
Since 1991, there was a concerting trend with the ratio declining substantially in all the States, except Assam and Tripura. During 1991 and 2005, the decline was to the extent of 19.0 percentage points in Meghalaya and over 20.0 percentage points in Nagaland that for this latter State, the ratio in 2005 was lower than what was in 1981. Another national trend which has eluded all these States is that while the ratio has risen during 2001 to 2005 at the national level, it continues to follow the declining trend. Thus in 2005, the current and savings accounts per 100 adult population ranged from 19.5 in Manipur to 40.9 in Meghalaya, with a regional average of 37.3, as against the national average of 58.3 (Table 2).
A similar trend is also observed for credit accounts per 100 adult population, which indicates access to bank credit. The ratio grew much more rapidly in all the States during the 1970s and the 1980s. However, barring Tripura, they remained below the national average throughout. Showing the national pattern, between 1991 and 2001, the ratio declined in all the States, barring Arunachal Pradesh and Mizoram, and excepting these two States, the ratios in 2005 stood significantly lower than the level in 1991 despite some improvement during 2001 to 2005. In 2005, the ratio ranged from 3.6 (Nagaland) to 13.6 (Tripura), with regional average of 6.6, as against the national average of 13.3 (Table 2).
Within a State there was large scale disparity in the level of banking penetration between the rural and urban population during 2001-05. In Arunanchal Pradesh, Meghalaya and Mizoram, withbetter coverage of population per bank branch, the divide in current and savings account per 100 adult population was lesser as compared to the divide at the national level. Only Arunachal Pradesh had higher than national average level of current and savings account per 100 adult in rural areas, while for the urban areas only Assam had an average above the national average. In Manipur and Nagaland, where the rural APPBO is alarmingly high, over 90.0 per cent of the rural adult population had no current and savings account.
Table 2: Current and Savings, and Credit Account |
per 100 Adult Population |
States |
Current and Savings Accounts |
Credit Accounts |
1973 |
1981 |
1991 |
2001 |
2005 |
1973 |
1981 |
1991 |
2001 |
2005 |
1 |
2 |
3 |
4 |
5 |
6 |
7 |
8 |
9 |
10 |
11 |
A.P |
1.4 |
10.8 |
47.0 |
45.9 |
37.8 |
0.02 |
0.8 |
3.0 |
6.8 |
6.0 |
Assam |
3.4 |
11.6 |
34.9 |
39.4 |
39.1 |
0.28 |
1.4 |
7.0 |
4.5 |
5.9 |
Manipur |
2.0 |
8.2 |
25.2 |
20.1 |
19.5 |
0.31 |
0.8 |
4.3 |
3.2 |
4.0 |
Meghalaya |
6.9 |
21.7 |
59.1 |
44.3 |
40.9 |
0.61 |
3.1 |
9.1 |
6.9 |
7.7 |
Mizoram |
0.5 |
5.5 |
41.8 |
25.8 |
29.0 |
0.01 |
0.5 |
4.6 |
5.4 |
7.7 |
Nagaland |
2.9 |
16.7 |
41.3 |
22.3 |
19.7 |
0.12 |
1.7 |
5.8 |
2.6 |
3.6 |
Tripura |
5.4 |
10.7 |
39.3 |
37.0 |
36.1 |
0.44 |
6.6 |
23.5 |
12.3 |
13.6 |
N E Region |
3.6 |
12.2 |
37.6 |
38.2 |
37.3 |
0.30 |
1.9 |
8.5 |
5.4 |
6.6 |
All India |
10.5 |
28.9 |
60.3 |
55.0 |
58.3 |
1.87 |
6.2 |
13.9 |
9.7 |
13.3 |
Source : Compiled from Various Issues of BSR, RBI and Census Data. |
With regard to credit accounts per 100 adult population, they were lower than national average for both the urban and rural area in all the States, except Tripura. However, the gap between rural and urban areas was lesser in Arunachal Pradesh, Meghalaya, Mizoram and Tripura, while in the remaining three States, they were much higher (Table 3).
Table 3: Centre-Wise Current and Savings, and |
Credit Account per 100 Adult Population |
States |
Centre |
Current and Savings Account |
Credit Accounts |
|
|
2001 |
2002 |
2003 |
2004 |
2005 |
2001 |
2002 |
2003 |
2004 |
2005 |
1 |
2 |
3 |
4 |
5 |
6 |
7 |
8 |
9 |
10 |
11 |
12 |
A.P |
Rural |
33.1 |
33.3 |
33.8 |
29.7 |
29.4 |
4.4 |
4.8 |
4.7 |
4.5 |
4.6 |
|
Urban |
95.6 |
97.7 |
84.7 |
74.2 |
70.0 |
17.1 |
7.1 |
7.9 |
9.7 |
11.9 |
Assam |
Rural |
21.1 |
20.4 |
21.7 |
21.8 |
22.3 |
2.6 |
3.0 |
3.0 |
3.2 |
3.5 |
|
Urban |
165.3 |
159.3 |
150.6 |
146.8 |
153.9 |
18.0 |
16.2 |
17.1 |
19.2 |
22.1 |
Manipur |
Rural |
7.5 |
7.4 |
6.7 |
5.9 |
8.7 |
1.6 |
1.5 |
1.5 |
1.5 |
2.1 |
|
Urban |
60.3 |
54.5 |
56.5 |
53.3 |
54.1 |
8.2 |
7.0 |
7.2 |
8.6 |
10.0 |
Meghalaya |
Rural |
25.7 |
26.1 |
27.0 |
24.1 |
23.3 |
4.9 |
5.4 |
5.0 |
4.7 |
5.8 |
|
Urban |
120.2 |
112.7 |
111.3 |
112.5 |
112.7 |
15.0 |
10.6 |
11.7 |
15.7 |
15.4 |
Mizoram |
Rural |
18.7 |
18.7 |
20.1 |
19.8 |
22.1 |
4.6 |
5.7 |
5.7 |
6.9 |
6.3 |
|
Urban |
33.0 |
28.2 |
29.9 |
29.4 |
36.0 |
6.4 |
5.0 |
5.8 |
7.9 |
9.3 |
Nagaland |
Rural |
5.1 |
4.8 |
4.6 |
4.8 |
5.1 |
1.1 |
1.1 |
1.0 |
1.0 |
1.4 |
|
Urban |
102.2 |
93.2 |
93.5 |
87.1 |
87.4 |
9.1 |
9.9 |
10.2 |
11.3 |
13.7 |
Tripura |
Rural |
20.4 |
19.7 |
20.3 |
21.3 |
20.9 |
10.3 |
15.5 |
14.1 |
11.1 |
10.8 |
|
Urban |
118.0 |
117.4 |
111.5 |
107.1 |
110.0 |
22.4 |
31.8 |
30.0 |
28.1 |
27.2 |
N E Region |
Rural |
20.5 |
20.0 |
21.0 |
20.8 |
21.3 |
3.4 |
4.2 |
4.1 |
4.0 |
4.3 |
|
Urban |
134.6 |
129.2 |
123.2 |
119.6 |
124.4 |
16.3 |
15.4 |
15.9 |
17.5 |
19.6 |
All India |
Rural |
24.1 |
23.9 |
24.4 |
25.0 |
25.7 |
5.7 |
6.3 |
6.3 |
6.3 |
6.9 |
|
Urban |
135.3 |
133.7 |
132.3 |
137.8 |
142.8 |
19.9 |
20.4 |
21.8 |
26.3 |
29.9 |
Source : Compiled from Various Issues of BSR, RBI and Census Data. |
|
|
|
|
Within this low level of banking penetration, there was also wide inter-district divergence. The total deposit accounts (including term deposits) per 100 population reveal the following. 2
In 2005, the range in the ratio within a State was:3
Arunachal Pradesh - from 3.4 (Dibang Valley) to 55 (West Kameng);
Assam - from 13.6 (Dhubri) to 56.4 (Kamrup);
Manipur - from 2.3 (Tamenglong) to 20.4 (Imphal);
Meghalaya - from 2.9 (South Garo Hills) to 52 (East Khasi Hills);
Mizoram - from 5.4 (Lawngtlai) to 26.2 (Aizwal);
Nagaland - from 3.4 (Tuensang) to 37 (Dimapur); and Tripura - from 18.9 (Dhalai) to 37 (West Tripura).
The ratio declined during 2001 to 2005 in most of the districts in each of the States. Further, districts that had the highest ratio were almost always the district with respective State capital or commercial town/cities having better banking facility. This inter-district disparity across the States is partly explained by APPBO, with correlation coefficient of -0.54, i.e., the districts with higher bank penetration (lower the APPBO), in general also had higher deposit accounts per 100 population.
Deposit and Credit Growth
The deposit and credit growth rate were estimated using a semi-log trend of the following type,
LogY = β0+β1Trend with β1as the estimate of growth tate. Over the entire period of 1972 to 2005, deposit growth for the region as whole was 17.3 per cent, with each of the States, barring Assam, recording growth rates above the national average of 16.3 per cent. Eventhough, as a national pattern, there was a continuous deceleration in the growth in each of the decades, the rate of deceleration was faster in the region. During 1972 to 1981 and 1981 to 1991, deposit growth in each of the States was above the national average. During 1991 to 2001, four States recorded growth below the national average, while during 2001-2005, three States recorded sub-average growth rates. Thus, during 1991 to 2005, the average deposit growth in the region was below the national average (Table 4).
With regard to credit, distinction between two types of credit, viz., sanctioned credit and utilised credit4 , is important for some of the States in the region. Credit sanctioned by the SCBs in the region could be utilised elsewhere in other parts of the country. Similarly, credit sanctioned elsewhere in other parts of the country could be utilised in the region. The difference between the two is therefore the net inflow of credit. Being less developed, the region typically receives net inflow of credit, though it is mostly confined to very few states, in particular Assam. Either this arises due to the sanctioning authority being located at other places where the corporate offices of SCBs are stationed, or more importantly, the agencies making the investment are also headquartered elsewhere. This would also reflect lack of local entrepreneurs to make investment in viable projects that exist in the region. Thus, non-local entrepreneurs or firms exploit these investment opportunities, but they seek bank credit from those places where they are based and not from the region. It is interesting to find that over the period 1972 to 2005, sanctioned credit growth for the region as a whole of 16.4 per cent was above the national average of 15.5 per cent, with each of the constituting States recording a higher growth. They ranged from 15.6 per cent (Assam) to 26.9 per cent (Mizoram) (Table 5). However, growth in utilised credit was below the national average for the region as whole, even though all the States, barring Assam, recorded growth rates higher than the national average. This reflects the predominant share of Assam in credit utilisation in the region or most of the net inflow of credit was confined to Assam.
Table 4: Deposit Growth |
(in per cent) |
States |
Annual growth |
Annual growth |
Annual growth |
Annual growth |
Annual growth |
|
1972-1981 |
1981-1991 |
1991-2001 |
2001-2005 |
1972-2005 |
1 |
2 |
3 |
4 |
5 |
6 |
A.P |
30.5 |
25.1 |
14.2 |
16.8 |
22.0 |
Assam |
21.6 |
17.4 |
15.3 |
14.1 |
15.6 |
Manipur |
27.9 |
19.5 |
16.2 |
18.5 |
17.6 |
Meghalaya |
14.6 |
20.0 |
15.2 |
15.9 |
17.0 |
Mizoram |
39.7 |
18.9 |
14.3 |
17.5 |
21.3 |
Nagaland |
27.3 |
23.0 |
15.9 |
10.3 |
19.8 |
Tripura |
17.8 |
17.8 |
20.8 |
12.8 |
18.4 |
N E Region |
21.2 |
18.5 |
15.50 |
14.3 |
17.3 |
All India |
18.3 |
16.3 |
15.50 |
15.2 |
16.3 |
Source : Authors’ estimate. |
During 1991-2001, however, there was also large-scale deceleration in the growth of both sanctioned and utilised credit, while at the national level a marginal acceleration was observed. Further, this was the only decade when the growth in both types of credit was below the national average in all the States. In the case of Assam, the sub-average growth rate continued during 2001-2005 also. During 2001-2005, there was a substantial acceleration in the growth of both sanctioned and utilised credit; far more than the trend at the national level. While the growth in sanctioned credit during 1991 to 2001 ranged from 1.93 per cent in Nagaland to 12.8 per cent in Meghalaya (national average of 14.83 per cent), they ranged from 16.0 per centin Assam to 41.0 per cent in Meghalaya during 2001-2005 (national average of 18.2 per cent) (Table 5).
Table 5: Credit Growth |
(in per cent) |
States |
Sanction |
Utilisation |
|
Annual growth
1972-1981 |
Annual growth
1981-1991 |
Annual growth
1991-2001 |
Annual growth
2001-2005- |
Annual growth
1972-2005 |
Annual growth
1972-1981 |
Annual growth
1981-1991 |
Annual growth
1991-2001 |
Annual growth
2001-2005 |
Annual growth
1972-
2005 |
1 |
2 |
3 |
4 |
5 |
6 |
7 |
8 |
9 |
10 |
11 |
A.P |
41.90 |
35.60 |
9.30 |
25.30 |
25.40 |
22.50 |
33.20 |
5.60 |
22.10 |
20.70 |
Assam |
20.80 |
19.50 |
10.10 |
16.00 |
15.60 |
15.50 |
18.30 |
7.00 |
9.20 |
14.60 |
Manipur |
24.90 |
26.30 |
10.00 |
21.40 |
18.50 |
27.50 |
25.60 |
10.20 |
20.90 |
18.60 |
Meghalaya |
15.30 |
21.10 |
12.80 |
41.00 |
17.90 |
19.80 |
24.10 |
10.30 |
53.40 |
19.20 |
Mizoram |
44.20 |
32.30 |
12.60 |
34.00 |
26.90 |
64.60 |
32.10 |
10.70 |
32.70 |
30.00 |
Nagaland |
28.90 |
23.70 |
1.93 |
24.00 |
18.00 |
30.60 |
24.20 |
1.70 |
19.30 |
18.10 |
Tripura |
40.00 |
22.00 |
6.20 |
20.20 |
19.30 |
34.10 |
21.20 |
6.97 |
19.60 |
18.30 |
N E Region |
21.80 |
20.70 |
9.50 |
20.00 |
16.40 |
16.90 |
19.60 |
7.10 |
16.40 |
15.40 |
All India |
17.80 |
14.80 |
14.83 |
18.20 |
15.50 |
17.80 |
14.80 |
14.83 |
18.20 |
15.50 |
Source : Authors’ estimate. |
A similar pattern is also observed with regard to the growth in utilised credit during 2001-05, with the notable feature that in Assam the acceleration was marginal, and as a result, the growth rate was far below the regional as well as the national average. In contrast, in Meghalaya, while the acceleration in the growth of sanctioned credit during 1991-2001 to 2001-2005 was little over three times, in terms of utilisation it was about five times, suggesting substantial inflow of credit (Table 5). The sectoral composition of this trend in the utilised credit is carried out in a later section.
Given the above trend in the decadal growth rates, we attempted to find out the most significant single year when a trend break in the growth rate could be detected during 1981 to 2005. The decade of the 1970s was excluded as many of the States started from a low base and consequently reflected exaggerated growth rates. For the same, a semi-log trend of the following type was employed.
| LogY=β0+(β2+β0)Dummy+β1Trend+(β1+β3)Dummy*Trend |
This is a kinked semi-log trend fit to check for presence of break in the growth rate over the sample period. Dummy takes a value of 1 from the point of significant departure from the overall trend growth and thereafter, and 0 otherwise.5 The point that gave the highest R-bar square, i.e., the best fit of the regression was chosen. The growth rate before the identified point is given by β1, and thereafter, it is given by (β1+β3). The growth rate accelerates after the identified point when β3 >0 and decelerates with β3 < 0 Deposit growth decelerated in all the States, except Manipur, with the years of deceleration spread between 1986, 1989 and 1992, while at the national level no such statistically significant trend was observed. The deceleration was over 10.0 percentage points in Arunachal Pradesh, Mizoram and Nagaland. Interestingly, in Manipur a contrasting trend of accelerated growth in deposit is discerned from 1986, yet remained about the decelerated growth of other States only. Notwithstanding the acceleration in the sanctioned credit in all the States during 2001-05 mentioned above, a drastic deceleration in the growth of sanction credit beginning around the early 1990s can be discerned in all but one State (Meghalya). It reflects that the deceleration since about the early 1990s was much more prominent than the acceleration in very recent years that for the combined period there is an overall deceleration. The rate of deceleration ranged from about nine percentage points in Assam to about 30.0 percentage points in Arunachal Pradesh. In contrast, for Meghalaya and at the all India level, reflecting the predominance of higher growth rate during the last five years, an accelerated growth rate from the earlier period is discerned. A similar trend is also observed in utilised credit. However, the deceleration began at a later period than that of sanctioned credit. In Assam which received the bulk of the net inflow of credit, the year from which deceleration began coincides with the onset of implementation of financial sector reforms in India, i.e., 1993-94 (Table 6).
Gap in Per Capita Deposit and Credit
As would be expected, barring Meghalaya, the per capita deposit in 1973 was much lower than the national level and continued to do so in 2005. In 1973, the per capita deposit in these States ranged from 7.7 percent of the national average in Mizoram to 95.3 per cent in Meghalaya, with regional average amounting to only 32.7 per cent of the national average. The relative gap narrowed up to 1991, and substantially so in three States, viz., Arunachal Pradesh, Mizoram and Nagaland. However, during 1991 to 2001, the gap once again enlarged markedly in the four hilly States of Arunachal Pradesh, Meghalaya, Mizoram and Nagaland. During 2001 to 2005, there was a mixed trend with the gap narrowing for some States and widening for some States leading to a widening of the gap for the region from the national average since 1991. In 2005, per capita credit ranged from 25.7 per cent of the national average in Manipur to 78.4 per cent in Meghalaya, with the regional average forming 43.1 per cent of the national average (Table 7).
Table 6: Trend Break in the Growth of Deposit and |
Credit During 1981 to 2005 |
(in per cent) |
States |
Deposit |
Sanction |
Utilised |
Before Break |
After Break |
Break at |
Before Break |
After Break |
Break at |
Before Break |
After Break |
Break at |
1 |
2 |
3 |
4 |
5 |
6 |
7 |
8 |
9 |
10 |
A.P |
25.14 |
14.16 |
1992 |
41.94 |
11.32 |
1986 |
33.16 |
12.67 |
1992 |
Assam |
19.25 |
15 |
1989 |
20.59 |
11.66 |
1991 |
17.37 |
15.03 |
1994 |
Manipur |
10.49 |
15.91 |
1986 |
29.99 |
9.84 |
1990 |
28.92 |
9.78 |
1989 |
Meghalaya |
22.39 |
15.56 |
1989 |
14.61 |
40.99 |
2001 |
19.25 |
34.98 |
1997 |
Mizoram |
30.58 |
15.72 |
1986 |
32.38 |
20.26 |
1992 |
42.78 |
16.67 |
1990 |
Nagaland |
27.03 |
14.61 |
1989 |
28.1 |
6.95 |
1989 |
29.34 |
6.57 |
1989 |
Tripura |
20.75 |
17.84 |
1992 |
23.15 |
9.1 |
1991 |
22.87 |
9.17 |
1991 |
N E Region |
20.46 |
15.28 |
1989 |
21.77 |
11.9 |
1991 |
18.21 |
15.24 |
1994 |
All India |
16.48 |
16.38 |
1986 |
14.61 |
17.74 |
2000 |
|
|
|
Source : Authors’ estimate. |
The gap in the per capita credit from the national average was much larger than the corresponding gap in per capita deposit. In 1973, sanctioned per capita credit ranged from no credit in Mizoram to 33.8 per cent of the national per capita credit in Meghalaya, with regional average forming only 16.6 per cent of the national average. During 1973 to 1991, there were significant catch up in all the States, except Meghalaya, thereby more than doubling the level of regional sanctioned per capita credit to 35.2 per cent of the national average. During 1991 to 2001, the trend reversed and the gap from the national average enlarged markedly in all the States, though some recovery has taken place during 2001 to 2005, excepting Assam. Thus, in 2005, the gap in per capita sanctioned credit from the national level remained glaring, with the level ranging from 12.9 per cent of national average in Nagaland to 50.4 per cent in Meghalya and a regional average of 23.0 per cent (Table 8).
Table 7: Per Capita Deposit as ratio to national average |
(in per cent) |
States |
1973 |
1981 |
1991 |
2001 |
2005 |
1 |
2 |
3 |
4 |
5 |
6 |
A.P |
14.4 |
32.4 |
71.4 |
60.9 |
65.1 |
Assam |
30.6 |
32.6 |
41.4 |
40.0 |
39.9 |
Manipur |
15.5 |
22.2 |
24.8 |
19.6 |
25.7 |
Meghalaya |
95.3 |
65.5 |
90.0 |
77.2 |
78.4 |
Mizoram |
7.7 |
35.4 |
63.2 |
48.0 |
52.3 |
Nagaland |
32.1 |
48.1 |
74.7 |
48.8 |
38.5 |
Tripura |
34.8 |
32.4 |
42.6 |
53.1 |
49.1 |
N E Region |
32.7 |
34.2 |
45.9 |
43.3 |
43.1 |
All India |
100 |
100 |
100 |
100 |
100 |
Source : Estimated from BSR, RBI and Census data. |
The gap with respect to per capita utilised credit was also large and remained so, but due to net inflow of credit it was narrower than the gap in terms of per capita sanctioned credit. In 1973, due to Assam (37.3 per cent of national average), the regional per capita utlised credit was 30.0 per cent of the national average, much higher than 16.6 per cent in terms of sanctioned credit. The State-wise range was no credit in Mizoram to 37.3 per cent of the national average in Assam. In 1991, the regional average moved up to 45.1 per cent of national average, with State-wise range of 28.5 per cent in Manipur to 58.2 per cent in Arunachal Pradesh. However, due to much slower growth in credit during 1991 to 2001, the per capita utlised credit for the region formed only 24.4 per cent of the national average in 2001. The difference between the utlised and sanctioned credit also declined during this period, indicating decline in the share of net inflow of credit in the total utilised credit in the region.
During 2001 to 2005, the gap from the national average narrowed down once again in all the States, except Assam. Meghalya and Mizoram particularly have made significant gain during the last five years, and for the former, the level of per capita utilised credit in2005 was about the national average. Yet, because of the enlargement of the gap during the decade of the 1990s and the continuance of this trend in Assam, in 2005, the per capita utilised credit for the region was 29.3 per cent of the national average only; a gap even higher than what was in 1973. Thus, it is observed that much of the gain achieved in narrowing down the gap during the decades of the 1970s and the 1980s lost its ground during the last 15 years, and in particular during the decade of the 1990s (Table 8).
Table 8: Per Capita Credit as a ratio to National Average |
(in per cent) |
States |
Sanction |
Utilised |
1973 |
1981 |
1991 |
2001 |
2005 |
1973 |
1981 |
1991 |
2001 |
2005 |
1 |
2 |
3 |
4 |
5 |
6 |
7 |
8 |
9 |
10 |
11 |
A.P |
0.9 |
5.1 |
31.4 |
15.8 |
21.8 |
7.3 |
11.2 |
58.2 |
23.7 |
29.8 |
Assam |
18.2 |
26.1 |
34.7 |
23.2 |
21.6 |
37.3 |
31.6 |
46.7 |
26.9 |
25.7 |
Manipur |
6.9 |
10.9 |
28.2 |
14.4 |
16.4 |
5.5 |
13.3 |
28.5 |
14.0 |
16.4 |
Meghalaya |
33.8 |
16.7 |
29.9 |
22.9 |
50.4 |
16.4 |
19.6 |
37.5 |
23.6 |
99.0 |
Mizoram |
0.0 |
5.4 |
26.7 |
20.7 |
38.5 |
0.0 |
9.2 |
31.0 |
24.6 |
47.5 |
Nagaland |
15.8 |
12.8 |
38.3 |
10.4 |
12.9 |
15.5 |
22.7 |
57.4 |
11.7 |
13.1 |
Tripura |
5.2 |
25.3 |
49.4 |
20.4 |
21.4 |
8.2 |
27.3 |
41.7 |
20.3 |
21.6 |
N E Region |
16.6 |
22.6 |
35.2 |
21.5 |
23.0 |
30.0 |
28.6 |
45.1 |
24.4 |
29.3 |
All India |
100 |
100 |
100 |
100 |
100 |
100 |
100 |
100 |
100 |
100 |
Source : Estimated from BSR, RBI and Census data. |
Gap in Deposit and Credit to Income (NSDP) Ratio
A number of studies [King and Levine (1992 and 1993), Benhabib and Spiegel (2000) and Khan and Snehadji (2003)] indicate that financial development is one of the major determinants of economic growth. While the direction of causality between financial development and economic growth is an unsettled issue, the higher the level of economic development the higher is the extent of financial deepening measured by the ratio of deposit and credit to GDP. In many developed countries of the Western countries, where financial deepening has reached a matured stage, credit and deposit to GDP ratios are much above 100.0 per cent. For instances, credit to GDP ratios in UK is around 159.0 per cent and in the Euro area it is about 145.0 per cent. These ratios are much lower in the developing countries like India, and more so in underdeveloped pockets such as North Eastern Indian States.
Deposit to NSDP ratio increased substantially since the beginning of the 1980s. However, the absolute gap from the national average increased over the years. The regional deposit to NSDP ratio, which stood at 17.7 per cent during 1981-1985 increased to 35.8 per cent during 2001-05, as against the increase in the national average from 35.6 per cent to 63.6 per cent during the same period. The gap with the national average enlarged significantly during the quinquennium 2001-2005. The increase in the ratio during this quinquennium over the previous one was 6.0 percentage points in the region, which was less than half the increase at the national level of 15.8 percentage points. Large divergence in the ratio persists among the constituting States. Mizoram and Nagaland have recorded the slowest increase in the ratio, and as a result, from second and third highest during 1981-85, they fell to third and second lowest, respectively, during 2001-05. Manipur and Meghalaya have continued to be the States with the lowest and the highest ratio throughout. During 2001-05, the ratio ranged from 21.8 per cent in Manipur to 56.8 per cent in Meghalaya, as against the national average of 63.6 per cent (Table 9 and Chart 1).
Table 9: Deposit to NSDP Ratio |
(in per cent) |
During |
A.P. |
Assam |
Manipur |
Meghalaya |
Mizoram |
Nagaland |
Tripura |
N.E. |
India |
1 |
2 |
3 |
4 |
5 |
6 |
7 |
8 |
9 |
10 |
1981-85 |
13.7 |
18.0 |
8.5 |
29.1 |
26.2 |
21.2 |
12.3 |
17.7 |
35.6 |
1986-90 |
25.4 |
23.4 |
12.7 |
41.6 |
21.8 |
28.6 |
20.2 |
24.1 |
43.5 |
1991-95 |
31.7 |
24.1 |
13.6 |
41.9 |
24.4 |
21.9 |
24.6 |
25.0 |
45.6 |
1996-00 |
35.7 |
29.3 |
16.5 |
46.3 |
25.2 |
28.6 |
29.0 |
29.8 |
47.8 |
2001-05 |
45.9 |
39.5 |
21.8 |
56.8 |
27.9 |
26.9 |
34.2 |
35.8 |
63.6 |
Source : Estimated from BSR and Handbook of Statistics, RBI. |
|
|
|
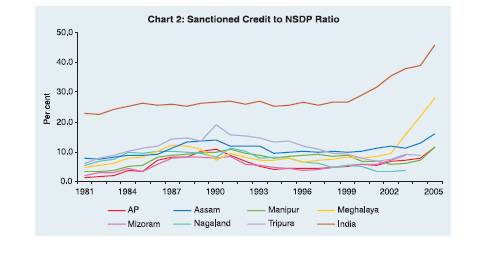
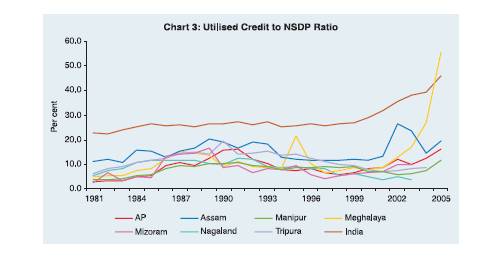
Both sanctioned and utilised credit to NSDP ratio has remained not only lower than the national ratio, but the gap has widened since 1991-95. During 1986-90 and 1996-2000, while the ratio increased slowly at the national level, they declined in each of the States for both the types of credit. For utilised credit, the ratio for the regionduring 1996-2000 was lower than the ratio during 1981-85. The declining trend in the ratio has continued in Manipur, Nagaland and Tripura during 2001-05, while in the rest it increased. Thus, during 2001-05, while the credit to NDP ratio for the country was 38.1 per cent, for the region it was 9.8 per cent for sanctioned credit and 16.0 per cent for utilised credit, with the respective range among the States for the two types of credit being 3.5 per cent in Nagaland to 16.8 per cent in Meghalaya for sanctioned credit and 4.0 per cent in Nagaland and 24.2 per cent in Meghalaya for utilised credit (Table 10, Chart 2 and 3). 
Table 10: Credit to NSDP Ratio |
(in per cent) |
Average |
A.P |
Assam |
Manipur |
Meghalaya |
During |
sanction |
utilisation |
sanction |
utilisation |
sanction |
utilisation |
sanction |
utilisation |
1 |
2 |
3 |
4 |
5 |
6 |
7 |
8 |
9 |
1981-85 |
2.5 |
4.0 |
8.3 |
13.0 |
4.3 |
4.5 |
6.5 |
6.3 |
1986-90 |
8.9 |
11.6 |
12.4 |
16.8 |
9.2 |
9.6 |
10.5 |
13.0 |
1991-95 |
6.0 |
10.8 |
11.0 |
15.8 |
9.2 |
9.2 |
8.0 |
11.7 |
1996-00 |
4.9 |
7.1 |
10.1 |
11.6 |
8.5 |
8.6 |
7.4 |
8.2 |
2001-05 |
7.9 |
11.8 |
12.7 |
19.4 |
7.5 |
7.5 |
16.8 |
24.2 |
Average |
Mizoram |
Nagaland |
Tripura |
NE |
India |
During |
sanction |
utilisation |
sanction |
utilisation |
sanction |
utilisation |
sanction |
utilisation |
sanction |
1 |
2 |
3 |
4 |
5 |
6 |
7 |
8 |
9 |
10 |
1981-85 |
3.2 |
4.4 |
7.8 |
8.7 |
8.8 |
9.1 |
7.7 |
11.2 |
24.3 |
1986-90 |
7.6 |
13.4 |
9.7 |
10.9 |
14.8 |
15.1 |
12.0 |
15.5 |
26.0 |
1991-95 |
5.8 |
8.3 |
9.1 |
10.3 |
14.6 |
14.3 |
10.6 |
14.4 |
26.3 |
Gap in Credit Deposit Ratio
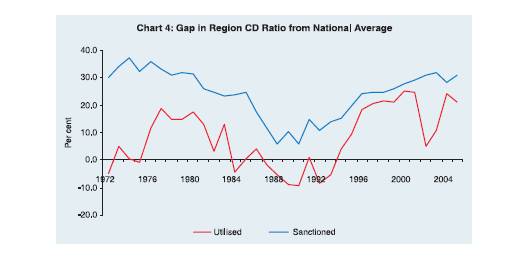
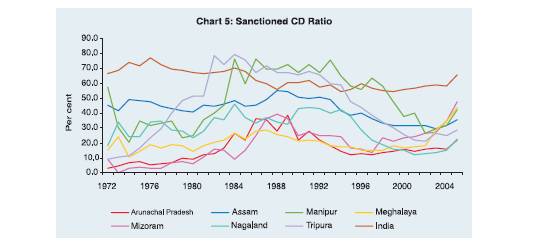
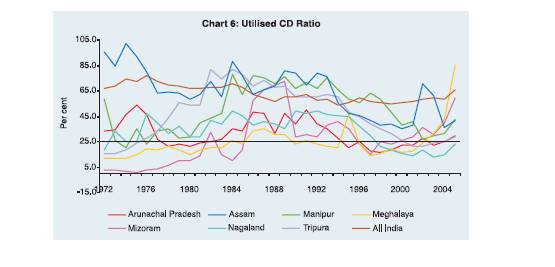
The higher gap in credit vis-à-vis deposit from the national average is reflected on the lower CD ratio in the region. However, there are differences between the CD ratio as per sanction and utilisation, and also among the States. First, there has been a substantial gap between the two types of credit in Arunachal Pradesh and Assam, and Meghalaya in the most recent years. Second, the ratio for both types of credit increased in all the States during 1972-75 to 1986-90, while at the national level a declining trend was observed. Yet, during 1986-90, when the sanctioned C-D ratio was at its peak in each of the States, they ranged from 25.6 per cent in Meghalaya to 71.3 per cent in Manipur, with a regional average of 49. 6 per cent, as against the national average of 59.9 per cent (Table 11). Only two States, viz., Manipur and Tripura had higher than national CD ratio during the major part of the 1980s and first half of the 1990s. Third, while the gap with respect to sanctioned credit was large, in terms of utilised credit, the regional average did not diverge much from the national averge during 1972-75 to 1991-95 (Chart 4). This was due to a much higher CD ratio as per utilisation in Assam during this period. Fourth, since the first half of the 1990s, both types of C-D ratio dipped substantially in all theStates, though Arunachal Pradesh, Meghlaya and Mizoram have made some recovery during 2001-2005. The result was that, for the region as a whole, a substantial gap from the national averagedeveloped for both types of credit, while earlier the gap was only in terms of sanctioned credit. Fifth, the inter-State disparity in CD ratio decreased substantially, but at a lower level than earlier. During 2001-05, sanctioned CD ratio ranged from 15.3 per cent in Nagaland to 34.1 per cent in Manipur, with a regional average of 29.4 per cent, as against the national average of 59.7 per cent. During the same period, utilised CD ratio ranged from 26.7 per cent in Nagaland to 49.5 per cent in Assam (Table 11, Chart 5 and 6).
Table 11: Credit Deposit Ratio |
(in per cent) |
Average |
A.P |
Assam |
Manipur |
Meghalaya |
During |
sanction |
utilisation |
sanction |
utilisation |
sanction |
utilisation |
sanction |
utilisation |
1 |
2 |
3 |
4 |
5 |
6 |
7 |
8 |
9 |
1972-1975 |
5.5 |
41.9 |
45.9 |
93.5 |
35.8 |
35.0 |
16.2 |
12.8 |
1976-1980 |
7.3 |
27.7 |
43.6 |
65.6 |
29.8 |
29.8 |
17.4 |
18.5 |
1981-1985 |
18.1 |
28.7 |
46.0 |
72.3 |
51.4 |
54.0 |
22.1 |
21.6 |
1986-1990 |
32.2 |
42.9 |
50.9 |
71.2 |
71.3 |
73.0 |
25.6 |
30.6 |
1991-1995 |
19.0 |
34.6 |
45.9 |
65.6 |
67.7 |
67.6 |
19.1 |
27.5 |
1996-2000 |
13.8 |
20.0 |
34.8 |
39.8 |
52.6 |
52.7 |
16.0 |
17.8 |
2001-2005 |
17.0 |
25.4 |
32.0 |
49.5 |
34.1 |
34.5 |
28.5 |
40.4 |
Average |
Mizoram |
Nagaland |
Tripura |
NE |
India |
During |
sanction |
utilisation |
sanction |
utilisation |
sanction |
utilisation |
sanction |
utilisation |
sanction |
1 |
2 |
3 |
4 |
5 |
6 |
7 |
8 |
9 |
10 |
1972-1975 |
4.0 |
1.8 |
25.1 |
25.4 |
11.8 |
18.5 |
37.0 |
70.6 |
70.5 |
1976-1980 |
5.2 |
6.4 |
29.8 |
36.9 |
38.6 |
42.7 |
38.4 |
55.6 |
71.2 |
1981-1985 |
13.0 |
18.2 |
36.8 |
40.8 |
71.6 |
73.9 |
43.4 |
62.9 |
68.0 |
1986-1990 |
32.4 |
58.8 |
36.1 |
40.4 |
67.8 |
68.0 |
49.6 |
64.1 |
59.9 |
1991-1995 |
23.7 |
34.6 |
41.5 |
46.8 |
60.0 |
58.4 |
42.5 |
57.4 |
57.7 |
1996-2000 |
19.4 |
22.6 |
20.3 |
24.4 |
34.5 |
35.2 |
31.0 |
35.0 |
56.5 |
2001-2005 |
32.1 |
38.9 |
15.3 |
16.7 |
24.7 |
24.1 |
29.4 |
42.3 |
59.7 |
Source : Estimated from BSR, RBI. |
Sectoral Deployment of Credit
The following provides the trend in the sectoral composition of utilised credit in these States vis-à-vis the national pattern. There has been a decline in the share of agriculture, which in most of the States were above 20.0 per cent during 1980-83 and 1992-95, and were markedly above the share in the national average. While this decline in the share of agriculture is a national phenomenon, the extent of decline between 1992-95 and 2001-05 was much more striking in most of the States in the region. The decline in the share of industry was even more than that of agriculture, with the exception of Meghalaya (due to one time financing of state electricity board by a nationalised bank) and Tripura where share of industry has been traditionally low. The share of transport operators also dipped significantly, but most of the decline in its share took place during 1980s. Similarly, barring Arunachal Pradesh, the share of trade also declined in all the States. However, within trade, share of retail trade has been predominant in the region, which is unlike at the national level where wholesale trade, which is considered to be more productive than retail trading (Roy, 2006), corners a larger share (Table 12).
On the other hand, share of personal loans increased substantially in all the States. While this has been a national trend, it was much more prominent in the region that, for most of the States, this sector now constitutes the most important sector in the utilisation of bank credit. The share of personal loan during 2001-05 ranged from 23.0 per cent in Meghalaya to 44.6 per cent in Mizoram, as against the national average of 20.1 per cent (Table 12 and Chart 7).Thus, even though the total CD ratio during 2001-05 was substantially lower than national average in all the States in the region, credit for personal loans to deposit ratio of 10.7 per cent for the region as a whole was higher than the national average of 9.94 per cent, with three States exceeding the national average and the rest of the States rapidly catching up (Table 13).
Table 12: Sectoral Share of Utilised Credit |
(in per cent) |
Sectors |
Arunachal Pradesh |
Assam |
Manipur |
Meghalaya |
1992-95 |
2001-05 |
1980-83 |
199295- |
2001-05 |
1980-83 |
1992-95 |
2001-05 |
1980-83 |
1992-95 |
2001-05 |
1 |
2 |
3 |
4 |
5 |
6 |
7 |
8 |
9 |
10 |
11 |
12 |
Agriculture |
12.2 |
10.1 |
20.9 |
15.2 |
7.1 |
18.7 |
13.2 |
11.1 |
16.2 |
21.9 |
6.6 |
Direct Finance |
11.2 |
8.9 |
17.9 |
11.7 |
5.3 |
12.7 |
11.9 |
8.6 |
12.3 |
18.5 |
5.0 |
Indirect Finance |
2.1 |
1.1 |
3.1 |
3.5 |
1.8 |
5.9 |
2.1 |
2.5 |
0.4 |
3.4 |
1.5 |
Industry |
58.8 |
18.8 |
45.6 |
46.6 |
34.7 |
16.4 |
36.8 |
18.5 |
15.7 |
26.7 |
43.2 |
Transport Operators |
6.4 |
3.6 |
7.2 |
4.3 |
2.3 |
33.8 |
8.6 |
2.5 |
28.0 |
6.0 |
2.8 |
Professional& |
|
|
|
|
|
|
|
|
|
|
|
Other Services |
1.8 |
7.6 |
2.2 |
2.4 |
2.8 |
3.6 |
2.1 |
3.7 |
5.0 |
2.1 |
3.7 |
Personal Loans |
7.5 |
29.2 |
2.3 |
9.3 |
24.8 |
5.0 |
12.0 |
39.6 |
8.0 |
15.7 |
23.0 |
Rest Of Personal Loans |
5.8 |
21.6 |
|
5.6 |
14.7 |
|
6.8 |
22.1 |
|
7.2 |
13.6 |
Trade |
4.7 |
16.9 |
17.7 |
16.1 |
12.2 |
18.3 |
23.3 |
14.2 |
19.2 |
16.1 |
10.6 |
Wholesale Trade |
1.1 |
4.0 |
|
3.6 |
3.8 |
|
2.7 |
2.0 |
|
3.5 |
3.4 |
Retail Trade |
3.6 |
13.0 |
|
12.5 |
8.4 |
|
20.6 |
12.3 |
|
12.6 |
7.2 |
Finance |
0.0 |
1.7 |
|
1.0 |
3.3 |
|
1.8 |
0.1 |
|
1.0 |
0.2 |
All Others |
8.5 |
12.1 |
4.0 |
5.2 |
12.8 |
4.3 |
2.2 |
10.3 |
6.2 |
10.6 |
9.9 |
Total |
100.0 |
100.0 |
100.0 |
100.0 |
100.0 |
100.0 |
100.0 |
100.0 |
100.0 |
100.0 |
100.0 |
SSI |
7.3 |
6.6 |
8.6 |
11.0 |
6.0 |
5.7 |
28.8 |
10.3 |
6.9 |
8.6 |
4.0 |
Sectors |
Mizoram |
Nagaland |
Tripura |
All India |
|
1992-95 |
2001-05 |
1980-83 |
951992- |
2001-05 |
1980-83 |
1992-95 |
2001-05 |
1980-83 |
1992-95 |
2001-05 |
1 |
2 |
3 |
4 |
5 |
6 |
7 |
8 |
9 |
10 |
11 |
12 |
Agriculture |
21.0 |
10.8 |
13.8 |
20.8 |
11.5 |
28.0 |
20.8 |
14.0 |
16.5 |
13.3 |
10.7 |
Direct Finance |
19.9 |
10.1 |
12.5 |
17.3 |
10.1 |
23.4 |
18.6 |
13.1 |
12.5 |
11.6 |
8.7 |
Indirect Finance |
1.1 |
0.7 |
1.3 |
3.5 |
1.4 |
4.5 |
2.2 |
0.9 |
4.0 |
1.7 |
2.0 |
Industry |
31.2 |
13.1 |
33.0 |
38.0 |
23.4 |
16.2 |
19.7 |
13.1 |
48.5 |
47.5 |
35.2 |
Transport Operators |
10.6 |
6.5 |
20.8 |
7.7 |
2.5 |
24.6 |
6.4 |
3.6 |
4.9 |
2.2 |
2.0 |
Professional&Other Services |
1.1 |
1.4 |
5.2 |
2.5 |
4.5 |
2.5 |
2.7 |
6.4 |
2.4 |
2.1 |
4.0 |
Personal Loans |
8.8 |
44.6 |
4.4 |
11.4 |
29.9 |
5.3 |
13.7 |
33.8 |
3.7 |
9.0 |
20.1 |
Rest Of Personal Loans |
3.1 |
13.3 |
|
7.3 |
23.2 |
|
10.2 |
19.9 |
|
5.1 |
9.8 |
Trade |
18.2 |
14.7 |
18.0 |
14.6 |
12.0 |
14.2 |
30.7 |
20.6 |
18.4 |
15.6 |
16.2 |
Wholesale Trade |
4.0 |
3.7 |
|
2.2 |
3.4 |
|
3.0 |
4.0 |
|
10.4 |
8.7 |
Retail Trade |
14.3 |
11.0 |
|
12.3 |
12.0 |
|
27.7 |
16.5 |
|
5.2 |
7.5 |
Finance |
1.2 |
0.1 |
|
0.1 |
1.5 |
|
3.8 |
0.3 |
|
2.9 |
4.8 |
All Others |
7.8 |
8.7 |
4.8 |
4.9 |
14.6 |
9.1 |
2.2 |
8.2 |
5.6 |
7.2 |
6.9 |
Total |
100.0 |
100.0 |
100.0 |
100.0 |
100.0 |
100.0 |
100.0 |
100.0 |
100.0 |
100.0 |
100.0 |
SSI |
11.0 |
6.3 |
14.5 |
20.3 |
10.0 |
7.2 |
11.4 |
6.6 |
11.8 |
11.8 |
6.1 |
Source : Estimated from BSR, RBI. |

The broad observations which follow from the trends in the above banking indicators are: first, much more rapid strides were made in the region in all the banking indicators during the first two decades of the post nationalisation phase since 1969. Consequently, the gap from the national average narrowed down significantly, and in indicators such as APPBO, it crossed over, i.e., lower than the national average, in Arunachal Pradesh, Meghlaya and Mizoram. Yet, in almost all the other remaining indicators, the gap remained glaring as the States in the region started from a much lower base. Second, much of the gain during the first two decades of post-nationalisation phase lost its ground during the decade of the 1990s, and for some of the indicators such as the level of current and savings accounts per 100adult population and per capita credit, the gaps from the national average reverted back to the level of earlier period. Given the trend at the national level, widening of gap in the banking indicators of the region from the national average during the 1990s indicates retardation on in the growth of activities of SCBs in the region during this period. Third, there has been a differential impact among the States in the region.
Table 13: Personal Loan to Deposit Ratio |
(in per cent) |
Year |
Arunachal |
Assam |
Manipur |
Meghalaya |
Mizoram |
Nagaland |
Tripura |
N.E. Region |
India |
1 |
2 |
3 |
4 |
5 |
6 |
7 |
8 |
9 |
10 |
2001 |
4.27 |
6.99 |
9.01 |
4.32 |
10.29 |
3.76 |
5.20 |
6.37 |
6.95 |
2002 |
6.13 |
8.35 |
8.58 |
4.84 |
11.98 |
3.83 |
6.43 |
7.53 |
7.35 |
2003 |
6.47 |
13.27 |
12.74 |
5.60 |
15.76 |
4.07 |
7.83 |
11.14 |
8.93 |
2004 |
8.78 |
12.39 |
16.85 |
10.41 |
21.32 |
5.89 |
9.21 |
11.71 |
11.85 |
2005 |
12.07 |
15.80 |
20.83 |
24.20 |
29.04 |
10.96 |
11.69 |
16.50 |
14.65 |
Average |
7.55 |
11.36 |
13.60 |
9.87 |
17.68 |
5.70 |
8.07 |
10.65 |
9.94 |
Source : Estimated from BSR, RBI. |
Section III Explaining Observed Trends and Impediments to Flow of Credit Reasons for the Observed Trend
Given the unique features of the region, the financial sector reforms introduced since the beginning of the 1990s will have much to do with the observed trends. A substantial transformation of the banking sector has taken place with the introduction of decontrol of interest rates, reduction of pre-emption of banking resources, while at the same time putting in place the international best practices on prudential norms, income recognition and capital adequacy, among others. Given the health of the SCBs at that time, these measures severely restricted the leverage and the bottom lines of banks in India. In the new environment, SCBs slowed down branch expansion where the business prospect was limited, and curtailed credit when the risk of default was high.
In the region, these problems were much more severe due to the unique features of the States. Low business prospects was combined with lower recovery rate and higher NPAs, which led to severe curtailment in branch expansion and credit disbursement in the aftermath of financial sector reforms. These constraints were not there earlier, as SCBs following nationalisation, adopted social banking with less consideration on commercial aspects. However, as pointed out by Mohan (2006), at the national level also this strategy of banking development may have reached its limit by the 1990s. Some of the indicators which reflect this lower volume of business are deposit and credit per branch and per employee (Table 14). In 1991, the average deposit per branch for the region was Rs. 183 lakh (state-wise range from Rs. 129 in Manipur to Rs. 301 lakh in Nagaland), as against the national average of Rs. 325 lakh. As on 2005, the respective figures were Rs. 1,432 lakh (state-wise range from Rs. 986 in Mizoram to Rs. 1,798 in Nagaland) and Rs. 2,497 lakh. However, deposits in general are mobilised at the lower cost in the region, as the share of current deposits in total deposits is higher than national average in almost all the States. For instance, in 2005, this share was 15.85 per cent for the region (State-wise range from 11.74 per cent in Tripura to 31.64 per cent in Manipur), while at the national level it was 12.13 per cent. The higher share of current deposit could arise on account of government deposit accounts, which are current in nature.
Credit per branch was even lower. In 1991, the average credit per branch in the region was Rs. 86 lakh (state-wise range from Rs. 39 lakh in Mizoram to Rs. 132 lakh in Nagaland), as against the national average of Rs. 201 lakh. In 2005, credit per branch increased to Rs. 501 lakh (state-wise range from Rs. 387 lakh in Arunachal Pradesh to Rs. 723 in Meghalaya), but remained substantially lower than the national average of Rs. 1,647 lakh.
Table 14: Business Indicators of Banks |
(in Rs. Lakh and per cent) |
States |
Deposit per branch |
Credit per branch |
Deposit per employee |
Credit per employee |
Share of Current Deposit |
|
1991 |
2005 |
1991 |
2005 |
1991 |
2005 |
1991 |
2005 |
1992 |
2005 |
1 |
2 |
3 |
4 |
5 |
6 |
7 |
8 |
9 |
10 |
11 |
A.P |
215 |
1762 |
60 |
387 |
20.9 |
193.0 |
5.8 |
42.4 |
19.3 |
22.4 |
Assam |
178 |
1398 |
88 |
493 |
15.9 |
126.1 |
7.9 |
44.5 |
18.7 |
15.0 |
Manipur |
129 |
1278 |
93 |
542 |
12.9 |
129.6 |
9.3 |
54.9 |
24.8 |
31.6 |
Meghalaya |
239 |
1657 |
53 |
723 |
20.0 |
177.8 |
4.4 |
77.6 |
17.2 |
14.3 |
Mizoram |
142 |
986 |
39 |
472 |
22.7 |
126.8 |
6.3 |
60.6 |
21.8 |
16.1 |
Nagaland |
301 |
1798 |
132 |
412 |
24.6 |
170.9 |
10.8 |
39.1 |
14.3 |
20.6 |
Tripura |
155 |
1429 |
105 |
409 |
13.2 |
128.3 |
9.0 |
36.7 |
18.5 |
11.7 |
N E Region |
183 |
1432 |
86 |
501 |
16.5 |
134.5 |
7.8 |
47.1 |
18.6 |
15.9 |
All India |
325 |
2497 |
201 |
1647 |
20.6 |
194.0 |
12.7 |
128.0 |
17.9 |
12.1 |
Deposit per employee in the region is also lower than the national average. However, the gap is much lesser than the gap in terms of deposit per branch, implying a lower number of employee per branch than the national average. Yet, the number of customers (deposit account) per staff in 2005 was lower than national average in all the States, except Assam.6 In 1991, the regional average deposit per employee was Rs. 16.54 lakh, as against the national average of Rs. 20.56 lakh, but three States (viz., Arunachal Pradesh, Mizoram and Nagaland) exceeded the national average. In 2005, none of the States exceeded the national average of Rs. 194 lakh, giving a regional average of Rs. 134.47 lakh.
Similarly, credit per employee is lower but again not to the extent of the gap observed in credit per branch.7 However, the gap from the national average is much higher for credit per employee than deposit per employee. In 1991, credit per employee for the region was Rs. 7.76 lakh (with a range of Rs. 4.42 lakh in Meghalaya to Rs. 10.81 lakh in Nagaland), while the national average was Rs. 12.73 lakh. By 2005, the gap enlarged with regional average of Rs. 47.07 lakh as against the national average of Rs. 127.99 lakh, while State-wise, it ranged from 36.75 lakh in Tripura to Rs. 77.56 lakh in Meghalaya.
In other words, both the business turnover per branch and employee are lower than the national average and the gap grew. Within this situation, liability (deposit) per branch and per employee was relatively higher than the corresponding asset (credit) per branch and per employee in the region. On the other hand, the share of non-performing component of these credits was much higher, thereby indicating that banks branches were more unviable in region than at the national level. Half a decade after the initiation of financial sector reforms, i.e., in 1999, the NPA to advances ratio of SBI, the commercial bank with largest business share in the region, ranged from 28.5 per cent in Meghalaya to as high as about 60.0 per cent in Manipur and Nagaland, as against the banks total ratio of 15.6 per cent. Even in 2005, the NPA to advances ratio of all SCBs in four States, for which data are available, ranged from 8.4per cent in Mizoram to about 14.5 per cent in Manipur and Nagaland, as against the national average of 5.2 per cent. These higher NPA in the region arises from very low recovery rate from priority sector advances, which accounts for bulk of the total advances in all the States. In 1999, the recovery rate for all banks including cooperatives ranged from a low of 4.8 per cent in Manipur to 45.0 per cent in Arunachal Pradesh, which is low by any standard. Improvement in the recovery rate has taken place in all the States by 2005, except Arunachal Pradesh, yet remained much to be desired ranging from 26.0 per cent in Arunachal Pradesh to 58.0 per cent in Mizoram. The recovery rate under government schemes was even lower, though it improved during 1999 to 2005 (Table 15).
Table 15: NPA to Advances Ratio and Recovery Rates |
(in per cent) |
States |
NPA/Advances
of SBI in 1999 |
NPA/Advances
of SCBs in 2005 |
Recovery rate from PSA |
Recovery from Govt. Schemes |
1999 |
2005 |
1999 |
2005 |
1 |
2 |
3 |
4 |
5 |
6 |
7 |
A.P |
30.5 |
n.a. |
44.6 |
26 |
19.9 |
24 |
Assam |
40.5 |
11.9 |
14.4 |
36 |
7.1 |
34 |
Manipur |
59.5 |
14.44 |
4.8 |
37 |
5.4 |
17 |
Meghalaya |
28.5 |
n.a. |
31.2 |
49 |
9.9 |
49 |
Mizoram |
36.7 |
8.35 |
36.7 |
58 |
17.7 |
58 |
Nagaland |
59.8 |
14.3 |
11.4 |
46 |
5.3 |
46 |
Tripura |
31.4 |
n.a. |
12 |
30 |
9.3 |
30 |
All India |
15.6 |
5.2 |
n.a. |
n.a. |
n.a. |
n.a. |
Source :
Report of Trend and Progress of Banking in India,
SLBC Agenda Notes of Respective States and Kaveri (undated mimeo). |
The lower volume of business, higher proportion of bad loans, coupled with sparse settlement of population and growing law and order problem, to mention a few of the problems, while the banks were required to follow a stricter prudential norms, thus led to deceleration in the growth of activities of SCBs in the region.
Impediments
A number of factors which limit the credit absorption capacity, enhance the risk of default and impede increasing the outreach of banks and flow of bank credit in the region are identifiable. Lack of adequate infrastructure in the form of roads, communications and transport and power, which restricts the movement goods and services, people, and development of a common market, has been the most important impediment to socioeconomic growth of the region. Tenth Finance Commission estimated that when the national economic and social infrastructure index is 100, the index ranged from 48 in Arunachal Pradesh to 82 in Assam. Barring Assam and almost a negligible part of Nagaland, there are no rail links. Even the existing links are mostly single track, which reduces the speed drastically. Most of the national highways and the state highways continue to remain in dilapidated conditions in hilly terrains with winding roads, while district and village roads are even worse.
Agriculture sector is highly underdeveloped with production mostly for subsistence. In the plain areas, the population pressure is much higher than the national average, reflected in much lower operational size of holding. The operational holding size in Assam, Manipur and Tripura ranged from 0.60 hectare to 1.17 hectare, as against the national average of 1.41 hectare. In these three States, marginal and small operational holdings account for 44 per cent (Assam) to 76 per cent (Tripura) of the total holdings, as against the national average of 36 per cent. Small operational size of holding restricts use of modern inputs, which reduces the demand for institutional credit. Further, while the yield per hectare in the plain areas is higher than the national average (for instance foodgrain yield in Manipur and Tripura in 2000-01 was 2,305 Kgs. per hectare and 2,059 Kgs. per hectare respectively, as against the national average of 1,636 Kgs. per hectare), yield per population dependent on agriculture is not necessarily higher because of the higher population pressure. In Assam, both the yield per hectare and cultivators are lower. As a result, the available marketable surplus is lower limiting generation of cash flows. For instance, the marketable surplus ratio of rice in Assam in 2001-02 was 46 per cent, much lower than the national average of 73.6 per cent and each of the major rice producing States in the country (see GOI, 2004). On the other hand, in the hill areas, large areas are still under shifting cultivation. Even under settled cultivation, due to topographical reasons, there are constraints to adoption of modern cultivation method, and consequently, the yield rate per hectare and per agricultural worker is much lower. In Arunachal Pradesh and Nagaland, the operational holding size is higher ranging from 3.31 hectare to 4.82 hectare, but the foodgrain yield ranged from 1,103 Kgs. per hectare to 1,550 Kgs. per hectare in 2000-01. Thus, limited marketable surplus is again generated. This is also reflected from the fact that no States in the region is self-sufficient in foodgrain production, of which rice is the major crop. Besides, inadequate post-harvest infrastructure like warehouses facility and dearth of organised market facilities under scattered production generating limited volume of outputs severely restricts the monetisation and development of agricultural sector. Despite being an agrarian economy with a higher percentage of population dependent on agriculture and allied activities, and a greater share in NSDP than the national average of 22.5 per cent (ranging from 24.21 per cent in Mizoram to 35.83 per cent in Arunachal Pradesh), demand for credit from this sector, therefore, remain limited.
Due to inadequate infrastructure, various forms of subsidy granted in separate industrial policy for the region have failed to attract outside entrepreneurs, which the few first generation local entrepreneurs can not fill. Thus, no large-scale industries in the private sector exist and the industrial sector remains underdeveloped. Consequently, the share of industry in NSDP ranged from a meagre 0.15 per cent in Nagaland to 8.96 per cent in Meghalya and 15.33 per cent in Assam, as against the national average of 20.6 per cent.
The demand for credit from real sector (agriculture and industry) is, therefore not only low, but also the economic structure is lopsided with disproportionate contribution from community, social and personal services (salaried sector) in State income, of which, public administration forms a major component. Barring Assam with 49.8 per cent, the share of tertiary sector is distinctly higher than the national average of 57.0 per cent in all the States, ranging from 60.0 per cent in Arunachal Pradesh to as high as 74.0 per cent in Mizoram. Within the services sector, the contribution from community, social and personal services (CSS) in the NSDP ranged from 17.4 per cent in Assam to 35.2 per cent in Mizoram, as against the national average of 14.5 per cent. Within CSS, public administration is dominant in all the States, except Assam which shows the all India pattern. The share of public administration in NSDP ranged from 12.6 per cent in Nagaland to 18.2 per cent in Arunachal Pradesh, as compared to national average of 6.5 per cent only. The predominance of public administration can be gauged from the fact that it is either the second or third most important sub-sector after agriculture contributing to the State income in all the States, except Assam.
Even within the limited demand for credit due to the constraints provided by the above factors, the unique land tenure system such as community ownership in the hills, which not only leads to absence of legalised ownership rights and proper land records but also restricts alienation of land, disenables collaterisation of land for bank lending. While this problem is absent in the plain areas as inheritable rights are established, due to non-segregation of pattas on lands inherited over generations, collateralisation of land for bank lending in this area has also become a problem.
While low recovery rate would also follow from poor quality of credit, repayment culture is lacking in the region, and particularly so with government sponsored programmes. This could be the adverse fallout of grant culture in the region, which tends to imbibe a mindset to the people that any involvement of government means a grant and not a loan. In the region, there could also be other irregularities necessarily cropping up when government machinery is involved in bank financing that there is incentive for non-payment of loans. In fact, government is the main source of indebtedness of rural household in the region, ranging from 9.2 per cent in Manipur to 97.6 per cent in Mizoram, as against the national average of 6.1 per cent only. Even for the urban households, government is the main source in five States, ranging from 11.6 per cent in Manipur to 83.1 per cent in Nagaland (AIDIS, 1991).
The above impediments have also inflicted the local formal institutions like RRBs and Cooperatives, which together account for more than 41.0 per cent of the bank branches. As a result, while these institutions should be in a better position than all India commercial banks to cater to the local needs, they are mostly plagued with huge accumulated losses and lack of business plans. Consequently, RRBs are unable to expand their operations and a significant number of districts (19 out of 34 districts) in Meghalaya, Nagaland and Arunachal Pradesh are still not covered by them. Similarly, six of the seven Apex banks in the region are plagued by poor governance and weak financials.
The level of awareness of people on various banking schemes is low due to socio-economic conditions and cultural factors and banks not making any conscious effort to increase it. At the same time, a matured credit culture is lacking and there is preference for hassle free informal channel instead of formal procedures of typical banking transactions that requires documentation. Lack of product differentiation and innovations to suit local conditions can be another factor for inability of the formal financial institutions to replace the traditional institutions, which are flexible and informal but trustworthy being deep-rooted as it has run through generations. For instance, in the plain areas of Manipur a Chit Fund like social institutions called ‘Marup’ is pervasive, which provides to the people a highly flexible alternative avenue to banks for saving and borrowing purposes. A casual observation also finds mushrooming growth of micro lending institutions in Manipur who charges exorbitant rates of interest, yet people prefer them to banks.
The consumption level is higher in the region, and consequently, rate of financial savings is low, limiting recourse to banking channel. Using NSS consumption and NSDP data from CSO, it is estimated that, in 2002-03, private consumption as a ratio to NSDP is estimated at 52.8 per cent for the region as a whole, as against the national average of 42.3 per cent. For instance, Mizoram is one State with the highest literacy rate and the lowest APPBO, but with the highest level of consumption relative to its income, the level of current and savings accounts per 100 adult population is the third lowest among these seven States. While the socio-economic and cultural factors are important factors, lack of saving avenues due to inaccessibility to a bank branch would also encourage consumption and/or savings can take the form of non-financial assets. In this regard, as mentioned above, due to hilly terrain and the sparse settlement of population, APPBO would not fully capture the accessibility of the people to banking services.
Section IV: Summary and Concluding Remarks
From the trends in banking indicators reviewed above, the seven States in the region may be broadly classified into three sub-groups. In the first group are the Arunachal Pradesh, Meghalaya and Mizoram with low APPBO. States with medium level of APPBO are Assam and Tripura, while Manipur and Nagaland belong to the third group of very high APPBO. All the States have a much lower level of current and savings accounts, and credit accounts per 100 adult population than at the national level, but within the region, these ratios are higher in the States belonging to the first and second sub-groups. The gap in per capita deposit and credit from the national average is the least for the first group followed by the second and third group in that order. Similarly, deposit and credit to NSDP ratio follow a similar trend, though they are much lower than the national average in all the States.
The difference in CD ratio, however, does not conform to the above categorisation of States. Three States which have plain areas, viz., Assam, Manipur and Tripura used to have a much higher CD ratio, about or higher than the national average, during the 1980s and the first half of the 1990s. For Assam, much of the reason for higher ratio was due to substantial inflow of credit. The remaining four hilly States had a much lower ratio during the corresponding period. Since the mid-1990s, there has been a substantial decline in the ratio in the above three States with plain areas.
Notwithstanding the above broad categorisation differentiating the States, there was common trend of retardation in the growth of activities of SCBs in all the States during the decade of the 1990s. The number of current and savings accounts per 100 adult population (barring Assam) declined, deposit and credit growth -particularly credit- decelerated substantially, the relative gap in per capita credit and deposit, and in deposit and credit to NSDP ratio from the national average enlarged. Some reversal of this trend, however, has taken place during the last five years in most of the States. Another common trend is the much larger decline in the share of agriculture and industry in utilised credit and corresponding increase in the share of retail credit than at the national level.Both the demand and supply gaps are important reasons for low level of financial intermediation in the region. While socio-economic and cultural factors have inhibited demand for banking services, it is important to note that poor infrastructure has been one of most important constraining factor. As Reddy (2006) notes, without real sector development in terms of physical infrastructure and improvement in supply elasticities, supply led financial intermediation can lead to misallocation of resources, potentially generate bubbles and possibly amplify the risks. Provision of these facilities will not only generate demand for rural credit (Mohan, 2006) but also improve the efficiency of supply. Much of the initiatives for development of infrastructure and formulating a development strategy to create a favourable investment climate and credit culture will have to come from the State Governments. However, these facilities could only be provided over a longer horizon.
Meanwhile, the existing supply gap in banking services need to be addressed soon.8 For this, banks will have to innovate and adapt themselves to the given situation prevailing in the region by redesigning their products according to local demand and reach out to the people. The emphasis should be on productive sectors, as real sector is underdeveloped and the economy is already lopsided. Owing to this lopsided nature of the economy, retail credit has shown a much higher growth in the region than at the national level, and is one of the most important reasons for the revival of credit growth in most of the States during the last five years or so. This is a national phenomenon arising from growth of consumerism, easing of lending standards by banks, comparatively lower defaults, etc., (Roy, 2006). In the region, while the demand for credit to real sectors is lacking, retail credit has a ready demand due to disproportionately higher share of public administration and other services in NSDP (salaried class people), and higher level of consumption relative to income emanating from social habits. The non-requirement of immovable property such as land collateral enhances both the demand and supply for these types of loans. But, unlike in other parts of the country, such retail bank credits will not create economic activity in the region, and not sustainable, as the ensuing retail purchases will have to be sourced from elsewhere outside the region.
Though there are a number of unbanked areas, given the topography of the region with sparse settlement of population and transport bottlenecks, branch expansion may not be always feasible on account of financial viability. The alternatives to branch expansion for outreach, viz., business correspondent and facilitator model is best suited for the region, as there are a number of community based organisations, NGOs and post offices (about 8,000 as compared to some odd 1,230 SCB branches), which are well dispersed in the region than bank branches. Besides, the disadvantage of topography and sparse settlement of population can be overcome through IT based solutions, as mobile connectivity has improved substantially in the region. Smart cards and mobile payments allow banking transactions from non-branch locations. The banks will, however, be required to have an IT plan at the branch level and incur initial lump sum investment for the purpose.
One important reason for the people keeping away from the banking fold is the complexities of documentation required in a typical banking transaction. A simplified procedure is a must, which can be introduced as a pilot project in some select areas. After due customisation of simple deposit (such as ‘no frills account’) and credit products (like general credit card (GCC)) through awareness programmes, more areas can be covered. For familiarising these products, services of respected local persons like schoolteacher, retired official, postman, etc., could be taken on commission basis. The services of these people could also be taken for recovery of loans, as their respectability among the masses could be leveraged. The operations of banks through self help groups (SHGs) is another important route that needs to be reassessed and scaled up. SHGs movement which peaked up late is confined mostly in Assam, though rapid growth is also taking place in other States too. In general, the recovery rates have also been higher for finance to SHGs. To encourage this, banks may be allowed to refinance MFIs for SHG lending.
Given the unique land tenure system in the region, the norm on land as collateral for bank loans need to be relaxed in the region. The issue of land procession certificate (LPC) has begun by most of the States in hill areas, but falls short of legal backing. Further, lack of cadastral survey and multiplicity of authority and other complexities including limited transferability rights are inhibiting factors. A continued emphasis on such collateral by banks would hinder growth of credit in the region. The focus of the bank should be on the cash flow generating from the credit. Establishing the right to cultivate the land by the borrower should be the focus, and not on individual ownership and transferability of the land in the event of failure on loan repayment. Wherever available, LPC should serve the purpose as this is enough evidence on cultivable right of the borrower on the land. And if this is not available, a letter of comfort from the community based organisation on cultivable right of the borrower should suffice. For any viable projects in both agriculture and industry, other forms of guarantees such as primary security, personal guarantee or other trust guarantee could replace land (immovable property) collateral. For the RRBs, besides the measures such as reassessment of staff needs, altering business strategy, implementing IT based solutions and allowing greater freedom in operations, their synergy can be achieved through amalgamation. The Assam Gramin Vikash Bank formed after amalgamation of four RRBs is now the single largest scheduled commercial bank having highest number of bank branches in Assam. The bank has achieved improved financials after amalgamation.
With regard to State co-operative banks, in addition to infusion of capital, allowing management by professionals, designing of suitable banking products and charting out a clear road map for revival, they can be considered for business correspondent on commission basis by SCBs. This arrangement can help both the parties, as the co-operatives have experience in banking transactions, are well dispersed and their financials can improve, while for the SCBs their outreach will increase.
Notes:
1 Among the two ratios, the former ratio is also considered as one of the benchmark to assess the reach of financial services to the population (Leeladhar, 2005). These ratios are also considered as indicators of banking penetration (Mohan, 2006).
2 Due to non-availability of data at the district level, we have considered total deposit accounts per 100 populations, instead of current and savings accounts only.
3 We have not reported the detailed estimates to preserve space, but they are available from the authors.
4 Thorat Committee on CD Ratio, appointed by Government of India in 2004 distinguished the importance of utilization as against sanction to measure the CD ratio of a State.
5 Since this point is not known a priori, we searched it within a range of 15 per cent to 85 per cent of the sample period, which is the standard practice in the literature to locate structural breaks at an unknown point of time.
6 For States other than Assam (545), it ranged from 262 in Mizoram to 483 in Tripura as against the national average of 518. 7 Credit accounts per employee was however lower, except Tripura (125), and ranged from 52 in Nagaland to 66 in Manipur, against the national average of 86.
8 Financial Sector Plan for the North Eastern Region (Usha Thorat Committee, 2006) has deliberated in great details and recommended comprehensive measures to raise the level of financial inclusion in all its aspect in the region. References:
All India Debt and Investment Survey (1991), National Sample Survey Organisation, Government of India.
Benhabib, J. and M Spiegel (2000), “The Role of Financial Development in Growth and Investment”, Journal of Economic Growth, Vol. 5, December 2000.
Boyreau-Debray, G. (2001), “Financial Intermediation and Growth: Chinese Style”, World Bank, Washington, DC, 2001.
Gorton, Gary and Andrew Winton (2002), “Financial Intermediation”, NBER Working Paper, No. 8928.
Government of India (2004), Agricultural Statistics at a Glance 2004, Ministry of Agriculture, August.
Kaveri V.S., (undated), “Banking in North Eastern Region- An Inter-State Analysis”, North Eastern Institute of Bank Management, Guwahati (Mimeo).
Khan, M.S. and Abdelhak S Snehadji (2003), “Financial Development and Economic Growth: A Review and New Evidence”, Journal of African Economies, Centre for the Study of African Economies.
King, R.G. and R. Levine (1992), “Financial Indicators and Growth in a Cross Section of Countries”, World Bank Policy Research Working Paper No. 819.
King, R.G. and R. Levine (1993), “Finance and Growth: Schumpeter Might be Right”, Quarterly Journal of Economics, Vol. 108, 1993.
Leeladhar, V. (2005), “Taking Banking Services to the Common Man-Financial Inclusion”, Febank Hornis Memorial Foundation Lecture, Ernakulam, December 2, 2005.
Levine, R. (1997), “Financial Development and Economic Growth: Views and Agenda”, Journal of Economic Literature, 35(2), 1997, pp. 668-726. Levine, R. Norman Loayza and Thorsten Beck (1999), “Financial Intermediation and Growth: Causality and Causes”, World Bank Country Economics Department Papers 2059, Washington, DC, 1999.
McKinnon, R. I. (1973), Money and Capital in Economic Development, Washington DC, Brookings Institution, 1973.
Mohan, Rakesh (2006), “Economic Growth, Financial Deepening and Financial Inclusion”, Address at the Bankers’ Conference 2006, Hyderbad,
November 3, 2006.
Reddy, Y.V. (2006),”Globalisation, Money and Finance – Uncertainities and Dilemmas”, Valedictory address at the FICCI-IBA Conference, Mumbai, September 28, 2006.
Reserve Bank of India, Basic Statistical Returns, Various Issues.
Reserve Bank of India (2006), Committee of Financial Sector Plan for North Eastern Region (Usha Thorat Committee), Mumbai.
Reserve Bank of India (2005), Handbook of Statistics of Indian Economy, 2004-05.
Roy, Mohua, (2006), “A Review of Bank Lending to Priority and Retail Sectors”, Economic and Political Weekly, March 18, 2006.
Shaw, G. (1973), Financial Deepening in Economic Development, New York, Oxford University Press, 1973.
* The authors are Chief General Manager, RPCD, RBI, Mumbai, formerly Regional Director of North Eastern States and Director, Reserve Bank of India. These are personal views of the authors. |


