
OBICUS Survey on the Manufacturing sector - Q1:2018-19 - ربی - Reserve Bank of India


OBICUS Survey on the Manufacturing sector - Q1:2018-19
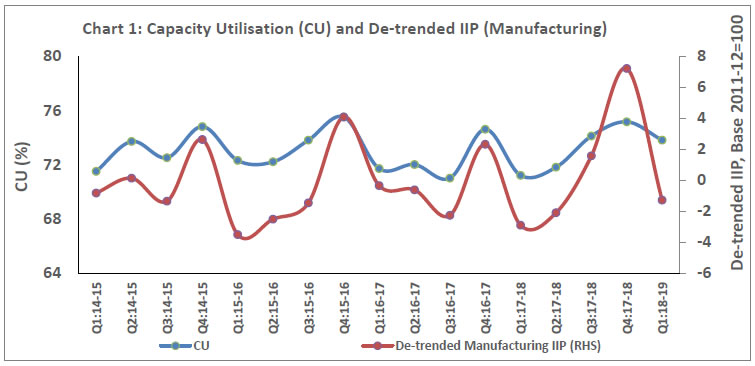
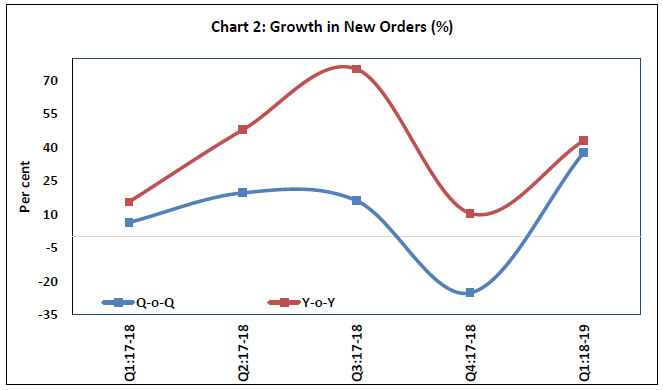
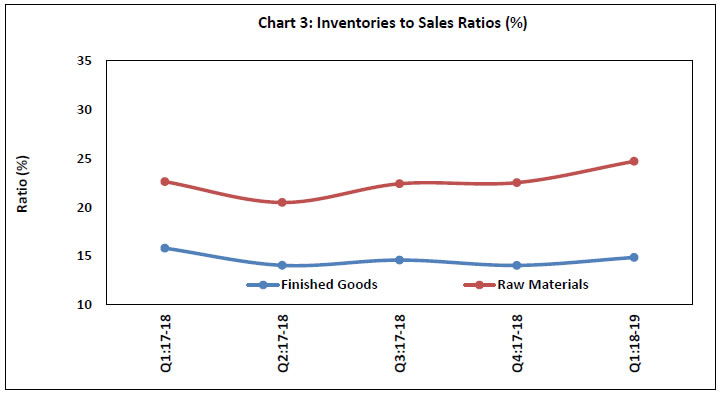
Today, the Reserve Bank released the results of the 42nd round of the Order Books, Inventories and Capacity Utilisation Survey (OBICUS) for the quarter April-June 2018 covering 994 manufacturing companies. The survey provides a snapshot of demand conditions in India’s manufacturing sector1. Highlights: 1) Capacity Utilisation (CU): At the aggregate level, CU recorded a seasonal decline and stood at 73.8 per cent in Q1:2018-19, co-moving with the de-trended index of industrial production2 (IIP) (Chart 1). However, seasonally adjusted CU rose by 1.7 percentage points to 74.9 per cent in Q1:2018-19. 2) Order Books: New orders growth regained buoyancy in Q1:2018-19. (Chart 2) 3) Finished Goods Inventory (FGI) to Sales Ratio: The FGI to sales ratio rose from its level in the previous quarter, due to relatively higher growth in finished goods, but remained lower than its level a year ago (Chart 3). 4) Raw Material Inventory (RMI) to Sales Ratio: Producers seem to have stocked up on raw materials in anticipation of a rise in demand in the forthcoming festival season leading to a sharp rise in the RMI to Sales ratio (Chart 3). Historical time series have been made available in excel format. ANNEX 1: Data Tables
1 The survey responses are voluntary and difference in sample composition may affect the results to some extent. The 41st round of the OBICUS covering 1,061 manufacturing companies with reference period as January-March 2018 was released on the RBI website on August 01, 2018. 2 IIP is calculated on a fixed base (currently 2011-12=100) whereas the denominator (viz. installed capacity) in CU is updated every quarter. For comparison, the trend component of IIP is removed. |
|||||||||||||||||||||||||||||||||||||||||||||||||||||||||||||||||||||||||||||||||||||||||||||||||||||||||||||||||||||||||||||||||||||||||||||||||||||||||||||||||||||||||||||||||||||||||||||||||||||||||||||||||

شارك هذه الصفحة:


Install the RBI mobile application and get quick access to the latest news!


