
OBICUS Survey on the Manufacturing sector - Q3:2017-18 - ربی - Reserve Bank of India


OBICUS Survey on the Manufacturing sector - Q3:2017-18
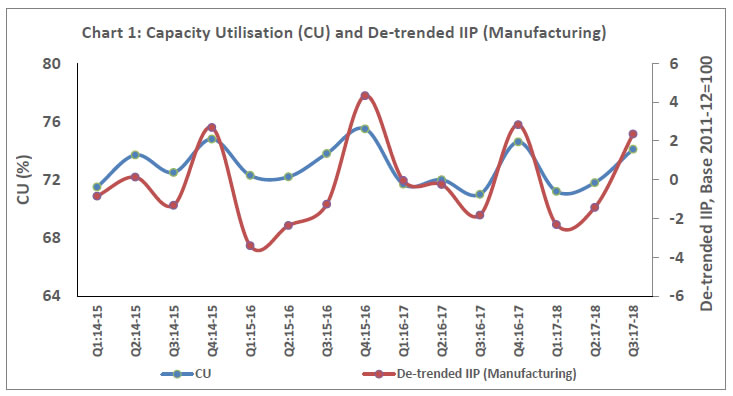
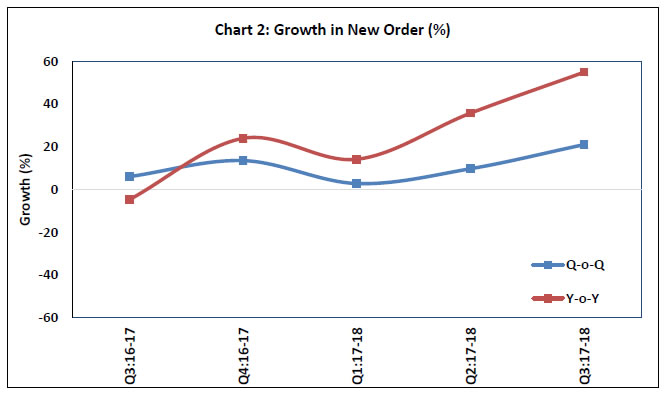
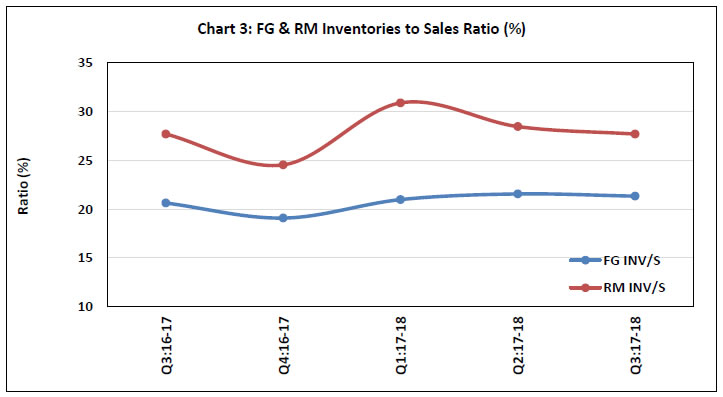
Today, the Reserve Bank released results of the 40th round of the Order Books, Inventories and Capacity Utilisation Survey (OBICUS) for the quarter October-December 2017 covering 940 manufacturing companies. The survey provides a snapshot of demand conditions in the Indian manufacturing sector1. Highlights: 1) Capacity Utilisation (CU): At the aggregate level, CU stood at 74.1 per cent in Q3:2017-18 with a coincident uptick in the de-trended index of industrial production2 (IIP) (Chart 1). Seasonally adjusted CU also increased for the first time in FY:17-18 to reach 74.3 per cent in Q3:2017-18. 2) Order Books: New orders received by companies in Q3:2017-18 recorded a substantial growth over their levels in the previous quarter and also a year ago (Chart 2). 3) Finished Goods Inventory (FGI) to Sales Ratio: A slight pile up in the finished goods inventory may reflect higher anticipated sales; the FGI to sales ratio declined marginally (Chart 3). 4) Raw Material Inventory (RMI) to Sales Ratio: RMI to sales ratio also declined from its elevated level seen in Q1:17-18. ANNEX 1: Data Tables
1 The survey responses are voluntary and difference in sample composition may affect the results to some extent. The 39th round of the OBICUS covering 756 manufacturing companies with reference period as July-September 2017 was released on the RBI website on February 07, 2018. 2 IIP is calculated on a fixed base (currently 2011-12=100) whereas the denominator (viz. installed capacity) in CU is updated every quarter. For comparison, the trend component of IIP is removed. |
|||||||||||||||||||||||||||||||||||||||||||||||||||||||||||||||||||||||||||||||||||||||||||||||||||||||||||||||||||||||||||||||||||||||||||||||||||||||||||||||||||||||||||||||||||||||||||||||||||||||||||||||||

شارك هذه الصفحة:


Install the RBI mobile application and get quick access to the latest news!


