The data on India’s Balance of Payments (BoP) are compiled and published by the Reserve Bank on a quarterly basis with a lag of one quarter. This article covers the analysis of major developments in India’s BoP during the third quarter of 2011-12 along with the revised data for earlier two quarters of 2011-12 on the basis of new format of BoP1. However, the quarterly Balance of Payments statistics based on the old format are also given for the period of 2008-09 to 2010-11 in the Annex 1 for ease of comparison. In addition, the disaggregated data on invisibles for October-December 2011 through April-June 2011 and annual data for last two years are also being published as a part of this article (Attachment I). Major Highlights of BoP during October- December (Q3) of 2011-12 During Q3 of 2011-12, India’s BoP came under stress as trade deficit widened, while capital inflows fell far short of financing requirement resulting in significant drawdown of foreign exchange reserves. Export growth decelerated in October-December 2011 owing to economic sluggishness, particularly in advanced economies. Imports continued to rise largely due to high international commodity prices and inelastic demand for gold and silver. As a result, trade deficit rose by little over 50 per cent (Y-o-Y). (i) On a BoP basis, merchandise exports recorded a lower growth of 7.9 per cent, year-on-year, during Q3 of 2011-12 as compared with 39.9 per cent during corresponding quarter of 2010-11. (ii) Imports registered a growth of 22.0 per cent during Q3 of 2011-12 as compared with 24.7 per cent in the corresponding quarter of the preceding year. (iii) With export growth remaining lower than the import growth, the trade deficit widened to US$ 47.7 billion in Q3 of 2011-12 as compared with US$ 31.4 billion in Q3 of 2010-11. (iv) Net services exports in Q3 of 2011-12 rose by 20.3 per cent, led by computer services, as compared with 47.5 per cent in Q3 of 2010-11. (v) Net secondary income (private transfers) receipts rose by 30.6 per cent (y-o-y) to US$ 17.5 billion in Q3 of 2011-12 as compared with US$ 13.4 billion in Q3 of 2010-11. (vi) Primary income account (mainly investment income) showed a net outflow of US$ 4.5 billion in Q3 of 2011-12, broadly the same as in the corresponding quarter of the previous year. (vii) Consequently, the current account deficit (CAD) widened to US$ 19.6 billion in Q3 of 2011-12 (US$ 10.1 billion in Q3 of 2010-11) which worked out to 4.3 per cent of GDP (2.3 per cent of GDP in Q3 of 2010-11). (viii) Capital and Financial account (excluding change in foreign exchange reserves), on a net basis, showed a much lower inflow of US$ 8.2 billion in Q3 of 2011-12 as compared with US$ 14.0 billion in Q3 of 2010-11. (ix) As a result, there was a drawdown of foreign exchange reserves of US$ 12.8 billion (excluding valuation) during Q3 of 2011-12 as against an increase of US$ 4.0 billion in the corresponding quarter of 2010-11. Major Highlights of BoP during April- December 2011 During April-December 2011, the CAD, in absolute terms, was higher than the corresponding period of the previous year mainly on account of increase in trade deficit, though services and secondary income recorded higher growth. As a percentage of GDP, CAD was, therefore, higher than the corresponding period of preceding year.
-
During April-December 2011, the CAD rose to US$ 53.7 billion (4.0 per cent of GDP) from US$ 39.6 billion (3.3 per cent of GDP) in April-December 2010, largely reflecting higher trade deficit on account of imports of POL and gold & silver.
-
Net inflows under Capital and Financial account (excluding changes in reserve assets) at US$ 47.5 billion showed moderation in April-December 2011 as compared to US$ 52.9 billion in April- December 2010.
-
There was a drawdown of reserves to the extent of US$ 7.1 billion during April-December 2011 as against an accretion of US$ 11.0 billion in April- December 2010.
1. Balance of Payments during October- December (Q3) of 2011-12 Stress witnessed in India’s BoP during the Q1 and Q2 of 2011-12 continued in Q3 of 2011-12 due to further deterioration in trade balance and moderation in capital inflows. Despite depreciation of the rupee during Q3 of 2011-12, the trade balance deteriorated due to slowdown in export demand and inelastic nature of major portion of imports like POL and gold & silver. Inflows under Capital and Financial Account also moderated reflecting the fragile global financial conditions. The inflows under FII investment, ECBs and short term credit witnessed significant moderation as the euro crisis worsened. The developments in the major items of the BoP for Q3 of 2011-12 are set out below in Table 1.
Table 1: Major items of India’s Balance of Payments |
(US$ billion) |
|
Oct-Dec 2011(P) |
Oct-Dec 2010 (PR) |
Apr-Dec 2011(P) |
Apr-Dec 2010 (PR) |
1. Goods exports |
71.2 |
66.0 |
222.0 |
173.2 |
2. Goods Imports |
118.8 |
97.4 |
354.3 |
273.6 |
3. Trade Balance(1-2) |
-47.7 |
-31.4 |
-132.3 |
-100.4 |
4. Services Exports |
36.7 |
38.8 |
102.0 |
96.4 |
5. Services Imports |
21.7 |
26.3 |
58.0 |
62.3 |
6. Net Services (4-5) |
15.0 |
12.5 |
44.1 |
34.1 |
7. Goods & Services Balances (3+6) |
-32.7 |
-18.9 |
-88.2 |
-66.3 |
8. Primary Income, Net (Compensation of employees and Investment Income) |
-4.5 |
-4.6 |
-13.5 |
-12.8 |
9. Secondary Income, Net ( Private Transfers) |
17.5 |
13.4 |
48.0 |
39.5 |
10. Net Income (8+9) |
13.0 |
8.8 |
34.5 |
26.7 |
11. Current Account Balance (7+10) |
-19.6 |
-10.1 |
-53.7 |
-39.6 |
12. Capital and Financial Account Balance, Net (Excl. change in reserves) |
8.2 |
14.0 |
47.5 |
52.9 |
13. Change in Reserves (-)increase/(+)decrease |
12.8 |
-4.0 |
7.1 |
-11.0 |
14. Errors & Omissions - (11+12+13) |
-1.4 |
0.1 |
-0.9 |
-2.2 |
P: Preliminary; R: Partially Revised |
Goods Trade With significant moderation in export growth and import volume remaining sizeable, the trade and current account deficit witnessed a further deterioration during October-December 2011.
-
On a BoP basis, India’s merchandise exports recorded a lower growth of 7.9 per cent, year-onyear, during Q3 of 2011-12 as compared with 39.9 per cent in the same quarter of previous year reflecting the slowdown in exports demand arising out of the global growth uncertainty.
-
As the sluggish economic conditions in advanced economies gradually spilled over to the developing world, export diversification efforts did not yield similar results as seen in the previous year.
-
Growth in merchandise imports (on BoP basis) was 22.0 per cent during Q3 of 2011-12 as compared with 24.7 per cent recorded during Q3 of 2010-11. Deceleration in merchandise import growth during the quarter was due to moderation in ‘non-oil and non-gold’ segment of imports. However, significant rise in the imports of POL and gold & silver kept total imports elevated during the quarter.
-
While the rise in oil imports was largely a reflection of higher international prices, rise in gold imports has been due to jump in both quantum as well as prices. During the quarter, gold prices on average remained at about US$ 1700 per troy ounce, whereas quantum of gold imports were estimated to be at least 50 tons above the long-term trend.
-
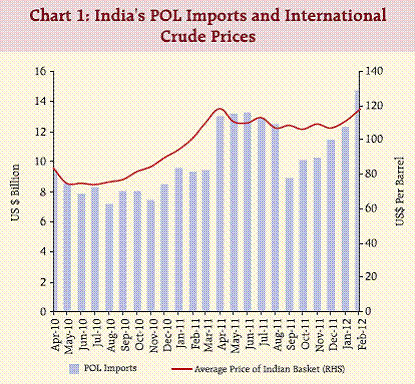
According to the data released by the Directorate General of Commercial Intelligence and Statistics (DGCI&S), oil imports and non-oil imports recorded growth of 38.7 per cent and 25.5 per cent, respectively, during Q3 of 2011-12 as compared with a growth of 4.9 per cent and 22.6 per cent recorded during the same period of the previous year. High growth of POL imports led to rise in its share in total merchandise imports from 27.9 per cent during Q3 of 2010-11 to 30.6 per cent during October-December 2011. The price of Indian basket of crude oil also witnessed a significant rise of 26.6 per cent to US$ 107.6 per bbl during Q3 2011-12 from US$ 85.0 per bbl recorded during the same period a year ago (Chart 1).
 |
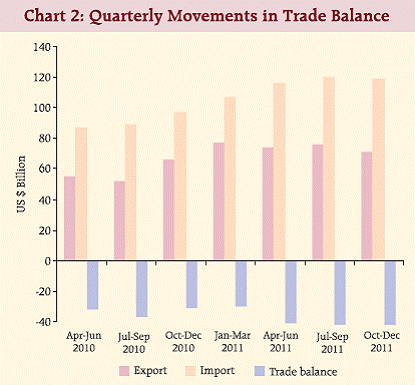
Trade Deficit Higher import growth vis-à-vis export growth witnessed during Q3 of 2011-12 led to widening of the trade deficit to US$ 47.7 billion as compared with US$ 31.4 billion recorded during the same period a year ago, showing a rise of over 51 per cent (Chart 2). Services With a pronounced decline in services imports as compared with that in services exports, net export of services was higher as compared with the corresponding quarter (Table 2).
-
During Q3 of 2011-12, services receipts declined by 5.4 per cent to US$ 36.7 billion from US$ 38.8 billion in Q3 of 2010-11. Moderation in services exports was recorded in financial services and other business services. Other business services comprise ‘research & developmental services’, ‘professional & management consulting services’, and ‘technical, trade-related & other business services n.i.e’.
-
Services payments declined at a rate more than services receipts, by 17.6 per cent to US$ 21.7 billion from US$ 26.3 billion in the corresponding quarter of previous year primarily led by ‘other business services’, ‘construction services’ and ‘personal, cultural and recreational services’.
-
As services imports declined more than the services exports, the net services exports stood higher at US$ 15.0 billion in Q3 of 2011-12 as compared with US$ 12.5 billion in the corresponding quarter of the previous year mainly reflecting improvement in net software exports. Net services exports under transport, construction, insurance & pension services and personal cultural & recreational services also witnessed improvement and contributed to improvement in net services balance.
 |
Income There has been a sharp rise in net secondary income in Q3 of 2011-12 which, however, was partly offset by net outflow on account of primary income (Table 2). The sharp rise under secondary income account may be attributed to weakening of Indian rupee which induced higher workers’ remittances for family maintenance.
-
Net outflow on account of primary income in Q3 of 2011-12 at US$ 4.5 billion was broadly the same as recorded in Q3 of 2010-11. Compensation of employees continued to record surpluses, albeit lower, in Q3 of 2011-12 for the third successive quarter.
-
Payments on account of investment income, comprising mainly the interest payments on the external commercial borrowings (ECBs), NRI deposits and profits & reinvested earnings of FDI companies in India rose by 1.8 per cent in Q3 (33.4 per cent in Q3 of 2010-11) while investment income receipts recorded a decline of 6.2 per cent (24.1 per cent decline in Q3 of 2010-11) mainly on account of lower tax receipts.
-
As a result, deficit in the investment income account widened by 5.2 per cent to US$ 4.5 billion in the October-December 2011 as compared with US$ 4.3 billion in Q3 of 2010-11).
-
Secondary income (on a net basis), reflecting mainly the remittances from overseas Indians, at US$ 17.5 billion remained buoyant and recorded a growth of 30.6 per cent in Q3 as compared with an increase of 7.4 per cent in Q3 of 2010-11.
Table 2: Disaggregated Items of Current Account (net) |
(US$ billion) |
|
Oct-Dec 2011 (P) |
Oct-Dec 2010 (PR) |
Apr-Dec 2011 (P) |
Apr-Dec 2010 (PR) |
1. |
Goods |
-47.7 |
-31.4 |
-132.3 |
-100.4 |
2. |
Services |
15.0 |
12.5 |
44.1 |
34.1 |
|
a Transport |
0.1 |
-0.3 |
1.2 |
-0.5 |
|
b Travel |
1.5 |
1.6 |
2.5 |
2.8 |
|
c Construction |
0.0 |
-0.1 |
-0.1 |
-0.3 |
|
d Insurance and pension services |
0.4 |
0.1 |
0.8 |
0.3 |
|
e Financial Services |
-0.5 |
-0.3 |
-1.5 |
-0.5 |
|
f Charges for the use of intellectual property |
-0.8 |
-0.7 |
-2.0 |
-1.7 |
|
g Telecommunications, computer and information services |
15.8 |
14.4 |
44.0 |
38.3 |
|
h Personal, cultural and recreational services |
0.0 |
-0.2 |
0.1 |
-0.2 |
|
i Government goods & services |
0.0 |
0.0 |
-0.1 |
-0.2 |
|
j Other Business services |
-1.0 |
-1.0 |
-2.9 |
-3.0 |
|
k Others n.i.e |
-0.6 |
-1.0 |
2.2 |
-0.8 |
3. |
Primary Income |
-4.5 |
-4.6 |
-13.5 |
-12.8 |
|
a Compensation of Employees |
0.0 |
-0.3 |
0.5 |
-0.7 |
|
b Investment Income |
-4.5 |
-4.3 |
-13.9 |
-12.1 |
4. |
Secondary Income |
17.5 |
13.4 |
48.0 |
39.5 |
|
a Personal Transfers |
16.9 |
13.0 |
46.3 |
38.4 |
|
b. Other Transfers |
0.6 |
0.4 |
1.6 |
1.2 |
5. |
Current Account (1+2+3+4) |
-19.6 |
-10.1 |
-53.7 |
-39.6 |
Note: Total of subcomponents may not tally with aggregate due to rounding off.
P: Preliminary; R: Partially Revised. |
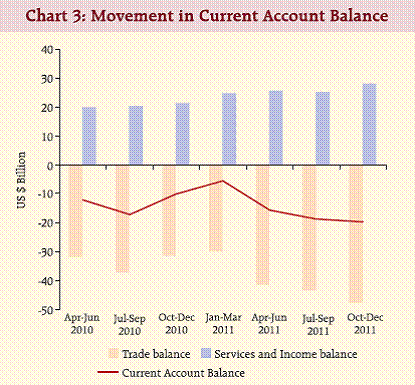
Current Account During the period, despite improvement in net services and secondary income, higher trade deficit coupled with deterioration in the primary income led CAD to widen during October-December 2011 as compared with corresponding quarter of 2010-11.
- The CAD widened to US$ 19.6 billion in Q3 as compared with US$ 18.4 billion in Q2 of 2011-12 and US$ 10.1 in Q3 of 2010-11 (Chart 3). At this level, CAD worked out to 4.3 per cent of GDP in Q3 of 2011-12 as compared with 2.3 per cent in Q3 of 2010-11.
Capital & Financial Account Growing fragility in global financial markets and continued shift in flow of capital towards safe haven markets impacted financial flows to India during Q3 of 2011-12. Gross inflows and outflows under capital and financial account (excluding reserve changes) stood lower during the quarter under reference as compared with the same period a year ago. Net inflows under capital and financial account (excluding change in foreign exchange reserves) moderated significantly to US$ 8.2 billion in Q3 of 2011-12 as compared with US$ 14.0 billion in the corresponding quarter of previous year.
Capital Account The capital account, which includes official transfers and purchase/sale of intangible assets like patents, copyrights, trademarks, etc., recorded a marginal surplus of US$ 0.1 billion during October- December 2011 mainly on account of other capital transfers. Financial Account
-
The gross financial inflows excluding reserve changes during Q3 of 2011-12 to India amounted to US$ 107.6 billion (US$ 174.4 billion in Q3 of 2010-11) and similarly gross financial outflows during the period were lower at US$ 99.6 billion (US$ 160.5 billion in Q3 of 2010-11).
-
Decline in gross inflows was largely on account of decline in portfolio investment receipts and loans to deposit taking corporations led by overseas borrowings. While decline in gross outflows was led by lower FDI by India and lower build up of Nostro balances of banks apart from the decline in FII outflows.
-
On net basis, overall financial account during the quarter recorded a steep decline mainly on account of outflows under ‘loans availed by deposits taking corporations’ and ‘trade credit & advances’; and lower inflows under FIIs and ‘loans availed by other sectors (ECBs)’ (Table 3).
-
Net FDI flows (net inward FDI minus net outward FDI) increased to US$ 4.4 billion during Q3 (US$ 1.2 billion in Q3 of 2010-11) mainly due to lower net outward FDI during the quarter.
-
Net inflows under portfolio investment recorded a sharp decline of US$ 1.8 billion during the quarter (inflows of US$ 6.1 billion during the same quarter last year), mainly due to the eurozone imbroglio and decline in the risk appetite of the FIIs.
-
Net loans availed by other sector declined to US$ 0.9 billion in Q3 of 2011-12 from a level of US$ 3.5 billion recorded during the same period a year ago. The decline was mainly on account of heavy repayments falling due during this period.
-
Inflows under currency and deposits of commercial banks, i.e., NRI deposits increased markedly to US$ 3.2 billion during the quarter reflecting the impact of exchange rate depreciation and deregulation of interest rates on NRI deposits.
-
Loans raised by the commercial banks from overseas market registered a net outflow of US$ 8.7 billion during Q3 of 2011-12 as against an inflow of US$ 4.6 billion in the corresponding quarters.
-
Trade credits & advances to India in the quarter at (-)US$ 0.1 billion stood lower than US$ 1.3 billion recorded during the same quarter of the preceding year.
-
Consequently, net financial inflows excluding change in reserves declined to US$ 8.1 billion during Q3 of 2011-12 (US$ 13.9 billion during Q3 in previous year).
-
As net inflows under capital and financial account were not sufficient enough to finance the CAD, there was a net drawdown of foreign exchange reserves to the extent of US$ 12.8 billion in Q3 of 2011-12 as against a reserve build-up of US$ 4.0 billion in Q3 of 2010-11. In nominal terms (i.e., including valuation changes), foreign exchange reserves declined by US$ 14.8 billion during the quarter reflecting appreciation of US dollar against major international currencies.
Table 3: Disaggregated Items of Financial Account |
(US$ billion) |
|
Oct-Dec 2011 (P) |
Oct-Dec 2010 (PR) |
Apr-Dec 2011 (P) |
Apr-Dec 2010 (PR) |
1. Direct Investment (net) |
4.5 |
1.2 |
16.2 |
8.2 |
a. Direct Investment to India |
6.4 |
6.1 |
26.7 |
20.4 |
b. Direct Investment by India |
-1.9 |
-4.9 |
-10.5 |
-12.1 |
2. Portfolio Investment |
1.8 |
6.1 |
2.7 |
28.3 |
a. Portfolio Investment in India |
1.9 |
7.2 |
2.7 |
29.5 |
b. Portfolio Investment by India |
-0.1 |
-1.1 |
-0.1 |
-1.2 |
3. Other investment |
1.8 |
6.6 |
28.5 |
16.3 |
a. Other equity (ADRs/GDRs) |
0.1 |
0.2 |
0.6 |
1.8 |
b. Currency and deposits |
3.2 |
0.3 |
7.1 |
1.8 |
Deposit-taking corporations, except the central bank: (NRI Deposits) |
3.3 |
0.2 |
7.3 |
2.3 |
c. Loans* |
-5.9 |
9.7 |
18.8 |
17.7 |
i Loans to India |
-6.4 |
9.3 |
17.7 |
17.7 |
Deposit-taking corporations, except the central bank |
-8.7 |
4.6 |
6.7 |
3.9 |
General government (External Assistance) |
1.4 |
1.2 |
2.1 |
4.2 |
Other sectors (ECBs) |
0.9 |
3.5 |
8.8 |
9.5 |
ii Loans by India |
0.5 |
0.3 |
1.2 |
0.0 |
General government (External Assistance) |
0.0 |
0.0 |
0.0 |
0.0 |
Other sectors (ECBs) |
0.5 |
0.3 |
1.2 |
0.0 |
d. Trade credit and advances |
-0.1 |
1.3 |
5.8 |
8.3 |
e. Other accounts receivable/payable – other |
4.5 |
-4.9 |
-3.8 |
-13.3 |
4. Reserve assets |
12.8 |
-4.0 |
7.1 |
-11.0 |
Financial Account (1+2+3+4) |
20.9 |
9.9 |
54.5 |
41.8 |
Note: Total of subcomponents may not tally with aggregate due to rounding off.
P: Preliminary; R: Partially Revised.
*: includes External Assistance, ECBs, non-NRI Banking Capital and short term trade credit. |
Balance of Payments for April-December of 2011 Taking into account the partially revised data for Q1 and Q2 along with preliminary data for Q3, the BoP data for April-December 2011 have been compiled. While the detailed data are set out in Statement I in standard format of BoP presentation, the major items are presented in Table 1.
-
On a BoP basis, India’s merchandise exports at US$ 222.0 billion recorded a growth of 28.1 per cent during April-December 2011 (as against a decline of 33.7 per cent in the same period of the previous year).
-
Import payments at US$ 354.3 billion, on a BoP basis, also registered a growth of 29.5 per cent during April-December 2011 as compared with an increase of 26.4 per cent in the corresponding period of the previous year.
-
At disaggregated level, growth in exports of petroleum products, agriculture and allied products, textile and textile products, gems & jewellery and chemicals & related products was higher during April-December 2011 as compared with the corresponding period of the previous year. In contrast, growth in exports of engineering goods moderated while that of ores and minerals turned negative during April-December 2011. Among imports, petroleum & petroleum products, capital goods, gold & silver and other bulk items, including fertilisers recorded higher growth during April-December 2011 while export related items showed a decelerated growth during the same period.
-
During April-December 2011, POL products and gold & silver together accounted for more than 43 .0per cent of India’s merchandise Imports. Oil imports recorded an increase of nearly 45.0 per cent during April-December 2011 (as compared with an increase of 22.0 per cent a year ago). In absolute terms, oil imports accounted for 30.6 per cent of total imports during April-December 2011 (27.9 per cent in the corresponding period of the previous year). Import of gold and silver at US$ 45.7 billion recorded a higher growth of 54.4 per cent during April-December 2011 as compared with 53.4 per cent recorded during April-December 2010.
Trade Deficit
- Deceleration in exports growth and acceleration in imports growth coupled with higher imports base worsened merchandise trade balance (on BoP basis) during April-December 2011 to US$ 132.3 billion from US$ 100.4 billion during April- December 2010. Notably, imports recorded a higher growth despite the depreciation of Indian rupee, as nearly half of the total imports (POL products and gold & silver) are price insensitive and international prices of these commodities witnessed significant increase during April- December 2011 over the same period last year. International price of the Indian basket of crude oil increased by 38.6 per cent to US$ 110.7 per bbl, during April-December 2011 from US$ 79.4 per bbl during the corresponding period of 2010-11.
Services There has been a moderation in the growth of services exports to 5.9 per cent during April-December 2011 as against 41.6 per cent during April-December 2010, while imports of services declined by 6.9 per cent as against an increase of 54.5 per cent during April- December 2010. Lower payments coupled with moderate growth in receipts resulted in net services exports (US$ 44.1 billion) to record a growth of 29.3 per cent during April-December 2011 (23.0 per cent in the same period a year ago).
-
Moderation in the growth rate of the services receipts was mainly on account of decline in financial services and moderate growth in export of other business services. However, other services, viz., travel, transportations, insurance and ‘telecommunications, computer & information services’ recorded a robust growth during April- December 2011.
-
Decline in services payments during April- December 2011 as against a sharp growth during the same period a year ago was noticed in almost all the items except tourism and construction services, led by other business services, transport, financial services and computer services.
-
Exports of computer services, i.e., software receipts at US$ 45.0 billion during April-December 2011 recorded an increase of 13.9 per cent as compared with a growth of 11.6 per cent a year ago.
-
The key components of the other business services are ‘research & developmental services’, ‘professional & management consulting services’ and ‘technical, trade related and other business services’. Net outflows on account of other business services (US$ (-) 2.9 billion) continued during April-December 2011, which, however, stood marginally lower than the level recorded during the same period previous year.
Income Primary income Primary income balance, comprising compensation of employees and investment income, during April- December 2011, worsened as compared with the corresponding period of preceding year mainly due to higher interest payment on account of ECBs and external assistance.
- Compensation of employees in net terms showed a small net inflow of US$ 0.5 billion during April- December 2011 as against net outflows of US$ 0.7 billion during the same period of previous year.
- Investment income receipts during April- December 2011 declined by 3.0 per cent over April-December 2010 reflecting lower interest/ discount earnings on foreign exchange reserves.
- Investment income payments stood higher by 8.9 per cent as compared with 22.9 per cent during the same period a year ago. The rise in investment income payments was mainly due to higher interest payments on account of ECBs and short term credits. The deficit in the investment income account widened by 14.9 per cent to US$ 13.9 billion during April-December 2011 (US$ (-) 12.1 billion during a year ago).
Secondary Income
-
Net secondary income receipts that primarily comprise private transfers recorded a robust growth of 21.4 per cent to US$ 48.0 billion during April-December 2011 (US$ 39.5 billion a year ago), perhaps responding to the depreciation of Indian rupee.
-
NRI deposits, when withdrawn domestically, form part of private transfers as they become unilateral transfers and do not have any quid pro quo. During April-December 2011, the share of local withdrawals in total outflows from NRI deposits was higher at 67.8 per cent as compared to 59.5 per cent in April- December 2010 (Table 4).
-
Under private transfers, the inward remittances for family maintenance accounted for 47.3 per cent of the total private transfer receipts, while local withdrawals accounted for 49.1 per cent during April-December 2011(Table 5).
Table 4: Inflows and Outflows from NRI Deposits and Local Withdrawals |
(US$ billion) |
Year |
Inflows |
Outflows |
Local Withdrawals |
1 |
2 |
3 |
4 |
2009-10 (R) |
41.4 |
38.4 |
23.3 |
2010-11 (PR) |
49.3 |
46.0 |
26.2 |
Apr-Dec 2010 (PR) |
35.5 |
33.1 |
19.7 |
Apr-Dec 2011 (P) |
43.3 |
36.0 |
24.4 |
P: Preliminary. R: Partially Revised. R: Revised. |
Current Account Balance
- During April-December 2011, worsening trade deficit coupled with higher outflow of net primary income led to increase in CAD despite improvement in net services and secondary income. The CAD during the period under reference amounted to US$ 53.7 billion as compared with US$ 39.6 billion during the corresponding period preceding year. As a percentage of GDP, CAD amounted to 4.0 per cent in April-December 2011 as compared with 3.3 per cent recorded during the same period of preceding year.
Table 5: Details of Secondary Income Receipts to India |
(US$ billion) |
Year |
Secondary Income Receipts |
of Which: |
Inward remittances for family maintenance |
Local withdrawals/ redemptions of NRI Deposits |
Amount |
Percentage Share in Total |
Amount |
Percentage Share in Total |
1 |
2 |
3 |
4 |
5 |
6 |
2009-10 (R) |
53.6 |
28.4 |
53.0 |
23.3 |
43.5 |
2010-11 (PR) |
55.6 |
27.4 |
49.3 |
26.2 |
47.1 |
Apr-Dec 2010 (PR) |
41.3 |
20.1 |
48.7 |
19.7 |
47.7 |
Apr-Dec 2011 (P) |
49.7 |
23.5 |
47.3 |
24.4 |
49.1 |
P: Preliminary. PR: Partially Revised. R: Revised. |
Capital and Financial Account Net inflows under Capital and Financial account (excluding changes in reserve assets) at US$ 47.5 billion showed moderation during April-December 2011 as compared to US$ 52.9 billion during April-December 2010 primarily on account of sharp decline in FII investment and moderation in short-term trade credit. Capital Account
- The capital account recorded a surplus of US$ 92 million during April-December 2011 as compared with a surplus of US$ 65 million a year ago.
Financial Account
- Both gross inflows and outflows under the financial account (excluding changes in reserve assets) were lower during April-December 2011 as compared with that in the corresponding period of preceding year (Table 3).
- FDI inflows to India during the period under reference increased significantly by 30.9 per cent to US$ 26.7 billion from US$ 20.4 billion during the same period a year ago. The surge in FDI inflows was primarily on account of equity inflows as well as inter corporate borrowings.
- Sector-wise, the rise in gross FDI to India during April-December 2011 was broadly under all the sectors. However, it was mainly led by higher inflows under manufacturing, financial services, business services and communication services (Table 6). Country-wise, investment routed through Mauritius remained, as in the past, the largest component followed by Singapore and the UK (Table 7).
- FDI by India (outward FDI) in net terms during the period moderated by around 14 per cent to US$ 10.6 billion (US$ 12.2 billion a year ago) largely due to lower outflows under equity investment. However, outflows under other capital (intercompany borrowing) stood higher. In terms of sectors, there has been moderation in outward FDI in subsectors like ‘financial, insurance, real estate & business services’, ‘manufacturing’ and ‘wholesale, retail trade, restaurants & hotels’. The ‘financial, insurance, real estate & business services’ and ‘agriculture, hunting, forestry & fishing’ continued to account for more than 50 percent of total outward FDI during April- December 2011 (Table 6).
Table 6: Sector-wise FDI: Inflows and Outflows |
(US$ billion) |
Gross FDI Inflows to India# |
Gross FDI Outflows from India* |
Industry |
2010-11 |
2010-11 |
2011-12 |
Industry |
2010-11 |
2010-11 |
2011-12 |
Apr-Mar |
Apr-Dec |
Apr-Mar |
Apr-Dec |
1 |
2 |
3 |
4 |
5 |
6 |
7 |
8 |
Manufacture |
4.8 |
4.0 |
8.0 |
Financial, Insurance, Real Estate and Business Services |
6.5 |
4.4 |
2.9 |
Financial Services |
1.4 |
1.2 |
2.4 |
Manufacturing |
4.9 |
3.4 |
2.7 |
Communication Services |
1.1 |
0.9 |
1.5 |
Agriculture, Hunting, Forestry and Fishing |
1.2 |
1.1 |
2.3 |
Business Services |
0.6 |
0.3 |
1.3 |
Transport, Storage and Communication Services |
0.8 |
0.5 |
1.1 |
Electricity and others |
1.3 |
1.0 |
1.0 |
Wholesale, Retail Trade, Restaurants and Hotels |
1.9 |
1.6 |
1.0 |
Construction |
1.7 |
1.5 |
1.7 |
Construction |
0.4 |
0.3 |
0.3 |
Restaurants and Hotels |
0.3 |
0.2 |
0.7 |
Community, Social and Personal Services |
0.7 |
0.7 |
0.2 |
Computer Services |
0.6 |
0.5 |
0.5 |
Electricity, Gas and Water |
0.1 |
0.1 |
0.1 |
Others |
3.2 |
2.7 |
2.1 |
Miscellaneous |
0.3 |
0.2 |
0.1 |
Total |
14.9 |
12.4 |
19.2 |
Total |
16.8 |
12.3 |
10.6 |
#: Includes equity FDI through SIA/FIPB and RBI routes only and hence are not comparable with data in other tables.
*: Includes equity (except that of individuals and banks), loans and guarantee invoked, and hence are not comparable with data in other tables. |
-
Direction-wise (i.e., in terms of recipient countries), investment routed through Singapore constituted the largest component of gross outward FDI during the period, followed by Mauritius (Table 7).
Table 7: Country-wise FDI: Inflows and Outflows |
(US$ billion) |
Gross FDI inflows to India# |
Gross FDI outflows to India* |
Country |
Apr-Mar |
Apr-Dec |
Country |
Apr-Mar |
Apr-Dec |
|
2010-11 |
2010-11 |
2011-12 |
|
2010-11 |
2010-11 |
2011-12 |
1 |
2 |
3 |
4 |
5 |
6 |
7 |
8 |
Mauritius |
5.6 |
4.7 |
6.9 |
Singapore |
4.0 |
3.0 |
2.2 |
UK |
0.5 |
0.4 |
2.6 |
Mauritius |
5.1 |
4.4 |
2.2 |
Singapore |
1.5 |
1.3 |
2.7 |
Panama |
0.1 |
0.1 |
1.9 |
Japan |
1.3 |
1.0 |
1.9 |
USA |
1.2 |
1.0 |
0.8 |
Netherlands |
1.4 |
1.2 |
1.0 |
Netherlands |
1.5 |
0.5 |
0.7 |
France |
0.5 |
0.5 |
0.5 |
UAE |
0.9 |
0.6 |
0.5 |
U.S.A |
1.1 |
1.0 |
0.8 |
British Virgin Islands |
0.3 |
0.2 |
0.4 |
Cyprus |
0.6 |
0.3 |
1.0 |
UK |
0.4 |
0.2 |
0.3 |
Germany |
0.2 |
0.1 |
0.2 |
Hong Kong |
0.2 |
0.1 |
0.3 |
Italy |
0.1 |
0.1 |
0.1 |
Sri Lanka |
0.0 |
0.0 |
0.1 |
Others |
2.2 |
1.8 |
1.5 |
Others |
3.1 |
2.2 |
1.2 |
Total |
14.9 |
12.4 |
19.2 |
Total |
16.8 |
12.3 |
10.6 |
#: Includes equity FDI through SIA/FIPB and RBI routes only and hence are not comparable with data in other tables.
*: Includes equity (except that of individuals and banks), loans and guarantee invoked, and hence are not comparable with data in other tables. |
-
With significant improvement in gross FDI inflows and lower gross outward FDI, the net FDI (i.e., net inward FDI minus net outward FDI) to India stood significantly higher at US$ 16.2 billion during April-December 2011 (US$ 8.2 billion a year ago).
-
During April-December 2011, the actual outward FDI in joint ventures (JVs) and wholly owned subsidiaries (WOSs) stood at US$ 10.6 billion, which was around 14 per cent lower than that during the same period of preceding year. During April-December 2011, investment financed through equity declined by 46.4 per cent whereas the loan component registered a rise of 29.3 per cent over the corresponding period of 2010-11. Accordingly, the share of equity in total outward FDI fell to 35.6 per cent as compared to 57.1 per cent in the preceding year (Table 8).
Table 8: India’s Outward FDI |
(US$ billion) |
Period |
Equity* |
Loan |
Guarantees Invoked |
Total |
Apr-Dec 2011-12 (P) |
3.8 |
6.8 |
0 |
10.6 |
|
(35.6) |
(64.4) |
(0) |
|
Apr-Dec 2010-11 (PR) |
7.0 |
5.3 |
0 |
12.3 |
|
(57.1) |
(42.9) |
(0) |
|
2010-2011 (PR) |
9.3 |
7.5 |
0 |
16.8 |
|
(55.4) |
(44.6) |
(0) |
|
2009-2010 (R) |
10.6 |
4.2 |
0 |
14.8 |
|
(71.6) |
(28.4) |
(0) |
|
P: Preliminary; PR: Partially Revised; R: Revised.
*: The equity data do not include equity of individuals and banks
Note: Figures in brackets relate to percentage share in total outward FDI for the period. |
-
FII investment flows remained volatile throughout the year and on cumulative basis net FII inflows declined sharply to US$ 2.7 billion during April- December 2011 as compared with a heavy inflow of US$ 29.5 billion recorded during the same period of preceding year.
-
Inflows under currency and deposits by banking sector (NRI deposits) witnessed a sharp rise of more than 200 per cent and stood at US$ 7.3 billion as compared with an inflow of US$ 2.3 billion a year ago. Such an impressive rise in NRI deposits may be attributed to weakening of rupee and deregulation of interest rate on NRI deposits.
-
Net loans availed by non-Government and nonbanking sectors (net ECBs) stood marginally lower at US$ 8.8 billion as compared with US$ 9.5 billion recorded during April-December 2010 primarily on account of a sharp rise in the amortisation of ECBs during Q3 of 2011-12 due to FCCB redemptions. Net inflows under short-term trade credit also moderated to US$ 5.8 billion during the period from US$ 8.3 billion recorded a year ago as the cost of short-term trade credit rose and availability became difficult.
-
Net loans availed by banks almost doubled to US$ 6.7 billion during April-December 2011, partly due to rise in their overseas borrowings.
-
‘Other receivables/ payables’ that include ‘leads and lags in exports’, ‘SDR allocation’, ‘net funds held abroad’, ‘advances received pending issue of shares under FDI’, ‘rupee debt service’ and ‘other capital not included elsewhere’ recorded a lower net outflow of US$ 3.8 billion during April- December 2011 as compared with US$ 13.3 billion in the corresponding period of preceding year (Table 9). ‘Leads & lags’ in exports’ also include trade credit extended by Indian exporters to non-residents.
Table 9: Details of ‘Other Receivables /Payables’ (Net) |
(US$ billion) |
Item |
Apr-Mar |
Apr-Dec |
2009-10 (R) |
2010-11 (PR) |
2010-11 (PR) |
2011-12 (P) |
1 |
2 |
3 |
4 |
5 |
Lead and Lags in Exports |
-3.4 |
-8.8 |
-8.7 |
-4.4 |
Net Funds Held Abroad |
-7.6 |
-5.4 |
-4.6 |
-2.8 |
Advances Received Pending Issue of Shares under FDI |
3.1 |
6.9 |
4.2 |
3.6 |
SDR Allocation |
5.2 |
0 |
0 |
0 |
Other capital not included elsewhere# |
-10.6 |
-3.8 |
-4.2 |
-0.2 |
Total (1 to 5) |
-13.3 |
-11.1 |
-13.3 |
-3.8 |
#: Inclusive of derivatives and hedging, migrant transfers, rupee debt service and other capital transfers
P: Preliminary. PR: Partially Revised. R: Revised. -: Nil/NA. |
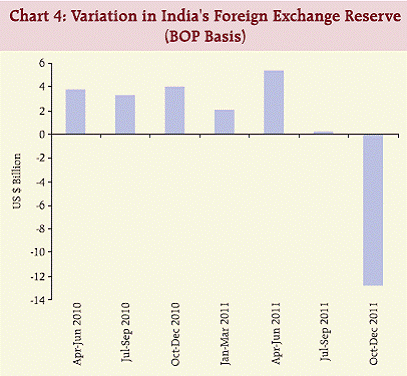
Reserve Variation
- There was a net drawdown of foreign exchange reserves to the extent of US$ 7.1 billion during April-December 2011 (Chart 4). In nominal terms (i.e., including valuation changes), foreign exchange reserves declined by US$ 8.1 billion during the period reflecting appreciation of US dollar against the major international currencies. At the end of December 2011, the level of foreign exchange reserves stood at US$ 296.7 billion.
Difference between DGCI&S and Balance of Payments Imports The data on imports based on DGCI&S (customs statistics) and the BoP (banking channel data) are given in Table 10. The difference between the two sets of data are likely to get reduced when both the sources revise them (Table 10).
Table 10: DGCI&S and the BoP Import Data |
(US$ billion) |
Item |
Apr-Mar |
Apr-Dec |
2009-10 |
2010-11 |
2011-12 |
1 |
2 |
3 |
4 |
1. BoP Imports |
300.6 |
381.1 |
354.3 |
2. DGCI&S Imports |
288.4 |
369.8 |
362.4 |
3. Difference (1-2) |
12.2 |
11.3 |
(-)8.1 |
Statement 1: Standard Presentation of BoP in India as per BPM6 |
(US$ million) |
Item |
Apr-Mar 2009-10 (R) |
Apr-Mar 2010-11 (PR) |
Credit |
Debit |
Net |
Credit |
Debit |
Net |
1 |
2 |
3 |
4 |
5 |
6 |
1 Current Account (1.A+1.B+1.C) |
344651 |
383087 |
-38435 |
447000 |
492958 |
-45958 |
1.A Goods and Services (1.A.a+1.A.b) |
277991 |
360181 |
-82190 |
382280 |
464054 |
-81775 |
1.A.a Goods (1.A.a.1 to 1.A.a.3) |
182262 |
300644 |
-118382 |
250627 |
381061 |
-130434 |
1.A.a.1 General merchandise on a BOP basis |
182442 |
271829 |
-89387 |
250468 |
347106 |
-96638 |
1.A.a.1.1 Re-exports |
– |
– |
– |
– |
– |
– |
1.A.a.2 Net exports of goods under merchanting |
-180 |
– |
-180 |
159 |
– |
159 |
1.A.a.2.1 Goods acquired under merchanting (negative credits) |
– |
– |
– |
– |
– |
– |
1.A.a.2.2 Goods sold under merchanting |
– |
– |
– |
– |
– |
– |
1.A.a.3 Non-monetary gold |
– |
28816 |
-28816 |
– |
33955 |
-33955 |
1.A.b Services (1.A.b.1 to 1.A.b.13) |
95729 |
59537 |
36192 |
131653 |
82993 |
48659 |
1.A.b.1 Manufacturing services on physical inputs owned by others |
– |
– |
– |
– |
– |
– |
1.A.b.1.1 Goods for processing in reporting economy |
– |
– |
– |
– |
– |
– |
1.A.b.1.2 Goods for processing abroad |
– |
– |
– |
– |
– |
– |
1.A.b.2 Maintenance and repair services n.i.e. |
– |
– |
– |
– |
– |
– |
1.A.b.3 Transport |
11185 |
12035 |
-850 |
14323 |
13947 |
375 |
1.A.b.3.1 Sea transport |
5825 |
7264 |
-1439 |
6167 |
8116 |
-1949 |
1.A.b.3.2 Air transport |
1816 |
3738 |
-1923 |
2464 |
4780 |
-2316 |
1.A.b.3.3 Other modes of transport |
3537 |
931 |
2606 |
5641 |
984 |
4656 |
1.A.b.3.4 Postal and courier services |
8 |
101 |
-94 |
52 |
67 |
-15 |
1.A.b.4 Travel |
11859 |
9343 |
2517 |
15275 |
11108 |
4167 |
1.A.b.4.1 Business |
– |
3463 |
-3463 |
– |
4979 |
-4979 |
1.A.b.4.2 Personal |
– |
5880 |
-5880 |
– |
6129 |
-6129 |
1.A.b.4.2.1 Health-related |
– |
28 |
-28 |
– |
59 |
-59 |
1.A.b.4.2.2 Education-related |
– |
2137 |
-2137 |
– |
1893 |
-1893 |
1.A.b.4.2.3 Other |
– |
3661 |
-3661 |
– |
4178 |
-4178 |
1.A.b.5 Construction |
560 |
998 |
-438 |
677 |
1157 |
-481 |
1.A.b.5.1 Construction abroad |
560 |
535 |
25 |
677 |
633 |
44 |
1.A.b.5.2 Construction in the reporting economy |
– |
463 |
-463 |
– |
524 |
-524 |
1.A.b.6 Insurance and pension services |
1591 |
1285 |
306 |
1948 |
1400 |
549 |
1.A.b.6.1 Direct insurance |
1290 |
456 |
834 |
1790 |
584 |
1205 |
1.A.b.6.2 Reinsurance |
270 |
684 |
-414 |
127 |
750 |
-623 |
1.A.b.6.3 Auxiliary insurance services |
31 |
145 |
-114 |
32 |
65 |
-33 |
1.A.b.6.4 Pension and standardized guarantee services |
– |
– |
– |
– |
– |
– |
1.A.b.7 Financial services |
3692 |
4642 |
-950 |
6508 |
7483 |
-975 |
1.A.b.7.1 Explicitly charged and other financial services |
3692 |
4642 |
-950 |
6508 |
7483 |
-975 |
1.A.b.7.2 Financial intermediation services indirectly measured |
– |
– |
– |
– |
– |
– |
1.A.b.8 Charges for the use of intellectual property n.i.e. |
203 |
2017 |
-1814 |
193 |
2424 |
-2231 |
1.A.b.9 Telecommunications, computer, and information services |
51879 |
3251 |
48629 |
57577 |
3748 |
53829 |
1.A.b.9.1 Telecommunications services |
1823 |
1144 |
679 |
1512 |
1085 |
427 |
1.A.b.9.2 Computer services |
49705 |
1468 |
48237 |
55460 |
2194 |
53265 |
1.A.b.9.3 Information services |
351 |
639 |
-288 |
605 |
468 |
137 |
1.A.b.10 Other business services |
11292 |
17926 |
-6634 |
22823 |
26696 |
-3874 |
1.A.b.10.1 Research and development services |
565 |
318 |
247 |
878 |
249 |
629 |
1.A.b.10.2 Professional and management consulting services |
5989 |
9998 |
-4009 |
10626 |
11991 |
-1365 |
1.A.b.10.3 Technical, trade-related, and other business services |
4738 |
7610 |
-2872 |
11319 |
14457 |
-3138 |
1.A.b.11 Personal, cultural, and recreational services |
527 |
300 |
227 |
227 |
543 |
-316 |
1.A.b.11.1 Audiovisual and related services |
438 |
172 |
266 |
117 |
147 |
-30 |
1.A.b.11.2 Other personal, cultural, and recreational services |
89 |
128 |
-39 |
110 |
396 |
-287 |
1.A.b.12 Government goods and services n.i.e. |
441 |
525 |
-84 |
531 |
820 |
-288 |
1.A.b.13 Others n.i.e. |
2499 |
7216 |
-4717 |
11571 |
13667 |
-2096 |
1.B Primary Income (1.B.1 to 1.B.3) |
13024 |
21061 |
-8036 |
9102 |
26411 |
-17308 |
1.B.1 Compensation of employees |
915 |
1705 |
-791 |
1116 |
2028 |
-912 |
1.B.2 Investment income |
12110 |
19355 |
-7246 |
7986 |
24383 |
-16397 |
1.B.2.1 Direct investment |
6199 |
19084 |
-12885 |
3824 |
24011 |
-20188 |
1.B.2.1.1 Income on equity and investment fund shares |
1989 |
12698 |
-10709 |
2049 |
16840 |
-14791 |
1.B.2.1.2 Interest |
4210 |
6386 |
-2176 |
1775 |
7171 |
-5397 |
1.B.2.2 Portfolio investment |
– |
– |
– |
– |
– |
– |
1.B.2.3 Other investment |
– |
262 |
-262 |
– |
353 |
-353 |
1.B.2.4 Reserve assets |
5910 |
9 |
5901 |
4162 |
18 |
4144 |
1.B.3 Other primary income |
– |
– |
– |
– |
– |
– |
1.C Secondary Income (1.C.1+1.C.2) |
53636 |
1845 |
51791 |
55618 |
2494 |
53125 |
1.C.1 Financial corporations, nonfinancial corporations, households, and NPISHs |
53636 |
1902 |
51735 |
55618 |
2494 |
53125 |
1.C.1.1 Personal transfers (Current transfers between resident and/ non-resident households) |
51695 |
1515 |
50180 |
53559 |
2078 |
51481 |
of which: |
– |
– |
– |
– |
– |
– |
1.C.1.1.1 Workers’ remittances |
28407 |
1881 |
26526 |
27408 |
2078 |
25331 |
1.C.1.2 Other current transfers |
1942 |
387 |
1555 |
2060 |
416 |
1644 |
2 Capital Account (2.1+2.2) |
777 |
501 |
276 |
685 |
645 |
40 |
2.1 Gross acquisitions (DR.)/disposals (CR.) of non-produced nonfinancial assets |
50 |
28 |
22 |
38 |
14 |
25 |
2.2 Capital transfers |
727 |
473 |
254 |
647 |
631 |
16 |
2.2.1 General government |
727 |
473 |
254 |
647 |
631 |
16 |
2.2.1.1 Debt forgiveness |
– |
– |
– |
– |
– |
– |
2.2.1.2 Other capital transfers |
727 |
473 |
254 |
647 |
631 |
16 |
2.2.2 Financial corporations, nonfinancial corporations, households, and NPISHs |
|
|
|
|
|
|
Statement 1: Standard Presentation of BoP in India as per BPM6 |
(US$ million) |
Item |
Apr-Mar 2009-10 (R) |
Apr-Mar 2010-11 (PR) |
Credit |
Debit |
Net |
Credit |
Debit |
Net |
1 |
2 |
3 |
4 |
5 |
6 |
3 Financial Account (3.1 to 3.5) |
345717 |
307546 |
38171 |
499317 |
450403 |
48914 |
3.1 Direct Investment (3.1A+3.1B) |
38484 |
20518 |
17966 |
35464 |
26104 |
9360 |
3.1.A Direct Investment in India |
37746 |
4637 |
33109 |
32902 |
7018 |
25884 |
3.1.1 Equity and investment fund shares |
35815 |
4241 |
31574 |
32244 |
6514 |
25730 |
3.1.1.1 Equity other than reinvestment of earnings |
27146 |
4241 |
22905 |
20304 |
6514 |
13791 |
3.1.1.1.1 Direct investor in direct investment enterprises |
27146 |
4241 |
22905 |
20304 |
6514 |
13791 |
3.1.1.1.2 Direct investment enterprises in direct investor (reverse investment) |
– |
– |
– |
– |
– |
– |
3.1.1.1.3 Between fellow enterprises |
– |
– |
– |
– |
– |
– |
3.1.1.2 Reinvestment of earnings |
8669 |
– |
8669 |
11939 |
– |
11939 |
3.1.2 Debt instruments |
1931 |
396 |
1535 |
658 |
504 |
154 |
3.1.2.1 Direct investor in direct investment enterprises |
1931 |
396 |
1535 |
658 |
504 |
154 |
3.1.2.2 Direct investment enterprises in direct investor (reverse investment) |
– |
– |
– |
– |
– |
– |
3.1.2.3 Between fellow enterprises |
– |
– |
– |
– |
– |
– |
3.1.B Direct Investment by India |
738 |
15881 |
-15143 |
2562 |
19086 |
-16524 |
3.1.1 Equity and investment fund shares |
738 |
11693 |
-10955 |
2562 |
11621 |
-9059 |
3.1.1.1 Equity other than reinvestment of earnings |
738 |
10609 |
-9871 |
2562 |
10537 |
-7975 |
3.1.1.1.1 Direct investor in direct investment enterprises |
738 |
10609 |
-7528 |
2562 |
10537 |
-7975 |
3.1.1.1.2 Direct investment enterprises in direct investor (reverse investment) |
– |
– |
– |
– |
– |
– |
3.1.1.1.3 Between fellow enterprises |
– |
– |
– |
– |
– |
– |
3.1.1.2 Reinvestment of earnings |
– |
1084 |
-1084 |
– |
1084 |
-1084 |
3.1.2 Debt instruments |
– |
4188 |
-4188 |
– |
7465 |
-7465 |
3.1.2.1 Direct investor in direct investment enterprises |
– |
4188 |
-4188 |
– |
7465 |
-7465 |
3.1.2.2 Direct investment enterprises in direct investor (reverse investment) |
– |
– |
– |
– |
– |
– |
3.1.2.3 Between fellow enterprises |
– |
– |
– |
– |
– |
– |
3.2 Portfolio Investment |
156842 |
127773 |
29069 |
251903 |
223660 |
28243 |
3.2A Portfolio Investment in India |
156570 |
127521 |
29049 |
251125 |
221704 |
29422 |
3.2.1 Equity and investment fund shares |
130471 |
93599 |
36873 |
187837 |
168910 |
18927 |
3.2.2 Debt securities |
26099 |
33922 |
-7824 |
63289 |
52794 |
10495 |
3.2.B Portfolio Investment by India |
272 |
252 |
20 |
777 |
1956 |
-1179 |
3.3 Financial derivatives (other than reserves) and employee stock options |
– |
– |
– |
– |
– |
– |
3.4 Other investment |
150391 |
145814 |
4577 |
211950 |
187589 |
24361 |
3.4.1 Other equity (ADRs/GDRs) |
3328 |
– |
3328 |
2049 |
– |
2049 |
3.4.2 Currency and deposits |
41961 |
38882 |
3078 |
50954 |
47186 |
3768 |
3.4.2.1 Central bank (Rupee Debt Movements; NRG) |
606 |
449 |
157 |
1702 |
1172 |
529 |
3.4.2.2 Deposit-taking corporations, except the central bank (NRI Deposits) |
41355 |
38433 |
2922 |
49252 |
46014 |
3238 |
3.4.2.3 General government |
– |
– |
– |
– |
– |
– |
3.4.2.4 Other sectors |
– |
– |
– |
– |
– |
– |
3.4.3 Loans (External Assistance, ECBs and Banking Capital) |
40438 |
36543 |
3894 |
73363 |
54722 |
18641 |
3.4.3A Loans to India |
39414 |
34617 |
4797 |
71447 |
53108 |
18339 |
3.4.3.1 Central bank |
– |
– |
– |
– |
– |
– |
3.4.3.2 Deposit-taking corporations, except the central bank |
19538 |
20533 |
-995 |
41369 |
40175 |
1194 |
3.4.3.3 General government (External Assistance) |
5846 |
2585 |
3261 |
7806 |
2840 |
4967 |
3.4.3.4 Other sectors (External Commercial Borrowings) |
14029 |
11498 |
2531 |
22272 |
10094 |
12179 |
3.4.3B Loans by India |
1024 |
1927 |
-903 |
1916 |
1614 |
302 |
3.4.3.1 Central bank |
– |
– |
– |
– |
– |
– |
3.4.3.2 Deposit-taking corporations, except the central bank |
– |
– |
– |
– |
– |
– |
3.4.3.3 General government |
51 |
422 |
-371 |
76 |
102 |
-26 |
3.4.3.4 Other sectors |
973 |
1505 |
-531 |
1840 |
1513 |
328 |
3.4.4 Insurance, pension, and standardized guarantee schemes |
– |
– |
– |
– |
– |
– |
3.4.5 Trade credit and advances |
53264 |
45706 |
7558 |
75732 |
64742 |
10990 |
3.4.5.1 Central bank |
– |
– |
– |
– |
– |
– |
3.4.5.2 General government |
– |
– |
– |
– |
– |
– |
3.4.5.3 Deposit-taking corporations |
– |
– |
– |
– |
– |
– |
3.4.5.4 Other sectors |
53264 |
45706 |
7558 |
75732 |
64742 |
10990 |
3.4.6 Other accounts receivable/payable-other |
11401 |
24682 |
-13281 |
9852 |
20939 |
-11088 |
3.4.7 Special drawing rights |
– |
– |
– |
– |
– |
– |
3.5 Reserve assets |
– |
13441 |
-13441 |
– |
13050 |
-13050 |
3.5.1 Monetary gold |
– |
– |
– |
– |
– |
– |
3.5.2 Special drawing rights n.a. |
– |
– |
– |
– |
– |
– |
3.5.3 Reserve position in the IMF n.a. |
– |
– |
– |
– |
– |
– |
3.5.4 Other reserve assets (Foreign Currency Assets) |
– |
13441 |
-13441 |
– |
13050 |
-13050 |
3.5.4.1 Currency,deposits and securities |
– |
13441 |
-13441 |
– |
13050 |
-13050 |
3.5.4.2 Financial derivatives |
– |
– |
– |
– |
– |
– |
3.5.4.3 Other claims |
– |
– |
– |
– |
– |
– |
3 Total assets/liabilities |
345717 |
307546 |
38171 |
499317 |
450403 |
48914 |
of which: (by instrument): |
|
|
|
|
|
|
3.0.1 Equity and investment fund shares |
167297 |
109785 |
57512 |
223420 |
189001 |
34419 |
3.0.2 Debt instruments |
163692 |
159638 |
4054 |
263996 |
227413 |
36583 |
3.0.3 Other financial assets and liabilities |
14729 |
38124 |
-23395 |
11901 |
33990 |
-22089 |
4 Net errors and omissions |
|
12 |
-12 |
|
2996 |
-2996 |
Statement 1: Standard Presentation of BoP in India as per BPM6 (Contd.) |
(US$ million) |
Item |
Apr-Jun 2009 (R) |
Jul-Sept 2009 (R) |
Credit |
Debit |
Net |
Credit |
Debit |
Net |
7 |
8 |
9 |
10 |
11 |
12 |
1 Current Account (1.A+1.B+1.C) |
77706 |
81795 |
-4089 |
83600 |
92857 |
-9257 |
1.A Goods and Services (1.A.a+1.A.b) |
61457 |
76277 |
-14820 |
64632 |
86578 |
-21946 |
1.A.a Goods (1.A.a.1 to 1.A.a.3) |
39072 |
65447 |
-26374 |
43346 |
72994 |
-29649 |
1.A.a.1 General merchandise on a BOP basis |
39166 |
59612 |
-20445 |
43403 |
67571 |
-24169 |
1.A.a.1.1 Re-exports |
– |
– |
– |
– |
– |
– |
1.A.a.2 Net exports of goods under merchanting |
-94 |
|
-94 |
-57 |
|
-57 |
1.A.a.2.1 Goods acquired under merchanting (negative credits) |
– |
– |
– |
– |
– |
– |
1.A.a.2.2 Goods sold under merchanting |
– |
– |
– |
– |
– |
– |
1.A.a.3 Non-monetary gold |
– |
5835 |
-5835 |
– |
5423 |
-5423 |
1.A.b Services (1.A.b.1 to 1.A.b.13) |
22385 |
10830 |
11554 |
21287 |
13583 |
7703 |
1.A.b.1 Manufacturing services on physical inputs owned by others |
– |
– |
– |
– |
– |
– |
1.A.b.1.1 Goods for processing in reporting economy |
– |
– |
– |
– |
– |
– |
1.A.b.1.2 Goods for processing abroad |
– |
– |
– |
– |
– |
– |
1.A.b.2 Maintenance and repair services n.i.e. |
– |
– |
– |
– |
– |
– |
1.A.b.3 Transport |
2503 |
2811 |
-308 |
2571 |
2242 |
329 |
1.A.b.3.1 Sea transport |
1434 |
1599 |
-164 |
1456 |
1271 |
185 |
1.A.b.3.2 Air transport |
437 |
905 |
-467 |
333 |
760 |
-426 |
1.A.b.3.3 Other modes of transport |
630 |
274 |
356 |
781 |
190 |
591 |
1.A.b.3.4 Postal and courier services |
2 |
34 |
-32 |
1 |
22 |
-20 |
1.A.b.4 Travel |
2,297 |
2,035 |
262 |
2,719 |
2,357 |
362 |
1.A.b.4.1 Business |
– |
826 |
-826 |
– |
833 |
-833 |
1.A.b.4.2 Personal |
– |
1209 |
-1209 |
– |
1524 |
-1524 |
1.A.b.4.2.1 Health-related |
– |
7 |
-7 |
– |
7 |
-7 |
1.A.b.4.2.2 Education-related |
– |
360 |
-360 |
– |
735 |
-735 |
1.A.b.4.2.3 Other |
– |
831 |
-831 |
– |
739 |
-739 |
1.A.b.5 Construction |
149 |
267 |
-118 |
150 |
259 |
-109 |
1.A.b.5.1 Construction abroad |
149 |
174 |
-25 |
150 |
121 |
29 |
1.A.b.5.2 Construction in the reporting economy |
– |
93 |
-93 |
– |
138 |
-138 |
1.A.b.6 Insurance and pension services |
388 |
314 |
74 |
384 |
341 |
44 |
1.A.b.6.1 Direct insurance |
308 |
64 |
244 |
250 |
201 |
49 |
1.A.b.6.2 Reinsurance |
73 |
146 |
-73 |
128 |
128 |
– |
1.A.b.6.3 Auxiliary insurance services |
7 |
104 |
-97 |
6 |
11 |
-5 |
1.A.b.6.4 Pension and standardized guarantee services |
– |
– |
– |
– |
– |
– |
1.A.b.7 Financial services |
1116 |
835 |
282 |
732 |
1135 |
-403 |
1.A.b.7.1 Explicitly charged and other financial services |
1116 |
835 |
282 |
732 |
1135 |
-403 |
1.A.b.7.2 Financial intermediation services indirectly measured |
– |
– |
– |
– |
– |
– |
1.A.b.8 Charges for the use of intellectual property n.i.e. |
69 |
414 |
-345 |
47 |
409 |
-362 |
1.A.b.9 Telecommunications, computer, and information services |
11509 |
726 |
10784 |
11900 |
788 |
11112 |
1.A.b.9.1 Telecommunications services |
416 |
243 |
173 |
611 |
280 |
331 |
1.A.b.9.2 Computer services |
11004 |
391 |
10613 |
11207 |
438 |
10769 |
1.A.b.9.3 Information services |
89 |
91 |
-2 |
83 |
71 |
12 |
1.A.b.10 Other business services |
2557 |
3172 |
-615 |
2504 |
4612 |
-2109 |
1.A.b.10.1 Research and development services |
106 |
51 |
55 |
145 |
56 |
90 |
1.A.b.10.2 Professional and management consulting services |
1485 |
1531 |
-46 |
1348 |
2639 |
-1291 |
1.A.b.10.3 Technical, trade-related, and other business services |
966 |
1590 |
-624 |
1010 |
1918 |
-907 |
1.A.b.11 Personal, cultural, and recreational services |
95 |
98 |
-3 |
139 |
89 |
50 |
1.A.b.11.1 Audiovisual and related services |
79 |
40 |
39 |
112 |
74 |
38 |
1.A.b.11.2 Other personal, cultural, and recreational services |
16 |
58 |
-43 |
27 |
15 |
12 |
1.A.b.12 Government goods and services n.i.e. |
100 |
103 |
-3 |
100 |
130 |
-29 |
1.A.b.13 Others n.i.e. |
1600 |
56 |
1544 |
39 |
1221 |
-1182 |
1.B Primary Income (1.B.1 to 1.B.3) |
2,951 |
5,159 |
-2208 |
4,751 |
5,819 |
-1068 |
1.B.1 Compensation of employees |
227 |
351 |
-124 |
205 |
342 |
-137 |
1.B.2 Investment income |
2723 |
4808 |
-2085 |
4546 |
5477 |
-931 |
1.B.2.1 Direct investment |
808 |
4768 |
-3960 |
2534 |
5420 |
-2886 |
1.B.2.1.1 Income on equity and investment fund shares |
408 |
3,093 |
-2685 |
411 |
3,614 |
-3203 |
1.B.2.1.2 Interest |
400 |
1675 |
-1275 |
2123 |
1806 |
318 |
1.B.2.2 Portfolio investment |
– |
– |
– |
– |
– |
– |
1.B.2.3 Other investment |
– |
38 |
-38 |
– |
56 |
-56 |
1.B.2.4 Reserve assets |
1915 |
1 |
1914 |
2012 |
1 |
2011 |
1.B.3 Other primary income |
– |
– |
– |
– |
– |
– |
1.C Secondary Income (1.C.1+1.C.2) |
13,298 |
360 |
12939 |
14,217 |
460 |
13757 |
1.C.1 Financial corporations, nonfinancial corporations, households, and NPISHs |
13,298 |
360 |
12,939 |
14,217 |
470 |
13,747 |
1.C.1.1 Personal transfers (Current transfers between resident and/ non-resident households) |
12,753 |
289 |
12,464 |
13,742 |
373 |
13,369 |
| of which: |
|
|
|
|
|
|
1.C.1.1.1 Workers’ remittances |
7,184 |
289 |
6,895 |
7,493 |
443 |
7,049 |
1.C.1.2 Other current transfers |
546 |
70 |
475 |
474 |
97 |
378 |
2 Capital Account (2.1+2.2) |
63 |
117 |
-54 |
179 |
114 |
65 |
2.1 Gross acquisitions (DR.)/disposals (CR.) of non-produced nonfinancial assets |
17 |
8 |
9 |
10 |
5 |
5 |
2.2 Capital transfers |
47 |
110 |
-63 |
169 |
108 |
60 |
2.2.1 General government |
47 |
110 |
-63 |
169 |
108 |
60 |
2.2.1.1 Debt forgiveness |
– |
– |
– |
– |
– |
– |
2.2.1.2 Other capital transfers |
47 |
110 |
-63 |
169 |
108 |
60 |
2.2.2 Financial corporations, nonfinancial corporations, households, and NPISHs |
– |
– |
– |
– |
– |
– |
Statement 1: Standard Presentation of BoP in India as per BPM6 (Contd.) |
(US$ million) |
Item |
Apr-Jun 2009 (R) |
Jul-Sept 2009 (R) |
Credit |
Debit |
Net |
Credit |
Debit |
Net |
7 |
8 |
9 |
10 |
11 |
12 |
3 Financial Account (3.1 to 3.5) |
77791 |
74106 |
3685 |
96032 |
86199 |
9832 |
3.1 Direct Investment (3.1A+3.1B) |
9950 |
4980 |
4970 |
11551 |
4126 |
7425 |
3.1.A Direct Investment in India |
9825 |
926 |
8900 |
11455 |
632 |
10824 |
3.1.1 Equity and investment fund shares |
9457 |
900 |
8558 |
10714 |
597 |
10117 |
3.1.1.1 Equity other than reinvestment of earnings |
7290 |
900 |
6390 |
8547 |
597 |
7950 |
3.1.1.1.1 Direct investor in direct investment enterprises |
7290 |
900 |
6390 |
8547 |
597 |
7950 |
3.1.1.1.2 Direct investment enterprises in direct investor (reverse investment) |
– |
– |
– |
– |
– |
– |
3.1.1.1.3 Between fellow enterprises |
– |
– |
– |
– |
– |
– |
3.1.1.2 Reinvestment of earnings |
2167 |
– |
2167 |
2167 |
– |
2167 |
3.1.2 Debt instruments |
368 |
26 |
342 |
741 |
35 |
707 |
3.1.2.1 Direct investor in direct investment enterprises |
368 |
26 |
342 |
741 |
35 |
707 |
3.1.2.2 Direct investment enterprises in direct investor (reverse investment) |
– |
– |
– |
– |
– |
– |
3.1.2.3 Between fellow enterprises |
– |
– |
– |
– |
– |
– |
3.1.B Direct Investment by India |
125 |
4054 |
-3929 |
95 |
3494 |
-3399 |
3.1.1 Equity and investment fund shares |
125 |
3108 |
-2984 |
95 |
2402 |
-2306 |
3.1.1.1 Equity other than reinvestment of earnings |
125 |
2837 |
-2713 |
95 |
2131 |
-2035 |
3.1.1.1.1 Direct investor in direct investment enterprises |
125 |
2837 |
-1765 |
95 |
2131 |
-1905 |
3.1.1.1.2 Direct investment enterprises in direct investor (reverse investment) |
– |
– |
– |
– |
– |
– |
3.1.1.1.3 Between fellow enterprises |
– |
– |
– |
– |
– |
– |
3.1.1.2 Reinvestment of earnings |
– |
271 |
-271 |
– |
271 |
-271 |
3.1.2 Debt instruments |
– |
946 |
-946 |
– |
1092 |
-1092 |
3.1.2.1 Direct investor in direct investment enterprises |
– |
946 |
-946 |
– |
1092 |
-1092 |
3.1.2.2 Direct investment enterprises in direct investor (reverse investment) |
– |
– |
– |
– |
– |
– |
3.1.2.3 Between fellow enterprises |
– |
– |
– |
– |
– |
– |
3.2 Portfolio Investment |
38582 |
30357 |
8225 |
41697 |
34683 |
7014 |
3.2A Portfolio Investment in India |
38,559 |
30,332 |
8227 |
41,693 |
34,655 |
7038 |
3.2.1 Equity and investment fund shares |
33863 |
26120 |
7743 |
36107 |
24604 |
11503 |
3.2.2 Debt securities |
4696 |
4212 |
484 |
5586 |
10051 |
-4465 |
3.2.B Portfolio Investment by India |
23 |
25 |
-2 |
4 |
28 |
-24 |
3.3 Financial derivatives (other than reserves) and employee stock options |
– |
– |
– |
– |
– |
– |
3.4 Other investment |
29259 |
38655 |
-9396 |
42784 |
37973 |
4811 |
3.4.1 Other equity (ADRs/GDRs) |
43 |
– |
43 |
2664 |
– |
2664 |
3.4.2 Currency and deposits |
11172 |
9593 |
1579 |
10342 |
9438 |
904 |
3.4.2.1 Central bank (Rupee Debt Movements; NRG) |
– |
239 |
-238 |
– |
143 |
-143 |
3.4.2.2 Deposit-taking corporations, except the central bank (NRI Deposits) |
11172 |
9354 |
1817 |
10342 |
9295 |
1047 |
3.4.2.3 General government |
– |
– |
– |
– |
– |
– |
3.4.2.4 Other sectors |
– |
– |
– |
– |
– |
– |
3.4.3 Loans (External Assistance, ECBs and Banking Capital) |
7391 |
12496 |
-5105 |
10962 |
5503 |
5459 |
3.4.3A Loans to India |
7134 |
12058 |
-4923 |
10744 |
5182 |
5561 |
3.4.3.1 Central bank |
– |
– |
– |
– |
– |
– |
3.4.3.2 Deposit-taking corporations, except the central bank |
4405 |
9349 |
-4944 |
6202 |
2694 |
3508 |
3.4.3.3 General government (External Assistance) |
1001 |
623 |
378 |
1464 |
635 |
829 |
3.4.3.4 Other sectors (External Commercial Borrowings) |
1728 |
2085 |
-357 |
3077 |
1853 |
1224 |
3.4.3B Loans by India |
257 |
438 |
-182 |
218 |
320 |
-102 |
3.4.3.1 Central bank |
– |
– |
– |
– |
– |
– |
3.4.3.2 Deposit-taking corporations, except the central bank |
– |
– |
– |
– |
– |
– |
3.4.3.3 General government |
13 |
105 |
-93 |
13 |
105 |
-93 |
3.4.3.4 Other sectors |
244 |
333 |
-89 |
206 |
215 |
-9 |
3.4.4 Insurance, pension, and standardized guarantee schemes |
– |
– |
– |
– |
– |
– |
3.4.5 Trade credit and advances |
10126 |
11382 |
-1256 |
11928 |
10721 |
1206 |
3.4.5.1 Central bank |
– |
– |
– |
– |
– |
– |
3.4.5.2 General government |
– |
– |
– |
– |
– |
– |
3.4.5.3 Deposit-taking corporations |
– |
– |
– |
– |
– |
– |
3.4.5.4 Other sectors |
10126 |
11382 |
-1256 |
11928 |
10721 |
1206 |
3.4.6 Other accounts receivable/payable-other |
528 |
5184 |
-4656 |
6889 |
12311 |
-5422 |
3.4.7 Special drawing rights |
|
|
– |
|
|
– |
3.5 Reserve assets |
– |
115 |
-115 |
– |
9418 |
-9418 |
3.5.1 Monetary gold |
– |
– |
– |
– |
– |
– |
3.5.2 Special drawing rights n.a. |
– |
– |
– |
– |
– |
– |
3.5.3 Reserve position in the IMF n.a. |
– |
– |
– |
– |
– |
– |
3.5.4 Other reserve assets (Foreign Currency Assets) |
– |
115 |
-115 |
– |
9418 |
-9418 |
3.5.4.1 Currency,deposits and securities |
– |
115 |
-115 |
– |
9418 |
-9418 |
3.5.4.2 Financial derivatives |
– |
– |
– |
– |
– |
– |
3.5.4.3 Other claims |
– |
– |
– |
– |
– |
– |
3 Total assets/liabilities |
77791 |
74106 |
3685 |
96032 |
86199 |
9832 |
of which: (by instrument): |
|
|
|
|
|
|
3.0.1 Equity and investment fund shares |
43468 |
30152 |
13315 |
46921 |
27631 |
19290 |
3.0.2 Debt instruments |
33753 |
38655 |
-4902 |
39558 |
36840 |
2719 |
3.0.3 Other financial assets and liabilities |
571 |
5299 |
-4728 |
9553 |
21729 |
-12176 |
4 Net errors and omissions |
459 |
|
459 |
|
641 |
-641 |
Statement 1: Standard Presentation of BoP in India as per BPM6 (Contd.) |
(US$ million) |
Item |
Oct-Dec 2009 (R) |
Jan-Mar 2010 (R) |
Credit |
Debit |
Net |
Credit |
Debit |
Net |
13 |
14 |
15 |
16 |
17 |
18 |
1 Current Account (1.A+1.B+1.C) |
87188 |
99643 |
-12455 |
96157 |
108791 |
-12634 |
1.A Goods and Services (1.A.a+1.A.b) |
71521 |
94001 |
-22480 |
80381 |
103326 |
-22945 |
1.A.a Goods (1.A.a.1 to 1.A.a.3) |
47160 |
78100 |
-30940 |
52685 |
84104 |
-31419 |
1.A.a.1 General merchandise on a BOP basis |
47170 |
70528 |
-23357 |
52702 |
74118 |
-21416 |
1.A.a.1.1 Re-exports |
– |
– |
– |
– |
– |
– |
1.A.a.2 Net exports of goods under merchanting |
-11 |
|
-11 |
-18 |
|
-18 |
1.A.a.2.1 Goods acquired under merchanting (negative credits) |
– |
– |
– |
– |
– |
– |
1.A.a.2.2 Goods sold under merchanting |
– |
– |
– |
– |
– |
– |
1.A.a.3 Non-monetary gold |
– |
7572 |
-7572 |
– |
9986 |
-9986 |
1.A.b Services (1.A.b.1 to 1.A.b.13) |
24361 |
15901 |
8460 |
27696 |
19222 |
8474 |
1.A.b.1 Manufacturing services on physical inputs owned by others |
– |
– |
– |
– |
– |
– |
1.A.b.1.1 Goods for processing in reporting economy |
– |
– |
– |
– |
– |
– |
1.A.b.1.2 Goods for processing abroad |
– |
– |
– |
– |
– |
– |
1.A.b.2 Maintenance and repair services n.i.e. |
– |
– |
– |
– |
– |
– |
1.A.b.3 Transport |
2992 |
3383 |
-391 |
3119 |
3599 |
-480 |
1.A.b.3.1 Sea transport |
1414 |
2161 |
-747 |
1521 |
2233 |
-713 |
1.A.b.3.2 Air transport |
510 |
950 |
-441 |
536 |
1124 |
-588 |
1.A.b.3.3 Other modes of transport |
1068 |
255 |
813 |
1058 |
213 |
846 |
1.A.b.3.4 Postal and courier services |
– |
16 |
-16 |
4 |
29 |
-25 |
1.A.b.4 Travel |
3,440 |
2,312 |
1127 |
3,403 |
2,638 |
766 |
1.A.b.4.1 Business |
– |
903 |
-903 |
– |
901 |
-901 |
1.A.b.4.2 Personal |
– |
1410 |
-1410 |
– |
1736 |
-1736 |
1.A.b.4.2.1 Health-related |
– |
8 |
-8 |
– |
6 |
-6 |
1.A.b.4.2.2 Education-related |
– |
551 |
-551 |
– |
491 |
-491 |
1.A.b.4.2.3 Other |
– |
851 |
-851 |
– |
1240 |
-1240 |
1.A.b.5 Construction |
160 |
182 |
-22 |
102 |
290 |
-189 |
1.A.b.5.1 Construction abroad |
160 |
123 |
37 |
102 |
117 |
-15 |
1.A.b.5.2 Construction in the reporting economy |
– |
59 |
-59 |
– |
174 |
-174 |
1.A.b.6 Insurance and pension services |
395 |
305 |
90 |
423 |
326 |
97 |
1.A.b.6.1 Direct insurance |
351 |
33 |
318 |
381 |
157 |
224 |
1.A.b.6.2 Reinsurance |
37 |
255 |
-218 |
31 |
155 |
-124 |
1.A.b.6.3 Auxiliary insurance services |
7 |
16 |
-10 |
11 |
13 |
-3 |
1.A.b.6.4 Pension and standardized guarantee services |
– |
– |
– |
– |
– |
– |
1.A.b.7 Financial services |
741 |
1156 |
-415 |
1103 |
1517 |
-414 |
1.A.b.7.1 Explicitly charged and other financial services |
741 |
1156 |
-415 |
1103 |
1517 |
-414 |
1.A.b.7.2 Financial intermediation services indirectly measured |
– |
– |
– |
– |
– |
– |
1.A.b.8 Charges for the use of intellectual property n.i.e. |
45 |
578 |
-532 |
41 |
616 |
-574 |
1.A.b.9 Telecommunications, computer, and information services |
13717 |
1006 |
12711 |
14752 |
731 |
14022 |
1.A.b.9.1 Telecommunications services |
421 |
296 |
125 |
376 |
325 |
51 |
1.A.b.9.2 Computer services |
13197 |
333 |
12865 |
14297 |
307 |
13990 |
1.A.b.9.3 Information services |
99 |
378 |
-279 |
80 |
99 |
-19 |
1.A.b.10 Other business services |
2413 |
4571 |
-2157 |
3818 |
5571 |
-1753 |
1.A.b.10.1 Research and development services |
94 |
89 |
5 |
220 |
123 |
97 |
1.A.b.10.2 Professional and management consulting services |
1273 |
2570 |
-1296 |
1883 |
3258 |
-1376 |
1.A.b.10.3 Technical, trade-related, and other business services |
1046 |
1912 |
-866 |
1715 |
2190 |
-475 |
1.A.b.11 Personal, cultural, and recreational services |
115 |
50 |
66 |
178 |
63 |
115 |
1.A.b.11.1 Audiovisual and related services |
94 |
23 |
71 |
153 |
35 |
118 |
1.A.b.11.2 Other personal, cultural, and recreational services |
21 |
26 |
-5 |
25 |
28 |
-3 |
1.A.b.12 Government goods and services n.i.e. |
124 |
134 |
-9 |
116 |
159 |
-42 |
1.A.b.13 Others n.i.e. |
219 |
2225 |
-2006 |
641 |
3714 |
-3073 |
1.B Primary Income (1.B.1 to 1.B.3) |
2,636 |
5,118 |
-2482 |
2,686 |
4,965 |
-2279 |
1.B.1 Compensation of employees |
251 |
520 |
-269 |
231 |
492 |
-261 |
1.B.2 Investment income |
2385 |
4597 |
-2212 |
2455 |
4473 |
-2018 |
1.B.2.1 Direct investment |
1479 |
4495 |
-3016 |
1378 |
4401 |
-3024 |
1.B.2.1.1 Income on equity and investment fund shares |
449 |
3,052 |
-2604 |
722 |
2,938 |
-2216 |
1.B.2.1.2 Interest |
1030 |
1442 |
-412 |
656 |
1463 |
-807 |
1.B.2.2 Portfolio investment |
– |
– |
– |
– |
– |
– |
1.B.2.3 Other investment |
– |
100 |
-100 |
– |
68 |
-68 |
1.B.2.4 Reserve assets |
906 |
3 |
903 |
1077 |
4 |
1073 |
1.B.3 Other primary income |
– |
– |
– |
– |
– |
– |
1.C Secondary Income (1.C.1+1.C.2) |
13,031 |
525 |
12506 |
13,090 |
500 |
12590 |
1.C.1 Financial corporations, nonfinancial corporations, households, and NPISHs |
13,031 |
546 |
12,485 |
13,090 |
526 |
12,564 |
1.C.1.1 Personal transfers (Current transfers between resident and/ non-resident households) |
12,554 |
441 |
12,113 |
12,646 |
412 |
12,234 |
| of which: |
|
|
|
|
|
|
1.C.1.1.1 Workers’ remittances |
6,813 |
540 |
6,273 |
6,916 |
609 |
6,308 |
1.C.1.2 Other current transfers |
477 |
105 |
372 |
444 |
115 |
330 |
2 Capital Account (2.1+2.2) |
395 |
115 |
280 |
139 |
154 |
-15 |
2.1 Gross acquisitions (DR.)/disposals (CR.) of non-produced nonfinancial assets |
11 |
2 |
9 |
12 |
12 |
– |
2.2 Capital transfers |
385 |
113 |
271 |
127 |
142 |
-15 |
2.2.1 General government |
385 |
113 |
271 |
127 |
142 |
-15 |
2.2.1.1 Debt forgiveness |
– |
– |
– |
– |
– |
– |
2.2.1.2 Other capital transfers |
385 |
113 |
271 |
127 |
142 |
-15 |
2.2.2 Financial corporations, nonfinancial corporations, households, and NPISHs |
– |
– |
– |
– |
– |
– |
Statement 1: Standard Presentation of BoP in India as per BPM6 (Contd.) |
(US$ million) |
Item |
Oct-Dec 2009 (R) |
Jan-Mar 2010 (R) |
Credit |
Debit |
Net |
Credit |
Debit |
Net |
13 |
14 |
15 |
16 |
17 |
18 |
3 Financial Account (3.1 to 3.5) |
81527 |
68931 |
12596 |
90367 |
78309 |
12058 |
3.1 Direct Investment (3.1A+3.1B) |
8922 |
6131 |
2791 |
8061 |
5281 |
2780 |
3.1.A Direct Investment in India |
8728 |
1469 |
7260 |
7737 |
1611 |
6126 |
3.1.1 Equity and investment fund shares |
8124 |
1233 |
6891 |
7520 |
1512 |
6008 |
3.1.1.1 Equity other than reinvestment of earnings |
5956 |
1233 |
4724 |
5353 |
1512 |
3841 |
3.1.1.1.1 Direct investor in direct investment enterprises |
5956 |
1233 |
4724 |
5353 |
1512 |
3841 |
3.1.1.1.2 Direct investment enterprises in direct investor (reverse investment) |
– |
– |
– |
– |
– |
– |
3.1.1.1.3 Between fellow enterprises |
– |
– |
– |
– |
– |
– |
3.1.1.2 Reinvestment of earnings |
2167 |
– |
2167 |
2167 |
– |
2167 |
3.1.2 Debt instruments |
605 |
236 |
369 |
217 |
99 |
118 |
3.1.2.1 Direct investor in direct investment enterprises |
605 |
236 |
369 |
217 |
99 |
118 |
3.1.2.2 Direct investment enterprises in direct investor (reverse investment) |
– |
– |
– |
– |
– |
– |
3.1.2.3 Between fellow enterprises |
– |
– |
– |
– |
– |
– |
3.1.B Direct Investment by India |
194 |
4663 |
-4469 |
324 |
3671 |
-3346 |
3.1.1 Equity and investment fund shares |
194 |
3911 |
-3717 |
324 |
2272 |
-1948 |
3.1.1.1 Equity other than reinvestment of earnings |
194 |
3640 |
-3446 |
324 |
2001 |
-1677 |
3.1.1.1.1 Direct investor in direct investment enterprises |
194 |
3640 |
-2181 |
324 |
2001 |
-1677 |
3.1.1.1.2 Direct investment enterprises in direct investor (reverse investment) |
– |
– |
– |
– |
– |
– |
3.1.1.1.3 Between fellow enterprises |
– |
– |
– |
– |
– |
– |
3.1.1.2 Reinvestment of earnings |
– |
271 |
-271 |
– |
271 |
-271 |
3.1.2 Debt instruments |
– |
752 |
-752 |
– |
1398 |
-1398 |
3.1.2.1 Direct investor in direct investment enterprises |
– |
752 |
-752 |
– |
1398 |
-1398 |
3.1.2.2 Direct investment enterprises in direct investor (reverse investment) |
– |
– |
– |
– |
– |
– |
3.1.2.3 Between fellow enterprises |
– |
– |
– |
– |
– |
– |
3.2 Portfolio Investment |
35306 |
30096 |
5210 |
41257 |
32637 |
8619 |
3.2A Portfolio Investment in India |
35,295 |
30,041 |
5254 |
41,023 |
32,493 |
8530 |
3.2.1 Equity and investment fund shares |
29453 |
21422 |
8031 |
31048 |
21452 |
9596 |
3.2.2 Debt securities |
5842 |
8619 |
-2777 |
9975 |
11041 |
-1066 |
3.2.B Portfolio Investment by India |
11 |
55 |
-44 |
234 |
144 |
89 |
3.3 Financial derivatives (other than reserves) and employee stock options |
– |
– |
– |
– |
– |
– |
3.4 Other investment |
37299 |
30937 |
6362 |
41049 |
38250 |
2799 |
3.4.1 Other equity (ADRs/GDRs) |
475 |
– |
475 |
146 |
– |
146 |
3.4.2 Currency and deposits |
10770 |
9636 |
1134 |
9677 |
10215 |
-539 |
3.4.2.1 Central bank (Rupee Debt Movements; NRG) |
594 |
67 |
526 |
12 |
– |
12 |
3.4.2.2 Deposit-taking corporations, except the central bank (NRI Deposits) |
10177 |
9568 |
608 |
9665 |
10215 |
-551 |
3.4.2.3 General government |
– |
– |
– |
– |
– |
– |
3.4.2.4 Other sectors |
– |
– |
– |
– |
– |
– |
3.4.3 Loans (External Assistance, ECBs and Banking Capital) |
10555 |
7211 |
3344 |
11530 |
11333 |
196 |
3.4.3A Loans to India |
10315 |
6536 |
3780 |
11220 |
10841 |
379 |
3.4.3.1 Central bank |
– |
– |
– |
– |
– |
– |
3.4.3.2 Deposit-taking corporations, except the central bank |
4401 |
3597 |
805 |
4530 |
4893 |
-363 |
3.4.3.3 General government (External Assistance) |
1633 |
697 |
936 |
1748 |
630 |
1118 |
3.4.3.4 Other sectors (External Commercial Borrowings) |
4281 |
2242 |
2039 |
4943 |
5318 |
-375 |
3.4.3B Loans by India |
240 |
676 |
-436 |
309 |
492 |
-183 |
3.4.3.1 Central bank |
– |
– |
– |
– |
– |
– |
3.4.3.2 Deposit-taking corporations, except the central bank |
– |
– |
– |
– |
– |
– |
3.4.3.3 General government |
13 |
105 |
-93 |
13 |
105 |
-93 |
3.4.3.4 Other sectors |
227 |
570 |
-343 |
297 |
387 |
-90 |
3.4.4 Insurance, pension, and standardized guarantee schemes |
– |
– |
– |
– |
– |
– |
3.4.5 Trade credit and advances |
13907 |
10754 |
3153 |
17303 |
12849 |
4454 |
3.4.5.1 Central bank |
– |
– |
– |
– |
– |
– |
3.4.5.2 General government |
– |
– |
– |
– |
– |
– |
3.4.5.3 Deposit-taking corporations |
– |
– |
– |
– |
– |
– |
3.4.5.4 Other sectors |
13907 |
10754 |
3153 |
17303 |
12849 |
4454 |
3.4.6 Other accounts receivable/payable-other |
1591 |
3336 |
-1744 |
2393 |
3852 |
-1459 |
3.4.7 Special drawing rights |
|
|
|
|
|
|
3.5 Reserve assets |
– |
1767 |
-1767 |
– |
2141 |
-2141 |
3.5.1 Monetary gold |
– |
– |
– |
– |
– |
– |
3.5.2 Special drawing rights n.a. |
– |
– |
– |
– |
– |
– |
3.5.3 Reserve position in the IMF n.a. |
– |
– |
– |
– |
– |
– |
3.5.4 Other reserve assets (Foreign Currency Assets) |
– |
1767 |
-1767 |
– |
2141 |
-2141 |
3.5.4.1 Currency,deposits and securities |
– |
1767 |
-1767 |
– |
2141 |
-2141 |
3.5.4.2 Financial derivatives |
– |
– |
– |
– |
– |
– |
3.5.4.3 Other claims |
– |
– |
– |
– |
– |
– |
3 Total assets/liabilities |
81527 |
68931 |
12596 |
90367 |
78309 |
12058 |
of which: (by instrument): |
|
|
|
|
|
|
3.0.1 Equity and investment fund shares |
37781 |
26621 |
11161 |
39127 |
25381 |
13746 |
3.0.2 Debt instruments |
41679 |
37207 |
4472 |
48701 |
46936 |
1766 |
3.0.3 Other financial assets and liabilities |
2066 |
5103 |
-3037 |
2539 |
5993 |
-3454 |
4 Net errors and omissions |
|
421 |
-421 |
591 |
|
591 |
Statement 1: Standard Presentation of BoP in India as per BPM6 (Contd.) |
(US$ million) |
Item |
Apr-Jun 2010 (PR) |
Jul-Sept 2010 (PR) |
Credit |
Debit |
Net |
Credit |
Debit |
Net |
19 |
20 |
21 |
22 |
23 |
24 |
1 Current Account (1.A+1.B+1.C) |
98221 |
110834 |
-12614 |
98598 |
115501 |
-16903 |
1.A Goods and Services (1.A.a+1.A.b) |
81670 |
103939 |
-22269 |
83112 |
108205 |
-25093 |
1.A.a Goods (1.A.a.1 to 1.A.a.3) |
55200 |
87209 |
-32008 |
52044 |
89005 |
-36960 |
1.A.a.1 General merchandise on a BOP basis |
55301 |
80806 |
-25504 |
52029 |
81061 |
-29031 |
1.A.a.1.1 Re-exports |
– |
– |
– |
– |
– |
– |
1.A.a.2 Net exports of goods under merchanting |
-101 |
|
-101 |
15 |
|
15 |
1.A.a.2.1 Goods acquired under merchanting (negative credits) |
– |
– |
– |
– |
– |
– |
1.A.a.2.2 Goods sold under merchanting |
– |
– |
– |
– |
– |
– |
1.A.a.3 Non-monetary gold |
|
6403 |
-6403 |
|
7944 |
-7944 |
1.A.b Services (1.A.b.1 to 1.A.b.13) |
26469 |
16730 |
9739 |
31067 |
19200 |
11867 |
1.A.b.1 Manufacturing services on physical inputs owned by others |
– |
– |
– |
– |
– |
– |
1.A.b.1.1 Goods for processing in reporting economy |
– |
– |
– |
– |
– |
– |
1.A.b.1.2 Goods for processing abroad |
– |
– |
– |
– |
– |
– |
1.A.b.2 Maintenance and repair services n.i.e. |
– |
– |
– |
– |
– |
– |
1.A.b.3 Transport |
3144 |
3146 |
-2 |
3296 |
3555 |
-259 |
1.A.b.3.1 Sea transport |
1378 |
1797 |
-419 |
1636 |
2055 |
-419 |
1.A.b.3.2 Air transport |
589 |
1133 |
-544 |
540 |
1164 |
-625 |
1.A.b.3.3 Other modes of transport |
1176 |
204 |
972 |
1094 |
304 |
790 |
1.A.b.3.4 Postal and courier services |
1 |
12 |
-11 |
26 |
31 |
-5 |
1.A.b.4 Travel |
2,949 |
2,307 |
642 |
3,379 |
2,747 |
632 |
1.A.b.4.1 Business |
– |
856 |
-856 |
– |
1006 |
-1006 |
1.A.b.4.2 Personal |
– |
1451 |
-1451 |
– |
1740 |
-1740 |
1.A.b.4.2.1 Health-related |
– |
41 |
-41 |
– |
6 |
-6 |
1.A.b.4.2.2 Education-related |
– |
325 |
-325 |
– |
664 |
-664 |
1.A.b.4.2.3 Other |
– |
1086 |
-1086 |
– |
1070 |
-1070 |
1.A.b.5 Construction |
122 |
345 |
-223 |
173 |
136 |
37 |
1.A.b.5.1 Construction abroad |
122 |
200 |
-78 |
173 |
77 |
97 |
1.A.b.5.2 Construction in the reporting economy |
– |
146 |
-146 |
– |
59 |
-59 |
1.A.b.6 Insurance and pension services |
410 |
310 |
100 |
441 |
386 |
55 |
1.A.b.6.1 Direct insurance |
374 |
143 |
231 |
404 |
178 |
227 |
1.A.b.6.2 Reinsurance |
29 |
147 |
-118 |
29 |
192 |
-164 |
1.A.b.6.3 Auxiliary insurance services |
7 |
20 |
-13 |
8 |
16 |
-8 |
1.A.b.6.4 Pension and standardized guarantee services |
– |
– |
– |
– |
– |
– |
1.A.b.7 Financial services |
1228 |
1404 |
-176 |
1819 |
1905 |
-87 |
1.A.b.7.1 Explicitly charged and other fi nancial services |
1228 |
1404 |
-176 |
1819 |
1905 |
-87 |
1.A.b.7.2 Financial intermediation services indirectly measured |
– |
– |
– |
– |
– |
– |
1.A.b.8 Charges for the use of intellectual property n.i.e. |
35 |
566 |
-531 |
27 |
560 |
-533 |
1.A.b.9 Telecommunications, computer, and information services |
12733 |
880 |
11854 |
12954 |
888 |
12066 |
1.A.b.9.1 Telecommunications services |
324 |
230 |
94 |
392 |
235 |
157 |
1.A.b.9.2 Computer services |
12327 |
575 |
11752 |
12455 |
585 |
11869 |
1.A.b.9.3 Information services |
83 |
75 |
7 |
108 |
68 |
39 |
1.A.b.10 Other business services |
4636 |
5609 |
-972 |
5584 |
6623 |
-1039 |
1.A.b.10.1 Research and development services |
170 |
66 |
104 |
286 |
51 |
235 |
1.A.b.10.2 Professional and management consulting services |
1914 |
2389 |
-475 |
2596 |
2995 |
-399 |
1.A.b.10.3 Technical, trade-related, and other business services |
2553 |
3154 |
-601 |
2702 |
3577 |
-875 |
1.A.b.11 Personal, cultural, and recreational services |
49 |
71 |
-21 |
56 |
105 |
-49 |
1.A.b.11.1 Audiovisual and related services |
22 |
36 |
-15 |
27 |
47 |
-20 |
1.A.b.11.2 Other personal, cultural, and recreational services |
28 |
35 |
-7 |
29 |
58 |
-29 |
1.A.b.12 Government goods and services n.i.e. |
94 |
143 |
-49 |
125 |
205 |
-80 |
1.A.b.13 Others n.i.e. |
1068 |
1950 |
-882 |
3214 |
2089 |
1125 |
1.B Primary Income (1.B.1 to 1.B.3) |
2,855 |
6,310 |
-3455 |
1,973 |
6,756 |
-4783 |
1.B.1 Compensation of employees |
227 |
482 |
-255 |
247 |
434 |
-188 |
1.B.2 Investment income |
2628 |
5828 |
-3199 |
1726 |
6322 |
-4596 |
1.B.2.1 Direct investment |
1685 |
5747 |
-4062 |
511 |
6186 |
-5674 |
1.B.2.1.1 Income on equity and investment fund shares |
351 |
4,064 |
-3713 |
393 |
4,508 |
-4115 |
1.B.2.1.2 Interest |
1335 |
1683 |
-349 |
119 |
1678 |
-1559 |
1.B.2.2 Portfolio investment |
– |
– |
– |
– |
– |
– |
1.B.2.3 Other investment |
– |
77 |
-77 |
– |
133 |
-133 |
1.B.2.4 Reserve assets |
943 |
4 |
939 |
1215 |
4 |
1211 |
1.B.3 Other primary income |
– |
– |
– |
– |
– |
– |
1.C Secondary Income (1.C.1+1.C.2) |
13,695 |
585 |
13110 |
13,513 |
540 |
12973 |
1.C.1 Financial corporations, nonfinancial corporations, households, and NPISHs |
13,695 |
585 |
13,110 |
13,513 |
540 |
12,973 |
1.C.1.1 Personal transfers (Current transfers between resident and/ non-resident households) |
13,219 |
486 |
12,733 |
13,051 |
443 |
12,608 |
| of which: |
|
|
|
|
|
|
1.C.1.1.1 Workers’ remittances |
6,900 |
486 |
6,414 |
5,999 |
443 |
5,556 |
1.C.1.2 Other current transfers |
476 |
100 |
377 |
462 |
97 |
365 |
2 Capital Account (2.1+2.2) |
69 |
144 |
-75 |
142 |
139 |
3 |
2.1 Gross acquisitions (DR.)/disposals (CR.) of non-produced nonfinancial assets |
11 |
3 |
8 |
1 |
2 |
-1 |
2.2 Capital transfers |
59 |
141 |
-83 |
141 |
137 |
4 |
2.2.1 General government |
59 |
141 |
-83 |
141 |
137 |
4 |
2.2.1.1 Debt forgiveness |
– |
– |
– |
– |
– |
– |
2.2.1.2 Other capital transfers |
59 |
141 |
-83 |
141 |
137 |
4 |
2.2.2 Financial corporations, nonfinancial corporations, households, and NPISHs |
– |
– |
– |
– |
– |
– |
Statement 1: Standard Presentation of BoP in India as per BPM6 (Contd.) |
(US$ million) |
Item |
Apr-Jun 2010 (PR) |
Jul-Sept 2010 (PR) |
Credit |
Debit |
Net |
Credit |
Debit |
Net |
19 |
20 |
21 |
22 |
23 |
24 |
3 Financial Account (3.1 to 3.5) |
95087 |
81489 |
13598 |
112390 |
94075 |
18314 |
3.1 Direct Investment (3.1A+3.1B) |
9344 |
5870 |
3474 |
9162 |
5596 |
3565 |
3.1.A Direct Investment in India |
9050 |
2302 |
6748 |
8584 |
1097 |
7487 |
3.1.1 Equity and investment fund shares |
8975 |
2278 |
6698 |
8436 |
1034 |
7402 |
3.1.1.1 Equity other than reinvestment of earnings |
5991 |
2278 |
3713 |
5452 |
1034 |
4418 |
3.1.1.1.1 Direct investor in direct investment enterprises |
5991 |
2278 |
3713 |
5452 |
1034 |
4418 |
3.1.1.1.2 Direct investment enterprises in direct investor (reverse investment) |
– |
– |
– |
– |
– |
– |
3.1.1.1.3 Between fellow enterprises |
– |
– |
– |
– |
– |
– |
3.1.1.2 Reinvestment of earnings |
2985 |
– |
2985 |
2985 |
– |
2985 |
3.1.2 Debt instruments |
75 |
24 |
50 |
148 |
63 |
85 |
3.1.2.1 Direct investor in direct investment enterprises |
75 |
24 |
50 |
148 |
63 |
85 |
3.1.2.2 Direct investment enterprises in direct investor (reverse investment) |
– |
– |
– |
– |
– |
– |
3.1.2.3 Between fellow enterprises |
– |
– |
– |
– |
– |
– |
3.1.B Direct Investment by India |
294 |
3568 |
-3274 |
578 |
4499 |
-3922 |
3.1.1 Equity and investment fund shares |
294 |
2409 |
-2115 |
578 |
2820 |
-2242 |
3.1.1.1 Equity other than reinvestment of earnings |
294 |
2138 |
-1844 |
578 |
2549 |
-1971 |
3.1.1.1.1 Direct investor in direct investment enterprises |
294 |
2138 |
-1844 |
578 |
2549 |
-1971 |
3.1.1.1.2 Direct investment enterprises in direct investor (reverse investment) |
– |
– |
– |
– |
– |
– |
3.1.1.1.3 Between fellow enterprises |
– |
– |
– |
– |
– |
– |
3.1.1.2 Reinvestment of earnings |
– |
271 |
-271 |
– |
271 |
-271 |
3.1.2 Debt instruments |
– |
1159 |
-1159 |
– |
1679 |
-1679 |
3.1.2.1 Direct investor in direct investment enterprises |
– |
1159 |
-1159 |
– |
1679 |
-1679 |
3.1.2.2 Direct investment enterprises in direct investor (reverse investment) |
– |
– |
– |
– |
– |
– |
3.1.2.3 Between fellow enterprises |
– |
– |
– |
– |
– |
– |
3.2 Portfolio Investment |
42952 |
39461 |
3491 |
58764 |
40065 |
18699 |
3.2A Portfolio Investment in India |
42,858 |
39,320 |
3538 |
58,614 |
39,854 |
18759 |
3.2.1 Equity and investment fund shares |
32352 |
30110 |
2242 |
36346 |
26919 |
9427 |
3.2.2 Debt securities |
10506 |
9209 |
1296 |
22268 |
12935 |
9333 |
3.2.B Portfolio Investment by India |
94 |
141 |
-47 |
151 |
211 |
-60 |
3.3 Financial derivatives (other than reserves) and employee stock options |
– |
– |
– |
– |
– |
– |
3.4 Other investment |
42791 |
32417 |
10374 |
44463 |
45124 |
-661 |
3.4.1 Other equity (ADRs/GDRs) |
1114 |
– |
1114 |
492 |
– |
492 |
3.4.2 Currency and deposits |
11255 |
10157 |
1097 |
11672 |
11232 |
440 |
3.4.2.1 Central bank (Rupee Debt Movements; NRG) |
2 |
24 |
-22 |
– |
604 |
-604 |
3.4.2.2 Deposit-taking corporations, except the central bank (NRI Deposits) |
11252 |
10133 |
1119 |
11672 |
10628 |
1044 |
3.4.2.3 General government |
– |
– |
– |
– |
– |
– |
3.4.2.4 Other sectors |
– |
– |
– |
– |
– |
– |
3.4.3 Loans (External Assistance, ECBs and Banking Capital) |
13130 |
5544 |
7587 |
12544 |
12119 |
426 |
3.4.3A Loans to India |
12926 |
5275 |
7651 |
12228 |
11537 |
691 |
3.4.3.1 Central bank |
– |
– |
– |
– |
– |
– |
3.4.3.2 Deposit-taking corporations, except the central bank |
5491 |
2586 |
2905 |
5320 |
8923 |
-3603 |
3.4.3.3 General government (External Assistance) |
3191 |
733 |
2458 |
1253 |
662 |
590 |
3.4.3.4 Other sectors (External Commercial Borrowings) |
4244 |
1957 |
2287 |
5656 |
1952 |
3703 |
3.4.3B Loans by India |
204 |
268 |
-64 |
316 |
581 |
-265 |
3.4.3.1 Central bank |
– |
– |
– |
– |
– |
– |
3.4.3.2 Deposit-taking corporations, except the central bank |
– |
– |
– |
– |
– |
– |
3.4.3.3 General government |
19 |
25 |
-6 |
19 |
25 |
-6 |
3.4.3.4 Other sectors |
185 |
243 |
-58 |
297 |
556 |
-259 |
3.4.4 Insurance, pension, and standardized guarantee schemes |
– |
– |
– |
– |
– |
– |
3.4.5 Trade credit and advances |
15825 |
11506 |
4319 |
19420 |
16801 |
2618 |
3.4.5.1 Central bank |
– |
– |
– |
– |
– |
– |
3.4.5.2 General government |
– |
– |
– |
– |
– |
– |
3.4.5.3 Deposit-taking corporations |
– |
– |
– |
– |
– |
– |
3.4.5.4 Other sectors |
15825 |
11506 |
4319 |
19420 |
16801 |
2618 |
3.4.6 Other accounts receivable/payable-other |
1467 |
5210 |
-3743 |
335 |
4972 |
-4637 |
3.4.7 Special drawing rights |
|
|
– |
|
|
– |
3.5 Reserve assets |
– |
3741 |
-3741 |
– |
3289 |
-3289 |
3.5.1 Monetary gold |
– |
– |
– |
– |
– |
– |
3.5.2 Special drawing rights n.a. |
– |
– |
– |
– |
– |
– |
3.5.3 Reserve position in the IMF n.a. |
– |
– |
– |
– |
– |
– |
3.5.4 Other reserve assets (Foreign Currency Assets) |
– |
3741 |
-3741 |
– |
3289 |
-3289 |
3.5.4.1 Currency, deposits and securities |
– |
3741 |
-3741 |
– |
3289 |
-3289 |
3.5.4.2 Financial derivatives |
– |
– |
– |
– |
– |
– |
3.5.4.3 Other claims |
– |
– |
– |
– |
– |
– |
3 Total assets/liabilities |
95087 |
81489 |
13598 |
112390 |
94075 |
18314 |
of which: (by instrument): |
|
|
|
|
|
|
3.0.1 Equity and investment fund shares |
41716 |
34938 |
6777 |
45511 |
30984 |
14526 |
3.0.2 Debt instruments |
50790 |
37600 |
13190 |
66051 |
54829 |
11222 |
3.0.3 Other financial assets and liabilities |
2581 |
8951 |
-6370 |
827 |
8262 |
-7434 |
4 Net errors and omissions |
|
909 |
-909 |
|
1414 |
-1414 |
Statement 1: Standard Presentation of BoP in India as per BPM6 (Contd.) |
(US$ million) |
Item |
Oct-Dec 2010 (PR) |
Jan-Mar 2011 (PR) |
Credit |
Debit |
Net |
Credit |
Debit |
Net |
25 |
26 |
27 |
28 |
29 |
30 |
1 Current Account (1.A+1.B+1.C) |
120994 |
131112 |
-10119 |
129188 |
135511 |
-6322 |
1.A Goods and Services (1.A.a+1.A.b) |
104816 |
123770 |
-18954 |
112682 |
128141 |
-15459 |
1.A.a Goods (1.A.a.1 to 1.A.a.3) |
65987 |
97421 |
-31434 |
77395 |
107427 |
-30032 |
1.A.a.1 General merchandise on a BOP basis |
65898 |
89520 |
-23621 |
77240 |
95720 |
-18481 |
1.A.a.1.1 Re-exports |
– |
– |
– |
– |
– |
– |
1.A.a.2 Net exports of goods under merchanting |
89 |
|
89 |
156 |
|
156 |
1.A.a.2.1 Goods acquired under merchanting (negative credits) |
– |
– |
– |
– |
– |
– |
1.A.a.2.2 Goods sold under merchanting |
– |
– |
– |
– |
– |
– |
1.A.a.3 Non-monetary gold |
|
7901 |
-7901 |
|
11707 |
-11707 |
1.A.b Services (1.A.b.1 to 1.A.b.13) |
38829 |
26349 |
12480 |
35287 |
20714 |
14573 |
1.A.b.1 Manufacturing services on physical inputs owned by others |
– |
– |
– |
– |
– |
– |
1.A.b.1.1 Goods for processing in reporting economy |
– |
– |
– |
– |
– |
– |
1.A.b.1.2 Goods for processing abroad |
– |
– |
– |
– |
– |
– |
1.A.b.2 Maintenance and repair services n.i.e. |
– |
– |
– |
– |
– |
– |
1.A.b.3 Transport |
3717 |
3992 |
-275 |
4166 |
3254 |
912 |
1.A.b.3.1 Sea transport |
1607 |
2268 |
-661 |
1545 |
1995 |
-450 |
1.A.b.3.2 Air transport |
579 |
1431 |
-852 |
755 |
1051 |
-296 |
1.A.b.3.3 Other modes of transport |
1527 |
285 |
1242 |
1844 |
192 |
1652 |
1.A.b.3.4 Postal and courier services |
4 |
8 |
-4 |
21 |
16 |
5 |
1.A.b.4 Travel |
4,429 |
2,857 |
1572 |
4,518 |
3,198 |
1321 |
1.A.b.4.1 Business |
– |
1251 |
-1251 |
– |
1866 |
-1866 |
1.A.b.4.2 Personal |
– |
1606 |
-1606 |
– |
1331 |
-1331 |
1.A.b.4.2.1 Health-related |
– |
7 |
-7 |
– |
5 |
-5 |
1.A.b.4.2.2 Education-related |
– |
435 |
-435 |
– |
468 |
-468 |
1.A.b.4.2.3 Other |
– |
1164 |
-1164 |
– |
858 |
-858 |
1.A.b.5 Construction |
128 |
220 |
-91 |
253 |
456 |
-203 |
1.A.b.5.1 Construction abroad |
128 |
117 |
11 |
253 |
239 |
14 |
1.A.b.5.2 Construction in the reporting economy |
– |
102 |
-102 |
– |
216 |
-216 |
1.A.b.6 Insurance and pension services |
507 |
403 |
104 |
590 |
301 |
289 |
1.A.b.6.1 Direct insurance |
463 |
131 |
332 |
548 |
133 |
415 |
1.A.b.6.2 Reinsurance |
37 |
255 |
-218 |
31 |
155 |
-124 |
1.A.b.6.3 Auxiliary insurance services |
7 |
16 |
-10 |
11 |
13 |
-3 |
1.A.b.6.4 Pension and standardized guarantee services |
– |
– |
– |
– |
– |
– |
1.A.b.7 Financial services |
1684 |
1961 |
-276 |
1777 |
2213 |
-436 |
1.A.b.7.1 Explicitly charged and other financial services |
1684 |
1961 |
-276 |
1777 |
2213 |
-436 |
1.A.b.7.2 Financial intermediation services indirectly measured |
– |
– |
– |
– |
– |
– |
1.A.b.8 Charges for the use of intellectual property n.i.e. |
25 |
696 |
-671 |
106 |
602 |
-495 |
1.A.b.9 Telecommunications, computer, and information services |
15485 |
1118 |
14368 |
16404 |
862 |
15542 |
1.A.b.9.1 Telecommunications services |
421 |
296 |
125 |
376 |
325 |
51 |
1.A.b.9.2 Computer services |
14743 |
709 |
14034 |
15936 |
326 |
15610 |
1.A.b.9.3 Information services |
322 |
113 |
209 |
93 |
211 |
-118 |
1.A.b.10 Other business services |
6754 |
7743 |
-989 |
5848 |
6721 |
-873 |
1.A.b.10.1 Research and development services |
224 |
79 |
145 |
198 |
53 |
145 |
1.A.b.10.2 Professional and management consulting services |
3131 |
3408 |
-277 |
2985 |
3199 |
-214 |
1.A.b.10.3 Technical, trade-related, and other business services |
3399 |
4257 |
-857 |
2665 |
3469 |
-804 |
1.A.b.11 Personal, cultural, and recreational services |
52 |
228 |
-176 |
70 |
139 |
-69 |
1.A.b.11.1 Audiovisual and related services |
30 |
39 |
-9 |
38 |
25 |
14 |
1.A.b.11.2 Other personal, cultural, and recreational services |
22 |
190 |
-168 |
31 |
114 |
-83 |
1.A.b.12 Government goods and services n.i.e. |
150 |
195 |
-45 |
162 |
277 |
-115 |
1.A.b.13 Others n.i.e. |
5897 |
6936 |
-1039 |
1392 |
2692 |
-1300 |
1.B Primary Income (1.B.1 to 1.B.3) |
2,096 |
6,698 |
-4601 |
2,177 |
6,646 |
-4469 |
1.B.1 Compensation of employees |
286 |
564 |
-279 |
357 |
547 |
-190 |
1.B.2 Investment income |
1811 |
6133 |
-4323 |
1820 |
6099 |
-4279 |
1.B.2.1 Direct investment |
898 |
6060 |
-5162 |
729 |
6019 |
-5289 |
1.B.2.1.1 Income on equity and investment fund shares |
723 |
4,351 |
-3627 |
583 |
3,918 |
-3336 |
1.B.2.1.2 Interest |
174 |
1709 |
-1535 |
147 |
2101 |
-1954 |
1.B.2.2 Portfolio investment |
– |
– |
– |
– |
– |
– |
1.B.2.3 Other investment |
– |
68 |
-68 |
– |
75 |
-75 |
1.B.2.4 Reserve assets |
913 |
5 |
908 |
1091 |
6 |
1085 |
1.B.3 Other primary income |
– |
– |
– |
– |
– |
– |
1.C Secondary Income (1.C.1+1.C.2) |
14,081 |
645 |
13436 |
14,329 |
723 |
13606 |
1.C.1 Financial corporations, nonfinancial corporations, households, and NPISHs |
14,081 |
645 |
13,436 |
14,329 |
723 |
13,606 |
1.C.1.1 Personal transfers (Current transfers between resident and/ non-resident households) |
13,573 |
540 |
13,033 |
13,716 |
609 |
13,107 |
| of which: |
|
|
|
|
|
|
1.C.1.1.1 Workers’ remittances |
7,227 |
540 |
6,687 |
7,282 |
609 |
6,673 |
1.C.1.2 Other current transfers |
508 |
105 |
403 |
613 |
115 |
499 |
2 Capital Account (2.1+2.2) |
343 |
206 |
137 |
131 |
155 |
-24 |
2.1 Gross acquisitions (DR.)/disposals (CR.) of non-produced nonfinancial assets |
3 |
7 |
-5 |
24 |
2 |
22 |
2.2 Capital transfers |
341 |
199 |
141 |
107 |
154 |
-47 |
2.2.1 General government |
341 |
199 |
141 |
107 |
154 |
-47 |
2.2.1.1 Debt forgiveness |
– |
– |
– |
– |
– |
– |
2.2.1.2 Other capital transfers |
341 |
199 |
141 |
107 |
154 |
-47 |
2.2.2 Financial corporations, nonfinancial corporations, households, and NPISHs |
– |
– |
– |
– |
– |
– |
Statement 1: Standard Presentation of BoP in India as per BPM6 (Contd.) |
(US$ million) |
Item |
Oct-Dec 2010 (PR) |
Jan-Mar 2011 (PR) |
Credit |
Debit |
Net |
Credit |
Debit |
Net |
25 |
26 |
27 |
28 |
29 |
30 |
3 Financial Account (3.1 to 3.5) |
174365 |
164501 |
9864 |
117475 |
110338 |
7137 |
3.1 Direct Investment (3.1A+3.1B) |
9424 |
8231 |
1193 |
7534 |
6407 |
1127 |
3.1.A Direct Investment in India |
8340 |
2200 |
6141 |
6928 |
1419 |
5508 |
3.1.1 Equity and investment fund shares |
8237 |
1861 |
6377 |
6594 |
1341 |
5253 |
3.1.1.1 Equity other than reinvestment of earnings |
5253 |
1861 |
3392 |
3610 |
1341 |
2269 |
3.1.1.1.1 Direct investor in direct investment enterprises |
5253 |
1861 |
3392 |
3610 |
1341 |
2269 |
3.1.1.1.2 Direct investment enterprises in direct investor (reverse investment) |
– |
– |
– |
– |
– |
– |
3.1.1.1.3 Between fellow enterprises |
– |
– |
– |
– |
– |
– |
3.1.1.2 Reinvestment of earnings |
2985 |
– |
2985 |
2985 |
– |
2985 |
3.1.2 Debt instruments |
103 |
339 |
-236 |
333 |
78 |
255 |
3.1.2.1 Direct investor in direct investment enterprises |
103 |
339 |
-236 |
333 |
78 |
255 |
3.1.2.2 Direct investment enterprises in direct investor (reverse investment) |
– |
– |
– |
– |
– |
– |
3.1.2.3 Between fellow enterprises |
– |
– |
– |
– |
– |
– |
3.1.B Direct Investment by India |
1084 |
6031 |
-4948 |
606 |
4987 |
-4381 |
3.1.1 Equity and investment fund shares |
1084 |
3608 |
-2524 |
606 |
2784 |
-2178 |
3.1.1.1 Equity other than reinvestment of earnings |
1084 |
3337 |
-2253 |
606 |
2513 |
-1907 |
3.1.1.1.1 Direct investor in direct investment enterprises |
1084 |
3337 |
-2253 |
606 |
2513 |
-1907 |
3.1.1.1.2 Direct investment enterprises in direct investor (reverse investment) |
– |
– |
– |
– |
– |
– |
3.1.1.1.3 Between fellow enterprises |
– |
– |
– |
– |
– |
– |
3.1.1.2 Reinvestment of earnings |
– |
271 |
-271 |
– |
271 |
-271 |
3.1.2 Debt instruments |
– |
2423 |
-2423 |
– |
2203 |
-2203 |
3.1.2.1 Direct investor in direct investment enterprises |
– |
2423 |
-2423 |
– |
2203 |
-2203 |
3.1.2.2 Direct investment enterprises in direct investor (reverse investment) |
– |
– |
– |
– |
– |
– |
3.1.2.3 Between fellow enterprises |
– |
– |
– |
– |
– |
– |
3.2 Portfolio Investment |
101562 |
95496 |
6066 |
48624 |
48637 |
-13 |
3.2A Portfolio Investment in India |
101423 |
94265 |
7158 |
48231 |
48265 |
-34 |
3.2.1 Equity and investment fund shares |
84647 |
75469 |
9177 |
34492 |
36411 |
-1919 |
3.2.2 Debt securities |
16776 |
18795 |
-2019 |
13739 |
11854 |
1885 |
3.2.B Portfolio Investment by India |
139 |
1232 |
-1092 |
393 |
372 |
21 |
3.3 Financial derivatives (other than reserves) and employee stock options |
– |
– |
– |
– |
– |
– |
3.4 Other investment |
63379 |
56785 |
6594 |
61317 |
53263 |
8054 |
3.4.1 Other equity (ADRs/GDRs) |
233 |
– |
233 |
210 |
– |
210 |
3.4.2 Currency and deposits |
12652 |
12380 |
272 |
15375 |
13417 |
1958 |
3.4.2.1 Central bank (Rupee Debt Movements; NRG) |
87 |
– |
87 |
1613 |
545 |
1068 |
3.4.2.2 Deposit-taking corporations, except the central bank (NRI Deposits) |
12566 |
12380 |
185 |
13763 |
12873 |
890 |
3.4.2.3 General government |
– |
– |
– |
– |
– |
– |
3.4.2.4 Other sectors |
– |
– |
– |
– |
– |
– |
3.4.3 Loans (External Assistance, ECBs and Banking Capital) |
28733 |
19073 |
9659 |
18956 |
17987 |
970 |
3.4.3A Loans to India |
28144 |
18825 |
9319 |
18149 |
17470 |
679 |
3.4.3.1 Central bank |
– |
– |
– |
– |
– |
– |
3.4.3.2 Deposit-taking corporations, except the central bank |
20451 |
15822 |
4629 |
10108 |
12844 |
-2737 |
3.4.3.3 General government (External Assistance) |
1916 |
755 |
1160 |
1446 |
689 |
757 |
3.4.3.4 Other sectors (External Commercial Borrowings) |
5778 |
2248 |
3530 |
6595 |
3937 |
2659 |
3.4.3B Loans by India |
589 |
248 |
341 |
807 |
517 |
290 |
3.4.3.1 Central bank |
– |
– |
– |
– |
– |
– |
3.4.3.2 Deposit-taking corporations, except the central bank |
– |
– |
– |
– |
– |
– |
3.4.3.3 General government |
19 |
25 |
-6 |
19 |
25 |
-6 |
3.4.3.4 Other sectors |
570 |
222 |
347 |
788 |
491 |
297 |
3.4.4 Insurance, pension, and standardized guarantee schemes |
– |
– |
– |
– |
– |
– |
3.4.5 Trade credit and advances |
18337 |
16992 |
1345 |
22150 |
19442 |
2708 |
3.4.5.1 Central bank |
– |
– |
– |
– |
– |
– |
3.4.5.2 General government |
– |
– |
– |
– |
– |
– |
3.4.5.3 Deposit-taking corporations |
– |
– |
– |
– |
– |
– |
3.4.5.4 Other sectors |
18337 |
16992 |
1345 |
22150 |
19442 |
2708 |
3.4.6 Other accounts receivable/payable-other |
3424 |
8340 |
-4915 |
4625 |
2417 |
2208 |
3.4.7 Special drawing rights |
|
|
|
|
|
|
3.5 Reserve assets |
– |
3989 |
-3989 |
– |
2031 |
-2031 |
3.5.1 Monetary gold |
– |
– |
– |
– |
– |
– |
3.5.2 Special drawing rights n.a. |
– |
– |
– |
– |
– |
– |
3.5.3 Reserve position in the IMF n.a. |
– |
– |
– |
– |
– |
– |
3.5.4 Other reserve assets (Foreign Currency Assets) |
– |
3989 |
-3989 |
– |
2031 |
-2031 |
3.5.4.1 Currency,deposits and securities |
– |
3989 |
-3989 |
– |
2031 |
-2031 |
3.5.4.2 Financial derivatives |
– |
– |
– |
– |
– |
– |
3.5.4.3 Other claims |
– |
– |
– |
– |
– |
– |
3 Total assets/liabilities |
174365 |
164501 |
9864 |
117475 |
110338 |
7137 |
of which: (by instrument): |
|
|
|
|
|
|
3.0.1 Equity and investment fund shares |
94107 |
82169 |
11938 |
42086 |
40908 |
1178 |
3.0.2 Debt instruments |
76601 |
70003 |
6598 |
70554 |
64981 |
5573 |
3.0.3 Other financial assets and liabilities |
3657 |
12329 |
-8671 |
4835 |
4448 |
387 |
4 Net errors and omissions |
118 |
|
118 |
|
791 |
-791 |
Statement 1: Standard Presentation of BoP in India as per BPM6 (Contd.) |
(US$ million) |
Item |
Apr-Jun 2011 (PR) |
Jul-Sept 2011 (PR) |
Credit |
Debit |
Net |
Credit |
Debit |
Net |
31 |
32 |
33 |
34 |
35 |
36 |
1 Current Account (1.A+1.B+1.C) |
125302 |
141004 |
-15702 |
128127 |
146519 |
-18392 |
1.A Goods and Services (1.A.a+1.A.b) |
107318 |
133519 |
-26201 |
108799 |
138171 |
-29372 |
1.A.a Goods (1.A.a.1 to 1.A.a.3) |
74360 |
115638 |
-41279 |
76446 |
119810 |
-43364 |
1.A.a.1 General merchandise on a BOP basis |
74238 |
99535 |
-25297 |
76429 |
107156 |
-30727 |
1.A.a.1.1 Re-exports |
– |
– |
– |
– |
– |
– |
1.A.a.2 Net exports of goods under merchanting |
122 |
|
122 |
17 |
|
17 |
1.A.a.2.1 Goods acquired under merchanting (negative credits) |
– |
– |
– |
– |
– |
– |
1.A.a.2.2 Goods sold under merchanting |
– |
– |
– |
– |
– |
– |
1.A.a.3 Non-monetary gold |
|
16103 |
-16103 |
|
12654 |
-12654 |
1.A.b Services (1.A.b.1 to 1.A.b.13) |
32959 |
17881 |
15078 |
32353 |
18361 |
13993 |
1.A.b.1 Manufacturing services on physical inputs owned by others |
– |
– |
– |
– |
– |
– |
1.A.b.1.1 Goods for processing in reporting economy |
– |
– |
– |
– |
– |
– |
1.A.b.1.2 Goods for processing abroad |
– |
– |
– |
– |
– |
– |
1.A.b.2 Maintenance and repair services n.i.e. |
– |
– |
– |
– |
– |
– |
1.A.b.3 Transport |
4332 |
4019 |
314 |
4427 |
3651 |
776 |
1.A.b.3.1 Sea transport |
1862 |
2570 |
-708 |
1629 |
2277 |
-648 |
1.A.b.3.2 Air transport |
685 |
1194 |
-509 |
873 |
1029 |
-156 |
1.A.b.3.3 Other modes of transport |
1782 |
238 |
1544 |
1922 |
318 |
1604 |
1.A.b.3.4 Postal and courier services |
4 |
16 |
-13 |
4 |
27 |
-24 |
1.A.b.4 Travel |
3697 |
3461 |
237 |
4235 |
3534 |
701 |
1.A.b.4.1 Business |
– |
1847 |
-1847 |
– |
1649 |
-1649 |
1.A.b.4.2 Personal |
– |
1613 |
-1613 |
– |
1885 |
-1885 |
1.A.b.4.2.1 Health-related |
– |
10 |
-10 |
– |
11 |
-11 |
1.A.b.4.2.2 Education-related |
– |
330 |
-330 |
– |
631 |
-631 |
1.A.b.4.2.3 Other |
– |
1273 |
-1273 |
– |
1242 |
-1242 |
1.A.b.5 Construction |
253 |
207 |
46 |
128 |
315 |
-187 |
1.A.b.5.1 Construction abroad |
253 |
120 |
133 |
128 |
173 |
-45 |
1.A.b.5.2 Construction in the reporting economy |
– |
87 |
-87 |
– |
142 |
-142 |
1.A.b.6 Insurance and pension services |
566 |
298 |
268 |
619 |
423 |
196 |
1.A.b.6.1 Direct insurance |
530 |
84 |
446 |
571 |
162 |
409 |
1.A.b.6.2 Reinsurance |
28 |
196 |
-168 |
30 |
226 |
-196 |
1.A.b.6.3 Auxiliary insurance services |
7 |
18 |
-11 |
18 |
34 |
-17 |
1.A.b.6.4 Pension and standardized guarantee services |
– |
– |
– |
– |
– |
– |
1.A.b.7 Financial services |
1267 |
1764 |
-497 |
1577 |
2130 |
-553 |
1.A.b.7.1 Explicitly charged and other financial services |
1267 |
1764 |
-497 |
1577 |
2130 |
-553 |
1.A.b.7.2 Financial intermediation services indirectly measured |
– |
– |
– |
– |
– |
– |
1.A.b.8 Charges for the use of intellectual property n.i.e. |
40 |
606 |
-566 |
78 |
693 |
-615 |
1.A.b.9 Telecommunications, computer, and information services |
15336 |
895 |
14442 |
14417 |
676 |
13741 |
1.A.b.9.1 Telecommunications services |
356 |
399 |
-42 |
455 |
282 |
173 |
1.A.b.9.2 Computer services |
14950 |
302 |
14647 |
13940 |
307 |
13633 |
1.A.b.9.3 Information services |
30 |
194 |
-164 |
21 |
87 |
-65 |
1.A.b.10 Other business services |
5023 |
6008 |
-985 |
5092 |
6020 |
-929 |
1.A.b.10.1 Research and development services |
159 |
48 |
111 |
187 |
26 |
161 |
1.A.b.10.2 Professional and management consulting services |
2424 |
2572 |
-148 |
2316 |
2758 |
-443 |
1.A.b.10.3 Technical, trade-related, and other business services |
2440 |
3388 |
-948 |
2589 |
3236 |
-647 |
1.A.b.11 Personal, cultural, and recreational services |
87 |
80 |
7 |
121 |
79 |
42 |
1.A.b.11.1 Audiovisual and related services |
33 |
27 |
7 |
27 |
22 |
5 |
1.A.b.11.2 Other personal, cultural, and recreational services |
53 |
53 |
1 |
93 |
56 |
37 |
1.A.b.12 Government goods and services n.i.e. |
139 |
201 |
-63 |
147 |
179 |
-32 |
1.A.b.13 Others n.i.e. |
2219 |
343 |
1876 |
1513 |
660 |
853 |
1.B Primary Income (1.B.1 to 1.B.3) |
2493 |
6800 |
-4307 |
3088 |
7726 |
-4638 |
1.B.1 Compensation of employees |
589 |
400 |
189 |
711 |
467 |
244 |
1.B.2 Investment income |
1904 |
6400 |
-4496 |
2377 |
7259 |
-4882 |
1.B.2.1 Direct investment |
1089 |
6337 |
-5248 |
1062 |
7201 |
-6139 |
1.B.2.1.1 Income on equity and investment fund shares |
726 |
3990 |
-3264 |
745 |
4886 |
-4141 |
1.B.2.1.2 Interest |
364 |
2347 |
-1983 |
317 |
2315 |
-1998 |
1.B.2.2 Portfolio investment |
– |
– |
– |
– |
– |
– |
1.B.2.3 Other investment |
– |
56 |
-56 |
– |
54 |
-54 |
1.B.2.4 Reserve assets |
815 |
7 |
807 |
1315 |
4 |
1311 |
1.B.3 Other primary income |
– |
– |
– |
– |
– |
– |
1.C Secondary Income (1.C.1+1.C.2) |
15491 |
685 |
14807 |
16240 |
622 |
15618 |
1.C.1 Financial corporations, nonfinancial corporations, households, and NPISHs |
15491 |
712 |
14779 |
16240 |
622 |
15618 |
1.C.1.1 Personal transfers (Current transfers between resident and/ non-resident households) |
14875 |
588 |
14287 |
15648 |
530 |
15119 |
| of which: |
|
|
|
|
|
|
1.C.1.1.1 Workers’ remittances |
7372 |
588 |
6784 |
7718 |
530 |
7188 |
1.C.1.2 Other current transfers |
616 |
124 |
492 |
592 |
93 |
499 |
2 Capital Account (2.1+2.2) |
49 |
320 |
-271 |
407 |
163 |
244 |
2.1 Gross acquisitions (DR.)/disposals (CR.) of non-produced nonfinancial assets |
2 |
174 |
-172 |
271 |
11 |
260 |
2.2 Capital transfers |
46 |
146 |
-99 |
136 |
152 |
-16 |
2.2.1 General government |
46 |
146 |
-99 |
136 |
152 |
-16 |
2.2.1.1 Debt forgiveness |
– |
– |
– |
– |
– |
– |
2.2.1.2 Other capital transfers |
46 |
146 |
-99 |
136 |
152 |
-16 |
2.2.2 Financial corporations, nonfinancial corporations, households, and NPISHs |
– |
– |
– |
– |
– |
– |
Statement 1: Standard Presentation of BoP in India as per BPM6 (Contd.) |
(US$ million) |
Item |
Apr-Jun 2011 (PR) |
Jul-Sept 2011 (PR) |
Credit |
Debit |
Net |
Credit |
Debit |
Net |
31 |
32 |
33 |
34 |
35 |
36 |
3 Financial Account (3.1 to 3.5) |
128181 |
111199 |
16983 |
113110 |
96431 |
16679 |
3.1 Direct Investment (3.1A+3.1B) |
18301 |
10530 |
7771 |
9457 |
5487 |
3971 |
3.1.A Direct Investment in India |
17897 |
4559 |
13337 |
9091 |
2137 |
6954 |
3.1.1 Equity and investment fund shares |
16426 |
4226 |
12200 |
8680 |
2015 |
6665 |
3.1.1.1 Equity other than reinvestment of earnings |
13696 |
4226 |
9470 |
5950 |
2015 |
3934 |
3.1.1.1.1 Direct investor in direct investment enterprises |
13696 |
4226 |
9470 |
5950 |
2015 |
3934 |
3.1.1.1.2 Direct investment enterprises in direct investor (reverse investment) |
– |
– |
– |
– |
– |
– |
3.1.1.1.3 Between fellow enterprises |
– |
– |
– |
– |
– |
– |
3.1.1.2 Reinvestment of earnings |
2730 |
– |
2730 |
2730 |
– |
2730 |
3.1.2 Debt instruments |
1471 |
333 |
1137 |
411 |
122 |
290 |
3.1.2.1 Direct investor in direct investment enterprises |
1471 |
333 |
1137 |
411 |
122 |
290 |
3.1.2.2 Direct investment enterprises in direct investor (reverse investment) |
– |
– |
– |
– |
– |
– |
3.1.2.3 Between fellow enterprises |
– |
– |
– |
– |
– |
– |
3.1.B Direct Investment by India |
404 |
5971 |
-5567 |
366 |
3350 |
-2983 |
3.1.1 Equity and investment fund shares |
404 |
1837 |
-1433 |
366 |
1902 |
-1536 |
3.1.1.1 Equity other than reinvestment of earnings |
404 |
1535 |
-1131 |
366 |
1600 |
-1234 |
3.1.1.1.1 Direct investor in direct investment enterprises |
404 |
1535 |
-1131 |
366 |
1600 |
-1234 |
3.1.1.1.2 Direct investment enterprises in direct investor (reverse investment) |
– |
– |
– |
– |
– |
– |
3.1.1.1.3 Between fellow enterprises |
– |
– |
– |
– |
– |
– |
3.1.1.2 Reinvestment of earnings |
– |
302 |
-302 |
– |
302 |
-302 |
3.1.2 Debt instruments |
– |
4133 |
-4133 |
– |
1448 |
-1448 |
3.1.2.1 Direct investor in direct investment enterprises |
– |
4133 |
-4133 |
– |
1448 |
-1448 |
3.1.2.2 Direct investment enterprises in direct investor (reverse investment) |
– |
– |
– |
– |
– |
– |
3.1.2.3 Between fellow enterprises |
– |
– |
– |
– |
– |
– |
3.2 Portfolio Investment |
48423 |
46159 |
2263 |
43022 |
44422 |
-1401 |
3.2A Portfolio Investment in India |
48329 |
45857 |
2472 |
42564 |
44152 |
-1588 |
3.2.1 Equity and investment fund shares |
33320 |
31652 |
1668 |
30286 |
32187 |
-1901 |
3.2.2 Debt securities |
15009 |
14205 |
804 |
12277 |
11965 |
312 |
3.2.B Portfolio Investment by India |
94 |
303 |
-208 |
458 |
270 |
188 |
3.3 Financial derivatives (other than reserves) and employee stock options |
– |
– |
– |
– |
– |
– |
3.4 Other investment |
61458 |
49067 |
12391 |
60631 |
46246 |
14385 |
3.4.1 Other equity (ADRs/GDRs) |
278 |
– |
278 |
205 |
|
205 |
3.4.2 Currency and deposits |
12520 |
11364 |
1155 |
15089 |
12328 |
2760 |
3.4.2.1 Central bank (Rupee Debt Movements; NRG) |
31 |
27 |
5 |
0 |
26 |
-26 |
3.4.2.2 Deposit-taking corporations, except the central bank (NRI Deposits) |
12488 |
11337 |
1151 |
15088 |
12302 |
2786 |
3.4.2.3 General government |
– |
– |
– |
– |
– |
– |
3.4.2.4 Other sectors |
– |
– |
– |
– |
– |
– |
3.4.3 Loans (External Assistance, ECBs and Banking Capital) |
24263 |
9067 |
15196 |
15871 |
6391 |
9480 |
3.4.3A Loans to India |
23906 |
8724 |
15182 |
14736 |
5898 |
8837 |
3.4.3.1 Central bank |
– |
– |
– |
– |
– |
– |
3.4.3.2 Deposit-taking corporations, except the central bank |
16248 |
4739 |
11509 |
5056 |
1137 |
3919 |
3.4.3.3 General government (External Assistance) |
1219 |
831 |
388 |
1063 |
734 |
330 |
3.4.3.4 Other sectors (External Commercial Borrowings) |
6439 |
3154 |
3285 |
8616 |
4028 |
4588 |
3.4.3B Loans by India |
357 |
343 |
14 |
1136 |
493 |
643 |
3.4.3.1 Central bank |
– |
– |
– |
– |
– |
– |
3.4.3.2 Deposit-taking corporations, except the central bank |
– |
– |
– |
– |
– |
– |
3.4.3.3 General government |
18 |
24 |
-6 |
18 |
24 |
-6 |
3.4.3.4 Other sectors |
339 |
319 |
21 |
1118 |
469 |
649 |
3.4.4 Insurance, pension, and standardized guarantee schemes |
– |
– |
– |
– |
– |
– |
3.4.5 Trade credit and advances |
24165 |
21096 |
3069 |
26405 |
23534 |
2871 |
3.4.5.1 Central bank |
– |
– |
– |
– |
– |
– |
3.4.5.2 General government |
– |
– |
– |
– |
– |
– |
3.4.5.3 Deposit-taking corporations |
– |
– |
– |
– |
– |
– |
3.4.5.4 Other sectors |
24165 |
21096 |
3069 |
26405 |
23534 |
2871 |
3.4.6 Other accounts receivable/payable-other |
232 |
7540 |
-7308 |
3061 |
3993 |
-931 |
3.4.7 Special drawing rights |
– |
– |
– |
– |
– |
– |
3.5 Reserve assets |
– |
5442 |
-5442 |
– |
276 |
-276 |
3.5.1 Monetary gold |
– |
– |
– |
– |
– |
– |
3.5.2 Special drawing rights n.a. |
– |
– |
– |
– |
– |
– |
3.5.3 Reserve position in the IMF n.a. |
– |
– |
– |
– |
– |
– |
3.5.4 Other reserve assets (Foreign Currency Assets) |
– |
5442 |
-5442 |
– |
276 |
-276 |
3.5.4.1 Currency, deposits and securities |
– |
5442 |
-5442 |
– |
276 |
-276 |
3.5.4.2 Financial derivatives |
– |
– |
– |
– |
– |
– |
3.5.4.3 Other claims |
– |
– |
– |
– |
– |
– |
3 Total assets/liabilities |
128181 |
111199 |
16983 |
113110 |
96431 |
16679 |
of which: (by instrument): |
|
|
– |
|
|
– |
3.0.1 Equity and investment fund shares |
50244 |
38018 |
12226 |
39790 |
36192 |
3598 |
3.0.2 Debt instruments |
77427 |
60199 |
17228 |
70053 |
55970 |
14084 |
3.0.3 Other financial assets and liabilities |
510 |
12982 |
-12472 |
3266 |
4269 |
-1003 |
4 Net errors and omissions |
|
1009 |
-1009 |
1469 |
|
1469 |
Statement 1: Standard Presentation of BoP in India as per BPM6 (Contd.) |
(US$ million) |
Item |
Oct-Dec 2011 (P) |
Oct-Dec 2010 (PR) |
Credit |
Debit |
Net |
Credit |
Debit |
Net |
37 |
38 |
39 |
40 |
41 |
42 |
1 Current Account (1.A+1.B+1.C) |
128202 |
147824 |
-19622 |
120994 |
131112 |
-10119 |
1.A Goods and Services (1.A.a+1.A.b) |
107912 |
140561 |
-32649 |
104816 |
123770 |
-18954 |
1.A.a Goods (1.A.a.1 to 1.A.a.3) |
71185 |
118848 |
-47662 |
65987 |
97421 |
-31434 |
1.A.a.1 General merchandise on a BOP basis |
71127 |
102105 |
-30978 |
65898 |
89520 |
-23621 |
1.A.a.1.1 Re-exports |
– |
– |
– |
– |
– |
– |
1.A.a.2 Net exports of goods under merchanting |
58 |
|
58 |
89 |
|
89 |
1.A.a.2.1 Goods acquired under merchanting (negative credits) |
– |
– |
– |
– |
– |
– |
1.A.a.2.2 Goods sold under merchanting |
– |
– |
– |
– |
– |
– |
1.A.a.3 Non-monetary gold |
|
16743 |
-16743 |
|
7901 |
-7901 |
1.A.b Services (1.A.b.1 to 1.A.b.13) |
36726 |
21713 |
15013 |
38829 |
26349 |
12480 |
1.A.b.1 Manufacturing services on physical inputs owned by others |
– |
– |
– |
– |
– |
– |
1.A.b.1.1 Goods for processing in reporting economy |
– |
– |
– |
– |
– |
– |
1.A.b.1.2 Goods for processing abroad |
– |
– |
– |
– |
– |
– |
1.A.b.2 Maintenance and repair services n.i.e. |
– |
– |
– |
– |
– |
– |
1.A.b.3 Transport |
4584 |
4451 |
133 |
3717 |
3992 |
-275 |
1.A.b.3.1 Sea transport |
1289 |
2229 |
-941 |
1607 |
2268 |
-661 |
1.A.b.3.2 Air transport |
801 |
841 |
-40 |
579 |
1431 |
-852 |
1.A.b.3.3 Other modes of transport |
2490 |
1374 |
1116 |
1527 |
285 |
1242 |
1.A.b.3.4 Postal and courier services |
4 |
7 |
-3 |
4 |
8 |
-4 |
1.A.b.4 Travel |
5068 |
3530 |
1538 |
4429 |
2857 |
1572 |
1.A.b.4.1 Business |
– |
1714 |
-1714 |
– |
1251 |
-1251 |
1.A.b.4.2 Personal |
– |
1816 |
-1816 |
– |
1606 |
-1606 |
1.A.b.4.2.1 Health-related |
– |
6 |
-6 |
– |
7 |
-7 |
1.A.b.4.2.2 Education-related |
– |
396 |
-396 |
– |
435 |
-435 |
1.A.b.4.2.3 Other |
– |
1415 |
-1415 |
– |
1164 |
-1164 |
1.A.b.5 Construction |
204 |
155 |
49 |
128 |
220 |
-91 |
1.A.b.5.1 Construction abroad |
204 |
72 |
132 |
128 |
117 |
11 |
1.A.b.5.2 Construction in the reporting economy |
– |
83 |
-83 |
– |
102 |
-102 |
1.A.b.6 Insurance and pension services |
799 |
440 |
359 |
507 |
403 |
104 |
1.A.b.6.1 Direct insurance |
743 |
190 |
552 |
463 |
131 |
332 |
1.A.b.6.2 Reinsurance |
45 |
243 |
-198 |
37 |
255 |
-218 |
1.A.b.6.3 Auxiliary insurance services |
11 |
6 |
5 |
7 |
16 |
-10 |
1.A.b.6.4 Pension and standardized guarantee services |
– |
– |
– |
– |
– |
– |
1.A.b.7 Financial services |
1613 |
2104 |
-491 |
1684 |
1961 |
-276 |
1.A.b.7.1 Explicitly charged and other financial services |
1613 |
2104 |
-491 |
1684 |
1961 |
-276 |
1.A.b.7.2 Financial intermediation services indirectly measured |
– |
– |
– |
– |
– |
– |
1.A.b.8 Charges for the use of intellectual property n.i.e. |
78 |
919 |
-841 |
25 |
696 |
-671 |
1.A.b.9 Telecommunications, computer, and information services |
16605 |
764 |
15842 |
15485 |
1118 |
14368 |
1.A.b.9.1 Telecommunications services |
452 |
334 |
118 |
421 |
296 |
125 |
1.A.b.9.2 Computer services |
16123 |
317 |
15806 |
14743 |
709 |
14034 |
1.A.b.9.3 Information services |
31 |
112 |
-82 |
322 |
113 |
209 |
1.A.b.10 Other business services |
5718 |
6708 |
-991 |
6754 |
7743 |
-989 |
1.A.b.10.1 Research and development services |
207 |
91 |
116 |
224 |
79 |
145 |
1.A.b.10.2 Professional and management consulting services |
2663 |
3348 |
-685 |
3131 |
3408 |
-277 |
1.A.b.10.3 Technical, trade-related, and other business services |
2848 |
3270 |
-422 |
3399 |
4257 |
-857 |
1.A.b.11 Personal, cultural, and recreational services |
67 |
48 |
20 |
52 |
228 |
-176 |
1.A.b.11.1 Audiovisual and related services |
41 |
17 |
24 |
30 |
39 |
-9 |
1.A.b.11.2 Other personal, cultural, and recreational services |
26 |
31 |
-5 |
22 |
190 |
-168 |
1.A.b.12 Government goods and services n.i.e. |
145 |
186 |
-40 |
150 |
195 |
-45 |
1.A.b.13 Others n.i.e. |
1845 |
2409 |
-564 |
5897 |
6936 |
-1039 |
1.B Primary Income (1.B.1 to 1.B.3) |
2282 |
6798 |
-4516 |
2096 |
6698 |
-4601 |
1.B.1 Compensation of employees |
583 |
551 |
32 |
286 |
564 |
-279 |
1.B.2 Investment income |
1698 |
6247 |
-4549 |
1811 |
6133 |
-4323 |
1.B.2.1 Direct investment |
698 |
6161 |
-5463 |
898 |
6060 |
-5162 |
1.B.2.1.1 Income on equity and investment fund shares |
497 |
3556 |
-3059 |
723 |
4351 |
-3627 |
1.B.2.1.2 Interest |
201 |
2605 |
-2404 |
174 |
1709 |
-1535 |
1.B.2.2 Portfolio investment |
– |
– |
– |
– |
– |
– |
1.B.2.3 Other investment |
– |
80 |
-80 |
– |
68 |
-68 |
1.B.2.4 Reserve assets |
1000 |
5 |
995 |
913 |
5 |
908 |
1.B.3 Other primary income |
– |
– |
– |
– |
– |
– |
1.C Secondary Income (1.C.1+1.C.2) |
18009 |
465 |
17544 |
14081 |
645 |
13436 |
1.C.1 Financial corporations, nonfinancial corporations, households, and NPISHs |
18009 |
465 |
17544 |
14081 |
645 |
13436 |
1.C.1.1 Personal transfers (Current transfers between resident and/ non-resident households) |
17339 |
396 |
16943 |
13573 |
540 |
13033 |
of which: |
|
|
|
|
|
– |
1.C.1.1.1 Workers’ remittances |
8399 |
396 |
8003 |
7227 |
540 |
6687 |
1.C.1.2 Other current transfers |
670 |
69 |
601 |
508 |
105 |
403 |
2 Capital Account (2.1+2.2) |
352 |
232 |
120 |
343 |
206 |
137 |
2.1 Gross acquisitions (DR.)/disposals (CR.) of non-produced nonfinancial assets |
0 |
83 |
-83 |
3 |
7 |
-5 |
2.2 Capital transfers |
351 |
149 |
202 |
341 |
199 |
141 |
2.2.1 General government |
351 |
149 |
202 |
341 |
199 |
141 |
2.2.1.1 Debt forgiveness |
– |
– |
– |
– |
– |
– |
2.2.1.2 Other capital transfers |
351 |
149 |
202 |
341 |
199 |
141 |
2.2.2 Financial corporations, nonfinancial corporations, households, and NPISHs |
– |
– |
– |
– |
– |
– |
Statement 1: Standard Presentation of BoP in India as per BPM6 (Contd.) |
(US$ million) |
Item |
Oct-Dec 2011 (P) |
Oct-Dec 2010 (PR) |
Credit |
Debit |
Net |
Credit |
Debit |
Net |
37 |
38 |
39 |
40 |
41 |
42 |
3 Financial Account (3.1 to 3.5) |
120413 |
99530 |
20883 |
174365 |
164501 |
9864 |
3.1 Direct Investment (3.1A+3.1B) |
9950 |
5466 |
4485 |
9424 |
8231 |
1193 |
3.1.A Direct Investment in India |
8949 |
2559 |
6389 |
8340 |
2200 |
6141 |
3.1.1 Equity and investment fund shares |
8037 |
2515 |
5522 |
8237 |
1861 |
6377 |
3.1.1.1 Equity other than reinvestment of earnings |
5307 |
2515 |
2792 |
5253 |
1861 |
3392 |
3.1.1.1.1 Direct investor in direct investment enterprises |
5307 |
2515 |
2792 |
5253 |
1861 |
3392 |
3.1.1.1.2 Direct investment enterprises in direct investor (reverse investment) |
– |
– |
– |
– |
– |
– |
3.1.1.1.3 Between fellow enterprises |
– |
– |
– |
– |
– |
– |
3.1.1.2 Reinvestment of earnings |
2730 |
– |
2730 |
2985 |
– |
2985 |
3.1.2 Debt instruments |
912 |
44 |
868 |
103 |
339 |
-236 |
3.1.2.1 Direct investor in direct investment enterprises |
912 |
44 |
868 |
103 |
339 |
-236 |
3.1.2.2 Direct investment enterprises in direct investor (reverse investment) |
– |
– |
– |
– |
– |
– |
3.1.2.3 Between fellow enterprises |
– |
– |
– |
– |
– |
– |
3.1.B Direct Investment by India |
1001 |
2906 |
-1905 |
1084 |
6031 |
-4948 |
3.1.1 Equity and investment fund shares |
1001 |
1684 |
-683 |
1084 |
3608 |
-2524 |
3.1.1.1 Equity other than reinvestment of earnings |
1001 |
1382 |
-381 |
1084 |
3337 |
-2253 |
3.1.1.1.1 Direct investor in direct investment enterprises |
1001 |
1382 |
-381 |
1084 |
3337 |
-2253 |
3.1.1.1.2 Direct investment enterprises in direct investor (reverse investment) |
– |
– |
– |
– |
– |
– |
3.1.1.1.3 Between fellow enterprises |
– |
– |
– |
– |
– |
– |
3.1.1.2 Reinvestment of earnings |
– |
302 |
-302 |
– |
271 |
-271 |
3.1.2 Debt instruments |
– |
1222 |
-1222 |
– |
2423 |
-2423 |
3.1.2.1 Direct investor in direct investment enterprises |
– |
1222 |
-1222 |
– |
2423 |
-2423 |
3.1.2.2 Direct investment enterprises in direct investor (reverse investment) |
– |
– |
– |
– |
– |
– |
3.1.2.3 Between fellow enterprises |
– |
– |
– |
– |
– |
– |
3.2 Portfolio Investment |
39266 |
37452 |
1814 |
101562 |
95496 |
6066 |
3.2A Portfolio Investment in India |
39065 |
37204 |
1861 |
101423 |
94265 |
7158 |
3.2.1 Equity and investment fund shares |
23058 |
25043 |
-1985 |
84647 |
75469 |
9177 |
3.2.2 Debt securities |
16007 |
12161 |
3846 |
16776 |
18795 |
-2019 |
3.2.B Portfolio Investment by India |
201 |
248 |
-47 |
139 |
1232 |
-1092 |
3.3 Financial derivatives (other than reserves) and employee stock options |
– |
– |
– |
– |
– |
– |
3.4 Other investment |
58385 |
56612 |
1772 |
63379 |
56785 |
6594 |
3.4.1 Other equity (ADRs/GDRs) |
84 |
|
84 |
233 |
|
233 |
3.4.2 Currency and deposits |
15701 |
12502 |
3199 |
12652 |
12380 |
272 |
3.4.2.1 Central bank (Rupee Debt Movements; NRG) |
3 |
127 |
-124 |
87 |
0 |
87 |
3.4.2.2 Deposit-taking corporations, except the central bank (NRI Deposits) |
15698 |
12375 |
3323 |
12566 |
12380 |
185 |
3.4.2.3 General government |
– |
– |
– |
– |
– |
– |
3.4.2.4 Other sectors |
– |
– |
– |
– |
– |
– |
3.4.3 Loans (External Assistance, ECBs and Banking Capital) |
12248 |
18107 |
-5859 |
28733 |
19073 |
9659 |
3.4.3A Loans to India |
10825 |
17181 |
-6356 |
28144 |
18825 |
9319 |
3.4.3.1 Central bank |
– |
– |
– |
– |
– |
– |
3.4.3.2 Deposit-taking corporations, except the central bank |
445 |
9130 |
-8685 |
20451 |
15822 |
4629 |
3.4.3.3 General government (External Assistance) |
2191 |
800 |
1392 |
1916 |
755 |
1160 |
3.4.3.4 Other sectors (External Commercial Borrowings) |
8189 |
7252 |
937 |
5778 |
2248 |
3530 |
3.4.3B Loans by India |
1422 |
925 |
497 |
589 |
248 |
341 |
3.4.3.1 Central bank |
– |
– |
– |
– |
– |
– |
3.4.3.2 Deposit-taking corporations, except the central bank |
– |
– |
– |
– |
– |
– |
3.4.3.3 General government |
18 |
24 |
-6 |
19 |
25 |
-6 |
3.4.3.4 Other sectors |
1405 |
901 |
504 |
570 |
222 |
347 |
3.4.4 Insurance, pension, and standardized guarantee schemes |
– |
– |
– |
– |
– |
– |
3.4.5 Trade credit and advances |
25148 |
25279 |
-131 |
18337 |
16992 |
1345 |
3.4.5.1 Central bank |
– |
– |
– |
– |
– |
– |
3.4.5.2 General government |
– |
– |
– |
– |
– |
– |
3.4.5.3 Deposit-taking corporations |
– |
– |
– |
– |
– |
– |
3.4.5.4 Other sectors |
25148 |
25279 |
-131 |
18337 |
16992 |
1345 |
3.4.6 Other accounts receivable/payable-other |
5205 |
725 |
4480 |
3424 |
8340 |
-4915 |
3.4.7 Special drawing rights |
– |
– |
– |
– |
– |
– |
3.5 Reserve assets |
12812 |
– |
12812 |
– |
3989 |
-3989 |
3.5.1 Monetary gold |
– |
– |
– |
– |
– |
– |
3.5.2 Special drawing rights n.a. |
– |
– |
– |
– |
– |
– |
3.5.3 Reserve position in the IMF n.a. |
– |
– |
– |
– |
– |
– |
3.5.4 Other reserve assets (Foreign Currency Assets) |
12812 |
– |
12812 |
– |
3989 |
-3989 |
3.5.4.1 Currency, deposits and securities |
12812 |
– |
12812 |
– |
3989 |
-3989 |
3.5.4.2 Financial derivatives |
– |
– |
– |
– |
– |
– |
3.5.4.3 Other claims |
– |
– |
– |
– |
– |
– |
3 Total assets/liabilities |
120413 |
99530 |
20883 |
174365 |
164501 |
9864 |
of which: (by instrument): |
|
|
– |
|
|
|
3.0.1 Equity and investment fund shares |
32297 |
29490 |
2807 |
94107 |
82169 |
11938 |
3.0.2 Debt instruments |
70016 |
69315 |
700 |
76601 |
70003 |
6598 |
3.0.3 Other financial assets and liabilities |
18100 |
725 |
17376 |
3657 |
12329 |
-8671 |
4 Net errors and omissions |
|
1381 |
-1381 |
118 |
|
118 |
Statement 1: Standard Presentation of BoP in India as per BPM6 (Concld.) |
(US$ million) |
Item |
Apr-Dec 2011-12 (P) |
Apr-Dec 2010-11 (PR) |
Credit |
Debit |
Net |
Credit |
Debit |
Net |
43 |
44 |
45 |
46 |
47 |
48 |
1 Current Account (1.A+1.B+1.C) |
381631 |
435347 |
-53716 |
317812 |
357448 |
-39636 |
1.A Goods and Services (1.A.a+1.A.b) |
324029 |
412251 |
-88222 |
269598 |
335913 |
-66316 |
1.A.a Goods (1.A.a.1 to 1.A.a.3) |
221990 |
354296 |
-132305 |
173232 |
273634 |
-100402 |
1.A.a.1 General merchandise on a BOP basis |
221794 |
308796 |
-87002 |
173229 |
251386 |
-78157 |
1.A.a.1.1 Re-exports |
– |
– |
– |
– |
– |
– |
1.A.a.2 Net exports of goods under merchanting |
197 |
– |
197 |
3 |
– |
3 |
1.A.a.2.1 Goods acquired under merchanting (negative credits) |
– |
– |
– |
– |
– |
– |
1.A.a.2.2 Goods sold under merchanting |
– |
– |
– |
– |
– |
– |
1.A.a.3 Non-monetary gold |
– |
45500 |
-45500 |
– |
22248 |
-22248 |
1.A.b Services (1.A.b.1 to 1.A.b.13) |
102038 |
57955 |
44083 |
96366 |
62280 |
34086 |
1.A.b.1 Manufacturing services on physical inputs owned by others |
– |
– |
– |
– |
– |
– |
1.A.b.1.1 Goods for processing in reporting economy |
– |
– |
– |
– |
– |
– |
1.A.b.1.2 Goods for processing abroad |
– |
– |
– |
– |
– |
– |
1.A.b.2 Maintenance and repair services n.i.e. |
– |
– |
– |
– |
– |
– |
1.A.b.3 Transport |
13344 |
12121 |
1222 |
10157 |
10693 |
-536 |
1.A.b.3.1 Sea transport |
4779 |
7076 |
-2297 |
4622 |
6121 |
-1499 |
1.A.b.3.2 Air transport |
2359 |
3065 |
-706 |
1708 |
3729 |
-2020 |
1.A.b.3.3 Other modes of transport |
6194 |
1930 |
4264 |
3797 |
793 |
3004 |
1.A.b.3.4 Postal and courier services |
11 |
51 |
-39 |
30 |
51 |
-21 |
1.A.b.4 Travel |
13000 |
10525 |
2475 |
10757 |
7910 |
2846 |
1.A.b.4.1 Business |
– |
5210 |
-5210 |
– |
3113 |
-3113 |
1.A.b.4.2 Personal |
– |
5314 |
-5314 |
– |
4798 |
-4798 |
1.A.b.4.2.1 Health-related |
– |
27 |
-27 |
– |
54 |
-54 |
1.A.b.4.2.2 Education-related |
– |
1357 |
-1357 |
– |
1424 |
-1424 |
1.A.b.4.2.3 Other |
– |
3930 |
-3930 |
– |
3320 |
-3320 |
1.A.b.5 Construction |
585 |
677 |
-92 |
424 |
701 |
-278 |
1.A.b.5.1 Construction abroad |
585 |
365 |
220 |
424 |
394 |
30 |
1.A.b.5.2 Construction in the reporting economy |
– |
312 |
-312 |
– |
308 |
-308 |
1.A.b.6 Insurance and pension services |
1983 |
1161 |
823 |
1358 |
1098 |
259 |
1.A.b.6.1 Direct insurance |
1843 |
437 |
1407 |
1241 |
451 |
790 |
1.A.b.6.2 Reinsurance |
104 |
666 |
-562 |
95 |
595 |
-500 |
1.A.b.6.3 Auxiliary insurance services |
36 |
58 |
-22 |
21 |
52 |
-31 |
1.A.b.6.4 Pension and standardized guarantee services |
– |
– |
– |
– |
– |
– |
1.A.b.7 Financial services |
4456 |
5997 |
-1541 |
4731 |
5270 |
-539 |
1.A.b.7.1 Explicitly charged and other financial services |
4456 |
5997 |
-1541 |
4731 |
5270 |
-539 |
1.A.b.7.2 Financial intermediation services indirectly measured |
– |
– |
– |
– |
– |
– |
1.A.b.8 Charges for the use of intellectual property n.i.e. |
196 |
2218 |
-2021 |
86 |
1822 |
-1736 |
1.A.b.9 Telecommunications, computer, and information services |
46358 |
2335 |
44024 |
41173 |
2886 |
38287 |
1.A.b.9.1 Telecommunications services |
1263 |
1015 |
248 |
1136 |
760 |
376 |
1.A.b.9.2 Computer services |
45013 |
927 |
44086 |
39524 |
1869 |
37655 |
1.A.b.9.3 Information services |
82 |
393 |
-311 |
512 |
257 |
255 |
1.A.b.10 Other business services |
15833 |
18737 |
-2904 |
16975 |
19975 |
-3000 |
1.A.b.10.1 Research and development services |
552 |
164 |
388 |
680 |
196 |
484 |
1.A.b.10.2 Professional and management consulting services |
7403 |
8679 |
-1276 |
7641 |
8792 |
-1151 |
1.A.b.10.3 Technical, trade-related, and other business services |
7877 |
9894 |
-2017 |
8654 |
10988 |
-2334 |
1.A.b.11 Personal, cultural, and recreational services |
275 |
206 |
69 |
157 |
404 |
-247 |
1.A.b.11.1 Audiovisual and related services |
102 |
66 |
36 |
79 |
122 |
-43 |
1.A.b.11.2 Other personal, cultural, and recreational services |
173 |
140 |
33 |
78 |
282 |
-204 |
1.A.b.12 Government goods and services n.i.e. |
431 |
566 |
-135 |
369 |
543 |
-174 |
1.A.b.13 Others n.i.e. |
5577 |
3412 |
2165 |
10179 |
10975 |
-796 |
1.B Primary Income (1.B.1 to 1.B.3) |
7862 |
21324 |
-13462 |
6925 |
19764 |
-12839 |
1.B.1 Compensation of employees |
1883 |
1418 |
465 |
759 |
1481 |
-722 |
1.B.2 Investment income |
5979 |
19906 |
-13927 |
6166 |
18283 |
-12118 |
1.B.2.1 Direct investment |
2850 |
19700 |
-16850 |
3094 |
17993 |
-14898 |
1.B.2.1.1 Income on equity and investment fund shares |
1967 |
12432 |
-10465 |
1467 |
12922 |
-11456 |
1.B.2.1.2 Interest |
882 |
7267 |
-6385 |
1628 |
5070 |
-3443 |
1.B.2.2 Portfolio investment |
– |
– |
– |
– |
– |
– |
1.B.2.3 Other investment |
– |
190 |
-190 |
– |
278 |
-278 |
1.B.2.4 Reserve assets |
3130 |
16 |
3113 |
3071 |
13 |
3058 |
1.B.3 Other primary income |
– |
– |
– |
– |
– |
– |
1.C Secondary Income (1.C.1+1.C.2) |
49740 |
1772 |
47968 |
41289 |
1770 |
39519 |
1.C.1 Financial corporations, nonfinancial corporations, households, and NPISHs |
49740 |
1799 |
47941 |
41289 |
1770 |
39519 |
1.C.1.1 Personal transfers (Current transfers between resident and/ non-resident households) |
47863 |
1514 |
46349 |
39843 |
1469 |
38374 |
of which: |
– |
– |
– |
– |
– |
– |
1.C.1.1.1 Workers’ remittances |
23489 |
1514 |
21975 |
20126 |
1469 |
18657 |
1.C.1.2 Other current transfers |
1877 |
285 |
1592 |
1446 |
301 |
1145 |
2 Capital Account (2.1+2.2) |
808 |
716 |
92 |
554 |
490 |
65 |
2.1 Gross acquisitions (DR.)/disposals (CR.) of non-produced nonfinancial assets |
274 |
269 |
5 |
14 |
12 |
2 |
2.2 Capital transfers |
534 |
447 |
87 |
540 |
478 |
62 |
2.2.1 General government |
534 |
447 |
87 |
540 |
478 |
62 |
2.2.1.1 Debt forgiveness |
– |
– |
– |
– |
– |
– |
2.2.1.2 Other capital transfers |
534 |
447 |
87 |
540 |
478 |
62 |
2.2.2 Financial corporations, nonfinancial corporations, households, and NPISHs |
– |
– |
– |
– |
– |
– |
Statement 1: Standard Presentation of BoP in India as per BPM6 (Concld.) |
(US$ million) |
Item |
Apr-Dec 2011-12 (P) |
Apr-Dec 2010-11 (PR) |
Credit |
Debit |
Net |
Credit |
Debit |
Net |
43 |
44 |
45 |
46 |
47 |
48 |
3 Financial Account (3.1 to 3.5) |
361704 |
307160 |
54544 |
381842 |
340065 |
41777 |
3.1 Direct Investment (3.1A+3.1B) |
37708 |
21482 |
16226 |
27930 |
19697 |
8233 |
3.1.A Direct Investment in India |
35937 |
9256 |
26681 |
25974 |
5599 |
20375 |
3.1.1 Equity and investment fund shares |
33143 |
8757 |
24386 |
25649 |
5173 |
20477 |
3.1.1.1 Equity other than reinvestment of earnings |
24952 |
8757 |
16196 |
16695 |
5173 |
11522 |
3.1.1.1.1 Direct investor in direct investment enterprises |
24952 |
8757 |
16196 |
16695 |
5173 |
11522 |
3.1.1.1.2 Direct investment enterprises in direct investor (reverse investment) |
– |
– |
– |
– |
– |
– |
3.1.1.1.3 Between fellow enterprises |
– |
– |
– |
– |
– |
– |
3.1.1.2 Reinvestment of earnings |
8190 |
– |
8190 |
8955 |
– |
8955 |
3.1.2 Debt instruments |
2794 |
499 |
2295 |
325 |
426 |
-101 |
3.1.2.1 Direct investor in direct investment enterprises |
2794 |
499 |
2295 |
325 |
426 |
-101 |
3.1.2.2 Direct investment enterprises in direct investor (reverse investment) |
– |
– |
– |
– |
– |
– |
3.1.2.3 Between fellow enterprises |
– |
– |
– |
– |
– |
– |
3.1.B Direct Investment by India |
1772 |
12227 |
-10455 |
1955 |
14098 |
-12143 |
3.1.1 Equity and investment fund shares |
1772 |
5423 |
-3652 |
1955 |
8837 |
-6881 |
3.1.1.1 Equity other than reinvestment of earnings |
1772 |
4517 |
-2746 |
1955 |
8024 |
-6068 |
3.1.1.1.1 Direct investor in direct investment enterprises |
1772 |
4517 |
-2746 |
1955 |
8024 |
-6068 |
3.1.1.1.2 Direct investment enterprises in direct investor (reverse investment) |
– |
– |
– |
– |
– |
– |
3.1.1.1.3 Between fellow enterprises |
– |
– |
– |
– |
– |
– |
3.1.1.2 Reinvestment of earnings |
– |
906 |
-906 |
– |
813 |
-813 |
3.1.2 Debt instruments |
– |
6803 |
-6803 |
– |
5261 |
-5261 |
3.1.2.1 Direct investor in direct investment enterprises |
– |
6803 |
-6803 |
– |
5261 |
-5261 |
3.1.2.2 Direct investment enterprises in direct investor (reverse investment) |
– |
– |
– |
– |
– |
– |
3.1.2.3 Between fellow enterprises |
– |
– |
– |
– |
– |
– |
3.2 Portfolio Investment |
130711 |
128034 |
2677 |
203278 |
175023 |
28256 |
3.2A Portfolio Investment in India |
129957 |
127213 |
2744 |
202894 |
173439 |
29456 |
3.2.1 Equity and investment fund shares |
86664 |
88882 |
-2218 |
153345 |
132499 |
20846 |
3.2.2 Debt securities |
43294 |
38331 |
4962 |
49550 |
40940 |
8610 |
3.2.B Portfolio Investment by India |
753 |
821 |
-67 |
384 |
1584 |
-1200 |
3.3 Financial derivatives (other than reserves) and employee stock options |
– |
– |
– |
– |
– |
– |
3.4 Other investment |
180473 |
151925 |
28548 |
150634 |
134326 |
16307 |
3.4.1 Other equity (ADRs/GDRs) |
567 |
– |
567 |
1839 |
– |
1839 |
3.4.2 Currency and deposits |
43309 |
36195 |
7114 |
35579 |
33769 |
1809 |
3.4.2.1 Central bank (Rupee Debt Movements; NRG) |
34 |
180 |
-146 |
89 |
628 |
-539 |
3.4.2.2 Deposit-taking corporations, except the central bank (NRI Deposits) |
43275 |
36015 |
7260 |
35490 |
33141 |
2348 |
3.4.2.3 General government |
– |
– |
– |
– |
– |
– |
3.4.2.4 Other sectors |
– |
– |
– |
– |
– |
– |
3.4.3 Loans (External Assistance, ECBs and Banking Capital) |
52382 |
33565 |
18817 |
54407 |
36736 |
17672 |
3.4.3A Loans to India |
49467 |
31804 |
17663 |
53298 |
35638 |
17660 |
3.4.3.1 Central bank |
– |
– |
– |
– |
– |
– |
3.4.3.2 Deposit-taking corporations, except the central bank |
21748 |
15006 |
6743 |
31261 |
27330 |
3931 |
3.4.3.3 General government (External Assistance) |
4474 |
2364 |
2110 |
6360 |
2151 |
4209 |
3.4.3.4 Other sectors (External Commercial Borrowings) |
23245 |
14434 |
8811 |
15677 |
6157 |
9520 |
3.4.3B Loans by India |
2915 |
1761 |
1154 |
1109 |
1098 |
12 |
3.4.3.1 Central bank |
– |
– |
– |
– |
– |
– |
3.4.3.2 Deposit-taking corporations, except the central bank |
– |
– |
– |
– |
– |
– |
3.4.3.3 General government |
53 |
72 |
-19 |
57 |
76 |
-19 |
3.4.3.4 Other sectors |
2862 |
1689 |
1173 |
1052 |
1021 |
31 |
3.4.4 Insurance, pension, and standardized guarantee schemes |
– |
– |
– |
– |
– |
– |
3.4.5 Trade credit and advances |
75717 |
69908 |
5809 |
53582 |
45299 |
8283 |
3.4.5.1 Central bank |
– |
– |
– |
– |
– |
– |
3.4.5.2 General government |
– |
– |
– |
– |
– |
– |
3.4.5.3 Deposit-taking corporations |
– |
– |
– |
– |
– |
– |
3.4.5.4 Other sectors |
75717 |
69908 |
5809 |
53582 |
45299 |
8283 |
3.4.6 Other accounts receivable/payable-other |
8498 |
12257 |
-3759 |
5227 |
18522 |
-13295 |
3.4.7 Special drawing rights |
|
|
|
|
|
|
3.5 Reserve assets |
7093 |
– |
7093 |
– |
11019 |
-11019 |
3.5.1 Monetary gold |
– |
– |
– |
– |
– |
– |
3.5.2 Special drawing rights n.a. |
– |
– |
– |
– |
– |
– |
3.5.3 Reserve position in the IMF n.a. |
– |
– |
– |
– |
– |
– |
3.5.4 Other reserve assets (Foreign Currency Assets) |
7093 |
– |
7093 |
– |
11019 |
-11019 |
3.5.4.1 Currency, deposits and securities |
7093 |
– |
7093 |
– |
11019 |
-11019 |
3.5.4.2 Financial derivatives |
– |
– |
– |
– |
– |
– |
3.5.4.3 Other claims |
– |
– |
– |
– |
– |
– |
3 Total assets/liabilities |
361704 |
307160 |
54544 |
381842 |
340065 |
41777 |
of which: (by instrument): |
|
|
|
|
|
|
3.0.1 Equity and investment fund shares |
122332 |
103882 |
18449 |
181334 |
148092 |
33241 |
3.0.2 Debt instruments |
217496 |
185302 |
32194 |
193442 |
162432 |
31011 |
3.0.3 Other financial assets and liabilities |
21877 |
17976 |
3901 |
7066 |
29541 |
-22476 |
4 Net errors and omissions |
|
921 |
-921 |
– |
2206 |
-2206 |
Note: The comparable figures in new and old formats may not entirely agree due to rounding off. Total of subcomponents may not tally with aggregate due to rounding off.
P: Preliminary. PR: Partially Revised. R: Revised. |
Annex 1: India’s Overall Balance of Payments |
(US$ million) |
Item |
2007-08 (R) |
2008-09 (R) |
Credit |
Debit |
Net |
Credit |
Debit |
Net |
1 |
2 |
3 |
4 |
5 |
6 |
A. CURRENT ACCOUNT |
|
|
|
|
|
|
I. MERCHANDISE |
1,66,162 |
2,57,629 |
-91,467 |
1,89,001 |
3,08,520 |
-1,19,519 |
II. INVISIBLES (a+b+c) |
1,48,875 |
73,144 |
75,731 |
1,67,819 |
76,214 |
91,604 |
a) Services |
90,342 |
51,490 |
38,853 |
1,05,963 |
52,047 |
53,916 |
i) Travel |
11,349 |
9,258 |
2,091 |
10,894 |
9,425 |
1,469 |
ii) Transportation |
10,014 |
11,514 |
-1,500 |
11,310 |
12,820 |
-1,509 |
iii) Insurance |
1,639 |
1,044 |
595 |
1,422 |
1,130 |
292 |
iv) G.n.i.e. |
331 |
376 |
-45 |
389 |
793 |
-404 |
v) Miscellaneous |
67,010 |
29,298 |
37,712 |
81,947 |
27,879 |
54,069 |
of which |
|
|
|
|
|
|
Software Services |
40,300 |
3,358 |
36,942 |
46,300 |
2,564 |
43,736 |
Business Services |
16,772 |
16,553 |
219 |
18,602 |
15,318 |
3,285 |
Financial Services |
3,217 |
3,133 |
84 |
4,428 |
2,958 |
1,469 |
Communication Services |
2,408 |
860 |
1,548 |
2,298 |
1,087 |
1,211 |
b) Transfers |
44,261 |
2,316 |
41,945 |
47,547 |
2,749 |
44,798 |
i) Official |
753 |
514 |
239 |
645 |
413 |
232 |
ii) Private |
43,508 |
1,802 |
41,706 |
46,903 |
2,336 |
44,567 |
c) Income |
14,272 |
19,339 |
-5,068 |
14,309 |
21,419 |
-7,110 |
i) Investment Income |
13,811 |
18,244 |
-4,433 |
13,483 |
20,109 |
-6,626 |
ii) Compensation of Employees |
461 |
1,095 |
-635 |
825 |
1,309 |
-484 |
Total Current Account (I+II) |
3,15,037 |
3,30,774 |
-15,737 |
3,56,820 |
3,84,735 |
-27,914 |
B. CAPITAL ACCOUNT |
|
|
|
|
|
|
1. Foreign Investment (a+b) |
2,71,122 |
2,27,796 |
43,326 |
1,71,660 |
1,63,318 |
8,342 |
a) Foreign Direct Investment (i+ii) |
37,321 |
21,429 |
15,893 |
43,006 |
20,634 |
22,372 |
i) In India |
34,844 |
116 |
34,728 |
41,903 |
166 |
41,738 |
Equity |
26,865 |
108 |
26,757 |
32,096 |
166 |
31,930 |
Reinvested Earnings |
7,679 |
– |
7,679 |
9,030 |
– |
9,030 |
Other Capital |
300 |
8 |
292 |
777 |
– |
777 |
ii) Abroad |
2,477 |
21,312 |
-18,835 |
1,103 |
20,468 |
-19,365 |
Equity |
2,477 |
16,899 |
-14,422 |
1,103 |
13,283 |
-12,181 |
Reinvested Earnings |
– |
1,084 |
-1,084 |
– |
1,084 |
-1,084 |
Other Capital |
– |
3,330 |
-3,330 |
– |
6,100 |
-6,100 |
b) Portfolio Investment |
2,33,800 |
2,06,367 |
27,433 |
1,28,654 |
1,42,685 |
-14,030 |
i) In India |
2,33,564 |
2,06,294 |
27,270 |
1,28,512 |
1,42,365 |
-13,853 |
of which |
|
|
|
|
|
|
FIIs |
2,26,621 |
2,06,294 |
20,327 |
1,27,349 |
1,49,366 |
-15,017 |
ADR/GDRs |
6,645 |
– |
6,645 |
1,162 |
– |
1,162 |
ii) Abroad |
236 |
73 |
163 |
142 |
319 |
-177 |
2. Loans (a+b+c) |
82,192 |
41,539 |
40,653 |
62,217 |
53,902 |
8,314 |
a) External Assistance |
4,241 |
2,126 |
2,114 |
5,230 |
2,792 |
2,439 |
i) By India |
23 |
28 |
-4 |
71 |
417 |
-347 |
ii) To India |
4,217 |
2,098 |
2,119 |
5,159 |
2,374 |
2,785 |
b) Commercial Borrowings |
30,293 |
7,684 |
22,609 |
15,222 |
7,361 |
7,861 |
i) By India |
1,593 |
1,624 |
-31 |
1,997 |
783 |
1,214 |
ii) To India |
28,700 |
6,060 |
22,640 |
13,225 |
6,578 |
6,647 |
c) Short Term to India |
47,658 |
31,729 |
15,930 |
41,765 |
43,750 |
-1,985 |
i) Suppliers’ Credit > 180 days & Buyers’ Credit |
42,641 |
31,729 |
10,913 |
38,815 |
38,352 |
463 |
ii) Suppliers’ Credit up to 180 days |
5,017 |
– |
5,017 |
2,950 |
5,398 |
-2,448 |
3. Banking Capital (a+b) |
55,814 |
44,055 |
11,759 |
65,207 |
68,453 |
-3,245 |
a) Commercial Banks |
55,735 |
43,623 |
12,112 |
65,094 |
67,868 |
-2,774 |
i) Assets |
19,562 |
12,668 |
6,894 |
25,823 |
28,725 |
-2,902 |
ii) Liabilities |
36,173 |
30,955 |
5,217 |
39,270 |
39,142 |
128 |
of which: Non-Resident Deposits |
29,400 |
29,222 |
179 |
37,147 |
32,858 |
4,290 |
b) Others |
79 |
432 |
-353 |
114 |
585 |
-471 |
4. Rupee Debt Service |
– |
122 |
-122 |
– |
100 |
-100 |
5. Other Capital |
29,229 |
18,261 |
10,969 |
16,685 |
22,602 |
-5,916 |
Total Capital Account (1 to 5) |
4,38,357 |
3,31,772 |
1,06,585 |
3,15,770 |
3,08,375 |
7,395 |
C. Errors & Omissions |
1,316 |
– |
1,316 |
440 |
– |
440 |
D. Overall Balance (Total Current Account, Capital Account and Errors & Omissions (A+B+C)) |
7,54,710 |
6,62,546 |
92,164 |
6,73,030 |
6,93,109 |
-20,080 |
E. Monetary Movements (i+ii) |
– |
92,164 |
-92,164 |
20,080 |
– |
20,080 |
i) I.M.F. |
– |
– |
– |
– |
– |
– |
ii) Foreign Exchange Reserves (Increase - / Decrease +) |
– |
92,164 |
-92,164 |
20,080 |
– |
20,080 |
of which: SDR allocation |
– |
– |
– |
– |
– |
– |
Annex 1: India’s Overall Balance of Payments (Contd.) |
(US$ million) |
Item |
2009-10 (R) |
2010-11 (PR) |
Credit |
Debit |
Net |
Credit |
Debit |
Net |
7 |
8 |
9 |
10 |
11 |
12 |
A. CURRENT ACCOUNT |
|
|
|
|
|
|
I. MERCHANDISE |
1,82,442 |
3,00,644 |
-1,18,203 |
2,50,468 |
3,81,061 |
-1,30,593 |
II. INVISIBLES (a+b+c) |
1,63,430 |
83,408 |
80,022 |
1,98,248 |
1,13,600 |
84,647 |
a) Services |
96,045 |
60,029 |
36,016 |
1,32,880 |
84,064 |
48,816 |
i) Travel |
11,859 |
9,343 |
2,517 |
15,275 |
11,108 |
4,167 |
ii) Transportation |
11,178 |
11,933 |
-756 |
14,271 |
13,880 |
391 |
iii) Insurance |
1,591 |
1,285 |
306 |
1,948 |
1,400 |
549 |
iv) G.n.i.e. |
441 |
525 |
-84 |
535 |
820 |
-285 |
v) Miscellaneous |
70,977 |
36,944 |
34,033 |
1,00,851 |
56,856 |
43,995 |
of which |
|
|
|
|
|
|
Software Services |
49,705 |
1,468 |
48,237 |
55,460 |
2,194 |
53,265 |
Business Services |
11,321 |
18,049 |
-6,728 |
24,050 |
27,765 |
-3,715 |
Financial Services |
3,693 |
4,642 |
-950 |
6,508 |
7,483 |
-975 |
Communication Services |
1,228 |
1,355 |
-127 |
1,562 |
1,152 |
410 |
b) Transfers |
54,363 |
2,318 |
52,045 |
56,265 |
3,125 |
53,140 |
i) Official |
727 |
473 |
254 |
647 |
631 |
16 |
ii) Private |
53,636 |
1,845 |
51,791 |
55,618 |
2,494 |
53,125 |
c) Income |
13,022 |
21,061 |
-8,038 |
9,102 |
26,412 |
-17,309 |
i) Investment Income |
12,108 |
19,355 |
-7,248 |
7,986 |
24,384 |
-16,398 |
ii) Compensation of Employees |
915 |
1,705 |
-791 |
1,116 |
2,028 |
-912 |
Total Current Account (I+II) |
3,45,872 |
3,84,052 |
-38,181 |
4,48,716 |
4,94,661 |
-45,945 |
B. CAPITAL ACCOUNT |
|
|
|
|
|
|
1. Foreign Investment (a+b) |
1,98,653 |
1,48,291 |
50,362 |
2,89,416 |
2,49,763 |
39,652 |
a) Foreign Direct Investment (i+ii) |
38,484 |
20,518 |
17,966 |
35,464 |
26,104 |
9,360 |
i) In India |
37,746 |
4,637 |
33,109 |
32,902 |
7,018 |
25,884 |
Equity |
27,146 |
4,241 |
22,905 |
20,304 |
6,514 |
13,791 |
Reinvested Earnings |
8,669 |
– |
8,669 |
11,939 |
– |
11,939 |
Other Capital |
1,931 |
396 |
1,535 |
658 |
504 |
154 |
ii) Abroad |
738 |
15,881 |
-15,143 |
2,562 |
19,086 |
-16,524 |
Equity |
738 |
10,609 |
-9,871 |
2,562 |
10,537 |
-7,975 |
Reinvested Earnings |
– |
1,084 |
-1,084 |
– |
1,084 |
-1,084 |
Other Capital |
– |
4,188 |
-4,188 |
– |
7,465 |
-7,465 |
b) Portfolio Investment |
1,60,169 |
1,27,773 |
32,396 |
2,53,952 |
2,23,660 |
30,293 |
i) In India |
1,59,897 |
1,27,521 |
32,376 |
2,53,175 |
2,21,704 |
31,471 |
of which |
|
|
|
|
|
|
FIIs |
1,56,570 |
1,27,521 |
29,049 |
2,51,125 |
2,21,704 |
29,422 |
ADR/GDRs |
3,328 |
– |
3,328 |
2,049 |
– |
2,049 |
ii) Abroad |
272 |
252 |
20 |
777 |
1,956 |
-1,179 |
2. Loans (a+b+c) |
74,163 |
61,716 |
12,447 |
1,07,726 |
79,289 |
28,437 |
a) External Assistance |
5,897 |
3,007 |
2,890 |
7,882 |
2,941 |
4,941 |
i) By India |
51 |
422 |
-371 |
76 |
102 |
-26 |
ii) To India |
5,846 |
2,585 |
3,261 |
7,806 |
2,840 |
4,967 |
b) Commercial Borrowings |
15,003 |
13,003 |
2,000 |
24,113 |
11,606 |
12,506 |
i) By India |
973 |
1,505 |
-531 |
1,840 |
1,513 |
328 |
ii) To India |
14,029 |
11,498 |
2,531 |
22,272 |
10,094 |
12,179 |
c) Short Term to India |
53,264 |
45,706 |
7,558 |
75,732 |
64,742 |
10,990 |
i) Suppliers’ Credit > 180 days & Buyers’ Credit |
48,571 |
43,914 |
4,657 |
72,086 |
64,742 |
7,344 |
ii) Suppliers’ Credit up to 180 days |
4,693 |
1,792 |
2,901 |
3,646 |
– |
3,646 |
3. Banking Capital (a+b) |
61,499 |
59,416 |
2,083 |
92,323 |
87,361 |
4,962 |
a) Commercial Banks |
60,893 |
58,966 |
1,927 |
90,621 |
86,189 |
4,433 |
i) Assets |
17,097 |
15,259 |
1,838 |
35,369 |
38,666 |
-3,297 |
ii) Liabilities |
43,796 |
43,707 |
88 |
55,252 |
47,523 |
7,730 |
of which: Non-Resident Deposits |
41,355 |
38,433 |
2,922 |
49,252 |
46,014 |
3,238 |
b) Others |
606 |
449 |
157 |
1,702 |
1,172 |
529 |
4. Rupee Debt Service |
– |
97 |
-97 |
– |
68 |
-68 |
5. Other Capital |
11,451 |
24,613 |
-13,162 |
9,890 |
20,885 |
-10,994 |
Total Capital Account (1 to 5) |
3,45,766 |
2,94,132 |
51,634 |
4,99,355 |
4,37,366 |
61,989 |
C. Errors & Omissions |
– |
12 |
-12 |
– |
2,993 |
-2,993 |
D. Overall Balance (Total Current Account, Capital Account and Errors & Omissions (A+B+C)) |
6,91,638 |
6,78,197 |
13,441 |
9,48,071 |
9,35,021 |
13,050 |
E. Monetary Movements (i+ii) |
– |
13,441 |
-13,441 |
– |
13,050 |
-13,050 |
i) I.M.F. |
– |
– |
– |
– |
– |
– |
ii) Foreign Exchange Reserves (Increase - / Decrease +) |
– |
13,441 |
-13,441 |
– |
13,050 |
-13,050 |
of which: SDR allocation |
– |
5,160 |
-5,160 |
– |
– |
– |
Annex 1: India’s Overall Balance of Payments (Contd.) |
(US$ million) |
Item |
Apr-Jun 2008 (R) |
Jul-Sept 2008 (R) |
Credit |
Debit |
Net |
Credit |
Debit |
Net |
|
13 |
14 |
15 |
16 |
17 |
18 |
A. CURRENT ACCOUNT |
|
|
|
|
|
|
I. MERCHANDISE |
57,454 |
82,655 |
-25,200 |
53,630 |
92,752 |
-39,121 |
II. INVISIBLES (a+b+c) |
39,985 |
18,186 |
21,799 |
46,919 |
20,062 |
26,857 |
a) Services |
23,616 |
12,344 |
11,271 |
29,001 |
13,525 |
15,476 |
i) Travel |
2,504 |
2,164 |
341 |
2,786 |
2,711 |
75 |
ii) Transportation |
2,615 |
3,328 |
-713 |
3,041 |
3,751 |
-710 |
iii) Insurance |
350 |
227 |
123 |
377 |
306 |
71 |
iv) G.n.i.e. |
130 |
110 |
19 |
81 |
95 |
-14 |
v) Miscellaneous |
18,017 |
6,515 |
11,501 |
22,716 |
6,662 |
16,054 |
of which |
|
|
|
|
|
|
Software Services |
12,081 |
844 |
11,237 |
12,120 |
685 |
11,435 |
Business Services |
4,087 |
3,217 |
869 |
5,410 |
3,916 |
1,494 |
Financial Services |
615 |
620 |
-5 |
1,673 |
966 |
707 |
Communication Services |
510 |
227 |
284 |
740 |
296 |
444 |
b) Transfers |
12,797 |
654 |
12,143 |
13,773 |
831 |
12,942 |
i) Official |
148 |
107 |
40 |
51 |
97 |
-46 |
ii) Private |
12,649 |
547 |
12,102 |
13,722 |
734 |
12,988 |
c) Income |
3,573 |
5,187 |
-1,615 |
4,145 |
5,706 |
-1,561 |
i) Investment Income |
3,418 |
4,859 |
-1,441 |
3,855 |
5,375 |
-1,520 |
ii) Compensation of Employees |
155 |
328 |
-174 |
290 |
331 |
-41 |
Total Current Account (I+II) |
97,440 |
1,00,841 |
-3,401 |
1,00,549 |
1,12,814 |
-12,264 |
B. CAPITAL ACCOUNT |
|
|
|
|
|
|
1. Foreign Investment (a+b) |
53,674 |
48,936 |
4,737 |
52,550 |
47,702 |
4,848 |
a) Foreign Direct Investment (i+ii) |
12,906 |
3,962 |
8,944 |
9,920 |
3,761 |
6,159 |
i) In India |
12,670 |
21 |
12,649 |
9,604 |
52 |
9,552 |
Equity |
10,248 |
21 |
10,227 |
7,312 |
52 |
7,260 |
Reinvested Earnings |
2,258 |
– |
2,258 |
2,258 |
– |
2,258 |
Other Capital |
164 |
– |
164 |
34 |
– |
34 |
ii) Abroad |
236 |
3,940 |
-3,705 |
316 |
3,709 |
-3,393 |
Equity |
236 |
2,519 |
-2,283 |
316 |
2,775 |
-2,460 |
Reinvested Earnings |
– |
271 |
-271 |
– |
271 |
-271 |
Other Capital |
– |
1,151 |
-1,151 |
– |
662 |
-662 |
b) Portfolio Investment |
40,768 |
44,975 |
-4,207 |
42,630 |
43,942 |
-1,311 |
i) In India |
40,745 |
44,923 |
-4,177 |
42,618 |
43,919 |
-1,302 |
of which |
|
|
|
|
|
|
FIIs |
39,746 |
44,923 |
-5,177 |
42,482 |
43,919 |
-1,437 |
ADR/GDRs |
999 |
– |
999 |
136 |
– |
136 |
ii) Abroad |
22 |
52 |
-29 |
13 |
22 |
-10 |
2. Loans (a+b+c) |
15,900 |
9,705 |
6,195 |
16,305 |
13,739 |
2,566 |
a) External Assistance |
940 |
656 |
284 |
1,122 |
673 |
449 |
i) By India |
18 |
104 |
-87 |
18 |
104 |
-87 |
ii) To India |
923 |
551 |
371 |
1,104 |
569 |
535 |
b) Commercial Borrowings |
2,754 |
1,271 |
1,483 |
3,574 |
1,859 |
1,715 |
i) By India |
403 |
190 |
213 |
532 |
138 |
393 |
ii) To India |
2,351 |
1,080 |
1,270 |
3,042 |
1,721 |
1,321 |
c) Short Term to India |
12,206 |
7,779 |
4,427 |
11,609 |
11,207 |
402 |
i) Suppliers’ Credit > 180 days & Buyers’ Credit |
9,256 |
7,779 |
1,477 |
11,609 |
9,766 |
1,843 |
ii) Suppliers’ Credit up to 180 days |
2,950 |
– |
2,950 |
– |
1,441 |
-1,441 |
3. Banking Capital (a+b) |
21,987 |
19,291 |
2,696 |
16,360 |
14,086 |
2,275 |
a) Commercial Banks |
21,987 |
19,140 |
2,847 |
16,360 |
14,083 |
2,277 |
i) Assets |
11,457 |
10,533 |
924 |
6,596 |
5,154 |
1,442 |
ii) Liabilities |
10,530 |
8,607 |
1,923 |
9,764 |
8,929 |
835 |
of which: Non-Resident Deposits |
9,098 |
8,284 |
814 |
9,176 |
8,917 |
259 |
b) Others |
– |
151 |
-151 |
– |
3 |
-3 |
4. Rupee Debt Service |
– |
30 |
-30 |
– |
3 |
-3 |
5. Other Capital |
4,644 |
13,015 |
-8,371 |
4,776 |
7,682 |
-2,906 |
Total Capital Account (1 to 5) |
96,206 |
90,978 |
5,228 |
89,992 |
83,212 |
6,780 |
C. Errors & Omissions |
408 |
– |
408 |
750 |
– |
750 |
D. Overall Balance (Total Current Account, Capital Account and Errors & Omissions (A+B+C)) |
1,94,053 |
1,91,818 |
2,235 |
1,91,291 |
196025 |
-4,734 |
E. Monetary Movements (i+ii) |
– |
2235 |
-2235 |
4734 |
– |
4734 |
i) I.M.F. |
– |
– |
– |
– |
– |
– |
ii) Foreign Exchange Reserves (Increase - / Decrease +) |
– |
2235 |
-2235 |
4734 |
– |
4734 |
of which: SDR allocation |
– |
– |
– |
– |
– |
– |
Annex 1: India’s Overall Balance of Payments (Contd.) |
(US$ million) |
Item |
Oct-Dec 2008 (R) |
Jan-Mar 2009 (R) |
Credit |
Debit |
Net |
Credit |
Debit |
Net |
|
19 |
20 |
21 |
22 |
23 |
24 |
A. CURRENT ACCOUNT |
|
|
|
|
|
|
I. MERCHANDISE |
39,436 |
74,428 |
-34,994 |
38,481 |
58,686 |
-20,205 |
II. INVISIBLES (a+b+c) |
42,416 |
19,294 |
23,123 |
38,498 |
18,673 |
19,826 |
a) Services |
28,228 |
13,099 |
15,129 |
25,119 |
13,078 |
12,040 |
i) Travel |
2,924 |
1,946 |
979 |
2,680 |
2,606 |
74 |
ii) Transportation |
2,738 |
3,241 |
-503 |
2,916 |
2,499 |
417 |
iii) Insurance |
347 |
268 |
80 |
348 |
329 |
18 |
iv) G.n.i.e. |
97 |
233 |
-136 |
81 |
355 |
-273 |
v) Miscellaneous |
22,121 |
7,412 |
14,709 |
19,094 |
7,289 |
11,804 |
of which |
|
|
|
|
|
|
Software Services |
11,274 |
580 |
10,694 |
10,825 |
455 |
10,370 |
Business Services |
4,851 |
3,568 |
1,283 |
4,255 |
4,616 |
-362 |
Financial Services |
1,112 |
740 |
372 |
1,028 |
633 |
395 |
Communication Services |
547 |
257 |
291 |
501 |
308 |
193 |
b) Transfers |
10,997 |
845 |
10,151 |
9,980 |
419 |
9,562 |
i) Official |
285 |
98 |
187 |
161 |
111 |
50 |
ii) Private |
10,712 |
748 |
9,964 |
9,820 |
308 |
9,512 |
c) Income |
3,192 |
5,349 |
-2,157 |
3,399 |
5,176 |
-1,777 |
i) Investment Income |
3,000 |
5,011 |
-2,011 |
3,210 |
4,864 |
-1,654 |
ii) Compensation of Employees |
192 |
338 |
-146 |
189 |
312 |
-123 |
Total Current Account (I+II) |
81,852 |
93,722 |
-11,871 |
76,979 |
77,359 |
-380 |
B. CAPITAL ACCOUNT |
|
|
|
|
|
|
1. Foreign Investment (a+b) |
37,774 |
40,654 |
-2,879 |
27,662 |
26,026 |
1,636 |
a) Foreign Direct Investment (i+ii) |
11,177 |
8,236 |
2,941 |
9,003 |
4,675 |
4,328 |
i) In India |
10,966 |
29 |
10,937 |
8,662 |
63 |
8,599 |
Equity |
8,182 |
29 |
8,153 |
6,352 |
63 |
6,289 |
Reinvested Earnings |
2,258 |
– |
2,258 |
2,258 |
– |
2,258 |
Other Capital |
526 |
– |
526 |
52 |
– |
52 |
ii) Abroad |
210 |
8,207 |
-7,996 |
341 |
4,612 |
-4,271 |
Equity |
210 |
4,217 |
-4,007 |
341 |
3,772 |
-3,432 |
Reinvested Earnings |
– |
271 |
-271 |
– |
271 |
-271 |
Other Capital |
– |
3,719 |
-3,719 |
– |
569 |
-569 |
b) Portfolio Investment |
26,598 |
32,418 |
-5,820 |
18,658 |
21,350 |
-2,692 |
i) In India |
26,568 |
32,355 |
-5,786 |
18,580 |
21,169 |
-2,588 |
of which |
|
|
|
|
|
|
FIIs |
26,561 |
32,355 |
-5,794 |
18,560 |
21,169 |
-2,609 |
ADR/GDRs |
7 |
– |
7 |
20 |
– |
20 |
ii) Abroad |
29 |
63 |
-34 |
78 |
182 |
-104 |
2. Loans (a+b+c) |
15,802 |
15,419 |
383 |
14,210 |
15,039 |
-829 |
a) External Assistance |
1,692 |
759 |
933 |
1,477 |
704 |
773 |
i) By India |
18 |
104 |
-87 |
18 |
104 |
-87 |
ii) To India |
1,674 |
655 |
1,019 |
1,459 |
600 |
859 |
b) Commercial Borrowings |
5,395 |
1,724 |
3,671 |
3,499 |
2,508 |
991 |
i) By India |
662 |
148 |
514 |
399 |
306 |
93 |
ii) To India |
4,733 |
1,576 |
3,157 |
3,100 |
2,201 |
898 |
c) Short Term to India |
8,715 |
12,936 |
-4,221 |
9,234 |
11,828 |
-2,594 |
i) Suppliers’ Credit > 180 days & Buyers’ Credit |
8,715 |
10,357 |
-1,642 |
9,234 |
10,450 |
-1,216 |
ii) Suppliers’ Credit up to 180 days |
– |
2,579 |
-2,579 |
– |
1,378 |
-1,378 |
3. Banking Capital (a+b) |
14,830 |
19,786 |
-4,956 |
12,030 |
15,290 |
-3,260 |
a) Commercial Banks |
14,827 |
19,355 |
-4,528 |
11,919 |
15,290 |
-3,371 |
i) Assets |
5,192 |
7,541 |
-2,349 |
2,578 |
5,498 |
-2,920 |
ii) Liabilities |
9,636 |
11,814 |
-2,178 |
9,341 |
9,792 |
-451 |
of which: Non-Resident Deposits |
9,543 |
8,501 |
1,042 |
9,331 |
7,155 |
2,176 |
b) Others |
2 |
431 |
-429 |
111 |
– |
111 |
4. Rupee Debt Service |
– |
– |
– |
– |
68 |
-68 |
5. Other Capital |
3,150 |
693 |
2,458 |
4,114 |
1,212 |
2,903 |
Total Capital Account (1 to 5) |
71,557 |
76,551 |
-4,995 |
58,016 |
57,634 |
382 |
C. Errors & Omissions |
– |
1,016 |
-1,016 |
298 |
– |
298 |
D. Overall Balance (Total Current Account, Capital Account and Errors & Omissions (A+B+C)) |
1,53,408 |
1,71,289 |
-17,881 |
1,35,293 |
1,34,993 |
300 |
E. Monetary Movements (i+ii) |
17881 |
– |
17881 |
– |
300 |
-300 |
i) I.M.F. |
– |
– |
– |
– |
– |
– |
ii) Foreign Exchange Reserves (Increase - / Decrease +) |
17881 |
– |
17881 |
– |
300 |
-300 |
of which: SDR allocation |
– |
– |
– |
– |
– |
– |
Annex 1: India’s Overall Balance of Payments (Contd.) |
(US$ million) |
Item |
Apr-Jun 2009 (R) |
July-Sept 2009 (R) |
Credit |
Debit |
Net |
Credit |
Debit |
Net |
|
25 |
26 |
27 |
28 |
29 |
30 |
A. CURRENT ACCOUNT |
|
|
|
|
|
|
I. MERCHANDISE |
39,166 |
65,447 |
-26,280 |
43,403 |
72,994 |
-29,592 |
II. INVISIBLES (a+b+c) |
38,710 |
16,582 |
22,128 |
40,488 |
20,092 |
20,396 |
a) Services |
22,414 |
10,954 |
11,460 |
21,352 |
13,704 |
7,648 |
i) Travel |
2,297 |
2,035 |
262 |
2,719 |
2,357 |
362 |
ii) Transportation |
2,501 |
2,777 |
-276 |
2,570 |
2,221 |
350 |
iii) Insurance |
388 |
314 |
74 |
384 |
341 |
44 |
iv) G.n.i.e. |
100 |
103 |
-3 |
100 |
130 |
-29 |
v) Miscellaneous |
17,127 |
5,725 |
11,403 |
15,578 |
8,656 |
6,922 |
of which |
|
|
|
|
|
|
Software Services |
11,004 |
391 |
10,613 |
11,207 |
438 |
10,769 |
Business Services |
2,586 |
3,295 |
-709 |
2,504 |
4,612 |
-2,109 |
Financial Services |
1,116 |
835 |
282 |
732 |
1,135 |
-403 |
Communication Services |
418 |
278 |
140 |
307 |
313 |
-6 |
b) Transfers |
13,345 |
469 |
12,876 |
14,386 |
569 |
13,817 |
i) Official |
47 |
110 |
-63 |
169 |
108 |
60 |
ii) Private |
13,298 |
360 |
12,939 |
14,217 |
460 |
13,757 |
c) Income |
2,951 |
5,159 |
-2,208 |
4,750 |
5,819 |
-1,069 |
i) Investment Income |
2,723 |
4,808 |
-2,085 |
4,544 |
5,477 |
-933 |
ii) Compensation of Employees |
227 |
351 |
-124 |
205 |
342 |
-137 |
Total Current Account (I+II) |
77,876 |
82,028 |
-4,152 |
83,890 |
93,086 |
-9,196 |
B. CAPITAL ACCOUNT |
|
|
|
|
|
|
1. Foreign Investment (a+b) |
48,575 |
35,337 |
13,239 |
55,911 |
38,808 |
17,103 |
a) Foreign Direct Investment (i+ii) |
9,950 |
4,980 |
4,970 |
11,551 |
4,126 |
7,425 |
i) In India |
9,825 |
926 |
8,900 |
11,455 |
632 |
10,824 |
Equity |
7,290 |
900 |
6,390 |
8,547 |
597 |
7,950 |
Reinvested Earnings |
2,167 |
– |
2,167 |
2,167 |
– |
2,167 |
Other Capital |
368 |
26 |
342 |
741 |
35 |
707 |
ii) Abroad |
125 |
4,054 |
-3,929 |
95 |
3,494 |
-3,399 |
Equity |
125 |
2,837 |
-2,713 |
95 |
2,131 |
-2,035 |
Reinvested Earnings |
– |
271 |
-271 |
– |
271 |
-271 |
Other Capital |
– |
946 |
-946 |
– |
1,092 |
-1,092 |
b) Portfolio Investment |
38,625 |
30,357 |
8,268 |
44,360 |
34,683 |
9,678 |
i) In India |
38,602 |
30,332 |
8,270 |
44,356 |
34,655 |
9,701 |
of which |
|
|
|
|
|
|
FIIs |
38,559 |
30,332 |
8,227 |
41,693 |
34,655 |
7,038 |
ADR/GDRs |
43 |
– |
43 |
2,664 |
– |
2,664 |
ii) Abroad |
23 |
25 |
-2 |
4 |
28 |
-24 |
2. Loans (a+b+c) |
13,111 |
14,528 |
-1,417 |
16,688 |
13,530 |
3,158 |
a) External Assistance |
1,014 |
729 |
285 |
1,477 |
741 |
736 |
i) By India |
13 |
105 |
-93 |
13 |
105 |
-93 |
ii) To India |
1,001 |
623 |
378 |
1,464 |
635 |
829 |
b) Commercial Borrowings |
1,972 |
2,418 |
-446 |
3,283 |
2,068 |
1,215 |
i) By India |
244 |
333 |
-89 |
206 |
215 |
-9 |
ii) To India |
1,728 |
2,085 |
-357 |
3,077 |
1,853 |
1,224 |
c) Short Term to India |
10,126 |
11,382 |
-1,256 |
11,928 |
10,721 |
1,206 |
i) Suppliers’ Credit > 180 days & Buyers’ Credit |
10,126 |
9,590 |
536 |
10,994 |
10,721 |
272 |
ii) Suppliers’ Credit up to 180 days |
– |
1,792 |
-1,792 |
934 |
– |
934 |
3. Banking Capital (a+b) |
15,577 |
18,942 |
-3,365 |
16,544 |
12,132 |
4,411 |
a) Commercial Banks |
15,577 |
18,704 |
-3,127 |
16,544 |
11,989 |
4,555 |
i) Assets |
4,368 |
6,946 |
-2,578 |
6,131 |
1,730 |
4,402 |
ii) Liabilities |
11,209 |
11,758 |
-549 |
10,412 |
10,259 |
153 |
of which: Non-Resident Deposits |
11,172 |
9,354 |
1,817 |
10,342 |
9,295 |
1,047 |
b) Others |
– |
238 |
-238 |
– |
143 |
-143 |
4. Rupee Debt Service |
– |
23 |
-23 |
– |
1 |
-1 |
5. Other Capital |
545 |
5,169 |
-4,625 |
6,899 |
12,315 |
-5,416 |
Total Capital Account (1 to 5) |
77,808 |
73,999 |
3,809 |
96,041 |
76,786 |
19,255 |
C. Errors & Omissions |
458 |
– |
458 |
– |
641 |
-641 |
D. Overall Balance (Total Current Account, Capital Account and Errors & Omissions (A+B+C)) |
1,56,143 |
1,56,028 |
115 |
1,79,931 |
1,70,513 |
9,418 |
E. Monetary Movements (i+ii) |
– |
115 |
-115 |
– |
9,418 |
-9,418 |
i) I.M.F. |
– |
– |
– |
– |
– |
– |
ii) Foreign Exchange Reserves (Increase - / Decrease +) |
– |
115 |
-115 |
– |
9,418 |
-9,418 |
of which: SDR allocation |
– |
– |
– |
– |
5160 |
-5160 |
Annex 1: India’s Overall Balance of Payments (Contd.) |
(US$ million) |
Item |
Oct-Dec 2009 (R) |
Jan- Mar 2010 (R) |
Credit |
Debit |
Net |
Credit |
Debit |
Net |
|
31 |
32 |
33 |
34 |
35 |
36 |
A. CURRENT ACCOUNT |
|
|
|
|
|
|
I. MERCHANDISE |
47,170 |
78,100 |
-30,929 |
52,702 |
84,104 |
-31,401 |
II. INVISIBLES (a+b+c) |
40,495 |
21,749 |
18,745 |
43,738 |
24,985 |
18,753 |
a) Services |
24,443 |
15,994 |
8,450 |
27,835 |
19,378 |
8,457 |
i) Travel |
3,440 |
2,312 |
1,127 |
3,403 |
2,638 |
766 |
ii) Transportation |
2,992 |
3,366 |
-375 |
3,115 |
3,570 |
-455 |
iii) Insurance |
395 |
305 |
90 |
423 |
326 |
97 |
iv) G.n.i.e. |
124 |
134 |
-9 |
116 |
159 |
-42 |
v) Miscellaneous |
17,493 |
9,876 |
7,617 |
20,778 |
12,686 |
8,092 |
of which |
|
|
|
|
|
|
Software Services |
13,197 |
333 |
12,865 |
14,297 |
307 |
13,990 |
Business Services |
2,413 |
4,571 |
-2,158 |
3,818 |
5,571 |
-1,753 |
Financial Services |
741 |
1,156 |
-415 |
1,103 |
1,517 |
-414 |
Communication Services |
259 |
381 |
-122 |
245 |
383 |
-139 |
b) Transfers |
13,416 |
638 |
12,777 |
13,217 |
642 |
12,575 |
i) Official |
385 |
113 |
271 |
127 |
142 |
-15 |
ii) Private |
13,031 |
525 |
12,506 |
13,090 |
500 |
12,590 |
c) Income |
2,636 |
5,118 |
-2,482 |
2,686 |
4,965 |
-2,279 |
i) Investment Income |
2,385 |
4,597 |
-2,212 |
2,455 |
4,473 |
-2,018 |
ii) Compensation of Employees |
251 |
520 |
-269 |
231 |
492 |
-261 |
Total Current Account (I+II) |
87,665 |
99,849 |
-12,184 |
96,441 |
1,09,089 |
-12,648 |
B. CAPITAL ACCOUNT |
|
|
|
|
|
|
1. Foreign Investment (a+b) |
44,703 |
36,226 |
8,476 |
49,464 |
37,919 |
11,545 |
a) Foreign Direct Investment (i+ii) |
8,922 |
6,131 |
2,791 |
8,061 |
5,281 |
2,780 |
i) In India |
8,728 |
1,469 |
7,260 |
7,737 |
1,611 |
6,126 |
Equity |
5,956 |
1,233 |
4,724 |
5,353 |
1,512 |
3,841 |
Reinvested Earnings |
2,167 |
– |
2,167 |
2,167 |
– |
2,167 |
Other Capital |
605 |
236 |
369 |
217 |
99 |
118 |
ii) Abroad |
194 |
4,663 |
-4,469 |
324 |
3,671 |
-3,346 |
Equity |
194 |
3,640 |
-3,446 |
324 |
2,001 |
-1,677 |
Reinvested Earnings |
– |
271 |
-271 |
– |
271 |
-271 |
Other Capital |
– |
752 |
-752 |
– |
1,398 |
-1,398 |
b) Portfolio Investment |
35,781 |
30,095 |
5,685 |
41,403 |
32,638 |
8,765 |
i) In India |
35,770 |
30,041 |
5,729 |
41,169 |
32,493 |
8,675 |
of which |
|
|
|
|
|
|
FIIs |
35,295 |
30,041 |
5,254 |
41,023 |
32,493 |
8,529 |
ADR/GDRs |
475 |
– |
475 |
146 |
– |
146 |
ii) Abroad |
11 |
55 |
-44 |
234 |
144 |
89 |
2. Loans (a+b+c) |
20,061 |
14,369 |
5,692 |
24,303 |
19,289 |
5,014 |
a) External Assistance |
1,646 |
803 |
843 |
1,760 |
735 |
1,025 |
i) By India |
13 |
105 |
-93 |
13 |
105 |
-93 |
ii) To India |
1,633 |
697 |
936 |
1,748 |
630 |
1,118 |
b) Commercial Borrowings |
4,508 |
2,812 |
1,696 |
5,240 |
5,705 |
-465 |
i) By India |
227 |
570 |
-343 |
297 |
387 |
-90 |
ii) To India |
4,281 |
2,242 |
2,039 |
4,943 |
5,318 |
-375 |
c) Short Term to India |
13,907 |
10,754 |
3,153 |
17,303 |
12,849 |
4,454 |
i) Suppliers’ Credit > 180 days & Buyers’ Credit |
12,055 |
10,754 |
1,301 |
15,396 |
12,849 |
2,547 |
ii) Suppliers’ Credit up to 180 days |
1,852 |
– |
1,852 |
1,907 |
– |
1,907 |
3. Banking Capital (a+b) |
15,172 |
13,232 |
1,939 |
14,207 |
15,109 |
-902 |
a) Commercial Banks |
14,578 |
13,165 |
1,413 |
14,195 |
15,109 |
-914 |
i) Assets |
3,067 |
1,874 |
1,193 |
3,531 |
4,709 |
-1,179 |
ii) Liabilities |
11,511 |
11,291 |
220 |
10,664 |
10,399 |
265 |
of which: Non-Resident Deposits |
10,177 |
9,568 |
608 |
9,665 |
10,215 |
-551 |
b) Others |
594 |
67 |
526 |
12 |
– |
12 |
4. Rupee Debt Service |
– |
– |
– |
– |
73 |
-73 |
5. Other Capital |
1,602 |
3,338 |
-1,736 |
2,405 |
3,791 |
-1,385 |
Total Capital Account (1 to 5) |
81,538 |
67,166 |
14,372 |
90,379 |
76,181 |
14,198 |
C. Errors & Omissions |
– |
421 |
-421 |
591 |
– |
591 |
D. Overall Balance (Total Current Account, Capital Account and Errors & Omissions (A+B+C)) |
1,69,203 |
1,67,435 |
1,767 |
1,87,411 |
1,85,270 |
2,141 |
E. Monetary Movements (i+ii) |
– |
1,767 |
-1,767 |
– |
2,141 |
-2,141 |
i) I.M.F. |
– |
– |
– |
– |
– |
– |
ii) Foreign Exchange Reserves (Increase - / Decrease +) |
– |
1,767 |
-1,767 |
– |
2,141 |
-2,141 |
of which: SDR allocation |
– |
– |
– |
– |
– |
– |
Annex 1: India’s Overall Balance of Payments (Contd.) |
(US$ million) |
Item |
Apr-Jun 2010 (PR) |
Jul-Sept 2010 (PR) |
Credit |
Debit |
Net |
Credit |
Debit |
Net |
37 |
38 |
39 |
40 |
41 |
42 |
A. CURRENT ACCOUNT |
|
|
|
|
|
|
I. MERCHANDISE |
55,301 |
87,209 |
-31,907 |
52,029 |
89,005 |
-36,975 |
II. INVISIBLES (a+b+c) |
43,260 |
24,051 |
19,209 |
47,051 |
26,977 |
20,074 |
a) Services |
26,650 |
17,014 |
9,636 |
31,425 |
19,543 |
11,881 |
i) Travel |
2,949 |
2,307 |
642 |
3,379 |
2,747 |
632 |
ii) Transportation |
3,143 |
3,134 |
9 |
3,270 |
3,524 |
-254 |
iii) Insurance |
410 |
310 |
100 |
441 |
386 |
55 |
iv) G.n.i.e. |
94 |
143 |
-49 |
125 |
205 |
-80 |
v) Miscellaneous |
20,054 |
11,120 |
8,934 |
24,210 |
12,682 |
11,528 |
of which |
|
|
|
|
|
|
Software Services |
12,327 |
575 |
11,752 |
12,455 |
585 |
11,869 |
Business Services |
4,819 |
5,892 |
-1,073 |
5,942 |
6,966 |
-1,024 |
Financial Services |
1,228 |
1,404 |
-176 |
1,819 |
1,905 |
-87 |
Communication Services |
325 |
241 |
83 |
417 |
266 |
152 |
b) Transfers |
13,754 |
727 |
13,027 |
13,653 |
677 |
12,976 |
i) Official |
59 |
141 |
-83 |
141 |
137 |
4 |
ii) Private |
13,695 |
585 |
13,110 |
13,513 |
540 |
12,973 |
c) Income |
2,855 |
6,310 |
-3,455 |
1,973 |
6,756 |
-4,783 |
i) Investment Income |
2,628 |
5,828 |
-3,199 |
1,726 |
6,322 |
-4,596 |
ii) Compensation of Employees |
227 |
482 |
-255 |
247 |
434 |
-188 |
Total Current Account (I+II) |
98,561 |
1,11,260 |
-12,698 |
99,080 |
1,15,981 |
-16,901 |
B. CAPITAL ACCOUNT |
|
|
|
|
|
|
1. Foreign Investment (a+b) |
53,410 |
45,331 |
8,079 |
68,418 |
45,662 |
22,756 |
a) Foreign Direct Investment (i+ii) |
9,344 |
5,870 |
3,474 |
9,162 |
5,596 |
3,565 |
i) In India |
9,050 |
2,302 |
6,748 |
8,584 |
1,097 |
7,487 |
Equity |
5,991 |
2,278 |
3,713 |
5,452 |
1,034 |
4,418 |
Reinvested Earnings |
2,985 |
– |
2,985 |
2,985 |
– |
2,985 |
Other Capital |
75 |
24 |
50 |
148 |
63 |
85 |
ii) Abroad |
294 |
3,568 |
-3,274 |
578 |
4,499 |
-3,922 |
Equity |
294 |
2,138 |
-1,844 |
578 |
2,549 |
-1,971 |
Reinvested Earnings |
– |
271 |
-271 |
– |
271 |
-271 |
Other Capital |
– |
1,159 |
-1,159 |
– |
1,679 |
-1,679 |
b) Portfolio Investment |
44,066 |
39,461 |
4,605 |
59,256 |
40,065 |
19,191 |
i) In India |
43,972 |
39,320 |
4,652 |
59,106 |
39,854 |
19,251 |
of which |
|
|
|
|
|
|
FIIs |
42,858 |
39,320 |
3,538 |
58,614 |
39,854 |
18,759 |
ADR/GDRs |
1,114 |
– |
1,114 |
492 |
– |
492 |
ii) Abroad |
94 |
141 |
-47 |
151 |
211 |
-60 |
2. Loans (a+b+c) |
23,465 |
14,464 |
9,000 |
26,644 |
19,997 |
6,647 |
a) External Assistance |
3,210 |
758 |
2,452 |
1,272 |
688 |
584 |
i) By India |
19 |
25 |
-6 |
19 |
25 |
-6 |
ii) To India |
3,191 |
733 |
2,458 |
1,253 |
662 |
590 |
b) Commercial Borrowings |
4,429 |
2,200 |
2,229 |
5,953 |
2,508 |
3,445 |
i) By India |
185 |
243 |
-58 |
297 |
556 |
-259 |
ii) To India |
4,244 |
1,957 |
2,287 |
5,656 |
1,952 |
3,703 |
c) Short Term to India |
15,825 |
11,506 |
4,319 |
19,420 |
16,801 |
2,618 |
i) Suppliers’ Credit > 180 days & Buyers’ Credit |
14,681 |
11,506 |
3,175 |
18,252 |
16,801 |
1,450 |
ii) Suppliers’ Credit up to 180 days |
1,144 |
– |
1,144 |
1,168 |
– |
1,168 |
3. Banking Capital (a+b) |
16,745 |
12,743 |
4,002 |
16,992 |
20,154 |
-3,163 |
a) Commercial Banks |
16,743 |
12,719 |
4,024 |
16,992 |
19,551 |
-2,559 |
i) Assets |
3,263 |
2,558 |
705 |
4,195 |
8,025 |
-3,831 |
ii) Liabilities |
13,480 |
10,160 |
3,320 |
12,797 |
11,526 |
1,271 |
of which: Non-Resident Deposits |
11,252 |
10,133 |
1,119 |
11,672 |
10,628 |
1,044 |
b) Others |
2 |
24 |
-22 |
– |
604 |
-604 |
4. Rupee Debt Service |
– |
16 |
-16 |
– |
1 |
-1 |
5. Other Capital |
1,478 |
5,197 |
-3,719 |
337 |
4,974 |
-4,637 |
Total Capital Account (1 to 5) |
95,098 |
77,751 |
17,347 |
1,12,391 |
90,788 |
21,603 |
C. Errors & Omissions |
– |
908 |
-908 |
– |
1,413 |
-1,413 |
D. Overall Balance (Total Current Account, Capital Account and Errors & Omissions (A+B+C)) |
1,93,659 |
1,89,918 |
3,741 |
2,11,471 |
2,08,182 |
3,289 |
E. Monetary Movements (i+ii) |
– |
3,741 |
-3,741 |
– |
3,289 |
-3,289 |
i) I.M.F. |
– |
– |
– |
– |
– |
– |
ii) Foreign Exchange Reserves (Increase - / Decrease +) |
– |
3,741 |
-3,741 |
– |
3,289 |
-3,289 |
of which: SDR allocation |
– |
– |
– |
– |
– |
– |
Annex 1: India’s Overall Balance of Payments (Contd.) |
(US$ million) |
Item |
Oct-Dec 2010 (PR) |
Jan-Mar 2011 (PR) |
Credit |
Debit |
Net |
Credit |
Debit |
Net |
|
43 |
44 |
45 |
46 |
47 |
48 |
A. CURRENT ACCOUNT |
|
|
|
|
|
|
I. MERCHANDISE |
65,898 |
97,421 |
-31,522 |
77,240 |
1,07,427 |
-30,188 |
II. INVISIBLES (a+b+c) |
55,678 |
34,133 |
21,545 |
52,259 |
28,440 |
23,819 |
a) Services |
39,160 |
26,591 |
12,569 |
35,645 |
20,915 |
14,730 |
i) Travel |
4,429 |
2,857 |
1,572 |
4,518 |
3,198 |
1,321 |
ii) Transportation |
3,713 |
3,984 |
-271 |
4,144 |
3,238 |
907 |
iii) Insurance |
507 |
403 |
104 |
590 |
301 |
289 |
iv) G.n.i.e. |
150 |
195 |
-45 |
165 |
277 |
-111 |
v) Miscellaneous |
30,360 |
19,152 |
11,208 |
26,227 |
13,902 |
12,325 |
of which |
|
|
|
|
|
|
Software Services |
14,743 |
709 |
14,034 |
15,936 |
326 |
15,610 |
Business Services |
7,085 |
7,986 |
-900 |
6,203 |
6,921 |
-717 |
Financial Services |
1,684 |
1,961 |
-276 |
1,777 |
2,213 |
-436 |
Communication Services |
424 |
304 |
121 |
396 |
341 |
55 |
b) Transfers |
14,422 |
844 |
13,578 |
14,436 |
877 |
13,559 |
i) Official |
341 |
199 |
141 |
107 |
154 |
-47 |
ii) Private |
14,081 |
645 |
13,436 |
14,329 |
723 |
13,606 |
c) Income |
2,096 |
6,698 |
-4,601 |
2,177 |
6,647 |
-4,470 |
i) Investment Income |
1,811 |
6,133 |
-4,323 |
1,820 |
6,100 |
-4,280 |
ii) Compensation of Employees |
286 |
564 |
-279 |
357 |
547 |
-190 |
Total Current Account (I+II) |
1,21,576 |
1,31,553 |
-9,977 |
1,29,498 |
1,35,867 |
-6,369 |
B. CAPITAL ACCOUNT |
|
|
|
|
|
|
1. Foreign Investment (a+b) |
1,11,219 |
1,03,727 |
7,492 |
56,369 |
55,044 |
1,325 |
a) Foreign Direct Investment (i+ii) |
9,424 |
8,231 |
1,193 |
7,534 |
6,407 |
1,127 |
i) In India |
8,340 |
2,200 |
6,141 |
6,928 |
1,419 |
5,508 |
Equity |
5,253 |
1,861 |
3,392 |
3,610 |
1,341 |
2,269 |
Reinvested Earnings |
2,985 |
– |
2,985 |
2,985 |
– |
2,985 |
Other Capital |
103 |
339 |
-236 |
333 |
78 |
255 |
ii) Abroad |
1,084 |
6,031 |
-4,948 |
606 |
4,987 |
-4,381 |
Equity |
1,084 |
3,337 |
-2,253 |
606 |
2,513 |
-1,907 |
Reinvested Earnings |
– |
271 |
-271 |
– |
271 |
-271 |
Other Capital |
– |
2,423 |
-2,423 |
– |
2,203 |
-2,203 |
b) Portfolio Investment |
1,01,795 |
95,496 |
6,299 |
48,835 |
48,637 |
198 |
i) In India |
1,01,656 |
94,265 |
7,391 |
48,441 |
48,265 |
176 |
of which |
|
|
|
|
|
|
FIIs |
1,01,423 |
94,265 |
7,158 |
48,231 |
48,265 |
-34 |
ADR/GDRs |
233 |
– |
233 |
210 |
– |
210 |
ii) Abroad |
139 |
1,232 |
-1,092 |
393 |
372 |
21 |
2. Loans (a+b+c) |
26,619 |
20,243 |
6,376 |
30,998 |
24,584 |
6,414 |
a) External Assistance |
1,935 |
781 |
1,154 |
1,465 |
714 |
751 |
i) By India |
19 |
25 |
-6 |
19 |
25 |
-6 |
ii) To India |
1,916 |
755 |
1,160 |
1,446 |
689 |
757 |
b) Commercial Borrowings |
6,347 |
2,470 |
3,877 |
7,383 |
4,428 |
2,955 |
i) By India |
570 |
222 |
347 |
788 |
491 |
297 |
ii) To India |
5,778 |
2,248 |
3,530 |
6,595 |
3,937 |
2,659 |
c) Short Term to India |
18,337 |
16,992 |
1,345 |
22,150 |
19,442 |
2,708 |
i) Suppliers’ Credit > 180 days & Buyers’ Credit |
18,031 |
16,992 |
1,039 |
21,122 |
19,442 |
1,680 |
ii) Suppliers’ Credit up to 180 days |
306 |
– |
306 |
1,028 |
– |
1,028 |
3. Banking Capital (a+b) |
33,103 |
28,202 |
4,901 |
25,483 |
26,262 |
-778 |
a) Commercial Banks |
33,016 |
28,202 |
4,814 |
23,871 |
25,717 |
-1,846 |
i) Assets |
19,992 |
15,240 |
4,752 |
7,920 |
12,843 |
-4,923 |
ii) Liabilities |
13,024 |
12,962 |
62 |
15,951 |
12,874 |
3,077 |
of which: Non-Resident Deposits |
12,566 |
12,380 |
185 |
13,763 |
12,873 |
890 |
b) Others |
87 |
– |
87 |
1,613 |
545 |
1,068 |
4. Rupee Debt Service |
– |
– |
– |
– |
52 |
-52 |
5. Other Capital |
3,427 |
8,347 |
-4,920 |
4,649 |
2,367 |
2,282 |
Total Capital Account (1 to 5) |
1,74,368 |
1,60,519 |
13,849 |
1,17,499 |
1,08,308 |
9,191 |
C. Errors & Omissions |
118 |
– |
118 |
– |
791 |
-791 |
D. Overall Balance (Total Current Account, Capital Account and Errors & Omissions (A+B+C)) |
2,96,061 |
2,92,072 |
3,989 |
2,46,997 |
2,44,966 |
2,031 |
E. Monetary Movements (i+ii) |
– |
3,989 |
-3,989 |
– |
2,031 |
-2,031 |
i) I.M.F. |
– |
– |
– |
– |
– |
– |
ii) Foreign Exchange Reserves (Increase - / Decrease +) |
– |
3,989 |
-3,989 |
– |
2,031 |
-2,031 |
of which: SDR allocation |
– |
– |
– |
– |
– |
– |
Annex 1: India’s Overall Balance of Payments (Contd.) |
(US$ million) |
Item |
Apr-Jun 2011 (PR) |
Jul-Sept 2011 (PR) |
Credit |
Debit |
Net |
Credit |
Debit |
Net |
|
49 |
50 |
51 |
52 |
53 |
54 |
A. CURRENT ACCOUNT |
|
|
|
|
|
|
I. MERCHANDISE |
74,238 |
1,15,638 |
-41,400 |
76,429 |
1,19,810 |
-43,381 |
II. INVISIBLES (a+b+c) |
51,321 |
25,722 |
25,599 |
52,165 |
27,193 |
24,972 |
a) Services |
33,291 |
18,091 |
15,200 |
32,701 |
18,692 |
14,009 |
i) Travel |
3,697 |
3,461 |
237 |
4,235 |
3,534 |
701 |
ii) Transportation |
4,329 |
4,002 |
327 |
4,424 |
3,624 |
800 |
iii) Insurance |
566 |
298 |
268 |
619 |
423 |
196 |
iv) G.n.i.e. |
139 |
201 |
-63 |
147 |
179 |
-32 |
v) Miscellaneous |
24,561 |
10,129 |
14,432 |
23,277 |
10,933 |
12,345 |
of which |
|
|
|
|
|
|
Software Services |
14,950 |
302 |
14,647 |
13,940 |
307 |
13,633 |
Business Services |
5,356 |
6,219 |
-863 |
5,439 |
6,352 |
-912 |
Financial Services |
1,267 |
1,764 |
-497 |
1,577 |
2,130 |
-553 |
Communication Services |
360 |
415 |
-55 |
390 |
309 |
80 |
b) Transfers |
15,537 |
830 |
14,707 |
16,376 |
775 |
15,601 |
i) Official |
46 |
146 |
-99 |
136 |
152 |
-16 |
ii) Private |
15,491 |
685 |
14,807 |
16,240 |
622 |
15,618 |
c) Income |
2,493 |
6,800 |
-4,307 |
3,088 |
7,726 |
-4,638 |
i) Investment Income |
1,904 |
6,400 |
-4,496 |
2,377 |
7,259 |
-4,882 |
ii) Compensation of Employees |
589 |
400 |
189 |
711 |
467 |
244 |
Total Current Account (I+II) |
1,25,559 |
1,41,360 |
-15,801 |
1,28,594 |
1,47,003 |
-18,408 |
B. CAPITAL ACCOUNT |
|
|
|
|
|
|
1. Foreign Investment (a+b) |
67,002 |
56,689 |
10,312 |
52,684 |
49,909 |
2,775 |
a) Foreign Direct Investment (i+ii) |
18,301 |
10,530 |
7,771 |
9,457 |
5,487 |
3,971 |
i) In India |
17,897 |
4,559 |
13,337 |
9,091 |
2,137 |
6,954 |
Equity |
13,696 |
4,226 |
9,470 |
5,950 |
2,015 |
3,934 |
Reinvested Earnings |
2,730 |
– |
2,730 |
2,730 |
– |
2,730 |
Other Capital |
1,471 |
333 |
1,137 |
411 |
122 |
290 |
ii) Abroad |
404 |
5,971 |
-5,567 |
366 |
3,350 |
-2,983 |
Equity |
404 |
1,535 |
-1,131 |
366 |
1,600 |
-1,234 |
Reinvested Earnings |
– |
302 |
-302 |
– |
302 |
-302 |
Other Capital |
– |
4,133 |
-4,133 |
– |
1,448 |
-1,448 |
b) Portfolio Investment |
48,701 |
46,159 |
2,541 |
43,227 |
44,422 |
-1,196 |
i) In India |
48,607 |
45,857 |
2,750 |
42,769 |
44,152 |
-1,384 |
of which |
|
|
|
|
|
|
FIIs |
48,329 |
45,857 |
2,472 |
42,564 |
44,152 |
-1,589 |
ADR/GDRs |
278 |
– |
278 |
205 |
– |
205 |
ii) Abroad |
94 |
303 |
-208 |
458 |
270 |
188 |
2. Loans (a+b+c) |
32,180 |
25,424 |
6,756 |
37,220 |
28,788 |
8,432 |
a) External Assistance |
1,237 |
855 |
382 |
1,081 |
758 |
324 |
i) By India |
18 |
24 |
-6 |
18 |
24 |
-6 |
ii) To India |
1,219 |
831 |
388 |
1,063 |
734 |
330 |
b) Commercial Borrowings |
6,779 |
3,473 |
3,306 |
9,735 |
4,497 |
5,238 |
i) By India |
339 |
319 |
21 |
1,118 |
469 |
649 |
ii) To India |
6,439 |
3,154 |
3,285 |
8,616 |
4,028 |
4,588 |
c) Short Term to India |
24,165 |
21,096 |
3,069 |
26,405 |
23,534 |
2,871 |
i) Suppliers’ Credit > 180 days & Buyers’ Credit |
22,682 |
21,096 |
1,586 |
25,130 |
23,534 |
1,596 |
ii) Suppliers’ Credit up to 180 days |
1,483 |
– |
1,483 |
1,275 |
– |
1,275 |
3. Banking Capital (a+b) |
28,767 |
16,103 |
12,664 |
20,144 |
13,465 |
6,679 |
a) Commercial Banks |
28,736 |
16,077 |
12,659 |
20,144 |
13,439 |
6,705 |
i) Assets |
10,858 |
4,595 |
6,263 |
2,223 |
1,006 |
1,217 |
ii) Liabilities |
17,878 |
11,482 |
6,396 |
17,921 |
12,433 |
5,488 |
of which: Non-Resident Deposits |
12,488 |
11,337 |
1,151 |
15,088 |
12,302 |
2,786 |
b) Others |
31 |
27 |
5 |
– |
26 |
-26 |
4. Rupee Debt Service |
– |
31 |
-31 |
– |
1 |
-1 |
5. Other Capital |
234 |
7,683 |
-7,448 |
3,333 |
4,003 |
-670 |
Total Capital Account (1 to 5) |
1,28,183 |
1,05,931 |
22,253 |
1,13,381 |
96,166 |
17,215 |
C. Errors & Omissions |
– |
1,009 |
-1,009 |
1,469 |
– |
1,469 |
D. Overall Balance (Total Current Account, Capital Account and Errors & Omissions (A+B+C)) |
2,53,742 |
2,48,300 |
5,442 |
2,43,444 |
2,43,168 |
276 |
E. Monetary Movements (i+ii) |
– |
5,442 |
-5,442 |
– |
276 |
-276 |
i) I.M.F. |
– |
– |
– |
– |
– |
– |
ii) Foreign Exchange Reserves (Increase - / Decrease +) |
– |
5,442 |
-5,442 |
– |
276 |
-276 |
of which: SDR allocation |
– |
– |
– |
– |
– |
– |
Annex 1: India’s Overall Balance of Payments (Contd.) |
(US$ million) |
Item |
Oct-Dec 2011 (P) |
Oct-Dec 2010 (PR) |
Credit |
Debit |
Net |
Credit |
Debit |
Net |
|
55 |
56 |
57 |
58 |
59 |
60 |
A. CURRENT ACCOUNT |
|
|
|
|
|
|
I. MERCHANDISE |
71,127 |
1,18,848 |
-47,721 |
65,898 |
97,421 |
-31,522 |
II. INVISIBLES (a+b+c) |
57,668 |
29,366 |
28,302 |
55,678 |
34,133 |
21,545 |
a) Services |
37,026 |
21,954 |
15,072 |
39,160 |
26,591 |
12,569 |
i) Travel |
5,068 |
3,530 |
1,538 |
4,429 |
2,857 |
1,572 |
ii) Transportation |
4,580 |
4,444 |
135 |
3,713 |
3,984 |
-271 |
iii) Insurance |
799 |
440 |
359 |
507 |
403 |
104 |
iv) G.n.i.e. |
145 |
186 |
-40 |
150 |
195 |
-45 |
v) Miscellaneous |
26,434 |
13,354 |
13,080 |
30,360 |
19,152 |
11,208 |
of which |
|
|
|
|
|
|
Software Services |
16,123 |
317 |
15,806 |
14,743 |
709 |
14,034 |
Business Services |
6,018 |
6,950 |
-931 |
7,085 |
7,986 |
-900 |
Financial Services |
1,613 |
2,104 |
-491 |
1,684 |
1,961 |
-276 |
Communication Services |
456 |
328 |
128 |
424 |
304 |
121 |
b) Transfers |
18,360 |
614 |
17,746 |
14,422 |
844 |
13,578 |
i) Official |
351 |
149 |
202 |
341 |
199 |
141 |
ii) Private |
18,009 |
465 |
17,544 |
14,081 |
645 |
13,436 |
c) Income |
2,282 |
6,798 |
-4,516 |
2,096 |
6,698 |
-4,601 |
i) Investment Income |
1,698 |
6,247 |
-4,549 |
1,811 |
6,133 |
-4,323 |
ii) Compensation of Employees |
583 |
551 |
32 |
286 |
564 |
-279 |
Total Current Account (I+II) |
1,28,795 |
1,48,214 |
-19,419 |
1,21,576 |
1,31,553 |
-9,977 |
B. CAPITAL ACCOUNT |
|
|
|
|
|
|
1. Foreign Investment (a+b) |
49,301 |
42,918 |
6,383 |
1,11,219 |
1,03,727 |
7,492 |
a) Foreign Direct Investment (i+ii) |
9,950 |
5,466 |
4,485 |
9,424 |
8,231 |
1,193 |
i) In India |
8,949 |
2,559 |
6,389 |
8,340 |
2,200 |
6,141 |
Equity |
5,307 |
2,515 |
2,792 |
5,253 |
1,861 |
3,392 |
Reinvested Earnings |
2,730 |
– |
2,730 |
2,985 |
– |
2,985 |
Other Capital |
912 |
44 |
868 |
103 |
339 |
-236 |
ii) Abroad |
1,001 |
2,906 |
-1,905 |
1,084 |
6,031 |
-4,948 |
Equity |
1,001 |
1,382 |
-381 |
1,084 |
3,337 |
-2,253 |
Reinvested Earnings |
– |
302 |
-302 |
– |
271 |
-271 |
Other Capital |
– |
1,222 |
-1,222 |
– |
2,423 |
-2,423 |
b) Portfolio Investment |
39,350 |
37,452 |
1,898 |
1,01,795 |
95,496 |
6,299 |
i) In India |
39,149 |
37,204 |
1,945 |
1,01,656 |
94,265 |
7,391 |
of which |
|
|
|
|
|
|
FIIs |
39,065 |
37,204 |
1,861 |
1,01,423 |
94,265 |
7,158 |
ADR/GDRs |
84 |
– |
84 |
233 |
– |
233 |
ii) Abroad |
201 |
248 |
-47 |
139 |
1,232 |
-1,092 |
2. Loans (a+b+c) |
36,950 |
34,255 |
2,695 |
26,619 |
20,243 |
6,376 |
a) External Assistance |
2,209 |
823 |
1,385 |
1,935 |
781 |
1,154 |
i) By India |
18 |
24 |
-6 |
19 |
25 |
-6 |
ii) To India |
2,191 |
800 |
1,392 |
1,916 |
755 |
1,160 |
b) Commercial Borrowings |
9,594 |
8,153 |
1,441 |
6,347 |
2,470 |
3,877 |
i) By India |
1,405 |
901 |
504 |
570 |
222 |
347 |
ii) To India |
8,189 |
7,252 |
937 |
5,778 |
2,248 |
3,530 |
c) Short Term to India |
25,148 |
25,279 |
-131 |
18,337 |
16,992 |
1,345 |
i) Suppliers’ Credit > 180 days & Buyers’ Credit |
25,148 |
23,897 |
1,251 |
18,031 |
16,992 |
1,039 |
ii) Suppliers’ Credit up to 180 days |
– |
1,382 |
-1,382 |
306 |
|
306 |
3. Banking Capital (a+b) |
16,146 |
21,632 |
-5,487 |
33,103 |
28,202 |
4,901 |
a) Commercial Banks |
16,143 |
21,505 |
-5,362 |
33,016 |
28,202 |
4,814 |
i) Assets |
393 |
2,770 |
-2,377 |
19,992 |
15,240 |
4,752 |
ii) Liabilities |
15,750 |
18,735 |
-2,985 |
13,024 |
12,962 |
62 |
of which: Non-Resident Deposits |
15,698 |
12,375 |
3,323 |
12,566 |
12,380 |
185 |
b) Others |
3 |
127 |
-124 |
87 |
– |
87 |
4. Rupee Debt Service |
– |
– |
– |
– |
– |
– |
5. Other Capital |
5,205 |
808 |
4,397 |
3,427 |
8,347 |
-4,920 |
Total Capital Account (1 to 5) |
1,07,602 |
99,614 |
7,988 |
1,74,368 |
1,60,519 |
13,849 |
C. Errors & Omissions |
– |
1,381 |
-1,381 |
118 |
– |
118 |
D. Overall Balance (Total Current Account, Capital Account and Errors & Omissions (A+B+C)) |
2,36,397 |
2,49,209 |
-12,812 |
2,96,061 |
2,92,072 |
3,989 |
E. Monetary Movements (i+ii) |
12,812 |
– |
12,812 |
– |
3,989 |
-3,989 |
i) I.M.F. |
– |
– |
– |
– |
– |
– |
ii) Foreign Exchange Reserves (Increase - / Decrease +) |
12,812 |
– |
12,812 |
– |
3,989 |
-3,989 |
of which: SDR allocation |
– |
– |
– |
– |
– |
– |
Annex 1: India’s Overall Balance of Payments (Concld.) |
(US$ million) |
Item |
Apr-Dec 2011-12 (P) |
Apr-Dec 2010-11 (PR) |
Credit |
Debit |
Net |
Credit |
Debit |
Net |
|
61 |
62 |
63 |
64 |
65 |
66 |
A. CURRENT ACCOUNT |
|
|
|
|
|
|
I. MERCHANDISE |
2,21,794 |
3,54,296 |
-1,32,502 |
1,73,229 |
2,73,634 |
-1,00,405 |
II. INVISIBLES (a+b+c) |
1,61,154 |
82,281 |
78,873 |
1,45,989 |
85,161 |
60,828 |
a) Services |
1,03,018 |
58,738 |
44,280 |
97,235 |
63,148 |
34,086 |
i) Travel |
13,000 |
10,525 |
2,475 |
10,757 |
7,910 |
2,846 |
ii) Transportation |
13,332 |
12,071 |
1,262 |
10,127 |
10,642 |
-516 |
iii) Insurance |
1,983 |
1,161 |
823 |
1,358 |
1,098 |
259 |
iv) G.n.i.e. |
431 |
566 |
-135 |
369 |
543 |
-174 |
v) Miscellaneous |
74,272 |
34,416 |
39,856 |
74,624 |
42,954 |
31,670 |
of which |
|
|
|
|
|
|
Software Services |
45,013 |
927 |
44,086 |
39,524 |
1,869 |
37,655 |
Business Services |
16,813 |
19,520 |
-2,706 |
17,847 |
20,844 |
-2,997 |
Financial Services |
4,456 |
5,997 |
-1,541 |
4,731 |
5,270 |
-539 |
Communication Services |
1,206 |
1,052 |
153 |
1,167 |
811 |
356 |
b) Transfers |
50,274 |
2,219 |
48,055 |
41,829 |
2,248 |
39,581 |
i) Official |
534 |
447 |
87 |
540 |
478 |
62 |
ii) Private |
49,740 |
1,772 |
47,968 |
41,289 |
1,770 |
39,519 |
c) Income |
7,862 |
21,324 |
-13,462 |
6,925 |
19,764 |
-12,839 |
i) Investment Income |
5,979 |
19,906 |
-13,927 |
6,166 |
18,283 |
-12,118 |
ii) Compensation of Employees |
1,883 |
1,418 |
465 |
759 |
1,481 |
-722 |
Total Current Account (I+II) |
3,82,948 |
4,36,576 |
-53,629 |
3,19,218 |
3,58,794 |
-39,577 |
B. CAPITAL ACCOUNT |
|
|
|
|
|
|
1. Foreign Investment (a+b) |
1,68,986 |
1,49,516 |
19,470 |
2,33,047 |
1,94,720 |
38,327 |
a) Foreign Direct Investment (i+ii) |
37,708 |
21,482 |
16,226 |
27,930 |
19,697 |
8,233 |
i) In India |
35,937 |
9,256 |
26,681 |
25,974 |
5,599 |
20,375 |
Equity |
24,952 |
8,757 |
16,196 |
16,695 |
5,173 |
11,522 |
Reinvested Earnings |
8,190 |
– |
8,190 |
8,955 |
– |
8,955 |
Other Capital |
2,794 |
499 |
2,295 |
325 |
426 |
-101 |
ii) Abroad |
1,772 |
12,227 |
-10,455 |
1,955 |
14,098 |
-12,143 |
Equity |
1,772 |
4,517 |
-2,746 |
1,955 |
8,024 |
-6,068 |
Reinvested Earnings |
– |
906 |
-906 |
– |
813 |
-813 |
Other Capital |
– |
6,803 |
-6,803 |
– |
5,261 |
-5,261 |
b) Portfolio Investment |
1,31,278 |
1,28,034 |
3,244 |
2,05,117 |
1,75,023 |
30,095 |
i) In India |
1,30,524 |
1,27,213 |
3,311 |
2,04,733 |
1,73,439 |
31,295 |
of which |
|
|
|
|
|
|
FIIs |
1,29,957 |
1,27,213 |
2,744 |
2,02,894 |
1,73,439 |
29,456 |
ADR/GDRs |
567 |
– |
567 |
1,839 |
– |
1,839 |
ii) Abroad |
753 |
821 |
-67 |
384 |
1,584 |
-1,200 |
2. Loans (a+b+c) |
1,06,351 |
88,467 |
17,883 |
76,728 |
54,704 |
22,023 |
a) External Assistance |
4,526 |
2,436 |
2,091 |
6,417 |
2,227 |
4,190 |
i) By India |
53 |
72 |
-19 |
57 |
76 |
-19 |
ii) To India |
4,474 |
2,364 |
2,110 |
6,360 |
2,151 |
4,209 |
b) Commercial Borrowings |
26,107 |
16,123 |
9,984 |
16,729 |
7,178 |
9,551 |
i) By India |
2,862 |
1,689 |
1,173 |
1,052 |
1,021 |
31 |
ii) To India |
23,245 |
14,434 |
8,811 |
15,677 |
6,157 |
9,520 |
c) Short Term to India |
75,717 |
69,908 |
5,809 |
53,582 |
45,299 |
8,283 |
i) Suppliers’ Credit > 180 days & Buyers’ Credit |
72,959 |
68,526 |
4,433 |
50,964 |
45,299 |
5,665 |
ii) Suppliers’ Credit up to 180 days |
2,758 |
1,382 |
1,376 |
2,618 |
– |
2,618 |
3. Banking Capital (a+b) |
65,058 |
51,201 |
13,857 |
66,840 |
61,100 |
5,740 |
a) Commercial Banks |
65,023 |
51,021 |
14,003 |
66,751 |
60,472 |
6,279 |
i) Assets |
13,474 |
8,370 |
5,103 |
27,450 |
25,824 |
1,626 |
ii) Liabilities |
51,549 |
42,650 |
8,899 |
39,301 |
34,648 |
4,653 |
of which: Non-Resident Deposits |
43,275 |
36,015 |
7,260 |
35,490 |
33,141 |
2,348 |
b) Others |
34 |
180 |
-146 |
89 |
628 |
-539 |
4. Rupee Debt Service |
– |
32 |
-32 |
– |
16 |
-16 |
5. Other Capital |
8,772 |
12,494 |
-3,722 |
5,241 |
18,518 |
-13,277 |
Total Capital Account (1 to 5) |
3,49,166 |
3,01,710 |
47,456 |
3,81,856 |
3,29,058 |
52,798 |
C. Errors & Omissions |
– |
921 |
-921 |
– |
2,202 |
-2,202 |
D. Overall Balance (Total Current Account, Capital Account and Errors & Omissions (A+B+C)) |
7,32,114 |
7,39,207 |
-7,093 |
7,01,074 |
6,90,054 |
11,019 |
E. Monetary Movements (i+ii) |
7,093 |
– |
7,093 |
– |
11,019 |
-11,019 |
i) I.M.F. |
– |
– |
– |
– |
– |
– |
ii) Foreign Exchange Reserves (Increase - / Decrease +) |
7,093 |
– |
7,093 |
– |
11,019 |
-11,019 |
of which: SDR allocation |
– |
– |
– |
– |
– |
– |
Note: The comparable figures in new and old formats may not entirely agree due to rounding off. Total of subcomponents may not tally with aggregate due to rounding off.
P: Preliminary. PR: Partially Revised. R: Revised. |
Attachment I : Invisibles by Category |
(US$ million) |
Items |
2009-10 R |
2010-11 PR |
2011-12 P |
Apr-Jun PR |
Jul-Sep PR |
Oct-Dec P |
Oct-Dec 2010 PR |
1 |
2 |
3 |
4 |
5 |
6 |
7 |
I. Invisibles Receipts ( A+B+C) |
163,430 |
198,248 |
51,321 |
52,165 |
57,668 |
55,678 |
A. Services |
96,045 |
132,880 |
33,291 |
32,701 |
37,026 |
39,160 |
1) Travel |
11,859 |
15,275 |
3,697 |
4,235 |
5,068 |
4,429 |
2) Transportation |
11,178 |
14,271 |
4,329 |
4,424 |
4,580 |
3,713 |
3) Insurance |
1,591 |
1,948 |
566 |
619 |
799 |
507 |
4) GNIE |
441 |
535 |
139 |
147 |
145 |
150 |
5) Miscellaneous |
70,977 |
1,00,851 |
24,561 |
23,277 |
26,434 |
30,360 |
of which: |
|
|
|
|
|
|
Software Services |
49,705 |
55,460 |
14,950 |
13,940 |
16,123 |
14,743 |
B. Transfers |
54,363 |
56,265 |
15,537 |
16,376 |
18,360 |
14,422 |
1) Official Transfers |
727 |
647 |
46 |
136 |
351 |
341 |
2) Private Transfers |
53,636 |
55,618 |
15,491 |
16,240 |
18,009 |
14,081 |
C. Income |
13,022 |
9,102 |
2,493 |
3,088 |
2,282 |
2,096 |
1) Investment Income |
12,108 |
7,986 |
1,904 |
2,377 |
1,698 |
1,811 |
2) Compensation of Employees |
915 |
1,116 |
589 |
711 |
583 |
286 |
II. Invisibles Payments ( A+B+C) |
83,408 |
113,600 |
25,722 |
27,193 |
29,366 |
34,133 |
A. Services |
60,029 |
84,064 |
18,091 |
18,692 |
21,954 |
26,591 |
1) Travel |
9,343 |
11,108 |
3,461 |
3,534 |
3,530 |
2,857 |
2) Transportation |
11,933 |
13,880 |
4,002 |
3,624 |
4,444 |
3,984 |
3) Insurance |
1,285 |
1,400 |
298 |
423 |
440 |
403 |
4) GNIE |
525 |
820 |
201 |
179 |
186 |
195 |
5) Miscellaneous |
36,944 |
56,856 |
10,129 |
10,933 |
13,354 |
19,152 |
of which: |
|
|
|
|
|
|
Software Services |
1,468 |
2,194 |
302 |
307 |
317 |
709 |
B. Transfers |
2,318 |
3,125 |
830 |
775 |
614 |
844 |
1) Official Transfers |
473 |
631 |
146 |
152 |
149 |
199 |
2) Private Transfers |
1,845 |
2,494 |
685 |
622 |
465 |
645 |
C. Income |
21,061 |
26,412 |
6,800 |
7,726 |
6,798 |
6,698 |
1) Investment Income |
19,355 |
24,384 |
6,400 |
7,259 |
6,247 |
6,133 |
2) Compensation of Employees |
1,705 |
2,028 |
400 |
467 |
551 |
564 |
Net Invisibles ( I - II) |
80,022 |
84,648 |
25,599 |
24,972 |
28,302 |
21,545 |
Attachment I A: Invisibles Receipts by Category of Transactions |
(US$ million) |
Items |
2009-10
R |
2010-11
PR |
2011-12 |
2010-11 |
Apr-Jun
PR |
Jul-Sep
PR |
Oct-Dec
P |
Oct-Dec
PR |
1 |
2 |
3 |
4 |
5 |
6 |
7 |
I. Invisibles Receipts ( A+B+C) |
163430 |
198248 |
51321 |
52165 |
57688 |
55678 |
A) SERVICES |
96045 |
132880 |
33291 |
32701 |
37026 |
39160 |
1) TRAVEL ACCOUNT |
|
|
|
|
|
|
Tourist Expenses in India |
11859 |
15275 |
3697 |
4235 |
5068 |
4429 |
TOTAL |
11859 |
15275 |
3697 |
4235 |
5068 |
4429 |
2) TRANSPORTATION ACCOUNT |
|
|
|
|
|
|
a ) Sea Transport |
|
|
|
|
|
|
i) Surplus remitted by Indian companies operating abroad |
609 |
649 |
205 |
219 |
143 |
178 |
ii) Operating expenses of foreign companies in India |
788 |
765 |
275 |
187 |
111 |
205 |
iii) Charter hire charges |
140 |
116 |
41 |
34 |
33 |
27 |
b) Air Transport |
|
|
|
|
|
|
i) Surplus remitted by Indian companies operating abroad |
420 |
530 |
153 |
193 |
163 |
122 |
ii) Operating expenses of foreign companies in India |
66 |
56 |
38 |
39 |
24 |
19 |
iii) Charter hire charges |
12 |
20 |
1 |
3 |
4 |
7 |
c) Freight on exports |
7967 |
10361 |
3044 |
3142 |
3432 |
2680 |
d) Others |
1177 |
1773 |
573 |
606 |
669 |
475 |
TOTAL ( a to d) |
11178 |
14270 |
4329 |
4424 |
4580 |
3713 |
3) INSURANCE ACCOUNT |
|
|
|
|
|
|
a) Insurance on export |
1040 |
1354 |
398 |
411 |
449 |
350 |
b) Premium |
|
|
|
|
|
|
i) Life |
46 |
50 |
29 |
45 |
44 |
10 |
ii) Non-life |
99 |
124 |
30 |
44 |
52 |
43 |
iii) Reinsurance from foreign companies |
212 |
126 |
29 |
33 |
90 |
37 |
c) Commission on Business received from foreign companies |
24 |
33 |
7 |
20 |
22 |
7 |
d) Others |
169 |
263 |
74 |
67 |
142 |
60 |
TOTAL ( a to d) |
1591 |
1949 |
566 |
619 |
799 |
507 |
4) Government Not Included Elsewhere |
|
|
|
|
|
|
a) Maintenance of foreign embassies and diplomatic missions in India |
279 |
387 |
100 |
112 |
98 |
106 |
b) Maintenance of international and regional institutions in India |
162 |
147 |
39 |
35 |
47 |
44 |
TOTAL ( a to b) |
441 |
534 |
139 |
147 |
145 |
150 |
5) MISCELLANEOUS ACCOUNT |
|
|
|
|
|
|
a) Communication services |
1229 |
1562 |
360 |
390 |
456 |
424 |
b) Construction services |
589 |
676 |
253 |
137 |
204 |
128 |
c) Financial services |
3692 |
6508 |
1267 |
1577 |
1613 |
1684 |
d) Software services |
49705 |
55461 |
14950 |
13940 |
16123 |
14743 |
e) News agency services |
351 |
605 |
30 |
24 |
31 |
322 |
f) Royalties, copyright and license fees |
202 |
193 |
40 |
78 |
78 |
25 |
g) Business services (i to xii) |
11323 |
24049 |
5355 |
5441 |
6018 |
7085 |
i) Merchanting services |
316 |
1223 |
332 |
348 |
300 |
330 |
ii) Trade related services |
1688 |
5356 |
740 |
716 |
700 |
1638 |
iii) Operational Leasing Services |
423 |
829 |
198 |
189 |
194 |
299 |
iv) Legal services |
609 |
439 |
117 |
129 |
167 |
74 |
v) Accounting / Auditing services |
224 |
301 |
80 |
106 |
157 |
68 |
vi) Business Management & consultancy services |
3776 |
9184 |
2005 |
1910 |
2148 |
2747 |
vii) Advertising/ trade fair |
568 |
703 |
222 |
171 |
192 |
243 |
viii) Research & Development services |
565 |
878 |
159 |
187 |
207 |
224 |
ix) Architectural Engineering & other technical services |
1380 |
2013 |
636 |
693 |
828 |
551 |
x) Agricultural Mining & on-site processing services |
196 |
286 |
36 |
16 |
17 |
77 |
xi) Maintanence of offices abroad services |
1507 |
2777 |
814 |
951 |
1089 |
825 |
xii) Environmental services |
71 |
60 |
16 |
25 |
20 |
9 |
h) Personal, Cultural & Recreational services |
527 |
227 |
86 |
120 |
67 |
52 |
i) Refunds/rebates |
597 |
507 |
8 |
149 |
200 |
132 |
j) Other services |
2762 |
11062 |
2212 |
1421 |
1644 |
5765 |
TOTAL ( a to j) |
70977 |
100850 |
24561 |
23277 |
26434 |
30360 |
Attachment I A: Invisibles Receipts by Category of Transactions (Concld.) |
(US$ million) |
Items |
2009-10
PR |
2010-11
PR |
2011-12 |
Apr-Jun
R |
Jul-Sep
R |
Oct-Dec
R |
Oct-Dec
PR |
|
8 |
9 |
10 |
11 |
12 |
13 |
B) TRANSFERS |
54364 |
56265 |
15537 |
16376 |
18360 |
14422 |
I) OFFICIAL TRANSFERS |
|
|
|
|
|
|
i) Donations received from Non- residents |
67 |
75 |
19 |
19 |
21 |
22 |
ii) Grant under PL 480 II |
4 |
0 |
0 |
0 |
0 |
0 |
iii) Grants from other Governments |
656 |
573 |
27 |
117 |
330 |
319 |
TOTAL ( i to iii) |
727 |
648 |
46 |
136 |
351 |
341 |
II) PRIVATE TRANSFERS |
|
|
|
|
|
|
i) Inward remittance from Indian workers abroad for family maintenance etc. |
28406 |
27408 |
7372 |
7718 |
8399 |
7227 |
ii) Local withdrawals/redemptions from non-resident deposits |
23288 |
26151 |
7503 |
7930 |
8940 |
6346 |
iii) Gold and silver brought through passenger baggage |
85 |
36 |
17 |
15 |
18 |
9 |
iv) Personal gifts/donations to charitable/ religious institutions in India. |
1857 |
2023 |
599 |
577 |
652 |
500 |
TOTAL (i to iv) |
53636 |
55618 |
15491 |
16240 |
18009 |
14082 |
C) INCOME ACCOUNT |
13023 |
9101 |
2493 |
3088 |
2282 |
2096 |
I) Compensation of Employees |
|
|
|
|
|
|
Wages received by Indians working on foreign contracts |
914 |
1117 |
589 |
711 |
583 |
286 |
II) Investment Income |
|
|
|
|
|
|
i) Interest received on loans to non-residents |
4138 |
1722 |
202 |
219 |
72 |
159 |
ii) Dividend/profit received by Indians on foreign investment |
349 |
283 |
276 |
149 |
104 |
67 |
of which: |
|
|
|
|
|
|
Dividend received by Indians on foreign investment |
224 |
156 |
241 |
101 |
51 |
40 |
Profit received by Indians on foreign investment |
125 |
127 |
35 |
48 |
53 |
27 |
iii) Reinvested Earning |
1084 |
1084 |
302 |
302 |
302 |
271 |
iv) Interest received on debentures, FRNs,CPs, fixed deposits and funds held abroad by ADs out of foreign currency loans/export proceeds |
57 |
42 |
150 |
85 |
126 |
14 |
v) Interest received on overdraft of VOSTRO accounts of foreign correspondents/branches by the ADs |
16 |
12 |
7 |
13 |
3 |
1 |
vi) Payment of taxes by the non-residents/refund of taxes by foreign governments to Indians |
554 |
681 |
152 |
294 |
91 |
384 |
vii) Interest/discount earnings etc. earnings on RBI investment |
5900 |
4142 |
811 |
1304 |
994 |
908 |
viii) Interest/remuneration on SDR holdings |
10 |
20 |
4 |
11 |
6 |
6 |
TOTAL ( i to viii) |
12108 |
7986 |
1904 |
2377 |
1698 |
1810 |
Attachment I B: Invisibles Payments by Category of Transactions |
(US$ million) |
Items |
2009-10 |
2010-11 |
2011-12 |
2010-11 |
PR |
PR |
Apr-Jun R |
Jul-Sep R |
Oct-Dec R |
Oct-Dec PR |
1 |
2 |
3 |
4 |
5 |
6 |
7 |
Invisibles Payments ( A+B+C) |
83408 |
113600 |
25722 |
27193 |
29366 |
34133 |
A) SERVICES |
60030 |
84064 |
18091 |
18692 |
21954 |
26591 |
I) TRAVEL ACCOUNT |
|
|
|
|
|
|
i) Business |
3569 |
4978 |
1847 |
1650 |
1921 |
1251 |
ii) Health Related |
29 |
59 |
10 |
11 |
7 |
7 |
iii) Education Related |
2252 |
1892 |
330 |
631 |
467 |
435 |
iv) Basic travel quota ( BTQ) |
2336 |
2780 |
895 |
733 |
602 |
714 |
v) Pilgrimage |
232 |
309 |
48 |
210 |
201 |
180 |
vi) Others |
924 |
1090 |
331 |
299 |
332 |
270 |
TOTAL ( i to vi) |
9342 |
11108 |
3461 |
3534 |
3530 |
2857 |
II) TRANSPORTATION ACCOUNT |
|
|
|
|
|
|
a. Sea Transport |
|
|
|
|
|
|
i) Surplus remitted by Foreign companies operating in India |
1209 |
1771 |
805 |
797 |
704 |
483 |
ii) Operating expenses of Indian companies abroad |
1670 |
962 |
312 |
311 |
231 |
301 |
iii) Charter hire charges |
97 |
93 |
13 |
10 |
29 |
30 |
iv) Freight on imports |
3265 |
4186 |
996 |
905 |
999 |
1213 |
v) Freight on Exports |
1019 |
1119 |
436 |
253 |
266 |
239 |
vi) Remittance of passage booking abroad |
6 |
11 |
8 |
1 |
0 |
2 |
b. Air Transport |
|
|
|
|
|
|
i) Surplus remitted by Foreign companies operating in India |
2452 |
3120 |
794 |
619 |
485 |
881 |
ii) Operating expenses of Indian companies abroad |
603 |
923 |
234 |
227 |
199 |
279 |
iii) Charter hire charges |
510 |
491 |
119 |
120 |
98 |
194 |
iv) Freight on imports |
112 |
152 |
34 |
39 |
43 |
56 |
v) Freight on Exports |
23 |
50 |
3 |
8 |
4 |
6 |
vi) Remittance of passage booking abroad |
38 |
41 |
10 |
17 |
12 |
15 |
c. Others |
930 |
961 |
238 |
317 |
1374 |
285 |
TOTAL ( a to e) |
11934 |
13880 |
4002 |
3624 |
4444 |
3984 |
III) INSURANCE ACCOUNT |
|
|
|
|
|
|
a. Premium |
|
|
|
|
|
|
i) Life |
25 |
15 |
2 |
4 |
1 |
3 |
ii) Non-life |
117 |
128 |
19 |
25 |
26 |
30 |
iii) Reinsurance |
653 |
750 |
198 |
220 |
243 |
255 |
b. Commission on Business |
58 |
65 |
18 |
33 |
6 |
16 |
c. Others |
432 |
442 |
61 |
140 |
164 |
99 |
TOTAL ( a to c) |
1285 |
1400 |
298 |
423 |
440 |
403 |
IV) Government Not Included Elsewhere |
|
|
|
|
|
|
a. Maintenance of Indian embassies and diplomatic mission abroad |
358 |
531 |
116 |
101 |
122 |
107 |
b. Remittances by foreign embassies and mission in India |
167 |
288 |
86 |
78 |
64 |
88 |
TOTAL ( a to b) |
525 |
819 |
201 |
179 |
186 |
195 |
V) MISCELLANEOUS ACCOUNT |
|
|
|
|
|
|
a) Communication services |
1355 |
1152 |
415 |
309 |
328 |
304 |
b) Construction services |
998 |
1157 |
203 |
315 |
149 |
220 |
c) Financial services |
4643 |
7483 |
1764 |
2130 |
2104 |
1961 |
d) Software services |
1469 |
2195 |
302 |
307 |
317 |
709 |
e) News agency services |
639 |
467 |
194 |
87 |
108 |
113 |
f) Royalties, copyright and license fees |
2017 |
2424 |
606 |
693 |
883 |
696 |
g) Business services (i to xii) |
18050 |
27763 |
6219 |
6352 |
6950 |
7984 |
i) Merchanting services |
496 |
1068 |
211 |
331 |
241 |
242 |
ii) Trade related services |
1772 |
1878 |
580 |
545 |
395 |
501 |
iii) Operational Leasing Services |
907 |
1236 |
332 |
250 |
282 |
354 |
iv) Legal services |
193 |
158 |
45 |
48 |
65 |
47 |
v) Accounting / Auditing services |
179 |
274 |
76 |
37 |
46 |
89 |
vi) Business Management & consultancy services |
5376 |
10613 |
2245 |
2394 |
2994 |
2948 |
vii) Advertising/ trade fair |
792 |
945 |
207 |
280 |
243 |
323 |
viii) Research & Development services |
319 |
249 |
48 |
26 |
91 |
79 |
ix) Architectural Engineering & other technical services |
4252 |
5127 |
1212 |
1262 |
1416 |
1622 |
x) Agricultural Mining & on-site processing services |
191 |
131 |
11 |
17 |
17 |
11 |
xi) Maintanence of offices abroad services |
3573 |
6072 |
1251 |
1160 |
1156 |
1767 |
xii) Environmental services |
3 |
12 |
1 |
2 |
4 |
1 |
h) Personal, Cultural & Recreational services |
260 |
543 |
80 |
78 |
48 |
228 |
i) Refunds/rebates |
473 |
641 |
111 |
266 |
176 |
233 |
j) Other services |
7040 |
13031 |
235 |
395 |
2291 |
6704 |
TOTAL ( a to j) |
36944 |
56856 |
10129 |
10933 |
13354 |
19152 |
Attachment I B: Invisibles Payments by Category of Transactions (Concld.) |
(US$ million) |
Items |
2009-10 |
2010-11 |
2011-12 |
2010-11 |
PR |
PR |
Apr-Jun R |
Jul-Sep R |
Oct-Dec R |
Oct-Dec PR |
|
8 |
9 |
10 |
11 |
12 |
13 |
B) TRANSFERS |
2318 |
3125 |
830 |
775 |
614 |
844 |
i) OFFICIAL TRANSFERS |
|
|
|
|
|
|
Grants/donations from official sector |
473 |
631 |
146 |
152 |
149 |
199 |
TOTAL |
473 |
631 |
146 |
152 |
149 |
199 |
ii) PRIVATE TRANSFERS |
|
|
|
|
|
|
i) Remittance by non-residents towards family maintenance and savings |
1515 |
2078 |
565 |
530 |
396 |
540 |
ii) Personal gifts/donations to charitable/ religious institutions |
329 |
415 |
120 |
93 |
69 |
105 |
of which: |
|
|
|
|
|
|
Remittance towards personal gifts and donations |
286 |
405 |
112 |
91 |
67 |
103 |
Remittance towards donations to religious and charitable institutions abroad |
41 |
9 |
7 |
1 |
2 |
2 |
Remittance towards grants and donations to other governments and charitable institutions established by the governments |
2 |
1 |
1 |
1 |
0 |
0 |
TOTAL ( i to ii) |
1844 |
2493 |
685 |
622 |
465 |
645 |
C) INCOME |
21061 |
26411 |
6800 |
7726 |
6798 |
6698 |
i) Compensation of Employees |
|
|
|
|
|
|
Payment of wages/salary to Non-residents working in India |
1705 |
2027 |
400 |
467 |
551 |
564 |
TOTAL |
1705 |
2027 |
400 |
467 |
551 |
564 |
ii) Investment Income |
|
|
|
|
|
|
i) Payment of interest on NRI deposits |
1599 |
1737 |
503 |
531 |
567 |
417 |
ii) Payment of interest on loans from non-residents |
4165 |
5071 |
1831 |
1762 |
1895 |
1272 |
iii) Payment of dividend/profit to non-resident share holder |
3810 |
4681 |
1167 |
2075 |
789 |
1299 |
of which: |
|
|
|
|
|
|
Payment of dividend to non-resident share holder |
3208 |
4337 |
1076 |
1947 |
725 |
1228 |
Payment of profit to non-resident share holder |
602 |
344 |
91 |
128 |
64 |
71 |
iv) Reinvested Earning |
8668 |
11940 |
2730 |
2730 |
2730 |
2985 |
v) Payment of interest on debentures, FRNs, CPs fi xed deposits, Government securities etc. |
227 |
320 |
47 |
49 |
77 |
66 |
vi) Charges on SDRs |
9 |
19 |
7 |
4 |
5 |
5 |
vii) Interest paid on overdraft on VOSTRO a/c Holders/ OD on NOSTRO a/c |
656 |
397 |
23 |
28 |
146 |
23 |
viii) Payment of taxes by the Indians/refund of taxes by government to non-residents |
221 |
219 |
92 |
81 |
38 |
67 |
TOTAL ( i to viii) |
19355 |
24384 |
6400 |
7259 |
6247 |
6134 |
P: Preliminary. PR: Partially Revised. R: Revised. |
|