Combined Government Finances: 2007-08 The combined finances of the Central and State Governments for 2007-08 are expected to improve with the fiscal rule-based consolidation process that is underway. The key deficit indicators are budgeted to decline over the revised estimates for 2006-07, both in absolute terms and as percentage of GDP. The improvement in combined finances during 2007-08 would be largely brought about by the strengthening of the State Governments' finances, with the consolidated revenue account of the States envisaged to record a surplus. Buoyant tax revenue is expected to raise the revenue receipts in 2007-08, despite sluggishness in non-tax revenue. Non-developmental revenue expenditure is expected to be curtailed, thereby reducing the revenue expenditure. Consequently, the combined revenue deficit in 2007-08 is budgeted to decline by 0.8 per cent of GDP, enabling a reduction in the combined gross fiscal deficit (GFD) by 0.9 per cent of GDP in 2007-08 (Table 15).
Table 15: Key Fiscal Indicators |
(Per cent to GDP) |
Year |
Primary
Deficit |
Revenue
Deficit |
Gross Fiscal
Deficit |
Outstanding
Liabilities* |
1 |
2 |
3 |
4 |
5 |
Centre |
2002-03 |
1.1 |
4.4 |
5.9 |
63.6 |
2003-04 |
-0.03 |
3.6 |
4.5 |
62.9 |
2004-05 |
-0.04 |
2.5 |
4.0 |
63.9 |
2005-06 |
0.4 |
2.6 |
4.1 |
63.4 |
2006-07 RE |
0.2 |
2.0 |
3.7 |
61.5 |
|
(-0.2) |
(1.9) |
(3.5) |
|
2007-08 BE |
-0.2 |
1.5 |
3.3 |
59.2 |
States |
2002-03 |
1.2 |
2.3 |
4.1 |
32.0 |
2003-04 |
1.5 |
2.3 |
4.4 |
33.0 |
2004-05 |
0.7 |
1.3 |
3.4 |
32.9 |
2005-06 |
0.2 |
0.2 |
2.5 |
32.7 |
2006-07 RE |
0.4 |
0.1 |
2.8 |
30.8 |
2007-08 BE |
0.1 |
-0.3 |
2.3 |
29.8 |
Combined |
2002-03 |
3.1 |
6.7 |
9.5 |
80.2 |
2003-04 |
2.0 |
5.8 |
8.4 |
81.1 |
2004-05 |
1.4 |
3.8 |
7.5 |
81.9 |
2005-06 |
1.0 |
2.8 |
6.7 |
80.7 |
2006-07 RE |
0.9 |
2.1 |
6.4 |
77.5 |
2007-08 BE |
0.2 |
1.3 |
5.5 |
74.8 |
RE: Revised Estimates.
BE: Budget Estimates.
*: Includes external liabilities at historical exchange rates.
Note: 1. Figures in parentheses relate to provisional accounts.
2. Negative sign indicates surplus.
3. Data in respect of States relate to 28 States. |
Centre's Fiscal Situation According to the latest information on Central Government finances for 2007-08 (April-November), key deficit indicators, viz., revenue deficit and GFD, were placed lower than those in the corresponding period of the previous year, both in absolute terms as well as per cent of budget estimates (BE) (Chart 5). Revenue deficit during April-November 2007 was placed lower than that in April-November 2006 on account of higher revenue receipts and lower revenue expenditure, as per cent of BE. Apart from the lower revenue deficit, contraction in defence capital outlay also moderated the fiscal deficit. There was a primary surplus of Rs. 7,374 crore during the first eight months of 2007-08 as compared with the budgeted surplus of Rs. 8,047 crore. During April-November 2007, tax revenue, as per cent of BE, was higher than a year ago on account of impressive growth in income tax, corporation tax, customs duties and services tax. Receipts from new taxes, particularly fringe benefit tax and securities transaction tax, also remained buoyant in the first eight months of 2007-08. Union excise duties, however, continued to remain subdued. Non-tax revenue, as per cent of BE, was higher than a year ago on account of higher interest receipts, and dividends and profits. Aggregate expenditure (adjusted for acquisition cost of Reserve Bank's stake in SBI), as per cent of BE, was lower than a year ago. Capital outlay in the first eight months of 2007-08 showed a modest decline. While expenditure on interest payments and subsidies increased, the overall non-plan expenditure (adjusted for acquisition cost of Reserve Bank's stake in SBI) as a per cent of BE, was lower than a year ago. Non-debt capital receipts (adjusted for profit on sale of Reserve Bank's stake in SBI) were higher than the comparable budget estimate due to higher than budgeted recoveries of loans and advances, and disinvestment proceeds (Table 16). 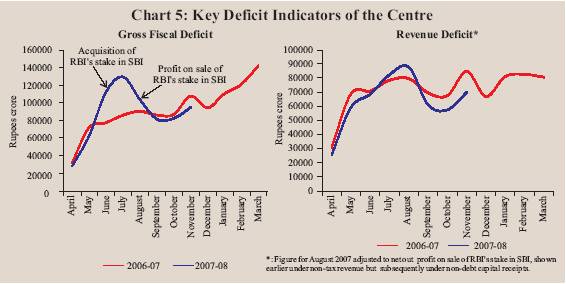
Table 16 : Central Government Finances during April-November 2007 |
(Rupees crore) |
Item |
2007-08
(Budget Estimates) |
April-November |
Per cent of Budget
Estimates
April-November
|
|
|
2006 |
2007 |
2006 |
2007 |
1 |
2 |
3 |
4 |
5 |
6 |
1. |
Revenue Receipts (i + ii) |
4,86,422 |
2,21,190 |
2,74,633 |
54.8 |
56.5 |
|
i) |
Tax Revenue |
4,03,872 |
1,76,956 |
2,20,372 |
54.1 |
54.6 |
|
ii) |
Non-tax Revenue |
82,550 |
44,234 |
54,261 |
58.0 |
65.7 |
2. |
Non-Debt Capital Receipts |
43,151 |
7,148 |
40,468 |
60.4 |
93.8 |
|
|
|
(3,151) |
|
(6,160) |
|
(195.5) |
3. |
Non-Plan Expenditure |
4,75,421 |
2,45,393 |
2,98,756 |
62.7 |
62.8 |
|
|
|
(4,35,421) |
|
(2,63,225) |
|
(60.5) |
|
of which: |
|
|
|
|
|
|
i) |
Interest Payments |
1,58,995 |
87,943 |
1,03,648 |
62.9 |
65.2 |
|
ii) |
Defence |
96,000 |
43,184 |
40,328 |
48.5 |
42.0 |
|
iii) |
Subsidies |
51,247 |
36,505 |
46,222 |
81.5 |
90.2 |
|
iv) |
Grants to States & UTs |
38,403 |
24,538 |
22,428 |
69.4 |
58.4 |
4. |
Plan Expenditure |
2,05,100 |
91,146 |
1,12,619 |
52.8 |
54.9 |
5. |
Revenue Expenditure |
5,57,900 |
3,05,673 |
3,44,607 |
62.6 |
61.8 |
6. |
Capital Expenditure |
1,22,621 |
30,866 |
66,768 |
40.7 |
54.5 |
|
|
|
(82,621) |
|
(31,237) |
|
(37.8) |
7. |
Total Expenditure |
6,80,521 |
3,36,539 |
4,11,375 |
59.7 |
60.5 |
|
|
|
(6,40,521) |
|
(3,75,844) |
|
(58.7) |
8. |
Revenue Deficit |
71,478 |
84,483 |
69,974 |
99.7 |
97.9 |
9. |
Gross Fiscal Deficit |
1,50,948 |
1,08,201 |
96,274 |
72.8 |
63.8 |
|
|
|
|
|
(95,051) |
|
(63.0) |
|
|
|
|
|
|
_ |
_ |
10. |
Gross Primary Deficit |
-8,047 |
20,258 |
-7,374 |
|
|
|
|
|
|
|
(-8,597) |
|
|
Note:
Figures in parentheses are net of transactions relating
to transfer of Reserve Bank's stake in SBI to the Government.
Source: Controller General of Accounts, Ministry of Finance, Government of India. |
Mid-Year Review by the Government of India During the first half of 2007-08, fiscal and revenue deficits (as per cent of BE) were higher than the targets prescribed under the Fiscal Responsibility and Budget Management (FRBM) rules. However, the Government had comfortably met the half-yearly target for total non-debt receipts as a proportion to BE. Fiscal deficit as a proportion of BE was also lower than that in the corresponding period of the previous year. However, there was a slippage in terms of revenue deficit as a proportion to BE. The Mid-Year Review for 2007-08 of the Central Government indicated that this was due to expenditure pressures resulting from higher subsidies as well as higher interest payments on account of larger borrowing under the Market Stabilisation Scheme (MSS). The faster pace of growth in expenditure during the first-half of 2007-08 was also attributed to front-loading, reflecting the seasonality of expenditure in certain sectors, embedded institutional factors relating to transfers to States and Union Territories and cash management measures to avoid parking of funds and rush in expenditure at the year-end. The Mid-Year Review also noted that in contrast, taxes/duties have more back-loaded payment schedules, leading to a gap between expenditures and receipts during the first half of the year. The Government expressed confidence in meeting the annual FRBM targets on the strength of fiscal consolidation measures in conjunction with growth dividends.
Table 17: Central Government Securities Issued during 2007-08 |
(Amount in Rupees crore/Maturity in years/Yield in per cent) |
Sr. |
Borrowings as per Issuance
Auction Calendar |
Actual Borrowings |
No. |
Period of Auction Amount |
Residual Maturity |
Period of Auction |
Amount |
Residual Maturity |
Yield |
1 |
2 |
3 |
4 |
5 |
6 |
7 |
8 |
1. |
April 5-12, 2007 |
6,000 |
5-9 |
April 12, 2007 |
6,000 |
8.39 |
8.16 |
|
|
4,000 |
20 and above |
April 12, 2007 |
4,000 |
29.15 |
8.58 |
2. |
April 20-27,2007 |
6,000 |
10-14 |
April 27, 2007 |
6,000 |
9.71 |
8.16 |
3. |
May 4-11, 2007 |
6,000 |
10-14 |
May 11, 2007 |
6,000 |
9.92 |
8.31 |
|
|
4,000 |
20 and above |
May 11, 2007 |
4,000 |
29.06 |
8.64 |
4. |
May 18-25, 2007 |
5,000 |
5-9 |
May 25, 2007 |
5,000 |
8.26 |
8.24 |
|
|
3,000 |
15-19 |
May 25, 2007 |
3,000 |
14.96 |
8.40 |
5. |
June 1-8, 2007 |
6,000 |
10-14 |
June 5, 2007 |
6,000 |
9.86 |
8.18 |
|
|
3,000 |
20 and above |
June 5, 2007 |
3,000 |
29.00 |
8.52 |
|
|
|
|
June 12, 2007 * |
5,000 |
9.84 |
8.44 |
6. |
June 15-22,2007 |
6,000 |
10-14 |
June 15, 2007 |
6,000 |
9.83 |
8.35 |
7. |
July 6-13, 2007 |
6,000 |
10-14 |
July 6, 2007 |
6,000 |
10.00 |
7.99 |
|
|
4,000 |
20 and above |
July 7, 2007 |
4,000 |
28.91 |
8.45 |
8. |
July 20-27,2007 |
6,000 |
5-9 |
July 20, 2007 |
6,000 |
6.10 |
7.59 |
|
|
3,000 |
20 and above |
July 20, 2007 |
3,000 |
25.10 |
8.34 |
9. |
August 3-10, 2007 |
6,000 |
10-14 |
August 3, 2007 |
6,000 |
9.93 |
7.93 |
|
|
4,000 |
20 and above |
August 3, 2007 |
4,000 |
24.87 |
8.45 |
10. |
August 17-24,2007 |
5,000 |
5-9 |
August 24, 2007 |
5,000 |
6.02 |
7.87 |
|
|
2,000 |
10-14 |
August 24, 2007 |
2,000 |
9.89 |
7.91 |
11. |
September 7-14, 2007 |
4,000 |
10-14 |
September 7, 2007 |
4,000 |
14.43 |
8.16 |
|
|
3,000 |
20 and above |
September 7, 2007 |
3,000 |
28.74 |
8.41 |
12. |
October 5-12, 2007 |
6,000 |
10-14 |
October 12, 2007 |
6,000 |
9.73 |
7.91 |
|
|
4,000 |
20 and above |
October 12, 2007 |
4,000 |
24.87 |
8.45 |
14. |
October 19-26, 2007 |
4,000 |
5-9 |
October 26, 2007 |
4,000 |
5.84 |
7.74 |
|
|
4,000 |
15-19 |
October 26, 2007 |
4,000 |
14.54 |
8.13 |
15. |
November 2-8, 2007 |
5,000 |
10-14 |
November 8, 2007 |
5,000 |
14.26 |
8.26 |
|
|
3,000 |
20 and above |
November 8, 2007 |
3,000 |
28.57 |
8.39 |
16. |
November 16-23, 2007 |
3,000 |
10-14 |
November 23, 2007 |
3,000 |
9.62 |
7.90 |
|
|
4,000 |
15-19 |
November 23, 2007 |
4,000 |
14.47 |
8.20 |
17. |
December 7-14, 2007 |
5,000 |
10-14 |
December 14, 2007 |
5,000 |
9.56 |
7.92 |
|
|
2,000 |
20 and above |
December 14, 2007 |
2,000 |
28.47 |
8.26 |
18. |
January 4-11, 2008 |
6,000 |
10-14 |
January 11, 2008 |
6,000 |
9.49 |
7.55 |
|
|
4,000 |
20 and above |
January 11, 2008 |
4,000 |
28.40 |
7.89 |
Memo: |
Year |
Weighted Average Maturity |
Weighted Average Yield |
2003-04 |
|
14.94 |
|
|
5.71 |
2004-05 |
|
14.13 |
|
|
6.11 |
2005-06 |
|
16.90 |
|
|
7.34 |
2006-07 |
|
14.72 |
|
|
7.89 |
2006-07 (up to January 18, 2007) |
|
14.56 |
|
|
7.86 |
2007-08 (up to January 18, 2008) |
|
14.57 |
|
|
8.15 |
* : Not scheduled. |
Extra-Budgetary Items The Central Government, besides providing explicit subsidies on petroleum, food and fertiliser, has also been periodically issuing special bonds to the oil marketing companies (since 1997-98), the Food Corporation of India (FCI) (in 2006-07) and fertiliser companies (in 2007-08) to support them. The issuance of these bonds per se is considered to be fiscal deficit neutral since they do not involve cash flow and are, therefore, not treated as part of budgetary expenditure/receipts. However, these bonds have fiscal implications as they add to the fiscal liabilities of the Government. Furthermore, as interest payments on such bonds are treated as part of the revenue expenditure, they affect the revenue deficit and, thereby, the fiscal deficit on a continuing basis.
During 2005-06 and 2006-07, special bonds were issued by the Government to oil marketing companies amounting to Rs.17,263 crore and Rs.24,121 crore, respectively, as compensation for their under recoveries on account of sale of sensitive petroleum products. In addition, special bonds amounting to Rs.16,200 crore were issued to FCI in 2006-07. During 2007-08, special bonds amounting to Rs.7,500 crore and Rs.23,457 crore, respectively, are envisaged to be issued to fertiliser companies and oil marketing companies. During the current fiscal year (up to January 18, 2008), special bonds amounting to Rs.3,890 crore and Rs.11,257 crore, respectively, were issued to fertiliser companies (as compensation for fertiliser subsidy) and to oil marketing companies (towards estimated under recoveries during 2007-08).
Cash Management and Central Government Market Borrowings
During 2007-08 (up to January 18, 2008), the actual issuances of dated securities amounted to Rs.1,47,000 crore as against Rs.1,42,000 crore scheduled in the calendar for the same period. All auctions were reissuances of existing securities, barring one new issue (10-year security) for Rs.6,000 crore on July 9, 2007. For the first time during the current year so far, an amount of Rs.957 crore devolved on the primary dealers (PDs) during the month of November 2007. Gross and net market borrowings (including 364-day Treasury Bills) during 2007-08 (up to January 18, 2008) amounted to Rs.1,73,429 crore and Rs.1,03,977 crore, respectively, accounting for 91.8 per cent and 94.9 per cent of the estimated borrowings for the year. The weighted average maturity of dated securities issued during 2007-08 (up to January 18, 2008) at 14.57 years was marginally higher than that of 14.56 years during the corresponding period of the previous year. The weighted average yield of dated securities issued during the same period was 8.15 per cent, as compared with 7.86 per cent (Table 17).
Commencing the year 2007-08 with a surplus cash balance of Rs.50,092 crore, the Central Government took recourse to Ways and Means Advance (WMA) during the greater part of the first quarter of the year on account of higher than anticipated spending, coupled with decline in investments in Treasury Bills by the States resulting from lower collections under the National Small Saving Fund (NSSF). The Central Government also resorted to overdraft during this period. A surplus was, however, built up in June 2007, ahead of acquisition of Reserve Bank's stake in SBI, which was used up by the month-end to meet this expenditure and the Central Government reverted to WMA. With the transfer of surplus from the Reserve Bank on August 9, 2007, the Centre's cash balance returned to a surplus mode and remained so thereafter. As on January 18, 2008, the surplus cash balance was placed at Rs.59,723 crore. During 2007-08 (up to January 18, 2008), the Centre took recourse to WMA for 91 days as compared with 39 days during the same period in 2006-07. The average utilisation of WMA/OD during 2007-08 (up to January 15, 2008) was Rs.5,315 crore as compared with Rs.500 crore in the corresponding period of the previous year. State Finances State Governments in their budgets for 2007-08 have committed to bring further improvement in their fiscal position in line with their Fiscal Responsibility Legislations. Notwithstanding some variations across the States, the consolidated revenue balance (of 28 State Governments) is budgeted to show a noticeable improvement in 2007-08, with a surplus of 0.3 per cent of GDP as compared with a deficit of 0.1 per cent of GDP in 2006-07 (RE). As a result, the GFD is estimated to decline to 2.3 per cent of GDP in 2007-08 (BE) from 2.8 per cent of GDP during 2006-07(RE). The consolidated primary deficit for the 28 States is budgeted at 0.1 per cent of GDP in 2007-08.
Cash Management and State Governments' Market Borrowings The net allocation (provisional) for the market borrowings of the State Governments during 2007-08 was placed at Rs.28,781 crore. Taking into account repayment of Rs.11,555 crore during the year, and additional allocation of Rs.37,483 crore (of which Rs. 35,358 crore was on account of allocation made by the Central Government in view of expected shortfall in NSSF collection), the gross allocation of market borrowings was placed at Rs.77,818 crore for the year 2007-08. Up to January 18, 2008, the States raised market loans amounting to Rs.39,671 crore (51.0 per cent of gross allocation) through auctions, as compared with Rs.12,989 crore (48.8 per cent of gross allocation) during the corresponding period of the previous year. The cut-off yield ranged between 8.00-8.90 per cent. The weighted average interest rate on market loans firmed up to 8.35 per cent during 2007-08 (up to January 18, 2008) from 7.99 per cent in the corresponding period of the previous year (Table 18).
The average daily utilisation of WMA and overdraft by the States during 2007-08 (up to December 2007) was Rs.834 crore, as against Rs.262 crore during the corresponding period of 2006-07 (Chart 6). Eight States availed of WMA and three States resorted to overdrafts during 2007-08 (up to December 2007) as compared with six States and two States, respectively, during the corresponding period of the previous year.
Table 18: Market Borrowings of State Governments - 2007-08 |
Item |
Date |
Cut-off Rate |
Tenor |
Amount Raised |
|
|
(Per cent) |
(Years) |
(Rupees crore) |
1 |
2 |
3 |
4 |
5 |
Auctions |
|
|
|
|
i. |
First |
April 19, 2007 |
8.30 |
10 |
1,837 |
ii. |
Second |
May 10, 2007 |
8.34 |
10 |
350 |
iii. |
Third |
May 17, 2007 |
8.40 |
10 |
1,400 |
iv. |
Fourth |
June 19, 2007 |
8.45-8.57 |
10 |
3,566 |
v. |
Fifth |
July 26, 2007 |
8.00-8.25 |
10 |
1,389 |
vi. |
Sixth |
August 16, 2007 |
8.30-8.90 |
10 |
3,485 |
vii. |
Seventh |
September 20, 2007 |
8.14-8.50 |
10 |
3,074 |
viii. |
Eighth |
October 4, 2007 |
8.20 |
10 |
590 |
xi. |
Ninth |
October 8, 2007 |
8.31-8.40 |
10 |
4,672 |
x. |
Tenth |
November 13, 2007 |
8.39-8.69 |
10 |
5,300 |
xi. |
Eleventh |
November 30, 2007 |
8.45-8.50 |
10 |
5,212 |
xii. |
Twelfth |
December 18 ,2007 |
8.39-8.58 |
10 |
2,963 |
xiii. |
Thirteenth |
January 7, 2008 |
8.03-8.12 |
10 |
5,833 |
Grand Total |
|
|
|
39,671 |
Memo: |
Year |
Weighted Average Yield
(per cent) |
2003-04 |
|
6.13 |
2004-05 |
|
6.45 |
2005-06 |
|
7.63 |
2006-07 |
|
8.10 |
2006-07 (up to January 18, 2007) |
|
7.99 |
2007-08 (up to January 18, 2008) |
|
8.35 |
Source: Reserve Bank of India. |

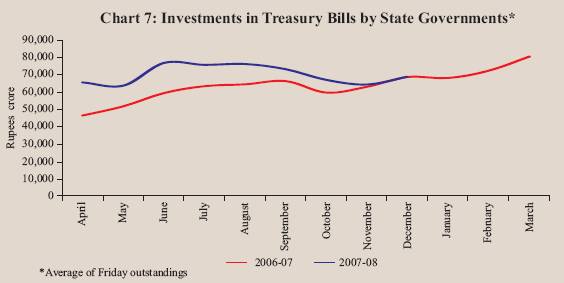
The cash surplus position of the States, as reflected in their investments in Treasury Bills (14-day and auction Treasury Bills), remained sizeable, although it decreased from Rs.73,403 crore at end-March 2007 to Rs.69,764 crore on Janu-ary 18, 2008. The average investment by the States in Treasury Bills during April-December 2007 amounted to Rs.70,528 crore as against Rs.60,583 crore in the corresponding period of the previous year (Chart 7).
|


