The global crisis, which created intense uncertainties for funding liquidity in the face of tight market liquidity for financial instruments trading in almost all financial markets, brought to the fore the strong interactions between funding liquidity and market liquidity. As the global liquidity crisis started to affect the domestic money and foreign exchange markets in the last quarter of 2008, the Reserve Bank ensured adequate provision of both domestic and foreign exchange liquidity to the market through banks, with the aim of restoring normal functioning of the market, and thereby facilitating adequate flow of credit to the productive sectors of the economy. As the Reserve Bank's net foreign exchange assets contracted on account of provision of dollar liquidity to the market, net domestic assets were expanded through policy actions to offset the impact so that overall rupee liquidity remains comfortable. The monetary policy stance of the Reserve Bank shifted from concerns related to inflation in the first half of 2008-09 to maintaining financial stability and arresting the moderation of growth in the second half. While money supply evolved consistent with indicative projections, credit to the private sector reflected the conditions evolving in the real sector of the economy. IV.1 Growth in monetary and liquidity aggregates during 2008-09 witnessed some moderation reflecting net capital outflows and deceleration in expansion of bank credit to the commercial sector. Broad money growth during the last quarter of 2008-09 moderated and remained marginally below the Reserve Bank’s projected trajectory of 19.0 per cent for the year 2008-09. Expansion in bank credit to the commercial sector remained strong up to October 2008 on the backdrop of drying up of other sources of funds to industry but has since decelerated and remained below the Reserve Bank’s Third Quarter Review projection of 24.0 per cent for the year 2008-09. The contractionary impact of decline in net foreign exchange assets on reserve money and domestic liquidity was offset by open market operations (OMO), unwinding under market stabilisation scheme (MSS) and other measures to augment rupee liquidity. Net Reserve Bank credit to Central Government increased substantially reflecting large purchases under OMO and unwinding under MSS. In response to the international financial turmoil and its possible impact on the domestic economy in the backdrop of the downturn in headline inflation, the Reserve Bank had taken a number of conventional and unconventional measures towards monetary easing since mid-September 2008. The aim of these measures was to ensure provision of ample liquidity to the banking system to make credit available for productive purposes for reviving the growth momentum.
Monetary Survey
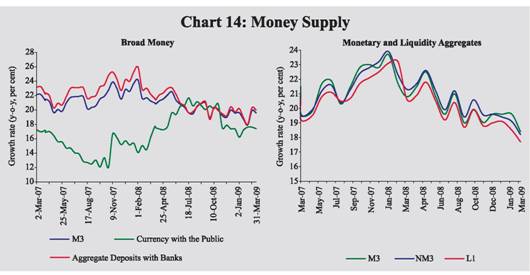
IV.2 Broad money (M3) growth, on a year-on-year (y-o-y) basis, was placed at 18.4 per cent at end-March 2009, which was lower than 21.2 per cent a year ago. Expansion in the residency-based new monetary aggregate (NM3) – which does not directly reckon non-resident foreign currency deposits such as FCNR(B) deposits – was lower at 18.2 per cent at end-March 2009 than 21.3 per cent a year ago. Similarly growth in liquidity aggregate, L1, was lower at 17.6 per cent than 20.6 per cent a year ago (Table 34 and Chart 14).
Table 34: Monetary Indicators |
(Amount in Rupees crore) |
Item |
Outstanding as on March 31, 2009 |
Variation (year-on-year) |
Mar. 31, 2008 |
Mar. 31, 2009 |
Absolute |
Per cent |
Absolute |
Per cent |
1 |
2 |
3 |
4 |
5 |
6 |
I. |
Reserve Money (M0) |
9,87,902 |
2,19,412 |
31.0 |
59,600 |
6.4 |
| |
(Reserve Money adjusted for CRR changes) |
|
(1,72,412) |
(25.3) |
(1,61,850) |
(19.0) |
II. |
Narrow Money (M1) |
12,45,557 |
1,86,443 |
19.3 |
93,125 |
8.1 |
III. |
Broad Money (M3) |
47,58,504 |
7,01,580 |
21.2 |
7,40,932 |
18.4 |
| |
a) |
Currency with the Public |
6,66,095 |
85,475 |
17.7 |
97,815 |
17.2 |
| |
b) |
Aggregate Deposits |
40,86,865 |
6,14,546 |
21.7 |
6,46,627 |
18.8 |
| |
|
i) |
Demand Deposits |
5,73,918 |
99,410 |
20.9 |
-1,179 |
-0.2 |
| |
|
ii) |
Time Deposits |
35,12,947 |
5,15,137 |
21.9 |
6,47,806 |
22.6 |
| |
|
|
of which: |
|
|
|
|
|
| |
|
|
Non-Resident Foreign Currency Deposits |
67,303 |
-10,525 |
-15.6 |
10,368 |
18.2 |
I V. |
NM 3 |
47,65,882 |
7,08,086 |
21.3 |
7,33,298 |
18.2 |
| |
of which: Call Term Funding from FIs |
1,11,739 |
20,668 |
24.1 |
5,235 |
4.9 |
V. |
a) |
L1 |
48,79,353 |
7,07,388 |
20.6 |
7,31,918 |
17.6 |
| |
|
of which: Postal Deposits |
1,13,471 |
-698 |
-0.6 |
-1,380 |
-1.2 |
| |
b) |
L2 |
48,82,285 |
7,07,388 |
20.5 |
7,31,918 |
17.6 |
| |
c) |
L3 |
49,06,932 |
7,08,221 |
20.4 |
7,31,713 |
17.5 |
VI. |
Major Sources of Broad Money |
|
|
|
|
|
| |
a) |
Net Bank Credit to the Government (i+ii) |
12,83,165 |
71,612 |
8.6 |
3,77,318 |
41.7 |
| |
|
i) |
Net Reserve Bank Credit to Government |
69,913 |
-1,15,632 |
- |
1,83,122 |
- |
| |
|
|
of which: to the Centre |
69,311 |
-1,16,772 |
- |
1,83,947 |
- |
| |
|
ii) |
Other Banks’ Credit to Government |
12,13,252 |
1,87,244 |
22.5 |
1,94,196 |
19.1 |
| |
b) |
Bank Credit to the Commercial Sector |
30,12,673 |
4,47,059 |
21.0 |
4,35,536 |
16.9 |
| |
c) |
Net Foreign Exchange Assets of the Banking Sector |
13,22,847 |
3,81,952 |
41.8 |
27,716 |
2.1 |
| |
d) |
Government Currency Liability to Public |
9,984 |
1,063 |
13.0 |
760 |
8.2 |
| |
e) |
Net Non-Monetary Liabilities of the Banking Sector |
8,70,165 |
2,00,107 |
35.1 |
1,00,399 |
13.0 |
Memo: |
Aggregate Deposits of SCBs |
38,30,322 |
5,85,006 |
22.4 |
6,33,382 |
Non-food Credit of SCBs |
27,23,801 |
4,32,846 |
23.0 |
4,06,287 |
SCBs : Scheduled Commercial Banks. FIs : Financial Institutions. NBFCs : Non-Banking Financial Companies.
NM3 is the residency-based broad money aggregate and L1, L2 and L3 are liquidity aggregates compiled on the recommendations of the Working Group on Money Supply, 1998.
L1 = NM3 + Select deposits with the post office saving banks.
L2 = L1 +Term deposits with term lending institutions and refinancing institutions + Term borrowing by FIs + Certificates of deposit issued by FIs.
L3 = L2 + Public deposits of NBFCs.
Note : 1. Data are provisional. Wherever data are not available, the data for last available month are repeated as estimates. 2. Government Balances as on March 31, 2009 are before closure of accounts. |
IV.3 Growth in key monetary aggregates during 2008-09 reflected changing liquidity conditions arising from domestic and global financial conditions and the necessary responses of monetary policy. The deterioration in the global financial conditions since September 2008 and capital outflows tightened domestic liquidity conditions. This necessitated the Reserve Bank to augment rupee and dollar liquidity and strengthen the credit delivery mechanisms for arresting the growth moderation through a series of policy measures. On the inflation front, WPI inflation moderated since August 2008 on account of the marked decline in international energy and commodity prices as well as slowdown in aggregate global demand due to persistence of financial market turmoil. In view of the prevailing macroeconomic scenario, the cash reserve ratio (CRR) has been reduced by a cumulative 4.0 percentage points from 9.0 per cent to 5.0 per cent since October 2008.This reduction in CRR released primary liquidity of the order of Rs.1,60,000 crore into the system. The repo rate was also reduced by a cumulative 4.0 percentage points to 5.0 per cent. The reverse repo rate was also reduced by 2.5 percentage points to 3.5 per cent (see Chapter VI, Table 66). The monetary and liquidity aggregates though remained strong, witnessed some moderation in the last quarter reflecting slowing down of economic growth.
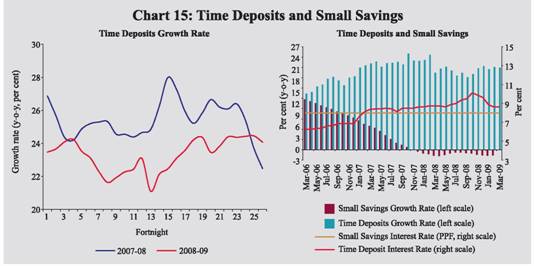
IV.4 The moderation in broad money (M3) growth mainly reflected a deceleration in aggregate deposits expansion during 2008-09 emanating from the downturn in economic activity. Currency in circulation remained high during the first half of 2008-09 reflecting the effects of disbursement under Farmers’ Debt Waiver Scheme and the Sixth Pay Commission payouts. Currency with the public grew by 17.2 per cent (y-o-y) at end-March 2009 as compared with 17.7 per cent a year ago (Table 35). Growth in time deposits decelerated during the first two quarters of 2008-09 but witnessed robust expansion thereafter reflecting some switching of demand deposits and other savings instruments to time deposits. Time deposits recorded a higher growth of 22.6 per cent (y-o-y) at end-March 2009 as compared with 21.9 per cent a year ago. The net outflows from small savings schemes that started from December 2007 continued up to February 2009, the latest period for which the data are available (Chart 15).
Table 35: Monetary Aggregates – Variations |
(Rupees crore) |
Item |
2007-08 |
2008-09 |
2008-09 |
Q1 |
Q2 |
Q3 |
Q4 |
1 |
2 |
3 |
4 |
5 |
6 |
7 |
M 3 (1+2+3 = 4+5+6+7-8) |
7,01,580 |
7,40,932 |
88,874 |
1,71,180 |
1,59,060 |
3,21,818 |
| |
(21.2) |
(18.4) |
|
|
|
|
1. |
Currency with the Public |
85,475 |
97,815 |
35,749 |
-17,971 |
40,431 |
39,606 |
| |
|
(17.7) |
(17.2) |
|
|
|
|
2. |
Aggregate Deposits with Banks |
6,14,546 |
6,46,627 |
57,235 |
1,88,636 |
1,11,585 |
2,89,171 |
| |
|
(21.7) |
(18.8) |
|
|
|
|
| |
2.1 |
Demand Deposits with Banks |
99,410 |
-1,179 |
-79,118 |
52,023 |
-61,730 |
87,646 |
| |
|
|
(20.9) |
(-0.2) |
|
|
|
|
| |
2.2 |
Time Deposits with Banks |
5,15,137 |
6,47,806 |
1,36,353 |
1,36,614 |
1,73,315 |
2,01,525 |
| |
|
|
(21.9) |
(22.6) |
|
|
|
|
3. |
‘Other’ Deposits with Banks |
1,558 |
-3,510 |
-4,110 |
514 |
7,045 |
-6,959 |
| |
|
(20.8) |
(-38.8) |
|
|
|
|
4. |
Net Bank Credit to Government |
71,612 |
3,77,318 |
36,224 |
30,879 |
1,29,330 |
1,80,885 |
| |
|
(8.6) |
(41.7) |
|
|
|
|
| |
4.1 |
RBI’s Net Credit to Government |
-1,15,632 |
1,83,122 |
-13 |
51,360 |
30,230 |
1,01,545 |
| |
|
4.1.1 RBI’s Net Credit to the Centre |
-1,16,772 |
1,83,947 |
1,430 |
51,379 |
29,932 |
1,01,206 |
| |
4.2 |
Other Banks’ Credit to Government |
1,87,244 |
1,94,196 |
36,237 |
-20,482 |
99,101 |
79,339 |
5. |
Bank Credit to the Commercial Sector |
4,47,059 |
4,35,536 |
31,107 |
1,59,864 |
88,766 |
1,55,799 |
| |
|
(21.0) |
(16.9) |
|
|
|
|
6. |
NFEA of Banking Sector |
3,81,952 |
27,716 |
66,858 |
7,271 |
-1,32,461 |
86,048 |
| |
6.1 |
NFEA of the RBI |
3,69,977 |
43,986 |
1,03,932 |
10,336 |
-1,56,330 |
86,048 |
7 |
Government’s Currency Liabilities to the Public |
1063 |
760 |
225 |
206 |
186 |
143 |
8 |
Net Non-Monetary Liabilities of the Banking Sector |
2,00,107 |
1,00,399 |
45,541 |
27,040 |
-73,239 |
1,01,056 |
Memo: |
1. |
Non-resident Foreign Currency Deposits with SCBs |
-10,525 |
10,368 |
2,048 |
3,898 |
-2,536 |
6,957 |
2. |
SCB’ Call-term Borrowing from Financial Institutions |
20,668 |
5,235 |
-1,116 |
7,015 |
-685 |
21 |
3. |
Overseas Borrowing by SCBs |
12,546 |
-2,795 |
9,494 |
4,600 |
-5,185 |
-11,704 |
SCBs : Scheduled Commercial Banks. NFEA : Net Foreign Exchange Assets.
Note : 1. Data are provisional.
2. Figures in parentheses are percentage variations. |
IV.5 On the sources side of broad money (M3), growth of bank credit to commercial sector decelerated and expansion in net foreign exchange assets of the banking sector moderated to a large extent. On the other hand, net Reserve Bank credit to the Centre increased reflecting the decline in outstanding balances under MSS, increase in open market operations (including purchase of oil bonds under special market operations) and decline in the Centre’s surplus with the Reserve Bank. However, growth in scheduled commercial banks’ (SCBs) credit to Government witnessed some moderation during this period. Bank credit to the commercial sector increased by 16.9 per cent (y-o-y) at end-March 2009 as compared with 21.0 per cent a year ago. Non-food credit growth (y-o-y) of SCBs picked up during the first two quarters of 2008-09, on the backdrop of sizeable rise in credit to petroleum sector due to the funding requirements of oil companies and substitution of funds raised by corporates from non-banking and external sources. It peaked during October-November 2008 but witnessed sustained deceleration thereafter. Non-food credit-growth (y-o-y) was 17.5 per cent at end-March 2009 as compared with 23.0 per cent a year ago (Table 36). The lower expansion in credit relative to the expansion in deposits resulted in a decline in the incremental credit-deposit ratio (y-o-y) of SCBs to 64.4 per cent at end-March 2009 from 73.6 per cent a year ago (Chart 16).
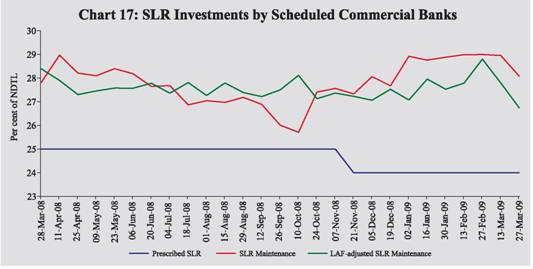
IV.6 Scheduled commercial bank’s investment in SLR securities as a per cent of their net demand and time liabilities (NDTL) increased at end-March 2009 to 28.1 per cent from 27.8 per cent a year ago. However, adjusted for LAF collateral securities on an outstanding basis, SCB’s holding of SLR securities amounted to Rs.11,10,156 crore or 26.7 per cent of NDTL at end-March, 2009 - implying an excess of Rs.1,13,817 crore or 2.7 per cent of NDTL over the prescribed SLR of 24.0 per cent of NDTL (Chart 17).
IV.7 Bank credit flow from scheduled commercial banks moderated to 17.3 per cent (y-o-y) at end-March 2009 as compared with 22.3 per cent a year ago. The deceleration in credit expansion was observed across the banking system, but it was sharper for the private and foreign banks (Table 37).
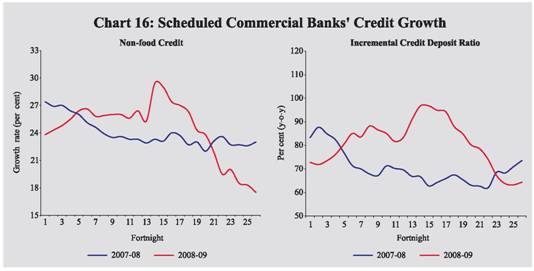
Table 36: Scheduled Commercial Bank Survey |
(Amount in Rupees crore) |
Item |
Outstanding as on Mar. 27, 2009 |
Variation (year-on-year) |
As on Mar. 28, 2008 |
As on Mar. 27, 2009 |
Amount |
Per cent |
Amount |
Per cent |
1 |
2 |
3 |
4 |
5 |
6 |
Sources of Funds |
|
|
|
|
|
1. |
Aggregate Deposits |
38,30,322 |
5,85,006 |
22.4 |
6,33,382 |
19.8 |
2. |
Call/Term Funding from Financial Institutions |
1,11,739 |
20,668 |
24.1 |
5,235 |
4.9 |
3. |
Overseas Foreign Currency Borrowings |
41,655 |
12,546 |
39.3 |
-2,795 |
-6.3 |
4. |
Capital |
47,016 |
9,695 |
28.5 |
3,246 |
7.4 |
5. |
Reserves |
2,81,673 |
60,126 |
35.6 |
52,821 |
23.1 |
Uses of Funds |
|
|
|
|
|
1. |
Bank Credit |
27,70,012 |
4,30,724 |
22.3 |
4,08,099 |
17.3 |
| |
of which: Non-food Credit |
27,23,801 |
4,32,846 |
23.0 |
4,06,287 |
17.5 |
2. |
Investments in Government and |
|
|
|
|
|
| |
Other Approved Securities |
11,65,746 |
1,80,199 |
22.8 |
1,94,031 |
20.0 |
| |
a) |
Investments in Government Securities |
11,48,168 |
1,82,603 |
23.5 |
1,89,507 |
19.8 |
| |
b) |
Investments in Other Approved Securities* |
17,578 |
-2,405 |
-15.6 |
4,524 |
34.7 |
3. |
Investments in non-SLR Securities |
2,11,953 |
30,155 |
21.5 |
41,344 |
24.2 |
4. |
Foreign Currency Assets |
56,251 |
-27,564 |
-46.9 |
25,062 |
80.4 |
5. |
Balances with the RBI |
2,38,195 |
76,900 |
42.7 |
-18,927 |
-7.4 |
* : Refer to investment in SLR securities as notified in the Reserve Bank notification DBOD No. Ref. BC. 61/12.02.001/2007-08 dated February 13, 2008.
Note : Data are provisional. |
IV.8 Disaggregated data on sectoral deployment of gross bank credit available up to February 27, 2009 showed that 52.5 per cent of incremental non-food credit (y-o-y) was absorbed by industry as compared with 45.2 per cent in the corresponding period of the previous year. The expansion of incremental non-food credit to industry during this period was led by infrastructure, petroleum, coal products & nuclear fuels, iron & steel, engineering, construction and chemical & chemical products industries. Small enterprises (both small industrial and services enterprises) absorbed 15.4 per cent of the total incremental non-food credit as compared with 19.2 per cent in the same period of the previous year. The infrastructure sector alone accounted for 31.3 per cent of the incremental credit to industry as compared with 33.2 per cent in the corresponding period of the previous year. The agricultural sector absorbed 13.0 per cent of the incremental non-food bank credit as compared with 9.2 per cent in the corresponding period of the previous year. Personal loans that accounted for 10.7 per cent of the incremental non-food credit witnessed some moderation; within personal loans, housing loans decelerated to a large extent. Growth in loans to commercial real estate and non-banking financial companies remained high (Table 38).
Table 37: Credit Flow from Scheduled Commercial Banks |
(Amount in Rupees crore) |
Item |
Outstanding as on March 27, 2009 |
Variation (year-on-year) |
As on March 28, 2008 |
As on March 27, 2009 |
Amount |
Per cent |
Amount |
Per cent |
1 |
2 |
3 |
4 |
5 |
6 |
1. |
Public Sector Banks |
20,11,591 |
3,07,310 |
22.5 |
3,41,442 |
20.4 |
2. |
Foreign Banks |
1,69,350 |
36,116 |
28.5 |
6,483 |
4.0 |
3. |
Private Banks |
5,23,038 |
78,301 |
19.9 |
51,559 |
10.9 |
4. |
All Scheduled Commercial Banks* |
27,70,012 |
4,30,724 |
22.3 |
4,08,099 |
17.3 |
*: Includes Regional Rural Banks
Note: Data are provisional. |
Table 38: Non-food Bank Credit - Sectoral Deployment |
(Amount in Rupees crore) |
Sector/Industry |
Outstanding as on Feb. 27, 2009 |
Year-on-Year Variations |
Feb. 15, 2008 |
Feb. 27, 2009 |
| |
|
Absolute |
Per cent |
Absolute |
Per cent |
1 |
2 |
3 |
4 |
5 |
6 |
Non-food Gross Bank Credit (1 to 4) |
24,92,685 |
3,71,053 |
22.0 |
4,06,304 |
19.5 |
1. |
Agriculture and Allied Activities |
2,97,753 |
34,013 |
16.4 |
52,742 |
21.5 |
2. |
Industry (Small, Medium and Large) |
10,39,821 |
1,67,819 |
25.9 |
2,13,261 |
25.8 |
3. |
Personal Loans |
5,55,392 |
58,669 |
13.2 |
43,559 |
8.5 |
| |
Housing |
2,72,376 |
26,930 |
12.0 |
19,012 |
7.5 |
| |
Advances against Fixed Deposits |
45,779 |
5,773 |
15.6 |
2,872 |
6.7 |
| |
Credit Cards |
28,926 |
8,947 |
51.3 |
2,332 |
8.8 |
| |
Education |
27,832 |
5,938 |
40.9 |
7,030 |
33.8 |
| |
Consumer Durables |
8,211 |
525 |
5.9 |
-1,393 |
-14.5 |
4. |
Services |
5,99,719 |
1,10,553 |
28.4 |
96,742 |
19.2 |
| |
Transport Operators |
38,638 |
9,669 |
43.3 |
5,783 |
17.6 |
| |
Professional & Other Services |
39,841 |
5,188 |
24.1 |
13,071 |
48.8 |
| |
Trade |
1,38,187 |
17,731 |
17.5 |
17,896 |
14.9 |
| |
Real Estate Loans |
90,765 |
11,361 |
26.7 |
34,533 |
61.4 |
| |
Non-Banking Financial Companies |
90,521 |
20,979 |
48.6 |
26,651 |
41.7 |
Memo: |
Priority Sector |
8,28,892 |
99,277 |
16.9 |
1,33,304 |
19.2 |
Micro & Small Enterprises (Manufacturing & Services) |
2,39,399 |
71,182 |
67.4 |
62,580 |
35.4 |
Industry (Small, Medium and Large) |
10,39,821 |
1,67,819 |
25.9 |
2,13,261 |
25.8 |
Food Processing |
53,855 |
11,720 |
32.0 |
5,190 |
10.7 |
Textiles |
1,03,732 |
16,862 |
23.0 |
11,537 |
12.5 |
Paper & Paper Products |
16,491 |
2,470 |
23.0 |
3,132 |
23.4 |
Petroleum, Coal Products & Nuclear Fuels |
72,762 |
7,412 |
23.3 |
31,933 |
78.2 |
Chemicals and Chemical Products |
73,269 |
7,437 |
13.9 |
11,899 |
19.4 |
Rubber, Plastic & their Products |
13,269 |
1,355 |
16.1 |
3,368 |
34.0 |
Iron and Steel |
1,00,383 |
11,661 |
19.2 |
27,117 |
37.0 |
Other Metal & Metal Products |
30,111 |
3,634 |
18.5 |
6,302 |
26.5 |
Engineering |
66,868 |
10,623 |
26.2 |
15,884 |
31.2 |
Vehicles, Vehicle Parts and Transport Equipments |
35,505 |
7,337 |
38.4 |
7,157 |
25.2 |
Gems & Jewellery |
27,242 |
2,073 |
9.3 |
2,454 |
9.9 |
Construction |
38,207 |
5,856 |
33.3 |
14,141 |
58.8 |
Infrastructure |
2,56,860 |
55,716 |
42.1 |
66,770 |
35.1 |
Note: 1. Data are provisional and relate to select scheduled commercial banks.
2.Data also include the figures of Bharat Overseas Bank, which was merged with Indian Overseas Bank, American
Express Bank with Standard Chartered Bank and State Bank of Saurashtra with State Bank of India.
3. Credit growth for February 2008 has been calculated with outstanding as on February 15, 2008 to obtain variations over comparable 26 fortnights data. |
IV.9 Apart from banks, the commercial sector mobilised resources from a variety of other sources such as issuances in capital markets, commercial paper, non-banking financial companies (NBFCs), financial institutions, external commercial borrowings, issuances of American Depository Receipts (ADRs)/Global Depository Receipts (GDRs) and foreign direct investment. During 2008-09, so far, flow of resources to the commercial sector declined reflecting subdued conditions in the domestic capital markets as well as deceleration of funds flow from external sources. Among the domestic sources, barring private placement and credit by housing companies, flow of resources from other sources have declined. Among the foreign sources, barring foreign direct investment, flow of resources from all other sources has declined (Table 39).
Table 39: Flow of Financial Resources to Commercial Sector |
(Rupees crore) |
Item |
2007-08 |
2008-09 |
1 |
2 |
3 |
A. |
Adjusted non-food Bank Credit (NFC) |
4,44,807 |
4,14,902 |
| |
i) |
Non-Food Credit |
4,32,846 |
4,06,287 |
| |
ii) |
Non-SLR Investment by SCBs |
11,961 |
8,615 |
B. |
Flow from Non-banks (B1+B2) |
3,35,698 |
2,64,138 |
| |
B1. Domestic Sources |
1,72,338 |
1,50,604 |
| |
1. |
Public issues by non-financial entities |
51,478 |
14,205 |
| |
2. |
Gross private placements by non-financial entities # |
47,419 |
51,254 |
| |
3. |
Net issuance of CPs subscribed by non-banks |
10,660 |
5,365 |
| |
4. |
Net Credit by housing finance companies ** |
8,693 |
16,438 |
| |
5. |
Total gross accommodation by 4 RBI regulated AIFIs - |
|
|
| |
|
NABARD, NHB, SIDBI & EXIM Bank # |
4,650 |
9,862 |
| |
6. |
Systemically important non-deposit taking NBFCs net of bank credit # |
25,163 |
-12,335 |
| |
7. |
LIC’s gross investment in Corporate Debt, Infrastructure and Social Sector |
24,275 |
65,815 |
| |
B2. Foreign Sources |
1,63,360 |
1,13,534 |
| |
1. |
External Commercial Borrowings / FCCB # |
70,382 |
32,765 |
| |
2. |
ADR/GDR Issues excluding banks and financial institutions |
13,023 |
4,788 |
| |
3. |
Short-term Credit from abroad @ |
53,080 |
4,584 |
| |
4. |
Foreign Direct Investment * |
26,875 |
71,397 |
C. |
Total Flow of Financial Resources (A+B) |
7,80,505 |
6,79,040 |
# : Up to December 2008 * : Up to January 2009. @ : Up to February 2009 ** : Up to September 2008.
Note: Data not comparable with those published in the Macroeconomic Monetary Developments: Third Quarter Review 2008-09, which were exclusive of item no. B1.7. |
Reserve Money Survey
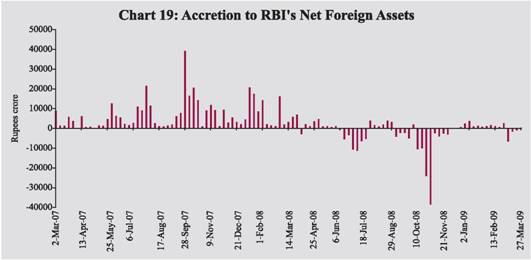
IV.10 The intra-year movements in reserve money largely reflected the Reserve Bank’s market operations and movements in bankers’ deposits with the Reserve Bank in the wake of changes in the CRR and large expansion in demand and time liabilities. In view of the inflationary pressures in the beginning of 2008-09, the Reserve Bank initially raised CRR by 150 basis points during April-August 2008-09 to 9.0 per cent. Subsequently, in view of the international financial turmoil and its possible impact on the domestic monetary and liquidity conditions on the backdrop of easing inflationary pressure, the Reserve Bank reduced CRR by a total 400 basis points since October 11, 2008. In the context of sharp changes in the CRR during 2008-09, for analytical purposes reserve money growth adjusted for the first round impact of CRR changes has become more relevant. Adjusted for the first round effect of the changes in CRR, reserve money growth (y-o-y) as on March 31, 2009 was lower at 19.0 per cent as compared with 25.3 per cent a year ago (Chart 18). On the sources side, reserve money was driven by net domestic assets during 2008-09 in contrast to net foreign exchange assets (adjusted for revaluation) being the major driver for preceding three years. The contractionary impact of decline in net foreign exchange assets on reserve money and domestic liquidity was offset by expansion of net domestic assets through open market operations (OMO), unwinding MSS and other measures to augment rupee liquidity (See Chapter V, Annex 2). Net Reserve Bank’s credit to the Centre during 2008-09 increased by Rs.1,83,947 crore as against a decrease of Rs.1,16,772 crore during the corresponding period of the previous year (Table 40). The Reserve Bank’s foreign currency assets (adjusted for revaluation) decreased by Rs.1,00,308 crore as against an increase of Rs.3,70,550 crore during the corresponding period of the previous year (Chart 19). Adjusted for the first round effect of the changes in CRR, reserve money growth (y-o-y) as on April 10, 2009 was at 17.3 per cent as compared with 20.4 per cent a year ago.
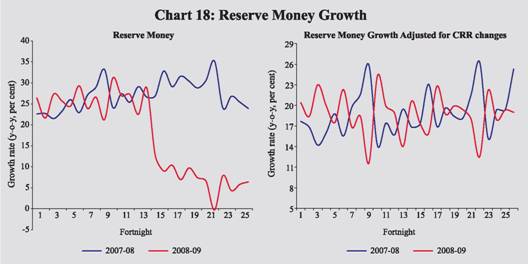
Table 40: Reserve Money - Variations |
(Amount in Rupees crore) |
Item |
Outstanding as on Mar. 31,09 |
2007-08 |
2008-09 |
2008-09 |
Q1 |
Q2 |
Q3 |
Q4 |
1 |
2 |
3 |
4 |
5 |
6 |
7 |
8 |
Reserve Money |
9,87,902 |
2,19,412 |
59,600 |
3,416 |
25,218 |
-70,452 |
1,01,417 |
| |
|
(31.0) |
(6.4) |
|
|
|
|
Adjusted Reserve Money |
|
1,72,412 |
1,61,850 |
-24,584 |
-4,532 |
69,548 |
1,21,417 |
| |
|
(25.3) |
(19.0) |
|
|
|
|
Components (1+2+3) |
|
|
|
|
|
|
|
1. |
Currency in Circulation |
6,91,083 |
86,702 |
1,00,282 |
36,859 |
-14,516 |
38,277 |
39,663 |
| |
|
|
(17.2) |
(17.0) |
|
|
|
|
2. |
Bankers’ Deposits with RBI |
2,91,275 |
1,31,152 |
-37,172 |
-29,333 |
39,219 |
-1,15,773 |
68,714 |
| |
|
|
(66.5) |
(-11.3) |
|
|
|
|
3. |
‘Other’ Deposits with the RBI |
5,544 |
1,558 |
-3,510 |
-4,110 |
514 |
7,045 |
-6,959 |
| |
|
|
(20.8) |
(-38.8) |
|
|
|
|
Sources (1+2+3+4-5) |
|
|
|
|
|
|
|
1. |
RBI’s net Credit to Government |
69,913 |
-1,15,632 |
1,83,122 |
-13 |
51,360 |
30,230 |
1,01,545 |
| |
of which: to Centre (i+ii+iii+iv-v) |
69,311 |
-1,16,772 |
1,83,947 |
1,430 |
51,379 |
29,932 |
1,01,206 |
| |
i. |
Loans and Advances |
0 |
0 |
0 |
0 |
0 |
0 |
0 |
| |
ii. |
Treasury Bills held by the RBI |
0 |
0 |
0 |
0 |
0 |
0 |
0 |
| |
iii. |
RBI’s Holdings of Dated Securities |
1,57,389 |
17,421 |
42,796 |
-39,239 |
56,975 |
-44,206 |
69,266 |
| |
iv. |
RBI’s Holdings of Rupee Coins |
99 |
121 |
-34 |
-1 |
-26 |
27 |
-33 |
| |
v. |
Central Government Deposits |
88,177 |
1,34,314 |
-1,41,184 |
-40,670 |
5,570 |
-74,111 |
-31,974 |
2. |
RBI’s Credit to Banks and |
|
|
|
|
|
|
|
| |
Commercial Sector |
24,177 |
-2,794 |
17,799 |
-3,358 |
4,963 |
5,032 |
11,163 |
3. |
NFEA of RBI |
12,80,116 |
3,69,977 |
43,986 |
1,03,932 |
10,336 |
-1,56,330 |
86,048 |
| |
|
|
(42.7) |
(3.6) |
|
|
|
|
| |
of which : |
|
|
|
|
|
|
|
| |
FCA, adjusted for revaluation |
- |
3,70,550 |
-1,00,308 |
15,535 |
-31,641 |
-92,102 |
7,900 |
4. |
Governments’ Currency |
|
|
|
|
|
|
|
| |
Liabilities to the Public |
9,984 |
1,063 |
760 |
225 |
206 |
186 |
143 |
5. |
Net Non-Monetary Liabilities of RBI |
3,96,289 |
33,202 |
1,86,068 |
97,369 |
41,648 |
-50,431 |
97,481 |
Memo: |
Net Domestic assets |
-2,92,214 |
-1,50,565 |
15,614 |
-1,00,516 |
14,882 |
85,879 |
15,370 |
LAF- Repos (+) / Reverse Repos(-) |
-1,485 |
21,165 |
-51,835 |
-45,350 |
51,480 |
-62,170 |
4,205 |
Net Open Market Sales # * |
- |
-5,923 |
-94,548 |
-8,696 |
-10,535 |
-7,669 |
-67,649 |
Centre’s Surplus |
16,319 |
26,594 |
-60,367 |
-42,427 |
6,199 |
-32,830 |
8,691 |
Mobilisation under the MSS |
88,077 |
1,05,419 |
-80,315 |
6,040 |
-628 |
-53,754 |
-31,973 |
Net Purchases(+)/Sales(-) from |
|
|
|
|
|
|
|
Authorised Dealers |
- |
3,12,054 |
-1,60,765^ |
3,956 |
-52,761 |
-1,11,877 |
-83^ |
NFEA/Reserve Money @ |
129.6 |
133.2 |
129.6 |
143.8 |
141.1 |
134.7 |
129.6 |
NFEA/Currency @ |
185.2 |
209.2 |
185.2 |
213.5 |
220.2 |
183.3 |
185.2 |
NFEA : Net Foreign Exchange Assets. FCA : Foreign Currency Assets. LAF : Liquidity Adjustment Facility. * : At face value.
# : Excludes Treasury Bills @ : Per cent; end of period ^: Up to end-February 2009.
Note:1. Data are based on March 31 for Q4 and last reporting Friday for all other quarters.
2. Figures in parentheses are percentage variations.
3.Government Balances as on March 31, 2009 are before closure of accounts. |
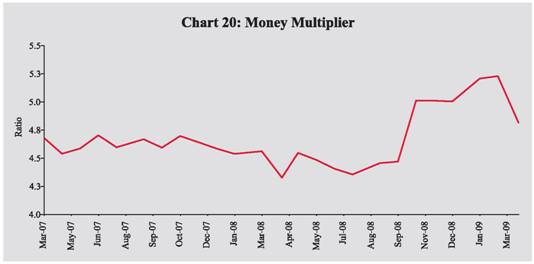
IV.11 The changes in CRR have impacted the money multiplier, i.e., the ratio between broad money and reserve money. The money multiplier, which had declined from 4.7 at end-March 2007 to 4.3 at end-March 2008 in the wake of CRR hikes, increased to 4.8 at end-March 2009, reflecting subsequent lowering of CRR (Chart 20).
IV.12 Movements in the net Reserve Bank's credit to the Central Government during 2008-09 largely reflected the liquidity management operations by the Reserve Bank and changes in Central Government deposits with the Reserve Bank. In particular, the net Reserve Bank's credit to the Central Government increased on account of the Reserve Bank's purchases under OMO, decline in Centre's cash balances with the Reserve Bank and unwinding of balances under MSS (details in Chapter V, see Table 47).
|