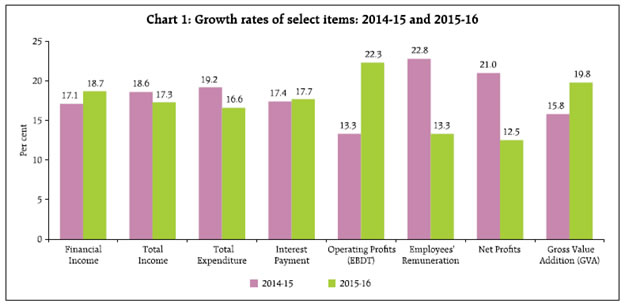
An analysis of the financial performance of select 21,186 non-government non-banking financial and investment companies (NGNBF&I) for the year 2015-16 showed that their overall performance improved, with growth at an accelerated pace and a distinct improvement in operating profit margin as well as in the return of equity. However, their liquidity position deteriorated and both leverage ratio and bad debts to expected receivables ratio rose from their levels a year ago. This article presents an analysis of the performance of non-government non-banking financial and investment (NGNBF&I) companies (excluding insurance and banking companies) for the financial year 2015-16, based on the audited annual accounts of 21,186 companies which closed their accounts during the period April 2015 to March 2016. Of these, data pertaining to 20,655 companies are based on Ministry of Corporate Affairs (MCA)1 systems, data for 361 companies are as collated by Department of Statistics and Information Management (DSIM) from Department of Non- Banking Supervision (DNBS), Regional Offices of Reserve Bank of India, while the data for the remaining 170 companies are obtained from other sources. A comparative picture on performance of these companies during the last three-year period i.e., from 2013-14 to 2015-16 has been assessed in this article. The detailed data for select 21,186 companies along with explanatory notes have been made available in the Data Release section of the Reserve Bank of India website in March 2017. As per provisional estimate of population paid-up capital (PUC) supplied by Ministry of Corporate Affairs (MCA), Government of India (GoI), the select 21,186 NGNBF&I companies accounted for 74.9 per cent of total PUC of all NGNBF&I as on March 31, 2016. Identification of NGNBF&I companies were based on National Industrial Classification (NIC) 2004 code and they were further classified into five major activity groups, viz., (1) Share Trading and Investment Holding, (2) Loan Finance, (3) Asset Finance, (4) Diversified and (5) Miscellaneous(including Chit Fund and Mutual Fund companies). In terms of PUC and financial income, the composition of select 21,186 NGNBF&I companies showed that “Loan Finance” has the largest share followed by “Share Trading and Investment Holding” and “Asset Finance” companies (Table 1). 1. Growth Rates: Gross Value Added improved significantly 1.1 The gross value added (GVA) of NGNBF&I companies witnessed a higher growth of 19.8 per cent in 2015-16 as against 15.8 per cent registered in 2014- 15. The improvement in GVA was mainly on account of higher growth in the financial income as compared to total expenditure during 2015-16. Among the activity groups, “Loan Finance”, “Asset Finance” and “Miscellaneous” companies, witnessed increase in GVA during 2015-16 as compared with the previous year (Chart 1 and Statement 1). 1.2 Financial income recorded a growth of 18.7 per cent in 2015-16 as against 17.1 per cent in 2014-15. This growth in financial income was mainly driven by higher dividend income during the year (Chart 1 and Statement 1).
| Table 1: Composition of Select 21,186 Companies by Activity Group – 2015-16 |
| (Per cent) |
| Activity |
No. of Companies |
Paid-up Capital |
Financial Income |
Total Net Assets |
| Share Trading and Investment Holding |
43.8 |
28.0 |
11.4 |
12.1 |
| Loan Finance |
11.3 |
31.9 |
42.1 |
37.1 |
| Asset Finance |
19.1 |
27.0 |
31.7 |
37.5 |
| Diversified |
4.4 |
1.4 |
0.6 |
0.6 |
| Miscellaneous |
21.5 |
11.8 |
14.2 |
12.8 |
| Of which: |
|
|
|
|
| Chit Fund/Kuri and Mutual Fund including UTI |
8.2 |
1.0 |
1.6 |
1.0 |
| All Activities |
100.0 |
100.0 |
100.0 |
100.0 |
| |
(21,186) |
(976,884) |
(1,517,515) |
(13,855,640) |
| Note: Figures in parentheses represents total under respective column. The amounts are in ₹ million. |
1.3 Total expenditure, on the other hand, grew at a lower rate as compared to total income, resulting in higher operating profits (EBDT) growth of 22.3 per cent in 2015-16 as against 13.3 per cent in 2014-15. Significant drop in the growth rate of employee’s remuneration was also seen in 2015-16 (Chart 1). 1.4 The growth in net profits had slowed down to 12.5 per cent in 2015-16 from 21.0 per cent in 2014-15 due to significant growth in the tax provision during 2015-16 (Statement 1). 1.5 The growth rate of total borrowings rose to 21.9 per cent in 2015-16 from 20.2 per cent in 2014-15. However, the growth in borrowings from banks had decelerated to 19.6 per cent in 2015-16 from 26.5 per cent in the previous year. It was also observed that the growth in investments (short and long term investments together) had dropped to 3.7 per cent in 2015-16 from 7.5 per cent witnessed in the preceding year (Statement 1).
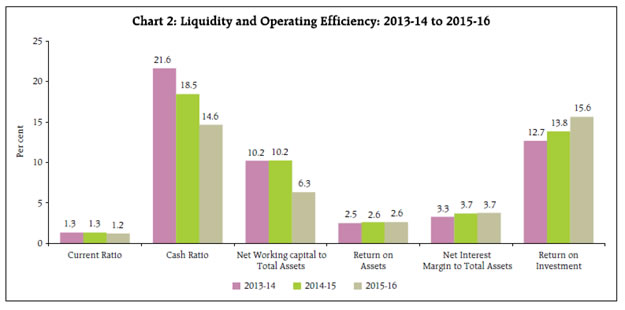
2. Liquidity Position and Operating Efficiency: Net Working Capital decline, while Return on Investments Improved 2.1 The liquidity position of the companies to meet its short-term obligations as measured by the current ratio (ratio of current assets to current liabilities) decreased marginally to 1.2 in 2015-16 from 1.3 in the previous year. Further, the cash ratio (ratio of cash and cash equivalents to current liabilities) and net working capital (current assets minus current liabilities expressed as a percentage of total assets) also declined in 2015-16 from its position in the preceding year (Chart 2 and Statement 2).
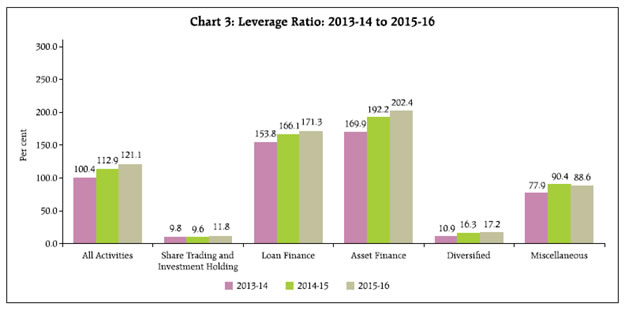
2.2 On the operational side, return on investments (RoI) (measured as a ratio of net profits to total investments) increased to 15.6 per cent in 2015-16 from 13.8 per cent in 2014-15. However, the net interest margin expressed as a percentage of total assets remained at 3.7 per cent as in the previous year (Chart 2 and Statement 2). 3. Profitability Ratios: Operating Profit margin as well as RoE improved 3.1 The operating profit margin, measured as a ratio of operating profits to financial income increased marginally to 34.1 per cent in 2015-16 from 33.1 per cent in the previous year. Among the activity groups, “Share Trading and Investment Holding”, “Loan Finance” and “Asset Finance” companies witnessed increase in operating profit margin during 2015-16 as compared with the previous year (Statement 2). 3.2 The return on equity (RoE) (measured as a ratio of net profits to net worth) increased to 8.7 per cent in 2015-16 from 8.2 per cent in 2014-15. Increase in the RoE was witnessed among all the activity groups in 2015-16 (Statement 2). 3.3 The dividend payout ratio (measured as a ratio of dividends paid to net profits) declined from 23.5 per cent in 2014-15 to 22.5 per cent in 2015-16. However, “Loan Finance” and “Diversified” companies witnessed increase in the dividend payout ratio among the activity groups during 2015-16 (Statement 2). 4. Vulnerability: Leverage and Bad Debts to Expected Receivables Ratios increased 4.1 The select NGNBF&I companies witnessed increasing trend in leverage ratio (measured as a ratio of debt to equity) over the three-year period and had gone up to 121.1 per cent in 2015-16. The leverage ratio of “Loan Finance” and “Asset Finance” companies was at significantly high level with increasing trend during the three-year period as compared to other activity groups (Chart 3).
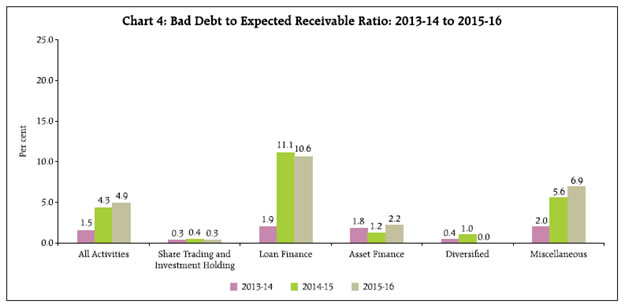
4.2 Though the overall financial operation of NGNBF&I companies had improved in terms of RoE and RoI in 2015-16 as compared with the preceding year, their bad debts to expected receivables2 ratio had gone up to 4.9 per cent in 2015-16 from 4.3 per cent in 2014-15, which is a drain on their profits. Bad debts to expected receivables ratio was observed to be higher for “Loan Finance” and “Miscellaneous” companies though the position has improved marginally for “Loan Finance” companies (Chart 4 and Statement 2).
5. Income and Expenditure: Share of Interest Income in Total Income as well as share of Interest Expenses in Total Expenditure increased 5.1 The fund based income continued to play a dominant role in generating income for NGNBF&I companies as compared to the fee-based income. The share of interest income, which is the main source of fund-based income for NGNBF&I companies in the total income increased to 66.5 per cent during 2015-16 from 65.5 per cent in the previous year. This increase in share of interest income during 2015-16 was observed for “Loan Finance”, “Diversified” and “Miscellaneous” companies (Statement 3). 5.2 On the expenditure side, the share of interest expenses in the total expenditure increased marginally to 48.6 per cent in 2015-16 from 48.1 per cent in 2014- 15. However, the shares of employees benefit expenses (Salaries, Wages and Bonus plus Provident Fund plus Employees Welfare Expenses) in the total expenditure declined during 2015-16 mainly contributed by the declined in the salaries, wages and bonus. The decline in the share of salaries, wages and bonus was witnessed for “Loan Finance”, “Diversified” and “Miscellaneous” companies (Statement 3).
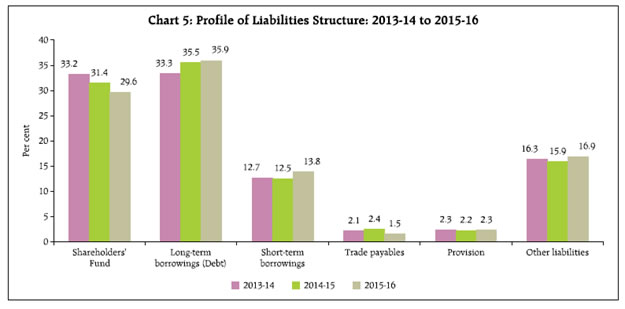
6. Liabilities Structure: Share of Shareholders’ Funds declined gradually but share of Short and Long term Borrowings increased 6.1 The share of shareholders’ funds in total liabilities witnessed a gradual decline from 33.2 per cent in 2013-14 to 29.6 per cent in 2015-16 (Chart 5). Similar trends were also witnessed for reserve and surplus as well as share capital. The decline in the share of shareholders’ funds in the total liabilities during 2015-16 was witnessed among all the activity groups except for “Diversified” companies (Statement 4). 6.2 The capital structure showed that the share of short-term and long-term borrowings in the total liabilities increased to 13.8 per cent and 35.9 per cent, respectively, in 2015-16 from 12.5 per cent and 35.5 per cent in 2014-15. Further, the share of short-term and long-term loans from banks also increased in 2015-16 (Chart 5 and Statement 4). 6.3 An increase in the share of short-term and long-term borrowings in the total liabilities was seen among all activity groups, except for “Diversified” companies, which experienced decline in 2015-16. For “Share Trading and Investment Holding” and “Asset Finance” companies, the share of both short-term and long-term borrowings increased during 2015-16 (Statement 4). 7. Assets Pattern: Share of Long-term Loans and Advances increased while that of Investments in Total Assets declined 7.1 The composition of assets for the select NGNBF&I companies showed that total loans and advances (inclusive of both short and long-term loans and advances) constituted more than 60.0 per cent of the total assets. The share of total loans and advances in the total assets had gone up to 65.7 per cent during 2015-16 from 61.9 per cent in 2014-15. This increase in the share of total loans and advances extended by these companies was mainly on account of increased in long-term loans and advances. The share of long-term loans and advances in the total assets increased to 43.0 per cent in 2015-16 from 39.0 per cent in 2014- 15, while that of short-term loans and advances declined marginally. The increase in the share of long-term loans and advances in the total assets was seen among all the activity groups during 2015-16 (Chart 6 and Statement 5).
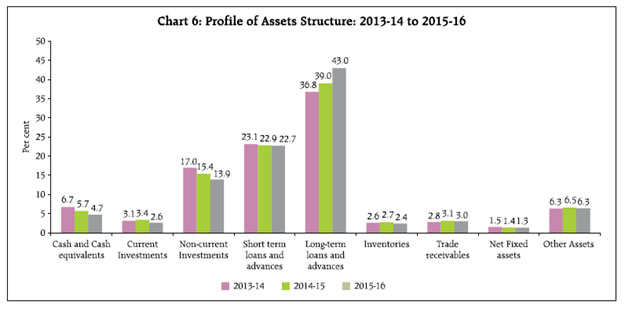
7.2 The share of both current and non-current investments in the total assets declined to 2.6 per cent and 13.9 per cent, respectively, in 2015-16 from 3.4 per cent and 15.4 per cent in 2014-15. This decline in the share of both current and non-current investments in the total assets was witnessed among all the activity groups, except for “Share Trading and Investment Holding” and “Diversified”, which experienced increased in current investments during 2015-16 as compared with the previous year (Chart 6 and Statement 5). 7.3 Further, the share of cash and cash equivalents in the total assets declined gradually from 6.7 per cent in 2013-14 to 4.7 per cent in 2015-16 (Chart 6). 8. Sources of Funds: Share of Funds raised through Debt Finance in Total Sources of Funds increased 8.1 With larger role of short-term and long-term borrowings in the liabilities structure of NGNBF&I companies (covering more than 50.0 per cent in total liabilities), the external sources continued to play a major role in expanding the business. The share of funds mobilised through external sources in the total sources of funds increased to 88.0 per cent in 2015-16 as against 86.8 per cent recorded in 2014-15. The increase in the share of external sources of funds in the total sources of funds was observed for “Share Trading and Investment Holding” and “Loan Finance” companies (Statement 6). 8.2 The funds raised through short-term borrowings increased to 21.2 per cent in 2015-16 from 11.2 per cent in the previous year. While the share of funds mobilised from long-term borrowings in the total sources of funds declined to 37.9 per cent in 2015-16 from 49.2 per cent witnessed in 2014-15. The share of fund raised through term loans from banks (short and long term loans together) in the total sources of funds declined to 21.7 per cent in 2015-16 from 30.9 per cent in the previous year, mainly on account of declined in the funds raised through long-term loans from banks (Statement 6). 8.3 The share of internal sources of funds in total sources of funds declined marginally to 12.0 per cent in 2015-16 from 13.2 per cent in the previous year, which was largely contributed by the decrease in the share of reserve and surplus and paid-up capital during 2015-16. The decrease in the share of internal sources of funds in total sources of funds was observed for “Share Trading and Investment Holding” and “Loan Finance” companies among the activity groups (Statement 6). 9. Uses of Funds: Loans financing and Non-Current Investment pick-up in business activity 9.1 The short-term and long-term loans and advances constituted more than 85.0 per cent in the total uses of funds. The share of short-term and long-term loans and advances extended by the NGNBF&I companies in the total uses of funds increased to 21.8 per cent and 65.4 per cent, respectively, in 2015-16 from 20.7 per cent and 52.8 per cent recorded in 2014-15. Further, the share of non-current investments in total uses of funds improved to 5.4 per cent in 2015-16 from 4.9 per cent in 2014-15 (Statement 7). 9.2 An increase in the share of long-term loans and advances in the total uses of funds during 2015-16 was witnessed among all the activity groups, except for “Asset Finance” companies. While, the share of non-current investments in the total uses of funds improved for “Loan Finance” and “Asset Finance” companies during 2015-16 as compared with the previous year (Statement 7). 10. Performance of Chit Fund and Mutual Fund Companies: Operating Profit margin, RoA and RoE declined 10.1 In contrast to the overall financial performance observed for the select NGNBF&I companies at aggregate level, the financial income for select 1,730 Chit Fund and Mutual Fund companies grew at a marginal rate of 0.5 per cent during 2015-16 as against 10.3 per cent registered in the previous year (Table 2). 10.2 The total expenditure of the Chit Fund and Mutual Fund companies increased by 4.4 per cent in 2015-16 as compared to 7.0 per cent in 2014-15. As a result of lower growth in the total income as compared with total expenditure, the operating profits of select Chit Fund and Mutual Fund companies decelerated by 17.7 per cent in 2015-16 as compared to 28.4 per cent growth witnessed in the preceding year. Further, the net profits of select Chit Fund and Mutual Fund companies also decelerated by 12.7 per cent in 2015- 16 (Table 2). 10.3 In contrast to the increasing trend at aggregate level of the NGNBF&I companies, the leverage ratio (debt to equity ratio) of Chit Fund and Mutual Fund companies declined to 43.1 per cent in 2015-16 from 44.6 per cent in the previous year. Further, the deceleration in the operating profits and net profits led to decline in the operating profit margin, RoA and RoE of the Chit Fund and Mutual Fund companies during 2015-16, after witnessing an improvement in 2014-15 (Table 2).
| Table 2: Select Growth Rates and Ratios of Chit and Mutual Fund Companies (1,730) |
| Per cent |
| Item |
2013-14 |
2014-15 |
2015-16 |
| Select Growth Rates |
|
|
|
| 1. Financial Income |
- |
10.3 |
0.5 |
| 2. Total Income |
- |
9.0 |
2.1 |
| 3. Total Expenditure |
- |
7.0 |
4.4 |
| 4. Operating Profits (EBDT) |
- |
28.4 |
-17.7 |
| 5. Net Profits |
- |
24.3 |
-12.7 |
| Select Ratios |
|
|
|
| 1. EBDT to Financial Income |
16.4 |
19.1 |
15.6 |
| 2. Debt to Equity |
43.2 |
44.6 |
43.1 |
| 3. Net profits to Total Net Assets |
2.1 |
2.4 |
2.0 |
| 4. Net profits to Net Worth |
11.2 |
12.9 |
10.6 |
| 5. Borrowings to Total Net Assets |
17.8 |
16.1 |
15.0 |
| 6. Bank Borrowings to Total Borrowings |
23.7 |
17.4 |
13.2 |
| Note: Figures in parentheses represent total number of chit and mutual fund companies. |
10.4 The share of borrowings in the total net assets declined to 15.0 per cent in 2015-16 from 16.1 per cent in 2014-15. Moreover, the share of borrowings from banks in the total borrowings also had declined to 13.2 per cent in 2015-16 from 17.4 per cent in 2014-15 (Table 2). 11. Concluding Observations 11.1 The aggregate results shows that the overall performance of the select 21,186 NGNBF&I companies had improved in 2015-16. The gross value added (GVA) along with financial income had accelerated in 2015- 16 as compared with the preceding year. Total expenditure grew at a lower rate as compared to the total income, leading to significant growth in the operating profits (EBDT) during 2015-16. However, the growth in interest expenses, which constituted major share in the total expenditure had increased marginally in 2015-16 as compared with the previous year. 11.2 Further, the return on investments (RoI) had improved in 2015-16. However, the liquidity position had deteriorated and leverage ratio and bad debts to expected receivables ratio had increased in 2015-16. 11.3 On liabilities side, the shares of both short-term and long-term borrowings in the total liabilities of NGNBF&I companies increased in 2015-16 as compared with the previous year, whereas the share of shareholders’ funds in the total liabilities declined gradually over the three-year period. The share of short-term and long-term loans and advances in the total assets, on the other hand increased in 2015-16. 11.4 The NGNBF&I companies continued to rely mainly on external sources for their business expansion and their share had increased in 2015-16. The share of funds raised through short-term borrowings increased in 2015-16 as compared with the previous year. These companies used their funds predominantly in expanding their non-current investments and both short-term and long-term loans and advances portfolios in 2015-16.
| Statement 1: Growth Rates of the Select Items of the Select 21,186 NGNBF&I Companies : 2014-15 and 2015-16 |
| (Per cent) |
| Item |
All Activities |
Share Trading and Investment Holding |
Loan Finance |
| (21,186) |
(9,269) |
(2,396) |
| 2014-15 |
2015-16 |
2014-15 |
2015-16 |
2014-15 |
2015-16 |
| 1. Financial Income |
17.1 |
18.7 |
25.7 |
7.7 |
15.8 |
22.2 |
| Of which; (a) Interest Received |
23.1 |
19.1 |
40.2 |
7.8 |
17.3 |
22.2 |
| (b) Dividend Received |
5.6 |
17.1 |
4.7 |
55.3 |
41.7 |
-27.8 |
| 2. Total Income |
18.6 |
17.3 |
25.9 |
9.2 |
17.3 |
19.9 |
| 3. Total Expenditure |
19.2 |
16.6 |
19.0 |
6.2 |
19.9 |
18.4 |
| 4. Interest Payment |
17.4 |
17.7 |
15.8 |
23.0 |
16.0 |
19.4 |
| 5. Employees' Remuneration |
22.8 |
13.3 |
10.8 |
8.1 |
41.9 |
10.2 |
| 6. Depreciation Provision |
25.7 |
5.4 |
31.5 |
-11.9 |
14.6 |
31.4 |
| 7. Operating Profits (EBDT) |
13.3 |
22.3 |
32.6 |
7.9 |
3.9 |
37.1 |
| 8. Gross Value Addition( GVA)$ |
15.8 |
19.8 |
26.6 |
7.9 |
14.8 |
27.6 |
| 9. Tax Provision |
17.5 |
23.2 |
50.9 |
0.3 |
6.6 |
34.3 |
| 10. Net Profits |
21.0 |
12.5 |
33.1 |
13.9 |
14.2 |
20.4 |
| 11. Dividend Paid |
12.5 |
12.6 |
16.1 |
4.9 |
-1.2 |
53.2 |
| 12. Profits Retained |
23.6 |
12.5 |
43.9 |
18.5 |
19.2 |
11.5 |
| 13. Investments |
7.5 |
3.7 |
7.5 |
3.9 |
9.4 |
3.9 |
| 14. Loans and Advances |
18.9 |
25.1 |
9.2 |
8.7 |
22.2 |
32.8 |
| 15. Total Net Assets |
15.2 |
17.8 |
9.9 |
4.9 |
18.1 |
23.1 |
| 16. Borrowings |
20.2 |
21.9 |
28.0 |
15.9 |
22.2 |
26.4 |
| Of which; from Banks |
26.5 |
19.6 |
22.8 |
17.9 |
14.8 |
6.4 |
| 17. Net Worth |
9.1 |
11.0 |
6.2 |
4.2 |
13.0 |
17.2 |
| Item |
Asset Finance |
Diversified |
Miscellaneous |
| (4,039) |
(922) |
(4,560) |
| 1. Financial Income |
16.3 |
18.6 |
22.4 |
28.8 |
15.5 |
18.2 |
| Of which; (a) Interest Received |
32.4 |
15.4 |
14.3 |
49.8 |
13.7 |
22.4 |
| (b) Dividend Received |
-27.3 |
-35.2 |
-1.6 |
14.9 |
-12.5 |
-33.6 |
| 2. Total Income |
19.0 |
16.4 |
16.7 |
36.5 |
15.9 |
18.1 |
| 3. Total Expenditure |
20.4 |
14.8 |
20.9 |
37.7 |
15.5 |
19.9 |
| 4. Interest Payment |
20.4 |
13.9 |
14.2 |
41.0 |
17.6 |
16.2 |
| 5. Employees' Remuneration |
16.4 |
20.5 |
30.8 |
20.4 |
11.6 |
13.9 |
| 6. Depreciation Provision |
28.4 |
0.5 |
44.9 |
-8.3 |
32.6 |
-3.9 |
| 7. Operating Profits (EBDT) |
12.2 |
22.2 |
30.6 |
-0.7 |
14.1 |
13.1 |
| 8. Gross Value Addition( GVA)$ |
13.0 |
21.9 |
30.7 |
6.3 |
13.0 |
13.4 |
| 9. Tax Provision |
16.0 |
26.6 |
10.7 |
17.2 |
26.4 |
9.5 |
| 10. Net Profits |
21.3 |
11.1 |
35.6 |
13.7 |
17.7 |
0.2 |
| 11. Dividend Paid |
15.1 |
-12.7 |
-28.0 |
47.4 |
32.3 |
10.4 |
| 12. Profits Retained |
22.7 |
16.0 |
36.4 |
13.4 |
14.7 |
-2.1 |
| 13. Investments |
4.6 |
4.1 |
6.9 |
0.1 |
8.6 |
2.0 |
| 14. Loans and Advances |
15.8 |
20.8 |
14.4 |
9.7 |
22.7 |
21.6 |
| 15. Total Net Assets |
15.1 |
19.2 |
11.5 |
4.3 |
14.0 |
13.4 |
| 16. Borrowings |
18.8 |
22.2 |
32.9 |
-1.6 |
16.3 |
8.7 |
| Of which; from Banks |
39.0 |
34.1 |
27.5 |
-64.5 |
26.0 |
3.3 |
| 17. Net Worth |
9.2 |
14.4 |
4.2 |
10.2 |
8.8 |
7.1 |
Note: Figures in parentheses below the activity name represents the number of companies.
$ GVA is defined as (Financial Income + Non-Financial Income - Total Expenditure + Salaries, wages,& Bonus + Employee Welfare Expenses + Depreciation) |
| Statement 2: Select Financial Ratios of the Select 21,186 NGNBF&I Companies : 2013-14 to 2015-16 |
| (Per cent) |
| Item |
All Activities |
Share Trading and Investment Holding |
Loan Finance |
| (21,186) |
(9,269) |
(2,396) |
| 2013-14 |
2014-15 |
2015-16 |
2013-14 |
2014-15 |
2015-16 |
2013-14 |
2014-15 |
2015-16 |
| 1. Dividends to Net Profits |
24.5 |
23.5 |
22.5 |
40.5 |
35.8 |
32.3 |
25.0 |
22.2 |
28.3 |
| 2. Operating Profits to Financial Income |
34.2 |
33.1 |
34.1 |
45.7 |
48.1 |
48.2 |
23.8 |
21.4 |
24.0 |
| 3. Net profits to Total Net Assets |
2.5 |
2.6 |
2.6 |
3.2 |
3.9 |
4.3 |
2.1 |
2.0 |
1.9 |
| 4. Net profits to Net Worth |
7.7 |
8.2 |
8.7 |
4.4 |
5.5 |
6.1 |
8.4 |
8.3 |
8.5 |
| 5. Debt to Equity |
100.4 |
112.9 |
121.1 |
9.8 |
9.6 |
11.8 |
153.8 |
166.1 |
171.3 |
| 6. Borrowings to Total Net Assets |
46.0 |
48.0 |
49.7 |
13.6 |
15.8 |
17.5 |
50.8 |
52.6 |
54.0 |
| 7. Bank Borrowings to Total Borrowings |
39.0 |
41.0 |
40.2 |
24.6 |
23.6 |
24.0 |
46.2 |
43.4 |
36.5 |
| 8. Current Ratio$ |
1.3 |
1.3 |
1.2 |
1.8 |
1.7 |
1.8 |
1.3 |
1.3 |
1.1 |
| 9. CashRatio@ |
21.6 |
18.5 |
14.6 |
45.5 |
45.0 |
44.0 |
19.7 |
17.8 |
12.1 |
| 10. Net Working capital to Total Assets |
10.2 |
10.2 |
6.3 |
15.6 |
14.5 |
16.2 |
10.3 |
10.1 |
3.0 |
| 11. Net Interest Margin to Total Assets |
3.3 |
3.7 |
3.7 |
2.0 |
2.8 |
2.7 |
4.9 |
4.9 |
5.0 |
| 12. Return on Investments |
12.7 |
13.8 |
15.6 |
5.8 |
7.0 |
7.9 |
13.5 |
13.7 |
15.9 |
| 13. Bad Debt to Expected Receivables |
1.5 |
4.3 |
4.9 |
0.3 |
0.4 |
0.3 |
1.9 |
11.1 |
10.6 |
| Item |
Asset Finance |
Diversified |
Miscellaneous |
| (4,039) |
(922) |
(4,560) |
| 1. Dividends to Net Profits |
18.9 |
18.6 |
14.0 |
1.4 |
0.9 |
1.0 |
19.4 |
22.7 |
21.6 |
| 2. Operating Profits to Financial Income |
46.3 |
44.7 |
46.0 |
33.1 |
35.3 |
27.3 |
27.9 |
27.5 |
26.3 |
| 3. Net profits to Total Net Assets |
2.7 |
2.7 |
2.7 |
2.1 |
2.0 |
2.6 |
2.6 |
2.6 |
2.6 |
| 4. Net profits to Net Worth |
11.0 |
11.9 |
12.0 |
3.1 |
3.2 |
4.0 |
7.3 |
7.7 |
8.3 |
| 5. Debt to Equity |
169.9 |
192.2 |
202.4 |
10.9 |
16.3 |
17.2 |
77.9 |
90.4 |
88.6 |
| 6. Borrowings to Total Net Assets |
56.4 |
58.1 |
59.6 |
21.7 |
25.9 |
24.4 |
40.7 |
41.6 |
39.8 |
| 7. Bank Borrowings to Total Borrowings |
37.5 |
43.8 |
48.1 |
18.7 |
18.0 |
6.5 |
27.3 |
29.6 |
28.1 |
| 8. Current Ratio$ |
1.2 |
1.2 |
1.2 |
1.6 |
1.5 |
1.9 |
1.5 |
1.5 |
1.2 |
| 9. Cash Ratio@ |
14.4 |
10.4 |
10.5 |
18.9 |
20.9 |
24.7 |
32.7 |
24.0 |
16.5 |
| 10. Net Working capital to Total Assets |
5.5 |
7.2 |
5.8 |
14.2 |
14.5 |
20.1 |
17.0 |
14.4 |
7.5 |
| 11. Net Interest Margin to Total Assets |
3.0 |
3.8 |
3.7 |
3.3 |
3.4 |
5.0 |
1.1 |
1.0 |
1.2 |
| 12. Return on Investments |
24.0 |
26.9 |
29.9 |
5.7 |
5.7 |
7.9 |
14.9 |
15.6 |
17.6 |
| 13. Bad Debt to Expected Receivables |
1.8 |
1.2 |
2.2 |
0.4 |
1.0 |
- |
2.0 |
5.6 |
6.9 |
Note: Figures in brackets below the activity name represents the number of companies in the activity.
$ Actual ratio (in times)
@ Cash Ratio is defined as a ratio of cash and cash equivalents to current liabilities.
- Nil or Negligible |
| Statement 3: Composition of Income and Expenditure of Select 21,186 NGNBF&I Companies : 2013-14 to 2015-16 |
| (Per cent) |
| Items |
All Activities |
Share Trading and Investment Holding |
Loan Finance |
| (21,186) |
(9,269) |
(2,396) |
| 2013-14 |
2014-15 |
2015-16 |
2013-14 |
2014-15 |
2015-16 |
2013-14 |
2014-15 |
2015-16 |
| Income |
|
|
|
|
|
|
|
|
|
| 1. Financial Income$ |
99.1 |
97.9 |
99.0 |
96.5 |
96.3 |
95.0 |
97.3 |
96.0 |
97.8 |
| A. Fund-based Income |
93.0 |
93.9 |
94.6 |
90.1 |
94.0 |
91.7 |
93.7 |
91.4 |
92.5 |
| Of which, (a) Interest |
63.1 |
65.5 |
66.5 |
34.0 |
37.8 |
37.3 |
81.5 |
81.5 |
83.1 |
| (b) Dividends |
2.0 |
1.8 |
1.8 |
9.1 |
7.6 |
10.8 |
0.9 |
1.0 |
0.6 |
| (c) Net Profit/Loss in Share Dealings |
4.3 |
6.0 |
5.5 |
19.8 |
31.6 |
27.6 |
2.5 |
2.1 |
3.4 |
| (d) Net Earnings From Hire Purchase Financing |
0.9 |
1.0 |
0.9 |
2.5 |
2.5 |
1.7 |
0.2 |
0.2 |
0.2 |
| (e) Other Fund-based Income |
22.2 |
19.3 |
19.6 |
24.1 |
14.2 |
14.0 |
8.4 |
6.5 |
5.2 |
| B. Fee-based Income |
6.1 |
3.9 |
4.4 |
6.4 |
2.4 |
3.3 |
3.5 |
4.6 |
5.3 |
| Of which, (a) Brokerage |
0.1 |
0.1 |
0.1 |
0.4 |
0.3 |
0.2 |
0.2 |
0.1 |
0.1 |
| (b) Other Fee-based Income |
5.9 |
3.8 |
4.3 |
6.0 |
2.0 |
3.0 |
3.4 |
4.5 |
5.2 |
| 2. Non-Financial Income |
0.6 |
0.7 |
0.6 |
1.5 |
0.8 |
0.6 |
0.5 |
0.8 |
0.9 |
| 3. Non-Operating Surplus(+)/Deficit(-) |
0.2 |
1.5 |
0.4 |
2.0 |
2.9 |
4.4 |
2.2 |
3.2 |
1.3 |
| Total Income |
100.0 |
100.0 |
100.0 |
100.0 |
100.0 |
100.0 |
100.0 |
100.0 |
100.0 |
| Expenditure |
|
|
|
|
|
|
|
|
|
| 1. Interest |
48.8 |
48.1 |
48.6 |
20.8 |
20.3 |
23.5 |
58.8 |
56.9 |
57.4 |
| 2. Salaries, Wages and Bonus |
15.9 |
16.3 |
15.9 |
26.6 |
24.8 |
25.1 |
11.1 |
13.1 |
12.2 |
| 3. Provident Fund |
1.0 |
1.1 |
1.0 |
1.5 |
1.5 |
1.7 |
0.6 |
0.8 |
0.7 |
| 4. Employees Welfare Expenses |
0.9 |
0.9 |
1.0 |
1.4 |
1.1 |
1.2 |
0.6 |
0.6 |
0.7 |
| 5. Bad Debts # |
0.6 |
1.9 |
2.1 |
0.3 |
0.3 |
0.2 |
0.5 |
2.7 |
2.7 |
| 6. Other Expenses |
27.5 |
29.3 |
27.5 |
43.8 |
46.8 |
44.2 |
20.8 |
24.0 |
20.8 |
| 7. Other Provisions (Other than Tax and Depreciation) |
3.3 |
0.3 |
2.1 |
1.1 |
0.2 |
0.1 |
6.3 |
0.6 |
4.2 |
| 8. Depreciation Provision |
2.0 |
2.1 |
1.9 |
4.5 |
4.9 |
4.1 |
1.3 |
1.2 |
1.4 |
| Total Expenditure |
100.0 |
100.0 |
100.0 |
100.0 |
100.0 |
100.0 |
100.0 |
100.0 |
100.0 |
Note: Figures in brackets below the activity name represents the number of companies in the activity.
- Nil or Negligible
# include provision for doubtful debt
$ Financial Income and its sub-components were arrived after recategorising the operating revenue as interest income, dividend income, etc., according to the nature of activities of each company and then adding the corresponding relevant item from other income. |
| Statement 3: Composition of Income and Expenditure of Select 21,186 NGNBF&I Companies : 2013-14 to 2015-16 (Concld.) |
| (Per cent) |
| Items |
Asset Finance |
Diversified |
Miscellaneous |
| (4,039) |
(922) |
(4,560) |
| 2013-14 |
2014-15 |
2015-16 |
2013-14 |
2014-15 |
2015-16 |
2013-14 |
2014-15 |
2015-16 |
| Income |
|
|
|
|
|
|
|
|
|
| 1. Financial Income$ |
105.2 |
102.8 |
104.7 |
94.8 |
99.4 |
93.8 |
94.6 |
94.3 |
94.4 |
| A. Fund-based Income |
94.6 |
100.3 |
101.9 |
93.7 |
98.2 |
92.9 |
90.0 |
87.8 |
88.1 |
| Of which, (a) Interest |
63.9 |
71.1 |
70.5 |
62.2 |
60.9 |
66.9 |
33.4 |
32.8 |
34.0 |
| (b) Dividends |
0.7 |
0.4 |
0.2 |
2.4 |
2.0 |
1.7 |
1.9 |
1.4 |
0.8 |
| (c) Net Profit/Loss in Share Dealings |
1.8 |
2.8 |
2.1 |
2.6 |
5.7 |
3.9 |
2.2 |
1.6 |
0.8 |
| (d) Net Earnings From Hire Purchase Financing |
1.0 |
1.2 |
1.3 |
4.9 |
8.8 |
2.8 |
1.0 |
1.3 |
1.2 |
| (e) Other Fund-based Income |
25.8 |
23.7 |
26.6 |
19.9 |
19.4 |
17.3 |
51.5 |
50.6 |
51.2 |
| B. Fee-based Income |
10.6 |
2.5 |
2.8 |
1.1 |
1.2 |
0.9 |
4.5 |
6.5 |
6.3 |
| Of which, (a) Brokerage |
- |
- |
- |
- |
- |
- |
0.2 |
0.1 |
0.1 |
| (b) Other Fee-based Income |
10.4 |
2.3 |
2.6 |
1.1 |
1.0 |
0.9 |
4.3 |
6.3 |
6.2 |
| 2. Non-Financial Income |
0.2 |
0.5 |
0.2 |
1.7 |
2.5 |
0.4 |
1.0 |
0.5 |
0.6 |
| 3. Non-Operating Surplus(+)/Deficit(-) |
-5.4 |
-3.3 |
-4.9 |
3.5 |
-1.9 |
5.8 |
4.4 |
5.3 |
5.0 |
| Total Income |
100.0 |
100.0 |
100.0 |
100.0 |
100.0 |
100.0 |
100.0 |
100.0 |
100.0 |
| Expenditure |
|
|
|
|
|
|
|
|
|
| 1. Interest |
50.5 |
50.6 |
50.1 |
31.9 |
30.1 |
30.8 |
34.9 |
35.5 |
34.4 |
| 2. Salaries, Wages and Bonus |
15.6 |
14.9 |
15.7 |
20.7 |
22.7 |
19.8 |
23.8 |
22.9 |
21.9 |
| 3. Provident Fund |
1.1 |
1.2 |
1.1 |
1.6 |
1.7 |
1.6 |
1.5 |
1.4 |
1.2 |
| 4. Employees Welfare Expenses |
1.4 |
1.3 |
1.5 |
0.9 |
0.7 |
0.6 |
1.0 |
1.1 |
1.0 |
| 5. Bad Debts # |
0.7 |
0.8 |
1.5 |
0.3 |
0.5 |
- |
0.9 |
2.2 |
2.4 |
| 6. Other Expenses |
28.3 |
28.7 |
27.9 |
40.1 |
38.8 |
43.6 |
35.2 |
34.8 |
37.4 |
| 7. Other Provisions (Other than Tax and Depreciation) |
0.1 |
- |
- |
- |
- |
- |
0.9 |
- |
- |
| 8. Depreciation Provision |
2.3 |
2.4 |
2.1 |
4.5 |
5.4 |
3.6 |
1.8 |
2.1 |
1.7 |
| Total Expenditure |
100.0 |
100.0 |
100.0 |
100.0 |
100.0 |
100.0 |
100.0 |
100.0 |
100.0 |
Note: Figures in brackets below the activity name represents the number of companies in the activity.
- Nil or Negligible
# include provision for doubtful debt
$ Financial Income and its sub-components were arrived after recategorising the operating revenue as interest income, dividend income, etc., according to the nature of activities of each company and then adding the corresponding relevant item from other income. |
| Statement 4: Profile of Liabilities Structure of the select 21,186 NGNBF&I Companies : 2013-14 to 2015-16 |
| (Per cent) |
| Items |
All Activities |
Share Trading and Investment Holding |
Loan Finance |
| (21,186) |
(9,269) |
(2,396) |
| 2013-14 |
2014-15 |
2015-16 |
2013-14 |
2014-15 |
2015-16 |
2013-14 |
2014-15 |
2015-16 |
| 1. Shareholders' Fund |
33.2 |
31.4 |
29.6 |
72.6 |
70.2 |
69.7 |
25.0 |
23.9 |
22.8 |
| Of which, (i) Share Capital |
8.5 |
7.8 |
7.1 |
17.4 |
17.2 |
16.4 |
7.3 |
6.5 |
6.1 |
| (ii) Reserves and Surplus |
24.6 |
23.6 |
22.5 |
54.7 |
52.7 |
52.9 |
17.7 |
17.4 |
16.7 |
| 2. Non-current liabilities |
35.6 |
37.8 |
38.2 |
8.2 |
8.0 |
9.4 |
41.5 |
42.7 |
41.6 |
| (a) Long-term borrowings (debt)$ |
33.3 |
35.5 |
35.9 |
7.1 |
6.7 |
8.2 |
38.4 |
39.7 |
39.0 |
| Of which, (i) Bonds/Debentures |
6.4 |
7.0 |
10.0 |
1.6 |
1.3 |
2.2 |
11.1 |
15.2 |
19.2 |
| (ii) Term loans |
21.6 |
21.3 |
20.3 |
3.3 |
3.6 |
4.4 |
19.4 |
19.7 |
15.7 |
| Of which, Term loans from banks |
10.9 |
12.8 |
12.9 |
0.7 |
0.7 |
1.4 |
17.8 |
17.6 |
14.6 |
| (iii) Deposits |
1.7 |
2.9 |
2.4 |
0.1 |
0.1 |
0.1 |
1.1 |
1.8 |
2.2 |
| (iv) Loan and Advances from related parties |
2.5 |
1.6 |
1.1 |
1.9 |
1.3 |
1.0 |
4.8 |
1.2 |
0.7 |
| (b) Long-term provisions |
1.2 |
1.2 |
1.2 |
0.2 |
0.2 |
0.2 |
2.3 |
2.1 |
1.9 |
| (c) Other long-term liabilities |
1.1 |
1.1 |
1.1 |
0.9 |
1.1 |
0.9 |
0.8 |
0.9 |
0.7 |
| 3. Current liabilities |
31.1 |
30.7 |
32.1 |
18.9 |
21.8 |
20.7 |
33.5 |
33.4 |
35.6 |
| (a) Short-term borrowings$ |
12.7 |
12.5 |
13.8 |
6.5 |
9.1 |
9.3 |
12.4 |
12.9 |
15.0 |
| Of which, (i) Loans repayable on demand |
9.0 |
8.3 |
8.9 |
4.5 |
5.2 |
5.2 |
6.8 |
5.9 |
6.2 |
| Of which, from banks |
7.1 |
6.9 |
7.1 |
2.6 |
3.0 |
2.8 |
5.7 |
5.2 |
5.1 |
| (ii) Loan and Advances from related parties |
0.6 |
0.3 |
0.7 |
1.0 |
1.7 |
2.6 |
0.5 |
0.2 |
0.7 |
| (iii) Other loans and advances |
2.8 |
3.5 |
3.7 |
1.0 |
2.2 |
1.3 |
4.4 |
5.7 |
7.3 |
| (b) Trade payables |
2.1 |
2.4 |
1.5 |
6.1 |
5.1 |
4.3 |
1.5 |
1.2 |
1.0 |
| (c) Short-term provisions |
1.1 |
1.1 |
1.1 |
1.5 |
1.6 |
1.1 |
1.2 |
1.1 |
1.1 |
| (d) Other current liabilities |
15.1 |
14.7 |
15.7 |
4.8 |
6.0 |
6.0 |
18.3 |
18.3 |
18.6 |
| Total Liabilities |
100.0 |
100.0 |
100.0 |
100.0 |
100.0 |
100.0 |
100.0 |
100.0 |
100.0 |
Note: Figures in brackets below the activity name represents the number of companies in the activity.
- Nil or Negligible
$ Sub-components of long-term borrowings and short-term borrowings for Non-XBRL data were estimated based on corresponding proportions in XBRL data for each activity groups. |
| Statement 4: Profile of Liabilities Structure of the select 21,186 NGNBF&I Companies : 2013-14 to 2015-16 (Concld.) |
| (Per cent) |
| Items |
Asset Finance |
Diversified |
Miscellaneous |
| (4,039) |
(922) |
(4,560) |
| 2013-14 |
2014-15 |
2015-16 |
2013-14 |
2014-15 |
2015-16 |
2013-14 |
2014-15 |
2015-16 |
| 1. Shareholders' Fund |
24.3 |
23.0 |
22.1 |
66.7 |
62.2 |
65.7 |
35.5 |
33.9 |
32.0 |
| Of which, (i) Share Capital |
6.3 |
5.6 |
5.1 |
15.5 |
14.5 |
14.8 |
7.9 |
7.2 |
6.5 |
| (ii) Reserves and Surplus |
18.0 |
17.4 |
17.0 |
49.0 |
47.7 |
50.9 |
27.5 |
26.7 |
25.5 |
| 2. Non-current liabilities |
42.6 |
45.6 |
46.2 |
7.9 |
11.0 |
12.2 |
31.8 |
34.9 |
33.4 |
| (a) Long-term borrowings (debt)$ |
41.2 |
44.2 |
44.7 |
7.3 |
10.2 |
11.3 |
27.6 |
30.6 |
28.3 |
| Of which, (i) Bonds/Debentures |
3.9 |
3.1 |
5.9 |
- |
- |
- |
6.5 |
2.1 |
2.7 |
| (ii) Term loans |
36.2 |
33.6 |
33.2 |
2.8 |
3.7 |
6.0 |
7.6 |
10.1 |
11.6 |
| Of which, from banks |
10.1 |
14.2 |
16.6 |
2.2 |
3.1 |
1.0 |
6.5 |
8.7 |
8.3 |
| (iii) Deposits |
0.3 |
0.2 |
0.3 |
0.2 |
2.5 |
2.0 |
9.0 |
16.3 |
11.3 |
| (iv) Loan and Advances from related parties |
0.7 |
2.3 |
1.4 |
2.3 |
0.8 |
- |
2.4 |
1.2 |
1.1 |
| (b) Long-term provisions |
0.6 |
0.5 |
0.5 |
0.2 |
0.2 |
0.2 |
1.3 |
1.4 |
2.0 |
| (c) Other long-term liabilities |
0.7 |
0.8 |
1.0 |
0.5 |
0.6 |
0.6 |
2.9 |
2.8 |
3.0 |
| 3. Current liabilities |
33.1 |
31.4 |
31.7 |
25.2 |
26.8 |
22.1 |
32.5 |
31.2 |
34.6 |
| (a) Short-term borrowings$ |
15.1 |
13.9 |
14.9 |
14.4 |
15.7 |
13.0 |
13.1 |
10.9 |
11.5 |
| Of which, (i) Loans repayable on demand |
12.6 |
12.2 |
13.3 |
10.1 |
10.0 |
0.6 |
9.6 |
6.7 |
7.6 |
| Of which, from banks |
11.0 |
11.3 |
12.1 |
1.9 |
1.5 |
0.6 |
4.6 |
3.6 |
2.9 |
| (ii) Loan and Advances from related parties |
0.4 |
- |
0.2 |
1.9 |
- |
3.7 |
0.7 |
0.1 |
0.4 |
| (iii) Other loans and advances |
2.2 |
1.6 |
1.2 |
2.5 |
4.3 |
5.8 |
2.3 |
3.8 |
3.0 |
| (b) Trade payables |
1.1 |
2.6 |
0.9 |
4.2 |
3.8 |
2.6 |
2.1 |
2.4 |
2.3 |
| (c) Short-term provisions |
1.0 |
0.9 |
0.9 |
0.7 |
0.6 |
0.6 |
1.0 |
1.2 |
1.8 |
| (d) Other current liabilities |
15.9 |
14.0 |
15.0 |
5.9 |
6.7 |
5.9 |
16.4 |
16.6 |
19.0 |
| Total Liabilities |
100.0 |
100.0 |
100.0 |
100.0 |
100.0 |
100.0 |
100.0 |
100.0 |
100.0 |
Note: Figures in brackets below the activity name represents the number of companies in the activity.
- Nil or Negligible
$ Sub-components of long-term borrowings and short-term borrowings for Non-XBRL data were estimated based on corresponding proportions in XBRL data for each activity groups. |
| Statement 5: Profile of Assets Structure of the select 21,186 NGNBF&I Companies : 2013-14 to 2015-16 |
| (Per cent) |
| Items |
All Activities |
Share Trading and Investment Holding |
Loan Finance |
| (21,186) |
(9,269) |
(2,396) |
| 2013-14 |
2014-15 |
2015-16 |
2013-14 |
2014-15 |
2015-16 |
2013-14 |
2014-15 |
2015-16 |
| 1. Current Assets |
41.3 |
41.0 |
38.5 |
34.5 |
36.3 |
36.9 |
43.8 |
43.6 |
38.6 |
| (a) Cash and Cash equivalents |
6.7 |
5.7 |
4.7 |
8.6 |
9.8 |
9.1 |
6.6 |
6.0 |
4.3 |
| (b) Current Investments |
3.1 |
3.4 |
2.6 |
4.4 |
4.9 |
5.6 |
4.1 |
4.4 |
3.1 |
| (c) Inventories |
2.6 |
2.7 |
2.4 |
5.1 |
6.1 |
6.3 |
2.0 |
2.2 |
1.6 |
| (d) Trade receivables |
2.8 |
3.1 |
3.0 |
4.6 |
3.8 |
4.0 |
2.7 |
2.2 |
2.2 |
| (e) Short term loans and advances |
23.1 |
22.9 |
22.7 |
10.1 |
9.8 |
10.0 |
26.0 |
26.1 |
25.5 |
| (f) Other current assets |
2.9 |
3.2 |
3.0 |
1.7 |
1.8 |
2.0 |
2.5 |
2.6 |
1.9 |
| 2. Non-Current Assets |
58.7 |
59.0 |
61.5 |
65.5 |
63.7 |
63.1 |
56.2 |
56.4 |
61.4 |
| (a) Non-current Investments |
17.0 |
15.4 |
13.9 |
51.6 |
49.8 |
48.7 |
11.5 |
10.0 |
9.1 |
| Of which, Indian Securities |
16.9 |
15.3 |
13.8 |
51.5 |
49.8 |
48.6 |
11.3 |
9.9 |
8.8 |
| (b) Long-term loans and advances |
36.8 |
39.0 |
43.0 |
9.2 |
9.4 |
9.9 |
41.2 |
43.3 |
49.4 |
| (c) Net Fixed assets |
1.5 |
1.4 |
1.3 |
3.7 |
3.4 |
3.5 |
1.0 |
0.9 |
1.0 |
| (d) Other Non-Current Assets |
3.1 |
3.1 |
3.1 |
0.9 |
0.9 |
0.8 |
2.0 |
1.8 |
1.4 |
| Total Assets |
100.0 |
100.0 |
100.0 |
100.0 |
100.0 |
100.0 |
100.0 |
100.0 |
100.0 |
| Items |
Asset Finance |
Diversified |
Miscellaneous |
| (4,039) |
(922) |
(4,560) |
| 1. Current Assets |
38.6 |
38.6 |
37.5 |
39.4 |
41.3 |
42.2 |
49.5 |
45.5 |
42.0 |
| (a) Cash and Cash equivalents |
4.8 |
3.3 |
3.3 |
4.8 |
5.6 |
5.5 |
10.6 |
7.5 |
5.7 |
| (b) Current Investments |
1.5 |
1.8 |
1.2 |
3.5 |
4.1 |
4.8 |
3.7 |
3.4 |
2.4 |
| (c) Inventories |
2.4 |
2.3 |
2.2 |
5.2 |
4.8 |
5.1 |
1.9 |
1.7 |
1.5 |
| (d) Trade receivables |
1.9 |
3.8 |
3.5 |
3.5 |
3.1 |
2.4 |
3.9 |
3.2 |
2.9 |
| (e) Short term loans and advances |
24.1 |
22.8 |
22.4 |
20.7 |
21.9 |
22.7 |
27.1 |
27.6 |
27.5 |
| (f) Other current assets |
3.9 |
4.7 |
4.8 |
1.7 |
1.8 |
1.8 |
2.3 |
2.1 |
2.0 |
| 2. Non-Current Assets |
61.4 |
61.4 |
62.5 |
60.6 |
58.7 |
57.8 |
50.5 |
54.5 |
58.0 |
| (a) Non-current Investments |
9.7 |
8.4 |
7.6 |
32.7 |
30.7 |
28.5 |
13.8 |
13.3 |
12.6 |
| Of which, Indian Securities |
9.7 |
8.4 |
7.6 |
32.7 |
30.7 |
28.5 |
13.8 |
13.3 |
12.6 |
| (b) Long-term loans and advances |
44.9 |
46.7 |
48.0 |
22.4 |
22.2 |
23.8 |
32.7 |
36.8 |
41.6 |
| (c) Net Fixed assets |
1.1 |
0.9 |
0.9 |
4.1 |
3.9 |
4.3 |
1.7 |
1.6 |
1.5 |
| (d) Other Non-Current Assets |
5.4 |
5.3 |
5.8 |
1.3 |
1.8 |
1.0 |
1.9 |
2.3 |
2.0 |
| Total Assets |
100.0 |
100.0 |
100.0 |
100.0 |
100.0 |
100.0 |
100.0 |
100.0 |
100.0 |
Note: Figures in brackets below the activity name represents the number of companies in the activity.
$ Sub-components for investments for Non-XBRL data were estimated based on corresponding proportion in XBRL data for each activity groups. |
| Statement 6: Composition of Sources of Funds of the Select 21,186 NGNBF&I Companies : 2014-15 and 2015-16 |
| (Per cent) |
| Item |
All Activities |
Share Trading and Investment Holding |
Loan Finance |
| (21,186) |
(9,269) |
(2,396) |
| 2014-15 |
2015-16 |
2014-15 |
2015-16 |
2014-15 |
2015-16 |
| Internal Sources |
13.2 |
12.0 |
37.1 |
6.1 |
14.4 |
12.5 |
| 1. Paid-up Capital |
2.6 |
1.9 |
11.3 |
1.3 |
1.9 |
1.8 |
| 2. Reserves and Surplus |
8.0 |
7.3 |
21.0 |
9.7 |
10.0 |
8.3 |
| 3. Provisions |
2.6 |
2.8 |
4.8 |
-4.8 |
2.5 |
2.4 |
| External Sources |
86.8 |
88.0 |
62.9 |
93.9 |
85.6 |
87.5 |
| 4. Share Capital and Premium on shares |
9.6 |
10.0 |
13.6 |
44.2 |
6.0 |
7.7 |
| A. Non-current liabilities |
50.7 |
39.0 |
5.5 |
36.0 |
47.4 |
35.8 |
| 5. Long-term borrowings |
49.2 |
37.9 |
3.0 |
38.2 |
46.4 |
35.7 |
| Of which, (a) Bonds / Debentures |
10.9 |
26.7 |
-1.8 |
20.3 |
37.6 |
36.4 |
| (b) Term loans |
18.8 |
15.0 |
6.8 |
21.0 |
21.1 |
-1.4 |
| Of which, from banks |
24.9 |
13.4 |
0.5 |
15.0 |
16.6 |
1.7 |
| (c) Deposits |
10.6 |
-0.6 |
-0.1 |
1.0 |
5.5 |
3.8 |
| (d) Loan and advances from related parties |
-4.4 |
-2.0 |
-5.1 |
-3.5 |
-18.1 |
-1.6 |
| 6. Other long-term liabilities |
1.5 |
1.1 |
2.5 |
-2.1 |
1.0 |
0.1 |
| B. Current liabilities |
27.5 |
38.7 |
47.3 |
8.4 |
32.5 |
44.1 |
| 7. Short-term borrowings |
11.2 |
21.2 |
34.6 |
12.2 |
15.4 |
24.2 |
| Of which, (a) Loans repayable on demand |
3.1 |
12.4 |
11.7 |
6.8 |
0.6 |
7.7 |
| Of which, from banks |
6.0 |
8.3 |
7.0 |
-1.6 |
2.4 |
4.6 |
| (b) Loan and advances from related parties |
-1.1 |
3.1 |
9.0 |
20.8 |
-1.2 |
3.0 |
| (c) Deposits |
1.3 |
0.7 |
-0.1 |
0.1 |
3.0 |
-0.3 |
| (d) Other loans and advances |
7.9 |
5.0 |
14.1 |
-15.5 |
13.0 |
13.8 |
| 8. Trade payables |
4.5 |
-3.6 |
-5.3 |
-10.9 |
-0.6 |
0.1 |
| 9. Other current liabilities |
11.8 |
21.1 |
18.0 |
7.1 |
17.7 |
19.8 |
| Total Sources of Funds |
100.0 |
100.0 |
100.0 |
100.0 |
100.0 |
100.0 |
Note: Figures in brackets below the activity name represents the number of companies in the activity.
- Nil or negligible |
| Statement 6: Composition of Sources of Funds of the Select 21,186 NGNBF&I Companies : 2014-15 and 2015-16 (Concld.) |
| (Per cent) |
| Item |
Asset Finance |
Diversified |
Miscellaneous |
| (4,039) |
(922) |
(4,560) |
| 2014-15 |
2015-16 |
2014-15 |
2015-16 |
2014-15 |
2015-16 |
| Internal Sources |
4.2 |
7.6 |
50.1 |
162.6 |
16.0 |
26.9 |
| 1. Paid-up Capital |
1.4 |
2.2 |
6.3 |
22.8 |
1.8 |
1.1 |
| 2. Reserves and Surplus |
1.2 |
4.4 |
41.4 |
140.6 |
10.1 |
11.1 |
| 3. Provisions |
1.6 |
1.0 |
2.4 |
-0.9 |
4.1 |
14.7 |
| External Sources |
95.8 |
92.4 |
49.9 |
-62.6 |
84.0 |
73.1 |
| 4. Share Capital and Premium on shares |
12.2 |
10.6 |
-5.6 |
-13.2 |
11.7 |
5.3 |
| A. Non-current liabilities |
64.6 |
49.2 |
36.2 |
40.3 |
55.0 |
15.4 |
| 5. Long-term borrowings |
63.3 |
47.4 |
34.4 |
39.5 |
52.2 |
11.0 |
| Of which, (a) Bonds / Debentures |
-2.2 |
21.1 |
- |
- |
-29.3 |
6.9 |
| (b) Term loans |
16.4 |
31.5 |
11.9 |
58.8 |
27.8 |
22.3 |
| Of which, from banks |
40.7 |
29.3 |
10.9 |
-50.2 |
24.3 |
5.2 |
| (c) Deposits |
-0.5 |
0.5 |
22.0 |
-8.7 |
69.1 |
-25.8 |
| (d) Loan and advances from related parties |
12.2 |
-2.9 |
-11.6 |
-20.2 |
-7.4 |
0.8 |
| 6. Other long-term liabilities |
1.3 |
1.7 |
1.8 |
0.7 |
2.8 |
4.5 |
| B. Current liabilities |
19.5 |
32.4 |
39.9 |
-89.2 |
19.1 |
52.4 |
| 7. Short-term borrowings |
5.6 |
20.3 |
26.0 |
-49.7 |
-4.5 |
15.3 |
| Of which, (a) Loans repayable on demand |
9.4 |
19.0 |
9.0 |
-223.2 |
-14.3 |
13.7 |
| Of which, from banks |
13.0 |
16.2 |
-1.4 |
-21.0 |
-3.6 |
-2.2 |
| (b) Loan and advances from related parties |
-2.2 |
1.2 |
-15.7 |
92.7 |
-4.5 |
2.6 |
| (c) Deposits |
0.2 |
1.4 |
12.6 |
40.9 |
-0.2 |
2.1 |
| (d) Other loans and advances |
-1.7 |
-1.3 |
20.2 |
40.0 |
14.5 |
-3.1 |
| 8. Trade payables |
12.4 |
-8.2 |
0.5 |
-25.7 |
5.2 |
1.2 |
| 9. Other current liabilities |
1.5 |
20.3 |
13.3 |
-13.9 |
18.4 |
35.9 |
| Total Sources of Funds |
100.0 |
100.0 |
100.0 |
100.0 |
100.0 |
100.0 |
Note: Figures in brackets below the activity name represents the number of companies in the activity.
- Nil or negligible |
| Statement 7: Composition of Uses of Funds of the Select 21,186 NGNBF&I Companies : 2014-15 and 2015-16 |
| (Per cent) |
| Items |
All Activities |
Share Trading and Investment Holding |
Loan Finance |
| (21,186) |
(9,269) |
(2,396) |
| 2014-15 |
2015-16 |
2014-15 |
2015-16 |
2014-15 |
2015-16 |
| 1. Current Assets |
38.4 |
24.3 |
53.0 |
49.6 |
41.7 |
17.3 |
| (a) Cash and cash equivalents |
-1.2 |
-0.7 |
21.5 |
-4.1 |
2.5 |
-2.9 |
| (b) Current Investments |
4.9 |
-1.5 |
9.7 |
19.1 |
6.1 |
-2.4 |
| (c) Inventories |
3.5 |
0.6 |
16.5 |
9.4 |
3.3 |
-1.1 |
| (d) Trade receivables |
4.9 |
2.4 |
-4.3 |
7.3 |
-0.5 |
2.4 |
| (e) Short term loans and advances |
20.7 |
21.8 |
6.7 |
12.9 |
26.7 |
22.8 |
| (f) Other current assets |
5.5 |
1.8 |
2.9 |
4.9 |
3.7 |
-1.5 |
| 2. Non-Current Assets |
61.6 |
75.7 |
47.0 |
50.4 |
58.3 |
82.7 |
| (a) Non-Current Investments |
4.9 |
5.4 |
31.7 |
24.1 |
1.9 |
4.8 |
| Of which, Indian Securities |
4.9 |
5.2 |
31.5 |
23.9 |
2.0 |
4.4 |
| (b) Long term Loans and Advances |
52.8 |
65.4 |
10.8 |
20.7 |
54.9 |
75.3 |
| (c) Deferred tax assets |
-0.5 |
0.3 |
0.8 |
0.1 |
-0.2 |
0.6 |
| (d) Gross Fixed Assets |
1.4 |
1.5 |
2.8 |
6.8 |
1.1 |
2.0 |
| (e) Other non-current Assets |
2.9 |
3.1 |
0.9 |
-1.4 |
0.5 |
-0.1 |
| Total Uses of Funds |
100.0 |
100.0 |
100.0 |
100.0 |
100.0 |
100.0 |
| Items |
Asset Finance |
Diversified |
Miscellaneous |
| (4,039) |
(922) |
(4,560) |
| 1. Current Assets |
37.9 |
32.2 |
56.4 |
66.5 |
17.0 |
15.5 |
| (a) Cash and cash equivalents |
-6.6 |
3.7 |
12.6 |
2.2 |
-15.3 |
-7.2 |
| (b) Current Investments |
3.5 |
-1.7 |
8.6 |
22.9 |
1.6 |
-5.1 |
| (c) Inventories |
1.6 |
1.8 |
1.1 |
12.9 |
0.4 |
-0.1 |
| (d) Trade receivables |
15.7 |
2.5 |
-0.4 |
-14.1 |
-1.9 |
0.7 |
| (e) Short term loans and advances |
13.8 |
20.2 |
31.9 |
41.1 |
31.4 |
26.1 |
| (f) Other current assets |
9.9 |
5.6 |
2.6 |
1.5 |
0.8 |
1.2 |
| 2. Non-Current Assets |
62.1 |
67.8 |
43.6 |
33.5 |
83.0 |
84.5 |
| (a) Non-Current Investments |
-0.1 |
3.9 |
12.4 |
-22.3 |
9.3 |
7.6 |
| Of which, Indian Securities |
-0.1 |
3.9 |
12.4 |
-22.3 |
9.3 |
7.6 |
| (b) Long term Loans and Advances |
57.2 |
55.5 |
20.5 |
60.2 |
66.2 |
75.1 |
| (c) Deferred tax assets |
-1.6 |
0.2 |
0.1 |
0.4 |
1.0 |
-0.2 |
| (d) Gross Fixed Assets |
1.6 |
-0.1 |
4.1 |
12.9 |
0.8 |
2.9 |
| (e) Other non-current Assets |
5.0 |
8.4 |
6.5 |
-17.7 |
5.7 |
-0.9 |
| Total Uses of Funds |
100.0 |
100.0 |
100.0 |
100.0 |
100.0 |
100.0 |
| Note: Figures in parentheses below the activity name represents the number of companies. |
|