Performance of Private Corporate Business Sector during 2011-12* The performance of the private (non-financial) corporate business sector was mixed during 2011-12. While sales growth moderated slightly for the full year, it dropped perceptibly during the fourth quarter of 2011-12. More importantly, the profit growth decelerated sharply on account of higher input prices and rise in interest cost. Profit margins fell for the second consecutive year. In terms of the sectoral breakdown, sales growth was higher for companies in the manufacturing sector vis-à-vis those in the services sector. However, IT sector with significant support from other income witnessed substantial growth in net profits during 2011-12. The article analyses the performance of the private corporate business sector during 2011-12 based on the abridged financial results of 2,679 non-government non-financial (NGNF) listed companies and provides, inter alia, a brief analysis by size and industry. A brief review of the performance of private corporate sector over the quarters of 2011-12 has also been presented based on a common set of companies. Further, the article touches upon the performance of 231 nongovernment financial listed companies during 2011-12. Performance of Non-Government Non-Financial Companies Overall Performance Sales of 2,679 select NGNF companies showed slight moderation during 2011-12 as it grew by 18.5 per cent vis-à-vis 19.8 per cent during 2010-11 (Table 1). However, growth in profits declined sharply on account of continued pressure from rising raw material costs and much higher growth in power & fuel and interest expenses. Profitability, in terms of operating, gross and net profit margins (expressed as percentage to sales) contracted for the second consecutive year (Chart 1). Interest burden, measured as a ratio of interest payments to gross profits increased by 6.5 percentage points. Depreciation provision recorded a lower growth indicating lower capacity addition. The rest of the analysis is based on 2,273 common companies for which data are available for all the quarters of 2010-11 and 2011-12.
Table 1: Performance of Non-Government Non-Financial Companies: 2011-12 |
Item |
All Companies |
Common Companies |
2011-12 |
2010-11* |
2011-12 |
2010-11 |
No. of companies |
2,679 |
2,763 |
2,273 |
Amount
(` billion) |
Y-o-Y Growth in
Per cent |
Y-o-Y Growth in
Per cent |
Amount
(` billion) |
Y-o-Y Growth in
Per cent |
Y-o-Y Growth in
Per cent |
Sales |
25,897 |
18.5 |
19.8 |
25,248 |
18.6 |
20.0 |
Change in stock |
281 |
-23.5 |
88.4 |
279 |
-23.0 |
80.4 |
Expenditure |
22,684 |
20.7 |
22.1 |
22,094 |
20.9 |
22.3 |
Consumption of Raw Materials |
12,693 |
22.3 |
26.0 |
12,366 |
22.7 |
26.3 |
Staff Cost |
1,809 |
17.4 |
18.0 |
1,754 |
17.6 |
19.3 |
Power & fuel |
906 |
27.0 |
17.7 |
896 |
27.2 |
18.1 |
Operating Profits (PBDIT) |
3,494 |
1.7 |
12.4 |
3,433 |
1.7 |
12.3 |
Other Income |
560 |
40.7 |
5.6 |
518 |
41.4 |
2.0 |
Depreciation |
905 |
10.6 |
15.6 |
891 |
10.5 |
16.2 |
Gross Profits (PBIT) |
3,149 |
4.4 |
10.7 |
3,060 |
4.2 |
10.0 |
Interest |
882 |
35.9 |
19.8 |
855 |
35.8 |
20.5 |
Profits before tax (PBT) |
2,267 |
-4.2 |
8.7 |
2,205 |
-4.4 |
7.7 |
Tax provision |
574 |
3.3 |
19.7 |
563 |
11.3 |
11.3 |
Profits after tax (PAT)^ |
1,645 |
-16.8 |
15.8 |
1,598 |
-11.8 |
9.0 |
Paid-up capital |
1,007 |
5.0 |
7.6 |
926 |
4.8 |
7.3 |
^ : Adjusted for non-operating surplus/deficit.
* : Published in the October 2011 issue of RBI Bulletin |
 |
Performance according to Size Companies in the largest size class (comprising of companies having Paid-up Capital (PUC) more than `250 million each or sales more than `10 billion each) reported higher sales growth than the companies in the smaller size classes and increase in operating profits (Table 2). Operating profits of companies in the other size classes witnessed a decline. Further, due to higher interest expenses, the net profits declined for all size classes. Profit margins contracted for all size classes and interest burden increased across the board (Table 3). Impact of high interest rates was more severe on smaller companies (i.e., with sales up to `500 million each) and it eased progressively in higher sales size classes.
Table 2: Performance of the Select Companies according to Size: 2011-12 |
Size Class
(` million) |
No. of
Compa
nies |
Per cent
Share in
PUC |
Per cent
Share in
sales |
Per cent change (Y-o-Y Growth in Per cent) |
Sales |
Expen
diture |
PBDIT |
Other
Income |
Depre
ciation |
PBIT |
Inte
rest |
Tax
Provi
sion |
PAT |
1 |
2 |
3 |
4 |
5 |
6 |
7 |
8 |
9 |
10 |
11 |
12 |
PUC |
Less than 50 |
440 |
1.5 |
1.8 |
14.2 |
14.3 |
-7.5 |
31.7 |
-1.9 |
-3.3 |
34.7 |
7.8 |
-20.6 |
50 to 100 |
481 |
3.7 |
4.7 |
15.0 |
16.3 |
-5.5 |
33.6 |
9.2 |
-5.1 |
35.0 |
-1.3 |
-12.0 |
100 to 150 |
379 |
5.0 |
6.0 |
13.4 |
14.0 |
-0.3 |
30.5 |
16.1 |
-1.5 |
36.2 |
14.3 |
-8.2 |
150 to 250 |
361 |
7.5 |
8.5 |
13.0 |
15.4 |
-5.7 |
12.7 |
8.9 |
-7.7 |
30.4 |
-9.7 |
-26.6 |
250 and above |
612 |
82.4 |
79.0 |
19.8 |
22.5 |
2.8 |
44.5 |
10.6 |
5.9 |
36.6 |
13.6 |
-10.9 |
Sales |
Less than 250 |
449 |
7.3 |
0.2 |
-22.3 |
-20.2 |
$ |
76.1 |
-4.2 |
$ |
-27.7 |
-34.2 |
$ |
250 to 500 |
209 |
3.2 |
0.3 |
-18.2 |
-17.6 |
1.9 |
-1.5 |
-23.2 |
27.4 |
-18.4 |
54.9 |
$ |
500 to 1000 |
275 |
4.3 |
0.8 |
3.0 |
6.0 |
-23.7 |
6.2 |
-2.4 |
-22.0 |
13.2 |
3.7 |
-40.7 |
1000 to 5000 |
667 |
15.3 |
6.5 |
6.2 |
7.9 |
-11.5 |
36.4 |
2.4 |
-8.4 |
30.1 |
-9.7 |
-34.3 |
5000 to 10000 |
272 |
11.0 |
7.7 |
11.6 |
13.4 |
-8.3 |
54.4 |
16.5 |
-7.6 |
39.0 |
-1.3 |
-34.0 |
10000 and above |
401 |
58.9 |
84.5 |
20.9 |
23.4 |
3.6 |
41.6 |
11.2 |
6.1 |
38.0 |
13.7 |
-9.4 |
All Companies |
2,273 |
100.0 |
100.0 |
18.6 |
20.9 |
1.7 |
41.4 |
10.5 |
4.2 |
35.8 |
11.3 |
-11.8 |
$: Previous and/or current amount negative. |
Sector/Industry-wise Performance Sales growth was higher for companies engaged in manufacturing activities as compared with those engaged in computer & related activities and services other than IT (Table 4). However, companies in IT services recorded the highest growth in net profits with considerable support from other income and maintained the profit margin. During 2011-12, profitability of manufacturing and services sector got impacted on account of higher input prices and interest expenses. Sales contracted in some of the industries such as mining & quarrying, sugar (a sub group of food products & beverages), radio, television & communication equipments and real estate in 2011-12 (Statement 1). Further, sales growth in textiles and motor vehicles industries was lower in 2011-12 as compared with 2010-11. Most of the industries recorded decline in both operating and net profits. Basic industrial chemicals, paints and varnishes, cement & cement products, jewellery & related articles, electricity generation & supply and wholesale & retail trade industries registered above 15 per cent growth in both operating and net profits during 2011-12. Similarly, profit margins were lower in almost all the industries except for cement & cement products (Statement 2). Depending on its nature, interest expenses and hence, interest burden varied considerably among various industries. In several industries such as textiles, paper and paper products, radio, television and communication equipments, real estate, hotels and restaurants and transport, storage and communication, interest burden rose sharply during 2011-12. Major Components of Expenditure This section analyses the trends in major components of expenditure, viz., consumption of raw material and staff cost.
Table 3: Profit Allocation, Interest-Linked and Profitability Ratios according to Size: 2011-12 |
(Per cent) |
Size Class
(` million) |
Profit Allocation Ratios |
Interest linked Ratios |
Profitability Ratios |
Tax provision
to profits
before tax@ |
Interest to
Gross Profits |
Interest
coverage
(Number) |
Interest to
Sales |
Operating profits to Sales |
Profits
after tax
to Sales |
2010-11 |
2011-12 |
2010-11 |
2011-12 |
2010-11 |
2011-12 |
2010-11 |
2011-12 |
2010-11 |
2011-12 |
2010-11 |
2011-12 |
1 |
2 |
3 |
4 |
5 |
6 |
7 |
8 |
9 |
10 |
11 |
12 |
PUC |
Less than 50 |
28.2 |
33.3 |
23.7 |
33.1 |
4.2 |
3.0 |
2.0 |
2.3 |
9.6 |
7.8 |
6.1 |
4.2 |
50 to 100 |
25.1 |
28.1 |
29.6 |
42.1 |
3.4 |
2.4 |
3.1 |
3.7 |
12.0 |
9.9 |
5.4 |
4.2 |
100 to 150 |
23.5 |
28.4 |
31.4 |
43.4 |
3.2 |
2.3 |
3.1 |
3.8 |
11.7 |
10.3 |
5.1 |
4.1 |
150 to 250 |
24.0 |
26.8 |
32.1 |
45.4 |
3.1 |
2.2 |
3.6 |
4.2 |
13.2 |
11.0 |
5.7 |
3.7 |
250 and above |
20.4 |
22.9 |
19.7 |
25.5 |
5.1 |
3.9 |
2.9 |
3.3 |
16.8 |
14.4 |
9.3 |
6.9 |
Sales |
Less than 250 |
17.4 |
13.0 |
$ |
103.9 |
0.2 |
1.0 |
9.5 |
8.9 |
1.1 |
$ |
$ |
$ |
250 to 500 |
20.8 |
21.6 |
144.6 |
92.6 |
0.7 |
1.1 |
6.4 |
6.4 |
5.9 |
7.3 |
$ |
0.1 |
500 to 1000 |
21.3 |
23.7 |
43.2 |
62.8 |
2.3 |
1.6 |
4.5 |
5.0 |
11.0 |
8.2 |
5.9 |
3.4 |
1000 to 5000 |
22.7 |
26.2 |
43.2 |
61.4 |
2.3 |
1.6 |
4.6 |
5.6 |
12.8 |
10.7 |
4.5 |
2.8 |
5000 to 10000 |
21.3 |
25.3 |
31.9 |
47.9 |
3.1 |
2.1 |
4.0 |
5.0 |
14.4 |
11.8 |
7.0 |
4.1 |
10000 and above |
20.8 |
23.3 |
18.5 |
24.1 |
5.4 |
4.1 |
2.7 |
3.0 |
16.4 |
14.1 |
9.2 |
6.9 |
All Companies |
20.9 |
23.6 |
21.4 |
27.9 |
4.7 |
3.6 |
3.0 |
3.4 |
15.9 |
13.6 |
8.5 |
6.3 |
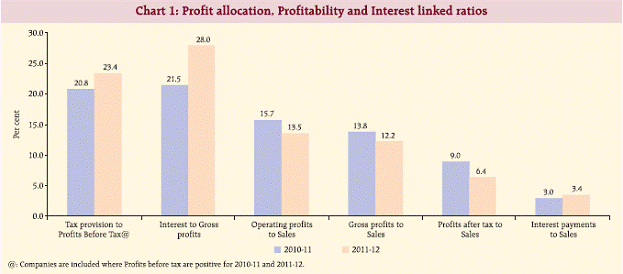
@: Companies are included where Profits before tax are positive for 2010-11 and 2011-12.
$: Previous and/or current amount negative. |
Table 4: Sector-wise performance of 2,273 selected companies: 2011-12 |
Item |
Manufacturing |
Services |
Services other than IT |
Computer and related activities (IT) |
Amount
(` billion) |
Per cent
change
(Y-o-Y) |
Amount
(` billion) |
Per cent
change
(Y-o-Y) |
Amount
(` billion) |
Per cent
change
(Y-o-Y) |
1 |
2 |
3 |
4 |
5 |
6 |
No. of companies |
1,665 |
431 |
177 |
Sales |
19,325 |
19.5 |
4,070 |
14.6 |
1,852 |
18.7 |
Expenditure |
17,200 |
21.9 |
3,449 |
16.9 |
1,445 |
19.6 |
Consumption of raw materials |
11,780 |
23.3 |
516 |
14.5 |
70 |
-4.8 |
Staff Cost |
841 |
14.1 |
251 |
11.2 |
662 |
25.4 |
Power & fuel |
534 |
25.7 |
362 |
29.4 |
- |
- |
Operating Profits (PBDIT) |
2,360 |
-0.7 |
664 |
3.2 |
409 |
14.7 |
Other Income |
325 |
41.1 |
115 |
19.2 |
79 |
96.5 |
Depreciation |
600 |
7.7 |
235 |
17.1 |
56 |
16.1 |
Gross Profits (PBIT) |
2,084 |
1.7 |
544 |
0.9 |
432 |
23.9 |
Interest |
543 |
32.9 |
285 |
39.8 |
28 |
58.3 |
Profits before tax (PBT) |
1,541 |
-6.1 |
259 |
-22.6 |
405 |
22.1 |
Tax provision |
392 |
2.8 |
78 |
15.1 |
94 |
63.2 |
Profits after tax (PAT) |
1,078 |
-14.3 |
196 |
-30.2 |
324 |
18.1 |
Paid-up capital |
547 |
5.5 |
319 |
4.1 |
60 |
1.8 |
Ratio in per cent |
2010-11 |
2011-12 |
2010-11 |
2011-12 |
2010-11 |
2011-12 |
Operating profits to Sales |
14.7 |
12.2 |
18.1 |
16.3 |
22.9 |
22.1 |
Gross profits to Sales |
12.7 |
10.8 |
15.2 |
13.4 |
22.4 |
23.3 |
Profits after tax to Sales |
7.8 |
5.6 |
7.9 |
4.8 |
17.6 |
17.5 |
Interest to Sales |
2.5 |
2.8 |
5.7 |
7.0 |
1.1 |
1.5 |
Interest to Gross profits |
19.9 |
26.1 |
37.8 |
52.3 |
5.0 |
6.4 |
Interest Coverage (Number) |
5.0 |
3.8 |
2.6 |
1.9 |
20.0 |
15.7 |
Consumption of Raw Materials Expenditure on consumption of raw materials, for reporting companies, increased by 22.7 per cent during 2011-12 (Table 5). The share of consumption of raw material in total expenditure at 66.3 per cent in 2011-12 increased by 80 basis points, with first quarter reflecting the sharpest rise. Staff Cost Staff cost increased by 17.6 per cent in 2011-12 (Table 6) though as a percentage of expenditure it was lower at 8.0 per cent as compared with 8.2 per cent in 2010-11.
Table 5: Consumption of Raw Materials: 2011-12 |
(Amount in ` billion) |
Item |
Q1 |
Q2 |
Q3 |
Q4 |
Year |
2010-11 |
2011-12 |
2010-11 |
2011-12 |
2010-11 |
2011-12 |
2010-11 |
2011-12 |
2010-11 |
2011-12 |
1 |
2 |
3 |
4 |
5 |
6 |
7 |
8 |
9 |
10 |
No. of companies* |
1,723 |
1,724 |
1,727 |
1,728 |
1,753 |
Consumption of raw materials (CRM) |
2,236 |
2,854 |
2,343 |
2,889 |
2,483 |
3,135 |
2,954 |
3,457 |
10,066 |
12,355 |
|
|
(27.2) |
|
(23.3) |
|
(26.3) |
|
(17.1) |
|
(22.7) |
Expenditure |
3,427 |
4,242 |
3,596 |
4,420 |
3,781 |
4,771 |
4,417 |
5,154 |
15,358 |
18,648 |
|
|
(23.8) |
|
(22.9) |
|
(26.2) |
|
(16.7) |
|
(21.4) |
CRM as percentage of expenditure |
65.2 |
67.3 |
65.2 |
65.4 |
65.7 |
65.7 |
66.9 |
67.1 |
65.5 |
66.3 |
* Number of companies reporting expenditure of raw materials explicitly.
Note: Figures in brackets denote percentage change over the corresponding period of the previous year. |
Table 6: Staff Cost: 2011-12 |
(Amount in ` billion) |
Item |
Q1 |
Q2 |
Q3 |
Q4 |
Year |
2010-11 |
2011-12 |
2010-11 |
2011-12 |
2010-11 |
2011-12 |
2010-11 |
2011-12 |
2010-11 |
2011-12 |
1 |
2 |
3 |
4 |
5 |
6 |
7 |
8 |
9 |
10 |
No. of companies* |
2,187 |
2,185 |
2,199 |
2,205 |
2,222 |
Staff cost |
345 |
414 |
371 |
435 |
381 |
453 |
400 |
457 |
1,491 |
1,754 |
|
|
(19.9) |
|
(17.4) |
|
(18.8) |
|
(14.4) |
|
(17.6) |
Expenditure |
4,118 |
5,064 |
4,287 |
5,269 |
4,540 |
5,696 |
5,223 |
6,087 |
18,232 |
22,050 |
|
|
(23.0) |
|
(22.9) |
|
(25.5) |
|
(16.5) |
|
(20.9) |
Staff cost as percentage of Expenditure |
8.4 |
8.2 |
8.6 |
8.3 |
8.4 |
8.0 |
7.7 |
7.5 |
8.2 |
8.0 |
*: Number of companies reporting staff cost explicitly.
Note: Figures in brackets denote percentage change over the corresponding period of the previous year. |
Performance over the quarters of 2011-12 Aggregate sales of corporates grew by 22.6 per cent (Y-o-Y) during the first quarter of 2011-12, which moderated during the subsequent quarters and registered 15.5 per cent growth in the fourth quarter, the slowest pace of growth in the last two years (Table 7). Net profit growth during the first quarter was at 6.9 per cent but it turned negative during the succeeding quarters on account of continue rising in input prices and higher interest expenses. However, support from other income coupled with relatively lower growth in interest expenses helped in arresting the decline in net profits in the fourth quarter of 2011- 12. Profit margin after declining up to the third quarter rose in the fourth quarter. Similarly, interest burden (Interest to Gross Profits) rose up to third quarter of 2011-12 and eased slightly in the fourth quarter. Industry wise analysis revealed that petroleum refinery industry having the highest share in sales registered high growth in sales during the first three quarters of 2011-12 (Statement 3). As the sales growth of refinery industry fell sharply in the fourth quarter along with a few other industries viz., edible oil, rubber & rubber products and cement & cement products, aggregate sales growth also declined. Barring a few industries like chemical and chemical products, cement and cement products, fabricated metal products, electricity generation and supply, wholesale and retail trade and computer and related activities, profits declined on a year-on-year basis in all (or most of) the quarters in 2011-12 (Statement 3). Profit margins also declined progressively up to the third quarter in many industries (Statement 5).
Table 7: Performance of the Select Companies over the Quarters of 2011-12 |
(Per cent) |
Item |
2010-11 |
2011-12 |
Q1 |
Q2 |
Q3 |
Q4 |
Q1 |
Q2 |
Q3 |
Q4 |
1 |
2 |
3 |
4 |
5 |
6 |
7 |
8 |
No. of companies |
2,273 |
Y-o-Y Growth |
|
|
|
|
|
|
|
|
Sales |
25.1 |
19.2 |
17.1 |
20.7 |
22.6 |
19.1 |
19.5 |
15.5 |
Expenditure |
29.6 |
20.3 |
19.0 |
22.9 |
23.0 |
22.7 |
25.4 |
16.5 |
Operating Profits |
15.2 |
7.3 |
11.0 |
16.5 |
12.5 |
-1.1 |
-6.0 |
-1.4 |
Other Income |
-26.2 |
55.1 |
6.1 |
-14.6 |
45.4 |
28.3 |
70.6 |
47.6 |
Depreciation |
20.2 |
17.6 |
14.7 |
14.6 |
9.7 |
9.7 |
10.3 |
11.2 |
Gross Profits |
8.1 |
9.0 |
9.5 |
11.9 |
16.5 |
-0.4 |
-3.2 |
2.5 |
Interest |
27.0 |
6.3 |
24.1 |
30.6 |
22.3 |
46.2 |
41.9 |
34.4 |
Profits after tax |
5.5 |
9.6 |
8.9 |
13.2 |
6.9 |
-15.6 |
-32.2 |
-7.7 |
Ratios |
|
|
|
|
|
|
|
|
Operating profits to Sales |
16.3 |
15.6 |
16.1 |
15.4 |
15.0 |
13.0 |
12.6 |
13.1 |
Gross profits to Sales |
13.6 |
13.5 |
13.6 |
13.4 |
13.0 |
11.3 |
11.0 |
12.2 |
Profits after tax to Sales |
8.6 |
8.6 |
8.4 |
8.6 |
7.5 |
6.1 |
4.8 |
6.9 |
Interest to Sales |
2.9 |
2.6 |
2.7 |
2.6 |
2.9 |
3.3 |
3.2 |
3.3 |
Interest to Gross profits |
20.9 |
19.5 |
19.8 |
19.0 |
22.0 |
28.8 |
28.9 |
27.3 |
Interest Coverage (Number) |
4.8 |
5.1 |
5.1 |
5.3 |
4.6 |
3.5 |
3.5 |
3.7 |
Note: Data for all companies whose results were available in a particular quarter are given in statement 6. |
Performance of Non-Government Financial Listed Companies The abridged financial results of select 231 financial companies in 2011-12 indicated a year-on-year rise of 32.4 per cent in income from operations, which was much higher than the previous year. Total expenditure of these companies also rose at a higher rate of 35.4 per cent primarily on account of higher growth in interest expenses. As a result, the growth in profits were much lower (Table 8). Profit margin showed decline in 2011-12. However, the decline in margin seen in the first three quarters was arrested in the fourth quarter.
Table 8: Performance of Financial Companies: 2011-12 |
Item |
Q1 |
Q2 |
Q3 |
Q4 |
Year |
Amount (` billion) |
Per cent
change*
(Y-o-Y) |
Amount (` billion) |
Per cent
change*
(Y-o-Y) |
Amount (` billion) |
Per cent
change*
(Y-o-Y) |
Amount (` billion) |
Per cent
change*
(Y-o-Y) |
Amount (` billion) |
Per cent
change*
(Y-o-Y) |
1 |
2 |
3 |
4 |
5 |
6 |
7 |
8 |
9 |
10 |
No. of companies |
231 |
Income from operations |
132 |
37.4 |
142 |
30.0 |
158 |
38.3 |
176 |
29.8 |
610 |
32.4 |
|
|
(1.7) |
|
(7.5) |
|
(13.8) |
|
(32.1) |
|
(12.8) |
Other income |
2 |
7.4 |
2 |
33.0 |
1 |
9.7 |
1 |
-8.5 |
6 |
21.4 |
|
|
(104.2) |
|
(56.0) |
|
(90.9) |
|
(5.4) |
|
(13.8) |
Expenditure @ |
97 |
40.5 |
108 |
40.8 |
123 |
47.4 |
130 |
28.4 |
461 |
35.4 |
|
|
(-5.6) |
|
(-0.5) |
|
(10.5) |
|
(42.4) |
|
(11.1) |
Interest Expenses |
60 |
56.3 |
67 |
60.5 |
75 |
61.5 |
75 |
43.0 |
276 |
55.1 |
|
|
(-5.2) |
|
(4.5) |
|
(20.0) |
|
(43.2) |
|
(14.2) |
Profits before depreciation and tax (PBDT) |
33 |
27.6 |
35 |
5.5 |
35 |
13.6 |
47 |
30.4 |
151 |
19.1 |
|
|
(28.3) |
|
(39.4) |
|
(29.8) |
|
(20.3) |
|
(28.8) |
Profits before tax (PBT) |
32 |
27.4 |
34 |
4.4 |
34 |
13.5 |
46 |
30.7 |
147 |
18.9 |
|
|
(29.1) |
|
(41.0) |
|
(30.2) |
|
(20.5) |
|
(29.5) |
Tax provision |
9 |
21.4 |
10 |
3.8 |
10 |
12.1 |
13 |
42.3 |
41 |
15.0 |
|
|
(38.4) |
|
(40.8) |
|
(25.0) |
|
(13.1) |
|
(26.9) |
Profits after tax (PAT) |
23 |
27.3 |
25 |
2.4 |
24 |
12.5 |
33 |
29.1 |
105 |
17.6 |
|
|
(23.6) |
|
(45.4) |
|
(33.5) |
|
(25.6) |
|
(31.7) |
Paid-up capital |
44 |
16.9 |
45 |
16.2 |
45 |
14.6 |
46 |
5.6 |
46 |
5.6 |
|
|
(10.7) |
|
(10.1) |
|
(11.1) |
|
(19.3) |
|
(18.8) |
Ratios in per cent |
2010-11 |
2011-12 |
2010-11 |
2011-12 |
2010-11 |
2011-12 |
2010-11 |
2011-12 |
2010-11 |
2011-12 |
PBDT/Total Income^ |
27.4 |
25.6 |
30.4 |
24.7 |
27.1 |
22.3 |
26.3 |
26.5 |
27.1 |
24.7 |
PAT/Total Income^ |
18.9 |
17.5 |
21.7 |
17.1 |
18.9 |
15.4 |
18.6 |
18.7 |
19.1 |
17.1 |
*: Figures in brackets denote per cent change over the corresponding period of previous year.
@: Includes interest expenses.
^: Includes other income. |
Statement 1: Industry-wise Growth Rates of Select Performance Indicators: 2011-12 (Contd.) |
Industry/Industry group |
No. of
compa
nies |
Sales |
Per cent change (Y-o-Y) |
Amount
(` billion) |
Per
cent
share |
Sales |
Expenditure |
Operating
profits |
Other Income |
2010-
11 |
2011-
12 |
2010-
11 |
2011-
12 |
2010-
11 |
2011-
12 |
2010-
11 |
2011-
12 |
1 |
2 |
3 |
4 |
5 |
6 |
7 |
8 |
9 |
10 |
11 |
1. Tea plantation |
15 |
25 |
0.1 |
3.2 |
11.5 |
6.5 |
11.5 |
-16.9 |
-7.8 |
49.1 |
172.6 |
2. Mining and quarrying |
32 |
128 |
0.5 |
28.3 |
-12.4 |
13.8 |
3.9 |
54.5 |
-33.9 |
-11.1 |
11.1 |
3. Food products and beverages |
|
|
|
|
|
|
|
|
|
|
|
Of which |
149 |
1,423 |
5.6 |
21.7 |
15.9 |
20.6 |
18.2 |
-8.0 |
0.3 |
-17.2 |
61.7 |
i. Sugar |
40 |
309 |
1.2 |
15.9 |
-13.0 |
8.7 |
-11.9 |
-46.3 |
-11.1 |
-37.5 |
16.9 |
ii. Edible oils |
32 |
543 |
2.2 |
29.6 |
40.2 |
32.1 |
41.9 |
16.6 |
-20.1 |
-8.5 |
89.7 |
iii. Other food products & beverages |
77 |
571 |
2.3 |
20.1 |
17.5 |
20.5 |
21.3 |
24.3 |
11.4 |
3.5 |
91.4 |
4. Textiles |
237 |
1,267 |
5.0 |
24.3 |
13.2 |
27.6 |
15.8 |
25.2 |
-19.7 |
-4.2 |
63.6 |
5. Paper and paper products |
34 |
117 |
0.5 |
18.4 |
11.2 |
21.6 |
17.1 |
9.2 |
-10.4 |
-7.5 |
-2.6 |
| 6. Chemicals and chemical products |
|
|
|
|
|
|
|
|
|
|
|
Of which |
319 |
2,562 |
10.1 |
18.4 |
18.7 |
21.6 |
19.7 |
10.6 |
10.8 |
-27.3 |
28.7 |
i. Basic industrial chemicals |
77 |
335 |
1.3 |
20.6 |
26.6 |
22.0 |
27.8 |
16.8 |
18.3 |
-3.6 |
21.5 |
ii. Chemical fertilisers and
pesticides |
38 |
594 |
2.4 |
22.9 |
16.3 |
24.6 |
19.8 |
40.6 |
3.2 |
-14.3 |
23.3 |
iii. Paints and varnishes |
10 |
168 |
0.7 |
22.3 |
29.3 |
25.0 |
30.6 |
14.1 |
17.8 |
-11.1 |
42.7 |
iv. Pharmaceuticals and medicines |
121 |
856 |
3.4 |
11.2 |
19.5 |
15.0 |
20.2 |
1.6 |
11.3 |
-45.0 |
32.4 |
v. Other chemical & chemical
products |
73 |
609 |
2.4 |
22.8 |
13.5 |
26.6 |
12.6 |
3.0 |
10.3 |
41.8 |
24.8 |
7. Rubber and plastic products |
107 |
635 |
2.5 |
31.4 |
19.5 |
37.8 |
20.0 |
21.8 |
-9.3 |
-18.0 |
3.3 |
8. Cement and cement products |
40 |
777 |
3.1 |
12.4 |
25.7 |
26.2 |
21.3 |
-22.2 |
37.7 |
24.4 |
54.2 |
9. Iron and steel |
112 |
2,046 |
8.1 |
15.8 |
18.8 |
19.9 |
21.4 |
12.8 |
-0.9 |
-20.8 |
23.4 |
10. Fabricated metal products except machinery and equipment |
32 |
188 |
0.7 |
43.2 |
17.9 |
43.6 |
17.2 |
48.4 |
18.9 |
-1.1 |
4.7 |
11. Machinery and machine tools |
129 |
931 |
3.7 |
24.3 |
16.7 |
28.6 |
17.8 |
15.7 |
-6.1 |
19.7 |
20.3 |
12. Electrical machinery and apparatus |
78 |
727 |
2.9 |
14.8 |
16.4 |
17.7 |
16.5 |
6.2 |
3.6 |
0.4 |
-5.1 |
13. Radio, television and communication equipments |
40 |
102 |
0.4 |
19.6 |
-8.1 |
24.3 |
-11.0 |
10.6 |
-7.4 |
62.8 |
-44.3 |
14. Medical precision and other scientific instruments |
15 |
152 |
0.6 |
26.5 |
14.1 |
25.6 |
20.3 |
20.7 |
-17.6 |
-0.6 |
-22.5 |
15. Motor vehicles and other transport equipments |
85 |
2,019 |
8.0 |
32.6 |
13.2 |
34.2 |
14.8 |
19.5 |
2.3 |
-17.4 |
33.2 |
16. Jewellery and related articles |
28 |
533 |
2.1 |
23.5 |
23.9 |
23.0 |
26.1 |
43.1 |
34.5 |
66.6 |
3.3 |
17. Real Estate |
28 |
103 |
0.4 |
12.5 |
-0.8 |
23.8 |
-5.8 |
14.1 |
-24.0 |
-10.0 |
73.5 |
18. Electricity generation and supply |
15 |
481 |
1.9 |
8.2 |
40.8 |
8.4 |
45.0 |
7.6 |
28.8 |
-1.6 |
45.6 |
19. Construction |
101 |
1,232 |
4.9 |
12.0 |
7.6 |
12.5 |
8.8 |
12.9 |
0.6 |
24.1 |
-1.1 |
20. Wholesale and retail trade |
90 |
648 |
2.6 |
-4.5 |
28.4 |
-4.3 |
30.4 |
-10.8 |
45.2 |
88.4 |
7.0 |
21. Hotel and restaurant |
41 |
68 |
0.3 |
15.5 |
9.3 |
19.0 |
16.1 |
7.0 |
-9.4 |
58.5 |
-6.4 |
22. Transport, storage and communication |
48 |
1,240 |
4.9 |
11.4 |
9.9 |
14.4 |
12.3 |
1.7 |
1.4 |
29.4 |
15.6 |
23. Computer and related activities |
177 |
1,852 |
7.3 |
15.6 |
18.7 |
17.0 |
19.6 |
10.9 |
14.7 |
29.4 |
96.5 |
24. Petroleum refinery |
14 |
3,960 |
15.7 |
28.6 |
31.2 |
28.3 |
36.7 |
27.8 |
-13.2 |
3.0 |
98.6 |
All companies+ |
2,273 |
25,247 |
100.0 |
20.0 |
18.6 |
22.3 |
20.9 |
12.3 |
1.7 |
2.0 |
41.4 |
+: All companies under study. |
Statement 1: Industry-wise Growth Rates of Select Performance Indicators: 2011-12 (Concld.) |
Industry/Industry group |
Per cent change (Y-o-Y) |
Depreciation |
Gross profits |
Interest |
Tax
provision |
Profits after tax |
2010-11 |
2011-12 |
2010-11 |
2011-12 |
2010-11 |
2011-12 |
2010-11 |
2011-12 |
2010-11 |
2011-12 |
12 |
13 |
14 |
15 |
16 |
17 |
18 |
19 |
20 |
21 |
1. Tea plantation |
7.9 |
12.2 |
-15.0 |
15.4 |
-11.0 |
39.7 |
-29.0 |
-0.3 |
-12.8 |
10.2 |
2. Mining and quarrying |
35.9 |
-13.7 |
43.8 |
-30.2 |
29.4 |
29.8 |
49.9 |
-33.3 |
22.2 |
-40.7 |
| 3. Food products and beverages |
|
|
|
|
|
|
|
|
|
|
Of which |
12.1 |
3.3 |
-13.3 |
5.6 |
28.5 |
20.0 |
-13.0 |
1.1 |
-33.7 |
-4.8 |
i. Sugar |
9.7 |
-6.7 |
-61.1 |
-9.3 |
35.1 |
11.5 |
$ |
$ |
$ |
$ |
ii. Edible oils |
20.3 |
10.1 |
14.2 |
-19.8 |
81.4 |
9.2 |
36.7 |
-1.2 |
-0.1 |
-28.7 |
iii. Other food products & beverages |
12.9 |
18.5 |
24.1 |
16.7 |
12.5 |
34.4 |
37.1 |
15.7 |
15.8 |
22.5 |
4. Textiles |
10.2 |
8.5 |
28.6 |
-21.6 |
15.5 |
39.1 |
31.3 |
-38.7 |
27.0 |
-56.2 |
5. Paper and paper products |
17.2 |
22.6 |
3.9 |
-31.3 |
14.4 |
38.8 |
44.9 |
-54.0 |
-6.6 |
-66.7 |
| 6. Chemicals and chemical products |
|
|
|
|
|
|
|
|
|
|
Of which |
12.9 |
11.3 |
4.2 |
13.0 |
16.4 |
48.6 |
-9.0 |
22.3 |
3.6 |
-4.6 |
i. Basic industrial chemicals |
19.4 |
13.3 |
14.0 |
20.2 |
12.1 |
43.5 |
44.1 |
49.4 |
-5.1 |
21.7 |
ii. Chemical fertilisers and pesticides |
6.1 |
1.9 |
38.9 |
6.1 |
33.1 |
11.3 |
21.4 |
8.0 |
46.6 |
-2.2 |
iii. Paints and varnishes |
25.5 |
16.9 |
9.7 |
20.9 |
-37.5 |
74.4 |
3.2 |
11.1 |
8.1 |
17.6 |
iv. Pharmaceuticals and medicines |
11.4 |
16.3 |
-9.2 |
13.4 |
11.9 |
81.2 |
-39.9 |
44.0 |
-9.5 |
-19.4 |
v. Other chemical & chemical products |
16.6 |
7.0 |
3.9 |
12.3 |
15.7 |
22.9 |
14.5 |
8.7 |
11.5 |
3.9 |
7. Rubber and plastic products |
18.7 |
15.6 |
18.6 |
-14.2 |
40.9 |
41.8 |
25.1 |
-22.9 |
12.5 |
-16.1 |
8. Cement and cement products |
27.0 |
29.8 |
-32.5 |
43.3 |
30.0 |
23.6 |
-47.0 |
55.7 |
-32.3 |
30.9 |
9. Iron and steel |
14.7 |
15.6 |
9.6 |
-3.1 |
2.2 |
32.8 |
31.6 |
-11.9 |
12.7 |
-29.8 |
10. Fabricated metal products except machinery and equipment |
17.3 |
12.7 |
48.5 |
18.4 |
18.1 |
36.7 |
49.4 |
5.9 |
115.8 |
-1.9 |
11. Machinery and machine tools |
13.1 |
26.7 |
16.5 |
-7.8 |
-0.3 |
55.5 |
19.0 |
-4.9 |
22.7 |
-14.8 |
12. Electrical machinery and apparatus |
14.3 |
13.3 |
3.8 |
0.2 |
1.3 |
45.1 |
-17.1 |
-18.3 |
47.2 |
-35.5 |
13. Radio, television and communication equipments |
40.3 |
-5.6 |
12.0 |
-20.5 |
-7.2 |
61.0 |
5.8 |
-46.1 |
$ |
$ |
14. Medical precision and other scientific instruments |
24.7 |
28.9 |
20.0 |
-22.8 |
143.9 |
-43.7 |
9.4 |
-19.8 |
3.0 |
-23.0 |
15. Motor vehicles and other transport equipments |
26.4 |
30.7 |
12.7 |
-0.8 |
11.2 |
12.5 |
20.2 |
7.6 |
10.4 |
0.7 |
16. Jewellery and related articles |
-20.6 |
38.0 |
49.5 |
30.1 |
20.6 |
48.7 |
73.2 |
32.8 |
47.9 |
21.8 |
17. Real Estate |
14.0 |
11.3 |
11.0 |
-17.2 |
4.8 |
33.2 |
20.7 |
-13.6 |
7.5 |
-46.0 |
18. Electricity generation and supply |
17.2 |
18.0 |
3.9 |
34.6 |
21.1 |
46.5 |
-16.4 |
77.4 |
2.3 |
18.5 |
19. Construction |
18.4 |
12.3 |
13.8 |
-1.3 |
27.5 |
33.2 |
6.0 |
-18.9 |
-1.4 |
-34.5 |
20. Wholesale and retail trade |
1.0 |
19.3 |
5.0 |
35.7 |
-30.3 |
57.4 |
-7.4 |
-21.1 |
52.9 |
15.8 |
21. Hotel and restaurant |
9.7 |
15.0 |
12.0 |
-16.9 |
21.0 |
41.7 |
17.1 |
-1.7 |
-1.0 |
-4.1 |
22. Transport, storage and communication |
10.2 |
18.5 |
-2.6 |
-10.7 |
150.1 |
46.9 |
23.9 |
136.7 |
-21.6 |
-60.5 |
23. Computer and related activities |
1.0 |
16.1 |
14.2 |
23.9 |
26.3 |
58.3 |
16.3 |
63.2 |
12.3 |
18.1 |
24. Petroleum refinery |
27.7 |
-15.1 |
24.5 |
0.1 |
11.4 |
15.7 |
42.2 |
9.3 |
28.6 |
-23.9 |
All companies + |
16.2 |
10.5 |
10.0 |
4.2 |
20.5 |
35.8 |
11.3 |
11.3 |
9.0 |
-11.8 |
| $: Previous and/or current amount negative. +: All companies under study. |
Statement 2: Industry-wise Profit Allocation, Interest-linked and Profitability Ratios: 2011-12 |
(Per cent) |
Industry/Industry group |
Profit allocation ratios |
Interest linked ratios |
Profitability ratios |
Tax provision
to Profits
before tax |
Interest to
Gross
profits |
Interest
coverage
(Times) |
Interest to
Sales |
Operating
profits to Sales |
Profits after tax to
Sales |
2010-
11 |
2011-
12 |
2010-
11 |
2011-
12 |
2010-
11 |
2011-
12 |
2010-
11 |
2011-
12 |
2010-
11 |
2011-
12 |
2010-
11 |
2011-
12 |
1 |
2 |
3 |
4 |
5 |
6 |
7 |
8 |
9 |
10 |
11 |
12 |
1. Tea plantation |
15.6 |
14.0 |
17.9 |
21.6 |
5.6 |
4.6 |
3.6 |
4.5 |
19.5 |
16.1 |
13.5 |
13.3 |
2. Mining and quarrying |
21.8 |
27.6 |
18.8 |
34.9 |
5.3 |
2.9 |
8.4 |
12.4 |
42.8 |
32.3 |
23.1 |
15.6 |
| 3. Food products and beverages |
|
|
|
|
|
|
|
|
|
|
|
|
Of which |
25.4 |
27.5 |
45.8 |
52.0 |
2.2 |
1.9 |
3.6 |
3.7 |
9.4 |
8.1 |
3.1 |
2.5 |
i. Sugar |
15.5 |
15.3 |
104.9 |
128.9 |
1.0 |
0.8 |
6.3 |
8.1 |
9.4 |
9.6 |
0.1 |
-2.1 |
ii. Edible oils |
23.5 |
28.9 |
33.8 |
46.0 |
3.0 |
2.2 |
1.2 |
1.0 |
4.3 |
2.4 |
1.8 |
0.9 |
iii. Other food products & beverages |
27.0 |
28.5 |
27.8 |
32.0 |
3.6 |
3.1 |
3.5 |
4.0 |
13.4 |
12.7 |
6.3 |
6.5 |
4. Textiles |
21.9 |
23.3 |
38.9 |
69.0 |
2.6 |
1.4 |
4.8 |
5.9 |
15.6 |
11.0 |
5.3 |
2.1 |
5. Paper and paper products |
18.4 |
26.9 |
43.5 |
87.8 |
2.3 |
1.1 |
4.4 |
5.5 |
16.0 |
12.9 |
4.3 |
1.3 |
| 6. Chemicals and chemical products |
|
|
|
|
|
|
|
|
|
|
|
|
Of which |
20.7 |
22.9 |
13.9 |
18.3 |
7.2 |
5.5 |
2.1 |
2.6 |
16.0 |
14.9 |
10.0 |
8.1 |
i. Basic industrial chemicals |
18.7 |
24.3 |
28.7 |
34.2 |
3.5 |
2.9 |
4.1 |
4.7 |
17.4 |
16.3 |
7.8 |
7.5 |
ii. Chemical fertilisers and pesticides |
30.4 |
30.7 |
16.3 |
17.1 |
6.1 |
5.9 |
2.0 |
1.9 |
13.4 |
11.9 |
7.5 |
6.3 |
iii. Paints and varnishes |
29.6 |
27.6 |
2.4 |
3.5 |
41.7 |
28.9 |
0.4 |
0.5 |
14.7 |
13.3 |
10.6 |
9.7 |
iv. Pharmaceuticals and medicines |
13.3 |
17.9 |
12.9 |
20.6 |
7.8 |
4.9 |
2.5 |
3.7 |
19.9 |
18.6 |
12.9 |
8.7 |
v. Other chemical & chemical products |
24.3 |
23.9 |
8.6 |
9.4 |
11.6 |
10.6 |
1.1 |
1.2 |
12.9 |
12.5 |
9.5 |
8.7 |
7. Rubber and plastic products |
23.9 |
26.6 |
24.2 |
40.0 |
4.1 |
2.5 |
2.9 |
3.4 |
13.7 |
10.4 |
6.2 |
4.3 |
8. Cement and cement products |
21.6 |
22.4 |
20.1 |
17.3 |
5.0 |
5.8 |
2.8 |
2.8 |
19.0 |
20.8 |
8.7 |
9.1 |
9. Iron and steel |
27.8 |
28.5 |
29.1 |
39.9 |
3.4 |
2.5 |
4.8 |
5.4 |
19.4 |
16.1 |
8.7 |
5.2 |
10. Fabricated metal products except machinery and equipment |
30.1 |
28.3 |
20.3 |
23.4 |
4.9 |
4.3 |
3.0 |
3.5 |
16.5 |
16.7 |
8.1 |
6.8 |
11. Machinery and machine tools |
25.7 |
26.4 |
9.2 |
15.5 |
10.9 |
6.5 |
1.1 |
1.5 |
12.7 |
10.2 |
8.4 |
6.1 |
12. Electrical machinery and apparatus |
28.5 |
26.5 |
26.6 |
38.6 |
3.8 |
2.6 |
2.6 |
3.2 |
10.0 |
8.9 |
5.6 |
3.1 |
13. Radio, television and communication equipments |
10.5 |
9.9 |
68.6 |
138.8 |
1.5 |
0.7 |
4.8 |
8.5 |
8.4 |
8.5 |
5.0 |
-3.8 |
14. Medical precision and other scientific instruments |
34.0 |
35.3 |
-2.0 |
-1.4 |
$ |
$ |
-0.2 |
-0.1 |
12.8 |
9.2 |
8.2 |
5.5 |
15. Motor vehicles and other transport equipments |
19.7 |
21.9 |
15.8 |
17.9 |
6.3 |
5.6 |
1.6 |
1.6 |
11.5 |
10.4 |
6.9 |
6.2 |
16. Jewellery and related articles |
16.8 |
17.5 |
24.7 |
28.2 |
4.1 |
3.5 |
1.1 |
1.4 |
4.2 |
4.5 |
2.9 |
2.9 |
17. Real Estate |
21.5 |
27.1 |
31.3 |
50.3 |
3.2 |
2.0 |
12.8 |
17.2 |
39.3 |
30.1 |
21.9 |
11.9 |
18. Electricity generation and supply |
15.4 |
21.0 |
27.9 |
30.4 |
3.6 |
3.3 |
6.6 |
6.9 |
25.0 |
22.9 |
14.2 |
12.0 |
19. Construction |
25.2 |
27.7 |
44.1 |
59.5 |
2.3 |
1.7 |
6.9 |
8.5 |
14.9 |
13.9 |
6.6 |
4.0 |
20. Wholesale and retail trade |
20.7 |
15.7 |
40.3 |
46.8 |
2.5 |
2.1 |
1.8 |
2.3 |
3.7 |
4.2 |
2.3 |
2.1 |
21. Hotel and restaurant |
30.0 |
29.5 |
39.4 |
67.1 |
2.5 |
1.5 |
9.0 |
11.7 |
26.8 |
22.2 |
9.1 |
7.9 |
22. Transport, storage and communication |
6.9 |
18.7 |
41.9 |
69.0 |
2.4 |
1.4 |
5.5 |
7.3 |
22.0 |
20.3 |
8.0 |
2.9 |
23. Computer and related activities |
16.9 |
22.2 |
5.0 |
6.4 |
20.0 |
15.7 |
1.1 |
1.5 |
22.9 |
22.1 |
17.6 |
17.5 |
24. Petroleum refinery |
17.7 |
20.5 |
11.6 |
13.4 |
8.6 |
7.4 |
1.2 |
1.0 |
13.8 |
9.2 |
7.2 |
4.2 |
All companies + |
20.9 |
23.6 |
21.4 |
27.9 |
4.7 |
3.6 |
3.0 |
3.4 |
15.9 |
13.6 |
8.5 |
6.3 |
+: All companies under study.
$: Previous and/or current amount negative. |
Statement 3: Industry-wise Growth Rates of Select Performance Indicators in the Quarters of 2011-12 (Contd.) |
(Per cent change (Y-o-Y)) |
Industry/Industry group |
Number
of comp
anies |
Sales |
Expenditure |
Q1 |
Q2 |
Q3 |
Q4 |
Q1 |
Q2 |
Q3 |
Q4 |
1 |
2 |
3 |
4 |
5 |
6 |
7 |
8 |
9 |
1. Tea plantation |
14 |
20.3 |
17.6 |
9.6 |
12.3 |
21.8 |
11.6 |
10.0 |
34.7 |
2. Mining and quarrying |
33 |
-9.1 |
-7.7 |
1.7 |
-26.3 |
-4.5 |
10.6 |
19.6 |
5.3 |
3. Food products and beverages |
|
|
|
|
|
|
|
|
|
Of which |
151 |
26.1 |
21.1 |
14.3 |
15.3 |
21.2 |
23.0 |
26.0 |
22.4 |
i. Sugar |
41 |
4.1 |
-1.2 |
-21.3 |
-0.7 |
-33.3 |
-14.1 |
11.6 |
14.2 |
ii. Edible oils |
32 |
57.4 |
41.7 |
41.3 |
24.8 |
60.3 |
41.3 |
42.0 |
28.6 |
iii. Other food products & beverages |
78 |
16.8 |
19.2 |
16.7 |
18.9 |
20.1 |
20.4 |
20.9 |
26.2 |
4. Textiles |
236 |
20.2 |
19.4 |
8.2 |
5.4 |
26.3 |
22.6 |
13.6 |
2.6 |
5. Paper and paper products |
35 |
14.4 |
10.3 |
6.9 |
15.3 |
21.8 |
21.5 |
14.0 |
13.2 |
6. Chemicals and chemical products |
|
|
|
|
|
|
|
|
|
Of which |
317 |
19.6 |
16.9 |
22.4 |
22.9 |
16.6 |
22.7 |
31.2 |
18.5 |
i. Basic industrial chemicals |
75 |
28.8 |
33.5 |
26.6 |
16.6 |
22.4 |
32.4 |
28.5 |
25.6 |
ii. Chemical fertilisers and pesticides |
38 |
24.2 |
13.7 |
24.3 |
35.7 |
12.8 |
26.9 |
54.4 |
24.9 |
iii. Paints and varnishes |
10 |
26.6 |
22.6 |
22.0 |
45.8 |
26.5 |
21.2 |
28.8 |
45.1 |
iv. Pharmaceuticals and medicines |
120 |
14.9 |
11.8 |
25.9 |
21.3 |
14.0 |
18.0 |
32.1 |
15.2 |
v. Other chemical & chemical
products |
74 |
15.4 |
18.4 |
13.8 |
13.2 |
18.0 |
20.0 |
10.5 |
7.9 |
7. Rubber and plastic products |
104 |
33.0 |
20.9 |
20.2 |
12.0 |
32.9 |
25.4 |
21.1 |
8.8 |
8. Cement and cement products |
40 |
27.4 |
25.4 |
27.8 |
20.2 |
26.7 |
20.1 |
21.0 |
15.1 |
9. Iron and steel |
111 |
24.6 |
17.7 |
20.6 |
16.6 |
21.5 |
22.6 |
31.9 |
16.7 |
10. Fabricated metal products except machinery and equipment |
31 |
29.0 |
20.1 |
11.9 |
8.3 |
27.6 |
20.1 |
11.6 |
7.4 |
11. Machinery and machine tools |
128 |
14.1 |
18.0 |
20.9 |
12.6 |
15.7 |
21.8 |
21.1 |
11.5 |
12. Electrical machinery and apparatus |
79 |
12.8 |
19.6 |
13.7 |
17.4 |
14.7 |
21.9 |
17.7 |
14.5 |
13. Radio, television and communication equipments |
40 |
7.7 |
-10.4 |
-17.5 |
-14.8 |
5.2 |
-10.9 |
-16.6 |
-18.2 |
| 14. Medical precision and other scientific instruments |
14 |
32.9 |
17.5 |
-1.7 |
8.7 |
41.8 |
20.3 |
16.0 |
14.9 |
15. Motor vehicles and other transport equipments |
86 |
18.2 |
12.2 |
10.7 |
14.5 |
20.7 |
12.6 |
15.3 |
14.3 |
16. Jewellery and related articles |
28 |
52.7 |
14.5 |
23.7 |
26.3 |
47.6 |
19.0 |
20.8 |
29.4 |
17. Real Estate |
28 |
-1.4 |
-13.3 |
-2.0 |
1.6 |
-13.8 |
12.6 |
-20.1 |
-3.6 |
18. Electricity generation and supply |
14 |
27.6 |
34.0 |
44.3 |
59.5 |
29.6 |
39.9 |
46.7 |
69.4 |
19. Construction |
101 |
9.4 |
8.9 |
8.2 |
6.6 |
8.3 |
7.8 |
12.5 |
9.3 |
20. Wholesale and retail trade |
91 |
18.4 |
37.5 |
32.2 |
23.4 |
21.8 |
41.0 |
34.3 |
19.5 |
21. Hotel and restaurant |
41 |
13.8 |
10.8 |
6.7 |
8.2 |
13.7 |
11.1 |
16.4 |
22.8 |
22. Transport, storage and
communication |
47 |
10.6 |
9.5 |
10.7 |
8.3 |
13.8 |
14.2 |
13.5 |
10.0 |
23. Computer and related activities |
176 |
18.9 |
17.0 |
22.2 |
16.0 |
20.5 |
18.5 |
24.1 |
15.0 |
24. Petroleum refinery |
14 |
39.1 |
33.4 |
35.5 |
19.2 |
37.9 |
40.2 |
47.0 |
24.4 |
All companies+ |
2,273 |
22.6 |
19.1 |
19.5 |
15.5 |
23.0 |
22.7 |
25.4 |
16.5 |
+: All companies under study. |
Statement 3: Industry-wise Growth Rates of Select Performance Indicators in the Quarters of 2011-12 (Concld.) |
(Per cent change (Y-o-Y)) |
Industry/Industry group |
Number of
companies |
PBDIT |
PAT |
Q1 |
Q2 |
Q3 |
Q4 |
Q1 |
Q2 |
Q3 |
Q4 |
1 |
10 |
11 |
12 |
13 |
14 |
15 |
16 |
17 |
1.Tea plantation |
14 |
29.7 |
10.0 |
-14.8 |
$ |
166.9 |
4.2 |
14.9 |
$ |
2. Mining and quarrying |
33 |
-14.8 |
-60.6 |
-37.9 |
-51.5 |
-34.2 |
$ |
-55.7 |
11.1 |
| 3. Food products and beverages |
|
|
|
|
|
|
|
|
|
Of which |
151 |
39.9 |
7.1 |
-16.3 |
-2.0 |
36.6 |
57.0 |
-68.1 |
-4.2 |
i. Sugar |
41 |
347.3 |
$ |
-50.0 |
-18.9 |
$ |
$ |
$ |
-35.6 |
ii. Edible oils |
32 |
12.4 |
-59.4 |
-41.6 |
35.9 |
-20.5 |
-96.3 |
-73.5 |
110.8 |
iii.Other food products & beverages |
78 |
13.9 |
10.2 |
8.1 |
9.6 |
6.1 |
34.5 |
8.0 |
10.1 |
4.Textiles |
236 |
-10.3 |
-22.6 |
-30.4 |
-18.9 |
-93.5 |
-80.7 |
-47.5 |
-33.7 |
5. Paper and paper products |
35 |
4.6 |
-17.8 |
-31.5 |
-2.5 |
-25.8 |
$ |
-90.5 |
47.6 |
| 6. Chemicals and chemical products |
|
|
|
|
|
|
|
|
|
Of which |
317 |
20.8 |
0.2 |
3.8 |
16.6 |
28.2 |
0.3 |
-60.5 |
21.5 |
i. Basic industrial chemicals |
75 |
50.2 |
35.5 |
21.6 |
-26.1 |
131.0 |
38.7 |
11.6 |
-54.6 |
ii. Chemical fertilisers and pesticides |
38 |
25.0 |
-1.2 |
1.1 |
5.3 |
22.9 |
-2.7 |
-15.3 |
0.1 |
iii. Paints and varnishes |
10 |
15.1 |
0.5 |
19.3 |
37.4 |
16.7 |
2.8 |
18.2 |
33.0 |
iv. Pharmaceuticals and medicines |
120 |
21.8 |
-10.1 |
-7.3 |
36.0 |
19.4 |
-7.3 |
$ |
78.0 |
v. Other chemical & chemical products |
74 |
0.0 |
2.9 |
16.9 |
19.2 |
10.5 |
3.3 |
6.2 |
-7.1 |
7. Rubber and plastic products |
104 |
12.9 |
-25.3 |
-28.6 |
2.6 |
-10.1 |
-8.8 |
-49.6 |
12.7 |
8. Cement and cement products |
40 |
29.3 |
56.9 |
43.9 |
32.9 |
29.6 |
112.1 |
76.9 |
-4.7 |
9. Iron and steel |
111 |
8.4 |
-5.3 |
-9.7 |
-2.0 |
-16.0 |
-54.1 |
-35.0 |
-18.1 |
10. Fabricated metal products except machinery and equipment |
31 |
28.5 |
19.4 |
14.2 |
12.0 |
-31.8 |
18.1 |
5.1 |
-10.0 |
11. Machinery and machine tools |
128 |
-5.6 |
-8.0 |
-5.4 |
-13.0 |
-14.5 |
-17.8 |
-24.5 |
-12.6 |
12. Electrical machinery and apparatus |
79 |
-6.8 |
-5.6 |
-20.4 |
4.2 |
-6.2 |
-50.6 |
-57.2 |
-43.5 |
13. Radio, television and communication equipments |
40 |
11.4 |
-11.5 |
-40.4 |
54.9 |
-82.0 |
$ |
$ |
$ |
14. Medical precision and other scientific instruments |
14 |
23.4 |
-25.3 |
-57.2 |
-26.5 |
24.3 |
-30.4 |
-61.5 |
-48.0 |
15. Motor vehicles and other transport equipments |
86 |
11.6 |
-7.9 |
-3.9 |
10.5 |
14.5 |
-16.7 |
-13.1 |
12.2 |
16. Jewellery and related articles |
28 |
23.6 |
16.8 |
21.3 |
69.2 |
10.1 |
-1.9 |
-5.5 |
64.5 |
17. Real Estate |
28 |
-16.0 |
-51.2 |
-43.7 |
-20.0 |
-29.4 |
-62.9 |
-68.4 |
-23.9 |
18. Electricity generation and supply |
14 |
22.4 |
22.9 |
30.6 |
28.2 |
2.1 |
24.6 |
41.9 |
11.5 |
19. Construction |
101 |
11.9 |
7.0 |
-13.9 |
-3.8 |
-32.6 |
-21.4 |
-35.1 |
-54.6 |
20. Wholesale and retail trade |
91 |
142.6 |
6.7 |
13.8 |
63.3 |
$ |
-40.4 |
-18.0 |
37.5 |
21. Hotel and restaurant |
41 |
14.3 |
9.4 |
-13.2 |
-23.0 |
46.1 |
$ |
-64.6 |
33.2 |
22. Transport, storage and communication |
47 |
2.8 |
-7.0 |
0.1 |
1.7 |
-54.9 |
-92.8 |
-43.4 |
-56.6 |
23. Computer and related activities |
176 |
14.7 |
9.1 |
20.9 |
13.3 |
19.1 |
20.5 |
15.8 |
17.7 |
24. Petroleum refinery |
14 |
10.5 |
0.4 |
-24.6 |
-36.1 |
27.4 |
8.6 |
-89.6 |
-33.9 |
All companies + |
2,273 |
12.5 |
-1.1 |
-6.0 |
-1.4 |
6.9 |
-15.6 |
-32.2 |
-7.7 |
$: Previous and/or current amount negative. +: All companies under study. |
Statement 4: Industry-wise Interest-Linked Ratios in the Quarters of 2011-12 (Contd.) |
(Per cent) |
Industry/Industry group |
Interest to Gross Profits |
Q1 |
Q2 |
Q3 |
Q4 |
2010-11 |
2011-12 |
2010-11 |
2011-12 |
2010-11 |
2011-12 |
2010-11 |
2011-12 |
1 |
2 |
3 |
4 |
5 |
6 |
7 |
8 |
1. Tea plantation |
18.2 |
19.6 |
4.9 |
7.1 |
7.6 |
13.6 |
$ |
$ |
2. Mining and quarrying |
16.0 |
22.3 |
37.7 |
112.4 |
20.3 |
38.3 |
10.8 |
10.2 |
| 3. Food products and beverages |
|
|
|
|
|
|
|
|
Of which |
51.3 |
49.5 |
62.6 |
69.1 |
43.7 |
65.3 |
37.5 |
43.8 |
i. Sugar |
$ |
138.1 |
$ |
$ |
96.8 |
$ |
42.6 |
53.9 |
ii. Edible oils |
19.3 |
34.2 |
24.2 |
61.7 |
41.1 |
62.1 |
54.2 |
41.0 |
iii. Other food products & beverages |
26.8 |
28.5 |
25.5 |
32.3 |
26.7 |
35.7 |
29.2 |
36.7 |
4. Textiles |
54.1 |
83.2 |
36.5 |
73.5 |
33.8 |
78.8 |
37.6 |
55.6 |
5. Paper and paper products |
27.9 |
43.2 |
36.4 |
88.6 |
42.7 |
89.0 |
50.2 |
78.4 |
| 6. Chemicals and chemical products |
|
|
|
|
|
|
|
|
Of which |
17.0 |
13.4 |
9.8 |
20.5 |
11.9 |
21.2 |
16.4 |
16.2 |
i. Basic industrial chemicals |
32.2 |
25.3 |
30.9 |
28.6 |
32.8 |
34.3 |
23.1 |
50.7 |
ii. Chemical fertilisers and pesticides |
22.4 |
14.2 |
11.5 |
17.5 |
15.4 |
17.9 |
17.7 |
20.5 |
iii. Paints and varnishes |
1.3 |
0.5 |
1.8 |
3.4 |
2.6 |
3.0 |
3.7 |
4.2 |
iv. Pharmaceuticals and medicines |
16.0 |
10.3 |
6.0 |
28.3 |
8.3 |
29.2 |
19.1 |
12.0 |
v. Other chemical & chemical products |
11.3 |
13.5 |
8.0 |
9.5 |
8.9 |
9.0 |
8.9 |
10.1 |
7. Rubber and plastic products |
27.3 |
39.8 |
20.8 |
42.9 |
20.2 |
42.9 |
25.9 |
33.5 |
8. Cement and cement products |
15.0 |
14.8 |
38.9 |
31.1 |
25.7 |
17.2 |
15.8 |
12.9 |
9. Iron and steel |
24.7 |
24.7 |
25.8 |
43.4 |
29.0 |
44.7 |
26.3 |
37.3 |
10. Fabricated metal products except machinery and equipment |
30.4 |
27.9 |
16.7 |
22.5 |
17.5 |
22.3 |
16.4 |
15.7 |
11. Machinery and machine tools |
13.2 |
20.6 |
6.2 |
12.7 |
7.8 |
13.8 |
9.6 |
18.7 |
12. Electrical machinery and apparatus |
13.7 |
21.7 |
23.1 |
40.5 |
26.3 |
49.0 |
19.5 |
26.3 |
13. Radio, television and communication equipments |
54.0 |
78.6 |
49.4 |
187.3 |
54.0 |
214.9 |
92.4 |
131.0 |
14. Medical precision and other scientific instruments |
-2.4 |
-1.6 |
-3.4 |
-4.6 |
-4.9 |
-10.8 |
10.6 |
20.1 |
15. Motor vehicles and other transport equipments |
12.0 |
11.3 |
14.2 |
18.5 |
14.4 |
17.9 |
15.4 |
15.4 |
16. Jewellery and related articles |
29.4 |
30.1 |
18.6 |
21.5 |
17.9 |
34.4 |
31.5 |
27.5 |
17. Real Estate |
32.1 |
44.0 |
11.3 |
34.8 |
15.3 |
41.5 |
36.6 |
50.5 |
18. Electricity generation and supply |
21.2 |
22.8 |
27.6 |
27.9 |
37.0 |
34.2 |
27.6 |
34.0 |
19. Construction |
44.1 |
55.1 |
46.8 |
59.6 |
43.7 |
59.7 |
39.7 |
63.1 |
20. Wholesale and retail trade |
81.5 |
39.7 |
28.1 |
49.8 |
39.8 |
57.1 |
44.2 |
42.6 |
21. Hotel and restaurant |
69.4 |
63.0 |
96.9 |
96.5 |
31.3 |
54.6 |
24.0 |
68.0 |
22. Transport, storage and communication |
45.1 |
56.5 |
35.8 |
85.2 |
35.5 |
60.8 |
39.3 |
73.8 |
23. Computer and related activities |
5.3 |
5.4 |
4.0 |
6.4 |
4.2 |
5.7 |
4.9 |
6.3 |
24. Petroleum refinery |
11.9 |
9.4 |
11.5 |
11.9 |
10.9 |
15.2 |
12.1 |
18.3 |
All companies + |
20.9 |
22.0 |
19.7 |
28.8 |
19.7 |
28.9 |
20.8 |
27.3 |
$: Previous and/or current amount negative.
+: All companies under study. |
Statement 4: Industry-wise Interest-Linked Ratios in the Quarters of 2011-12 (Concld.) |
(Per cent) |
Industry/Industry group |
Interest to Sales |
Q1 |
Q2 |
Q3 |
Q4 |
2010-11 |
2011-12 |
2010-11 |
2011-12 |
2010-11 |
2011-12 |
2010-11 |
2011-12 |
9 |
10 |
11 |
12 |
13 |
14 |
15 |
16 |
1. Tea plantation |
2.2 |
2.0 |
1.9 |
2.5 |
2.1 |
2.9 |
4.5 |
5.8 |
2. Mining and quarrying |
7.2 |
9.5 |
13.1 |
14.8 |
8.5 |
10.2 |
5.1 |
4.0 |
| 3. Food products and beverages |
|
|
|
|
|
|
|
|
Of which |
3.3 |
3.7 |
3.5 |
3.5 |
3.3 |
3.5 |
4.0 |
4.0 |
i. Sugar |
5.9 |
8.2 |
7.0 |
8.4 |
5.6 |
8.4 |
7.4 |
7.7 |
ii. Edible oils |
0.8 |
1.0 |
1.0 |
0.5 |
1.4 |
0.7 |
1.5 |
1.3 |
iii. Other food products & beverages |
3.5 |
3.6 |
3.2 |
3.8 |
3.3 |
4.0 |
3.6 |
4.1 |
4. Textiles |
5.3 |
5.8 |
4.6 |
5.5 |
4.4 |
6.0 |
4.6 |
5.9 |
5. Paper and paper products |
3.4 |
4.6 |
4.1 |
5.3 |
4.1 |
5.5 |
4.2 |
4.7 |
| 6. Chemicals and chemical products |
|
|
|
|
|
|
|
|
Of which |
2.4 |
2.0 |
1.6 |
2.7 |
1.8 |
2.6 |
2.3 |
2.5 |
i. Basic industrial chemicals |
4.1 |
4.0 |
4.2 |
4.1 |
4.2 |
4.3 |
3.8 |
5.8 |
ii. Chemical fertilisers and pesticides |
2.7 |
1.8 |
1.5 |
2.0 |
1.9 |
1.8 |
2.1 |
2.1 |
iii. Paints and varnishes |
0.2 |
0.1 |
0.3 |
0.5 |
0.3 |
0.4 |
0.5 |
0.5 |
iv. Pharmaceuticals and medicines |
2.9 |
2.0 |
1.2 |
4.4 |
1.7 |
4.0 |
3.1 |
2.7 |
v. Other chemical & chemical products |
1.4 |
1.5 |
1.1 |
1.1 |
1.1 |
1.1 |
1.0 |
1.3 |
7. Rubber and plastic products |
2.6 |
3.0 |
2.7 |
3.2 |
2.8 |
3.2 |
2.9 |
3.3 |
8. Cement and cement products |
2.7 |
2.8 |
2.7 |
3.2 |
2.9 |
2.5 |
2.6 |
2.3 |
9. Iron and steel |
4.6 |
4.2 |
4.3 |
4.7 |
4.3 |
4.6 |
4.5 |
5.5 |
10. Fabricated metal products except machinery and equipment |
4.7 |
4.5 |
2.2 |
3.1 |
2.3 |
2.9 |
2.1 |
2.1 |
11. Machinery and machine tools |
1.5 |
1.9 |
0.8 |
1.3 |
0.9 |
1.3 |
1.1 |
1.6 |
12. Electrical machinery and apparatus |
1.4 |
1.8 |
2.2 |
2.8 |
2.3 |
3.0 |
2.2 |
2.6 |
13. Radio, television and communication equipments |
4.2 |
6.4 |
3.0 |
8.4 |
4.7 |
8.0 |
6.3 |
10.9 |
14. Medical precision and other scientific instruments |
-0.2 |
-0.1 |
-0.4 |
-0.3 |
-0.6 |
-0.5 |
1.3 |
1.6 |
15. Motor vehicles and other transport equipments |
1.2 |
1.1 |
1.5 |
1.5 |
1.4 |
1.4 |
1.6 |
1.5 |
16. Jewellery and related articles |
1.5 |
1.3 |
0.9 |
1.0 |
0.8 |
1.6 |
1.2 |
1.3 |
17. Real Estate |
13.6 |
17.2 |
4.2 |
9.2 |
5.2 |
8.4 |
13.1 |
16.0 |
18. Electricity generation and supply |
5.6 |
5.7 |
6.5 |
6.8 |
7.2 |
7.0 |
6.8 |
6.7 |
19. Construction |
5.3 |
6.7 |
7.3 |
8.9 |
6.9 |
8.5 |
5.9 |
7.6 |
20. Wholesale and retail trade |
2.6 |
2.6 |
1.8 |
2.0 |
1.9 |
2.4 |
1.8 |
2.3 |
21.Hotel and restaurant |
9.4 |
9.6 |
10.4 |
11.1 |
8.6 |
11.8 |
8.1 |
12.1 |
22. Transport, storage and communication |
5.8 |
6.1 |
4.4 |
8.0 |
4.1 |
6.6 |
5.0 |
7.3 |
23. Computer and related activities |
1.1 |
1.2 |
0.9 |
1.6 |
1.0 |
1.4 |
1.1 |
1.4 |
24. Petroleum refinery |
1.2 |
0.9 |
1.2 |
1.1 |
1.2 |
1.1 |
1.2 |
1.2 |
All companies + |
2.9 |
2.9 |
2.7 |
3.3 |
2.7 |
3.2 |
2.9 |
3.3 |
+: All companies under study. |
Statement 5: Industry-wise Profitability Ratios in the Quarters of 2011-12 (Contd.) |
(Per cent) |
Industry/Industry group |
Operating Profits to Sales |
Q1 |
Q2 |
Q3 |
Q4 |
2010-11 |
2011-12 |
2010-11 |
2011-12 |
2010-11 |
2011-12 |
2010-11 |
2011-12 |
1 |
2 |
3 |
4 |
5 |
6 |
7 |
8 |
1. Tea plantation |
12.4 |
13.4 |
38.6 |
36.1 |
28.8 |
22.4 |
$ |
$ |
2. Mining and quarrying |
43.1 |
40.4 |
31.2 |
13.3 |
40.3 |
24.6 |
45.6 |
30.0 |
| 3. Food products and beverages |
|
|
|
|
|
|
|
|
Of which |
8.1 |
9.0 |
7.1 |
6.2 |
9.0 |
6.6 |
11.6 |
9.9 |
i. Sugar |
2.3 |
10.0 |
0.0 |
3.5 |
9.4 |
6.0 |
20.0 |
16.4 |
ii. Edible oils |
5.1 |
3.7 |
4.9 |
1.4 |
4.1 |
1.7 |
2.8 |
3.1 |
iii. Other food products & beverages |
14.1 |
13.8 |
13.2 |
12.3 |
12.8 |
11.8 |
13.1 |
12.1 |
4. Textiles |
13.9 |
10.4 |
15.6 |
10.1 |
16.5 |
10.6 |
15.5 |
11.9 |
5. Paper and paper products |
18.2 |
16.6 |
17.5 |
13.1 |
15.7 |
10.1 |
13.5 |
11.4 |
| 6. Chemicals and chemical products |
|
|
|
|
|
|
|
|
Of which |
15.9 |
16.0 |
16.7 |
14.3 |
16.4 |
13.9 |
14.7 |
14.0 |
i. Basic industrial chemicals |
16.4 |
19.1 |
16.8 |
17.0 |
16.7 |
16.0 |
18.8 |
11.9 |
ii. Chemical fertilisers and pesticides |
13.5 |
13.6 |
14.0 |
12.2 |
13.6 |
11.0 |
12.1 |
9.4 |
iii. Paints and varnishes |
16.4 |
14.9 |
15.7 |
12.9 |
13.8 |
13.5 |
12.6 |
11.9 |
iv. Pharmaceuticals and medicines |
19.4 |
20.6 |
21.0 |
16.9 |
21.7 |
16.0 |
17.1 |
19.1 |
v. Other chemical & chemical products |
13.4 |
11.6 |
13.9 |
12.1 |
12.7 |
13.0 |
12.1 |
12.8 |
7. Rubber and plastic products |
11.6 |
9.9 |
14.4 |
8.9 |
15.7 |
9.4 |
12.6 |
11.5 |
8. Cement and cement products |
23.4 |
23.7 |
12.2 |
15.3 |
17.1 |
19.3 |
21.9 |
24.2 |
9. Iron and steel |
22.2 |
19.3 |
17.8 |
14.4 |
18.6 |
13.9 |
19.3 |
16.2 |
10. Fabricated metal products except machinery and equipment |
18.8 |
18.7 |
15.5 |
15.4 |
15.5 |
15.8 |
14.6 |
15.1 |
11. Machinery and machine tools |
12.2 |
10.1 |
13.2 |
10.3 |
13.1 |
10.2 |
11.9 |
9.2 |
12. Electrical machinery and apparatus |
11.4 |
9.4 |
9.9 |
7.8 |
9.5 |
6.7 |
11.4 |
10.1 |
13. Radio, television and communication equipments |
10.1 |
10.4 |
8.8 |
8.7 |
9.4 |
6.8 |
4.8 |
8.7 |
14. Medical precision and other scientific instruments |
10.0 |
9.3 |
12.8 |
8.1 |
13.9 |
6.0 |
12.7 |
8.6 |
15. Motor vehicles and other transport equipments |
12.0 |
11.4 |
12.0 |
9.8 |
11.4 |
9.9 |
11.4 |
11.0 |
16. Jewellery and related articles |
5.4 |
4.3 |
4.6 |
4.7 |
4.7 |
4.6 |
3.2 |
4.3 |
17. Real Estate |
35.8 |
30.5 |
35.8 |
20.1 |
31.3 |
18.0 |
34.5 |
27.2 |
18. Electricity generation and supply |
27.3 |
26.2 |
26.4 |
24.3 |
22.3 |
20.2 |
24.9 |
20.0 |
19. Construction |
13.6 |
13.9 |
15.4 |
15.1 |
16.4 |
13.0 |
12.9 |
11.6 |
20. Wholesale and retail trade |
2.9 |
5.9 |
4.9 |
3.8 |
4.7 |
4.0 |
3.2 |
4.2 |
21. Hotel and restaurant |
20.9 |
21.0 |
16.7 |
16.5 |
32.7 |
26.6 |
32.0 |
22.8 |
22. Transport, storage and communication |
22.1 |
20.5 |
21.7 |
18.4 |
21.2 |
19.1 |
21.5 |
20.2 |
23. Computer and related activities |
22.3 |
21.6 |
22.5 |
21.0 |
23.0 |
22.7 |
23.0 |
22.4 |
24. Petroleum refinery |
14.2 |
11.3 |
14.5 |
10.9 |
14.3 |
7.9 |
12.5 |
6.7 |
All companies + |
16.3 |
15.0 |
15.6 |
13.0 |
16.1 |
12.6 |
15.3 |
13.1 |
$: Previous and/or current amount negative.
+: All companies under study. |
Statement 5: Industry-wise Profitability Ratios in the Quarters of 2011-12 (Concld.) |
(Per cent) |
Industry/Industry group |
Profits after tax to Sales |
Q1 |
Q2 |
Q3 |
Q4 |
2010-11 |
2011-12 |
2010-11 |
2011-12 |
2010-11 |
2011-12 |
2010-11 |
2011-12 |
9 |
10 |
11 |
12 |
13 |
14 |
15 |
16 |
1. Tea plantation |
8.1 |
17.9 |
37.2 |
32.9 |
25.5 |
26.7 |
$ |
$ |
2. Mining and quarrying |
31.5 |
22.8 |
18.1 |
$ |
27.1 |
11.8 |
15.3 |
23.0 |
| 3. Food products and beverages |
|
|
|
|
|
|
|
|
Of which |
2.3 |
2.5 |
1.3 |
1.7 |
3.1 |
0.9 |
5.2 |
4.4 |
i. Sugar |
$ |
$ |
$ |
$ |
0.4 |
$ |
9.2 |
5.9 |
ii. Edible oils |
2.6 |
1.3 |
2.4 |
0.1 |
1.3 |
0.2 |
1.3 |
2.1 |
iii. Other food products & beverages |
7.0 |
6.4 |
6.6 |
7.4 |
6.5 |
6.0 |
5.8 |
5.4 |
4. Textiles |
3.0 |
0.2 |
6.4 |
1.0 |
5.4 |
2.6 |
5.2 |
3.3 |
5. Paper and paper products |
6.4 |
4.1 |
6.0 |
$ |
5.3 |
0.5 |
3.4 |
4.4 |
| 6. Chemicals and chemical products |
|
|
|
|
|
|
|
|
Of which |
9.5 |
10.2 |
10.7 |
9.2 |
10.2 |
3.3 |
9.4 |
9.3 |
i. Basic industrial chemicals |
6.6 |
11.8 |
7.9 |
8.2 |
6.5 |
5.7 |
8.9 |
3.5 |
ii. Chemical fertilisers and pesticides |
7.3 |
7.3 |
7.8 |
6.7 |
7.6 |
5.1 |
7.1 |
5.3 |
iii. Paints and varnishes |
12.0 |
11.1 |
11.0 |
9.2 |
9.6 |
9.3 |
10.2 |
9.3 |
iv. Pharmaceuticals and medicines |
12.5 |
12.9 |
14.9 |
12.3 |
14.3 |
$ |
10.0 |
14.7 |
v. Other chemical & chemical products |
8.6 |
8.3 |
9.8 |
8.6 |
9.1 |
8.5 |
10.3 |
8.5 |
7. Rubber and plastic products |
4.9 |
3.3 |
6.9 |
5.2 |
7.4 |
3.1 |
5.5 |
5.5 |
8. Cement and cement products |
11.3 |
11.5 |
3.0 |
5.0 |
7.2 |
9.9 |
11.6 |
9.2 |
9. Iron and steel |
9.6 |
6.5 |
9.2 |
3.6 |
7.5 |
4.0 |
9.2 |
6.4 |
10. Fabricated metal products except machinery and equipment |
7.1 |
3.8 |
7.6 |
7.4 |
7.6 |
7.2 |
7.8 |
6.5 |
11. Machinery and machine tools |
7.0 |
5.3 |
9.0 |
6.3 |
8.7 |
5.4 |
8.1 |
6.3 |
12. Electrical machinery and apparatus |
5.9 |
4.9 |
7.2 |
3.0 |
4.7 |
1.8 |
7.6 |
3.7 |
13. Radio, television and communication equipments |
5.9 |
1.0 |
4.2 |
$ |
3.3 |
$ |
6.0 |
$ |
14. Medical precision and other scientific instruments |
6.7 |
6.3 |
8.1 |
4.8 |
8.7 |
3.4 |
8.7 |
4.1 |
15. Motor vehicles and other transport equipments |
6.9 |
6.7 |
6.8 |
5.1 |
6.3 |
4.9 |
8.1 |
7.9 |
16. Jewellery and related articles |
3.6 |
2.6 |
3.5 |
3.0 |
3.2 |
2.4 |
2.1 |
2.8 |
17. Real Estate |
22.7 |
16.2 |
25.7 |
11.0 |
23.2 |
7.5 |
16.3 |
12.2 |
18. Electricity generation and supply |
16.0 |
12.8 |
13.3 |
12.4 |
9.7 |
9.5 |
17.9 |
12.5 |
19. Construction |
6.1 |
3.8 |
5.5 |
4.0 |
6.2 |
3.7 |
7.1 |
3.0 |
20. Wholesale and retail trade |
0.3 |
3.3 |
3.4 |
1.5 |
2.1 |
1.3 |
2.5 |
2.8 |
21. Hotel and restaurant |
3.3 |
4.2 |
1.1 |
$ |
12.3 |
4.1 |
16.5 |
20.3 |
22. Transport, storage and communication |
9.6 |
3.9 |
7.4 |
0.5 |
7.0 |
3.6 |
7.7 |
3.1 |
23. Computer and related activities |
16.9 |
16.9 |
17.2 |
17.7 |
18.4 |
17.5 |
17.7 |
17.9 |
24. Petroleum refinery |
7.1 |
6.5 |
7.5 |
6.1 |
7.5 |
0.6 |
6.7 |
3.7 |
All companies + |
8.6 |
7.5 |
8.6 |
6.1 |
8.5 |
4.8 |
8.6 |
6.9 |
$: Previous and/or current amount negative.
+: All companies under study. |
Statement 6: Performance of the Select Companies in the Quarters of 2011-12 |
Item |
2010-11 |
2011-12 |
Q1 |
Q2 |
Q3 |
Q4 |
Q1 |
Q2 |
Q3 |
Q4 |
No. of companies |
2,546 |
2,586 |
2,643 |
2,632 |
2,615 |
2,627 |
2,637 |
2,597 |
Y-o-Y Growth in Per cent |
Sales |
24.2 |
18.7 |
17.6 |
20.7 |
22.5 |
19.0 |
19.2 |
15.0 |
Expenditure |
29.0 |
19.9 |
19.6 |
23.2 |
23.0 |
22.4 |
24.7 |
16.1 |
Operating Profits |
14.8 |
7.8 |
11.3 |
15.5 |
12.1 |
-1.0 |
-5.9 |
-1.8 |
Other Income |
-21.2 |
58.5 |
14.7 |
-22.2 |
39.4 |
25.8 |
66.1 |
47.2 |
Depreciation |
19.9 |
16.8 |
13.6 |
13.7 |
9.5 |
9.7 |
10.5 |
11.1 |
Gross Profits |
8.2 |
10.3 |
11.0 |
9.6 |
15.7 |
-0.3 |
-2.8 |
2.1 |
Interest |
26.9 |
5.9 |
22.4 |
31.1 |
21.6 |
47.1 |
42.6 |
34.8 |
Profits after tax |
2.4 |
10.8 |
10.3 |
10.2 |
5.7 |
-14.8 |
-31.3 |
-7.2 |
Ratios in Per cent |
Operating profits to Sales |
16.4 |
15.5 |
15.9 |
15.0 |
14.8 |
12.8 |
12.5 |
13.0 |
Gross profits to Sales |
13.9 |
13.6 |
13.6 |
13.1 |
13.0 |
11.4 |
11.0 |
12.2 |
Profits after tax to Sales |
8.6 |
8.5 |
8.3 |
8.3 |
7.4 |
6.1 |
4.8 |
6.8 |
Interest to Sales |
2.9 |
2.7 |
2.8 |
2.5 |
2.8 |
3.3 |
3.2 |
3.4 |
Interest to Gross profits |
21.1 |
19.9 |
20.6 |
19.4 |
22.0 |
28.8 |
28.9 |
27.7 |
Interest Coverage (Number) |
4.7 |
5.0 |
4.9 |
5.1 |
4.6 |
3.5 |
3.5 |
3.6 |
Amount in ` billion |
Sales |
4,863 |
5,232 |
5,609 |
6,362 |
6,263 |
6,436 |
6,728 |
7,149 |
Change in stock |
119 |
46 |
69 |
113 |
70 |
36 |
122 |
65 |
Expenditure |
4184 |
4466 |
4784 |
5523 |
5406 |
5646 |
6011 |
6282 |
Operating Profits |
798 |
812 |
894 |
952 |
928 |
827 |
838 |
931 |
Other Income |
72 |
99 |
76 |
99 |
102 |
127 |
132 |
186 |
Depreciation |
194 |
198 |
207 |
221 |
218 |
222 |
227 |
246 |
Gross Profits |
676 |
713 |
763 |
831 |
812 |
732 |
743 |
872 |
Interest |
143 |
142 |
157 |
161 |
178 |
211 |
215 |
241 |
Profits after tax |
420 |
446 |
467 |
531 |
463 |
393 |
325 |
488 |
|


