
V. Financial Markets - ربی - Reserve Bank of India


V. Financial Markets
During the third quarter (October-December) of 2005-06, international financial market conditions generally continued to remain favourable. Equity markets remained buoyant on expectations of improved growth prospects, notwithstanding some increase in long-term rates in major economies. Short-term interest rates moved up in a number of economies as monetary policy was further tightened due to firming up of inflationary pressures emanating from higher energy prices. Consequently, long-term yields edged higher during the quarter ended December 2005 as investors revised upwards their expectations regarding future policy rates. Financing conditions in emerging market economies (EMEs) also remained favourable reflecting improved economic fundamentals.
Short-term rates increased by 35 basis points in the Euro area and by 60 basis points in the US between end-September 2005 and January 11, 2006. Amongst EMEs, short-term rates increased by more than 50 basis points in Argentina, India, Singapore and Thailand. The US Federal Reserve raised Federal Funds target rate by 25 basis points for the 13th consecutive time to 4.25 per cent on December 13, 2005. The European Central Bank (ECB) also hiked its key policy rate by 25 basis points to 2.25 per cent on December 1, 2005 after having held it unchanged since June 6, 2003 (Table 30).
| Table 30: Short-term Interest Rates |
||||||
| (Per cent) |
||||||
| Country |
March 2004 |
March |
2005 |
June 2005 |
September 2005 |
January 2006# |
| 1 |
2 |
3 |
4 |
5 |
6 |
|
| Advanced Economies |
||||||
| Euro Area |
1.96 |
2.15 |
2.10 |
2.15 |
2.50 |
|
| Japan |
0.03 |
0.02 |
0.02 |
0.02 |
0.03 |
|
| Sweden |
2.12 |
1.97 |
1.48 |
1.46 |
1.84 |
|
| UK |
4.31 |
4.95 |
4.75 |
4.56 |
4.56 |
|
| US |
1.04 |
2.90 |
3.33 |
3.85 |
4.45 |
|
| Emerging Market Economies |
||||||
| Argentina |
2.88 |
4.56 |
6.94 |
6.69 |
8.88 |
|
| Brazil |
16.02 |
19.25 |
19.74 |
19.51 |
17.95 |
|
| China |
N.A. |
2.25 |
2.30 |
4.38 |
2.18 |
|
| Hong Kong |
0.17 |
2.79 |
3.36 |
4.12 |
4.08 |
|
| India |
4.24 |
5.37 |
5.37 |
5.49 |
6.19 |
|
| Malaysia |
3.00 |
2.82 |
2.87 |
2.92 |
3.25 |
|
| Philippines |
9.19 |
7.25 |
5.88 |
8.13 |
6.75 |
|
| Singapore |
0.69 |
2.06 |
2.06 |
2.34 |
3.28 |
|
| South Korea |
3.90 |
3.54 |
3.52 |
3.94 |
4.17 |
|
| Thailand |
1.31 |
2.64 |
2.75 |
3.90 |
4.50 |
|
| N.A. : Not available .# : As on January 11, 2006. |
||||||
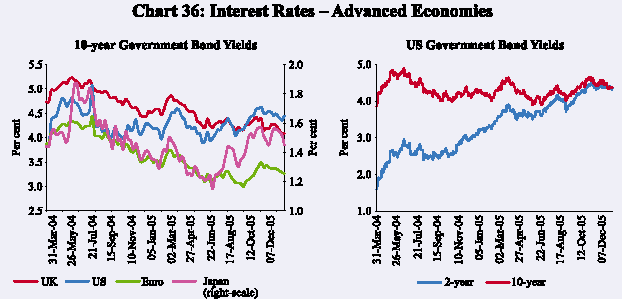
Long-term Government bond yields increased during October 2005 reversing the softening trend during the first half of the year. Yields had initially declined during April-June 2005 on expectations that monetary authorities could slow down policy tightening due to fragility in the economic recovery. Structural factors such as increased demand for fixed income products from pension funds and insurance companies in response to regulatory changes also provided support to long-term gilts. The US 10-year Treasury yield was at a 14-month low at 3.8 per cent in early-June 2005. During July 2005, yields, however, firmed up in the run up to the widely anticipated revaluation of the Chinese currency on July 21, 2005. With the Chinese authorities continuing to manage the renminbi tightly, the yields reversed their increasing trend. Long-term Government bond yields increased during October 2005 in the US and Euro area in tandem with sharp rise in headline inflation and higher short-term rates which increased expectations regarding future policy rates. In December 2005, 10-year yields eased again. Yield on 10-year US treasuries briefly fell below that on two-year treasuries in end-December 2005 for the first time in the past five years (Chart 36). In the Euro area and Japan, the increase in long-term yields was also on account of improved economic outlook. In the UK, the yields remained almost range-bound reflecting weak growth prospects.
Equity markets in many economies continued to exhibit buoyancy during the third quarter of 2005-06, notwithstanding some increase in long-term interest rates. In the wake of sharp increase in inflation during September 2005 and the prospects of faster pace of monetary tightening, equity prices declined in October 2005 around the world. Equity markets, however, bounced back in November 2005 on signs of robust economic activity in the US. Equity markets were also buoyed by some moderation in international crude oil prices from their record
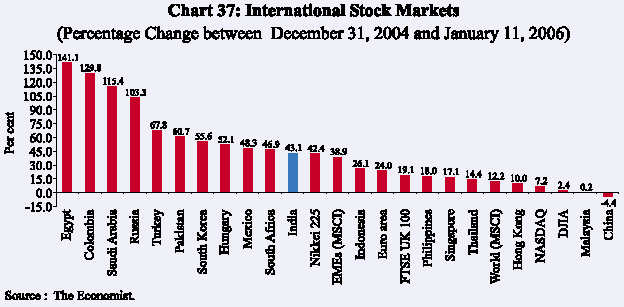
highs. During 2005, stock markets in India outperformed major Asian markets (Chart 37). Stock markets in some emerging markets outside Asia yielded even higher returns led by Egypt (141.1 per cent since end-December 2004) followed by Colombia, Saudi Arabia, Russia and Turkey. Equity markets in the US, however, under-performed significantly as equities struggled to cope with the impact of higher US interest rates and increasing activity by US investors in overseas markets. Equity markets in the Euro area registered relatively better returns reflecting improved economic outlook.
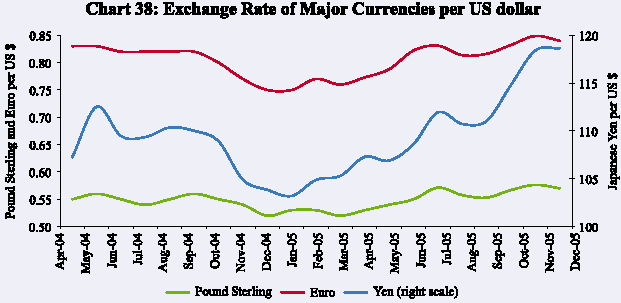
Notwithstanding the growing current account deficit, the US dollar appreciated further against major currencies during the third quarter of 2005-06 (2.6 per cent against the Euro, 2.1 per cent against the Pound Sterling and 4.3 per cent against the Yen), reflecting growing interest and growth differential in favour of the US (Chart 38). The US dollar also benefited from a year-long tax break designed to encourage US multinationals to repatriate cash held overseas. The US dollar, however, has depreciated since mid-December 2005 on anticipation that the monetary tightening in the US might be nearing its end.
Indian financial markets have remained broadly stable during 2005-06 so far. During the quarter, the redemption of India Millennium Deposits (IMDs) (December 29, 2005) took place smoothly although the markets witnessed some liquidity pressures during November-December 2005. The Reserve Bank put in place arrangements for redemption of IMDs in close co-ordination with the State Bank of India (SBI). Appropriate preparations and arrangements were made to ensure that the redemption is done smoothly, in time and without causing any impact on the money, Government securities and foreign exchange markets.
Comfortable liquidity kept money market segments generally around the reverse repo rate during April-October 2005. During most part of November-December 2005, however, the call money rate remained above the reverse repo rate reflecting some liquidity pressures. The foreign exchange market remained more or less orderly. Yields in the Government securities market which had hardened in April 2005 reflecting higher crude oil prices and increase in the reverse repo rate have largely remained range bound since then. In the credit market, deposit and lending rates edged up during the quarter ended December 2005. The primary market segment of the equity market gathered momentum with increase in both the number of issues and the resources raised on the back of a buoyant secondary market and strong macroeconomic fundamentals. The secondary market staged a strong rally which pushed the BSE Sensex to new highs crossing 9000 in December 2005 (Table 31).
Money Market
Money markets during 2005-06 till October 2005 were largely marked by comfortable liquidity conditions stemming from the overhang in the system -outstanding Liquidity Adjustment Facility (LAF) and Market Stabilisation Scheme (MSS) balances at end-March 2005 stood at Rs. 83,541 crore. Despite capital outflows in April 2005, the Reserve Bank had to supplement reverse repo operations with sale of Government paper under the MSS to absorb liquidity and balance market conditions. Average daily call money borrowing rates ruled at sub-reverse repo rate levels on many occasions. With the increase in the fixed reverse repo rate by 25 basis points on April 29, 2005, call rates also edged up by a similar magnitude. Towards the end of June 2005, call rates rose above the
| Table 31: Domestic Financial Markets at a Glance |
|||||||||||||||||
| Month |
Call Money |
Govt. Securities |
Foreign Exchange |
Liquidity |
Equity |
||||||||||||
| Management |
|||||||||||||||||
| Average |
Average |
Average |
Average |
Average |
Average |
RBI’s net |
Average |
Average |
Average |
Average |
Average |
Average |
Average |
||||
| Daily |
Call |
10-Year |
Daily |
Daily |
Exchange |
Foreign |
Forward |
MSS |
Daily |
Daily |
Daily |
BSE |
S&P |
||||
| Turnover |
Rates* |
Yield@ |
Turnover |
Inter- |
Rate |
Currency |
Premia |
Out- |
Reverse |
BSE |
NSE |
Sensex** |
CNX |
||||
| (Rs. |
(Per |
(Per |
(Rs. |
bank |
(Rs. per |
Sales(-)/ |
3-month |
standing# |
Repo |
Turnover |
Turnover |
Nifty** |
|||||
| crore) |
cent) |
cent) |
crore)+ |
Turnover |
US $) |
Purchases |
(Per |
(Rs. |
(LAF) |
(Rs. |
(Rs. |
||||||
| (US $ |
(+) |
cent) |
crore) |
Out- |
crore) |
crore) |
|||||||||||
| million) |
(US $ |
standing |
|||||||||||||||
| million) |
(Rs. |
||||||||||||||||
| crore) |
|||||||||||||||||
| 1 |
2 |
3 |
4 |
5 |
6 |
7 |
8 |
9 |
10 |
11 |
12 |
13 |
14 |
15 |
|||
| 2004-05 |
|||||||||||||||||
| April |
12,916 |
4.29 |
5.10 |
10,029 |
10,302 |
43.93 |
7,427 |
- 0.35 |
14,296 |
75,006 |
2,243 |
5,048 |
5809 |
1848 |
|||
| May |
10,988 |
4.30 |
5.19 |
6,202 |
8,882 |
45.25 |
-220 |
-1.33 |
27,518 |
74,502 |
2,188 |
4,710 |
5205 |
1640 |
|||
| June |
10,974 |
4.35 |
5.50 |
5,860 |
7,847 |
45.51 |
-413 |
0.93 |
35,283 |
61,981 |
1,681 |
3,859 |
4824 |
1506 |
|||
| July |
8,632 |
4.31 |
5.91 |
4,206 |
7,756 |
46.04 |
-1,180 |
2.25 |
43,739 |
59,594 |
1,793 |
4,265 |
4973 |
1568 |
|||
| August |
11,562 |
4.41 |
6.38 |
4,173 |
5,947 |
46.34 |
-876 |
2.85 |
48,541 |
42,692 |
1,736 |
3,948 |
5144 |
1615 |
|||
| September |
17,088 |
4.45 |
6.08 |
5,854 |
7,348 |
46.09 |
19 |
2.20 |
52,421 |
31,589 |
1,800 |
4,023 |
5423 |
1692 |
|||
| October |
16,666 |
4.63 |
6.73 |
3,636 |
7,262 |
45.78 |
-99 |
2.87 |
53,660 |
10,805 |
1,730 |
3,785 |
5702 |
1795 |
|||
| November |
13,820 |
5.62 |
7.14 |
2,607 |
9,930 |
45.13 |
3,792 |
2.20 |
54,157 |
-5,066 |
1,787 |
4,102 |
5961 |
1874 |
|||
| December |
19,526 |
5.28 |
6.73 |
4,305 |
9,447 |
43.98 |
1,393 |
2.02 |
52,085 |
7,570 |
2,184 |
5,026 |
6394 |
2022 |
|||
| January |
16,534 |
4.72 |
6.68 |
3,566 |
9,114 |
43.75 |
0 |
2.50 |
53,790 |
18,721 |
2,310 |
5,249 |
6307 |
1978 |
|||
| February |
16,041 |
4.76 |
6.58 |
4,640 |
11,583 |
43.68 |
4,974 |
1.99 |
58,141 |
19,895 |
2,484 |
4,999 |
6595 |
2067 |
|||
| March |
15,294 |
4.72 |
6.65 |
2,835 |
11,286 |
43.69 |
6,030 |
1.82 |
63,737 |
29,809 |
2,706 |
5,139 |
6679 |
2096 |
|||
| 2005-06 |
|||||||||||||||||
| April |
17,213 |
4.77 |
7.02 |
3,001 |
9,880 |
43.74 |
0 |
1.96 |
65,638 |
30,675 |
1,890 |
4,136 |
6379 |
1987 |
|||
| May |
15,269 |
4.99 |
7.13 |
3,805 |
10,083 |
43.49 |
0 |
1.57 |
68,539 |
22,754 |
1,971 |
3,946 |
6483 |
2002 |
|||
| June |
20,134 |
5.10 |
6.88 |
6,807 |
10,871 |
43.58 |
-104 |
1.40 |
70,651 |
13,916 |
2,543 |
4,843 |
6926 |
2134 |
|||
| July |
20,046 |
5.02 |
7.12 |
3,698 |
10,812 P |
43.54 |
2,473 |
1.56 |
70,758 |
10,754 |
3,095 |
6,150 |
7337 |
2237 |
|||
| August |
16,158 |
5.02 |
7.04 |
4,239 |
11,462 P |
43.62 |
1,552 |
0.69 |
71,346 |
34,832 |
3,452 |
6,624 |
7726 |
2358 |
|||
| September |
16,292 |
5.05 |
7.04 |
5,207 |
9,750 P |
43.92 |
0 |
0.62 |
67,617 |
31,570 |
3,871 |
6,923 |
8272 |
2512 |
|||
| October |
17,164 |
5.12 |
7.14 |
2,815 |
10,802 P |
44.82 |
0 |
0.69 |
68,602 |
18,608 |
2,955 |
6,040 |
8220 |
2487 |
|||
| November |
22,620 |
5.79 |
7.10 |
3,314 |
11,001 P |
45.73 |
0 |
0.67 |
67,041 |
3,268 |
2,635 |
5,480 |
8552 |
2575 |
|||
| December |
21,149 |
6.00 |
7.13 |
2,948 |
13,632 P |
45.64 |
N.A. |
1.51 |
52,040 |
1,452 |
3,516 |
6,814 |
9162 |
2773 |
|||
| *:Average of daily weighted call money borrowing rates. |
|||||||||||||||||
reverse repo rate under liquidity pressures – average balances under LAF reverse repos fell from Rs 22,754 crore during May 2005 to Rs. 13,916 crore during June 2005 – emanating from advance tax payments and scheduled Treasury Bills auctions. Liquidity conditions improved by the second half of July 2005 due to cancellation of some scheduled Treasury Bills auctions and increase in Government spending. Large foreign currency purchases from the authorised dealers during July-August 2005 also improved liquidity conditions and this was reflected in a jump in average balances under LAF reverse repos from Rs. 10,754 crore in July to Rs. 34,832 crore in August 2005. The call money market, thus, remained broadly stable during August 2005 and first half of September 2005. During the second half of September 2005 the call money market witnessed mild pressure, reflecting advance tax outflows and scheduled auctions. For the most part of October 2005, the call money rate hovered around the reverse repo rate as liquidity conditions remained easy (Chart 39).
During November 2005, the call money rate remained generally above the reverse repo rate and also exceeded the repo rate on a few occasions reflecting
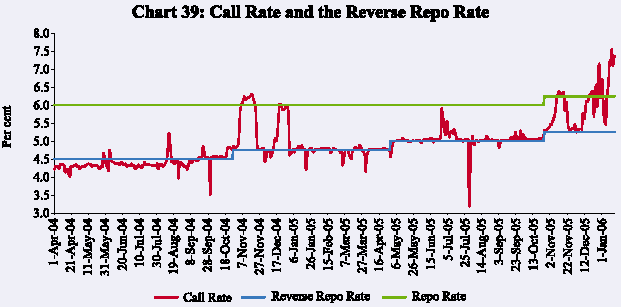
liquidity pressures emanating from sustained credit demand, festival demand for currency and scheduled auctions (Chart 40). The Reserve Bank, therefore, injected liquidity into the system through LAF repos on seven occasions during the month. Concomitantly, the notified amount of Treasury Bills auctions under the MSS was also cancelled. The call money rate subsequently hovered around the reverse repo rate. To fine-tune the management of liquidity and in response to suggestions from the market participants, the Reserve Bank introduced a Second Liquidity Adjustment Facility (SLAF), with effect from November 28, 2005. Beginning the second half of December 2005, call money rate again edged up as the market witnessed large liquidity pressures emanating from credit offtake and
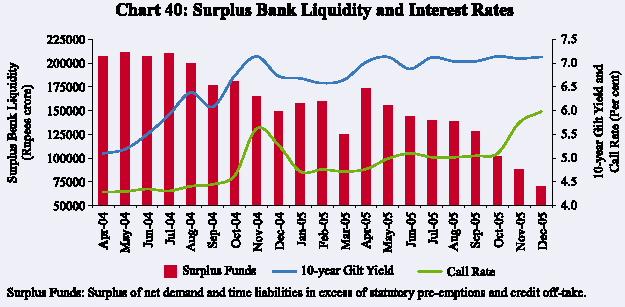
quarter-end advance tax payments amidst uncertainty relating to the redemption of the IMDs. The call money rate eased during the first week of January 2006 with the smooth redemption of IMDs and reduction in the Centre’s surplus balances. The call money rate, however, increased during the second week of January 2006 reflecting demand pressures emanating from scheduled auctions of Government securities.
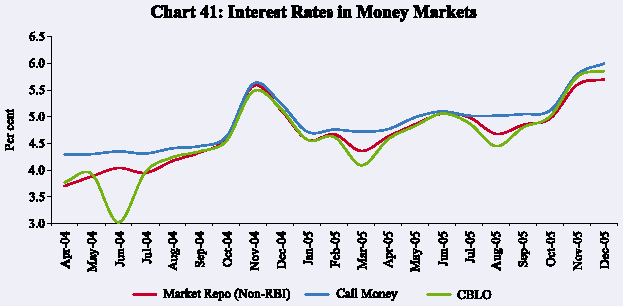
The turnover in the collateralised segments of the money market – the market repo (outside the LAF) and the Collateralised Borrowing and Lending Obligation (CBLO) segments which provide funds at a lower cost – continued to expand during the quarter ended December 2005. Interest rates in the various segments edged up during the third quarter reflecting liquidity conditions (Chart 41). The supply of funds in the CBLO segment has been augmented by the participation of mutual funds and financial institutions. Members operating in the CBLO segment of the Clearing Corporation of India Limited (CCIL) have increased from 110 in March 2005 to 141 in December 2005. On the other hand, the turnover in the call/notice money market during 2005-06 so far has been range bound reflecting the process of phasing out of non-bank participants from the call money market, which was completed on August 6, 2005 (Table 32). The increase in turnover during June-July 2005 and November-December 2005 reflected increased recourse to call money market due to liquidity pressures.
Other Money Market Instruments
Issuances under commercial paper (CP) which had exhibited increases till mid-September 2005 witnessed some moderation in the quarter ended December 2005 reflecting tight liquidity conditions. Accordingly, outstanding
| Table 32: Activity in Money Market Segments |
|||||||
| (Rupees crore) |
|||||||
| Average Daily Turnover |
Outstanding Amount |
Forward Rate |
|||||
| Agreements/ |
|||||||
| Month |
Call Money |
Term Money |
Repo Market |
Collateralised |
Commercial |
Certificates |
Interest Rate |
| Market |
Market |
(Outside the |
Borrowing and |
Paper |
of Deposit |
Swaps |
|
| LAF) |
Lending |
(Notional |
|||||
| Obligation |
Amount) |
||||||
| (CBLO) |
|||||||
| 1 |
2 |
3 |
4 |
5 |
6 |
7 |
8 |
| 2004-05 |
|||||||
| April |
12,916 |
325 |
15,195 |
2,496 |
10,362 |
4,725 |
5,76,808 |
| May |
10,988 |
372 |
15,932 |
3,872 |
11,038 |
4,860 |
6,11,595 |
| June |
10,974 |
274 |
17,517 |
4,015 |
10,950 |
5,438 |
6,04,669 |
| July |
8,632 |
445 |
19,226 |
4,508 |
11,038 |
5,478 |
5,90,118 |
| August |
11,562 |
311 |
13,561 |
4,962 |
11,002 |
4,480 |
6,40,173 |
| September |
17,088 |
487 |
18,178 |
6,149 |
11,371 |
5,112 |
8,53,195 |
| October |
16,666 |
539 |
15,719 |
8,466 |
10,409 |
4,785 |
9,25,175 |
| November |
13,820 |
407 |
18,560 |
9,651 |
10,719 |
6,118 |
9,50,151 |
| December |
19,526 |
504 |
21,922 |
9,962 |
13,272 |
6,103 |
9,75,135 |
| January |
16,534 |
514 |
17,556 |
7,701 |
13,092 |
4,236 |
10,14,442 |
| February |
16,041 |
878 |
17,562 |
8,952 |
13,189 |
9,214 |
9,46,293 |
| March |
15,294 |
1,253 |
14,688 |
9,626 |
14,235 |
12,078 |
10,62,242 |
| 2005-06 |
|||||||
| April |
17,213 |
661 |
12,174 |
10,370 |
15,598 |
16,602 |
10,76,513 |
| May |
15,269 |
545 |
13,688 |
12,233 |
17,182 |
17,689 |
10,72,684 |
| June |
20,134 |
534 |
17,163 |
11,792 |
17,797 |
19,270 |
10,93,367 |
| July |
20,046 |
717 |
18,103 |
15,292 |
18,607 |
20,768 |
12,18,072 |
| August |
16,158 |
754 |
21,325 |
14,544 |
19,508 |
23,568 |
13,15,084 |
| September |
16,292 |
1,116 |
18,872 |
17,143 |
19,725 |
27,641 |
13,17,829 |
| October |
17,164 |
734 |
20,980 |
21,763 |
18,723 |
29,193 |
13,42,335# |
| November |
22,620 |
917 |
25,660 |
20,496 |
18,013 |
27,457 |
N.A. |
| December |
21,149 |
775 |
25,574 |
21,265 |
17,180 |
30,445* |
N.A. |
| *: As on December 9, 2005. #: As on October 14, 2005. N.A. : Not available. |
|||||||
CPs after increasing from Rs.14,235 crore at end-March 2005 to Rs. 20,019 crore by mid-September 2005 fell to Rs.17,180 crore by end-December 2005 (Chart 42).
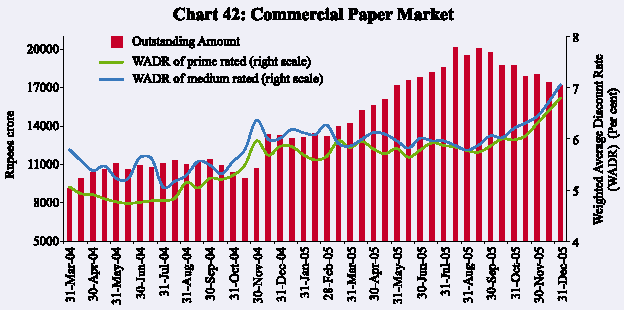
Concomitantly, the weighted average discount rate (WADR) on CPs increased to 6.81 per cent on December 31, 2005 from 5.81 per cent on March 31, 2005. Leasing and finance companies continue to be the largest issuers of CPs – a share of 65.1 per cent in amount outstanding as on December 31, 2005 – partly reflecting the policy of phasing out the access of these companies to public deposits. Manufacturing and other companies and financial institutions are the other issuers with shares of 29.8 per cent and 5.1 per cent, respectively, as on December 31, 2005.
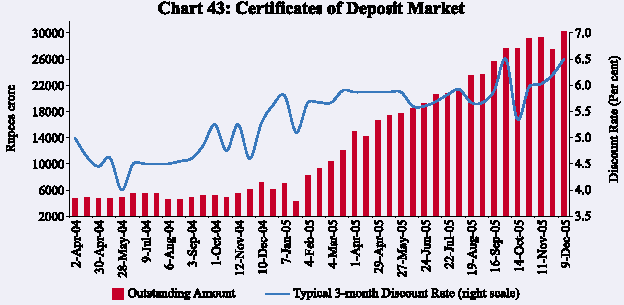
The market for certificates of deposit (CDs) has remained buoyant during the year so far, reflecting their cost attractiveness to banks vis-à-vis time deposits as well as banks’ demand for funds in the wake of the acceleration in demand for bank credit. The amount of CDs outstanding doubled from Rs.14,975 crore in early April 2005 to Rs.30,445 crore by December 9, 2005 mainly on account of higher issuances by some private sector banks. The higher recourse to CDs was also driven by the reduction in the minimum maturity period to seven days. Outstanding CDs were 3.0 per cent of aggregate deposits of issuing banks as on December 9, 2005, up from 2.0 per cent a year ago. The typical three-month discount rate on CDs at 6.50 per cent on December 9, 2005 was higher by about 60 basis points over its level at end-March 2005 (Chart 43). As in the case of CPs, mutual funds have emerged as key investors in CDs.
Amongst other money market segments, the market for forward rate agreements and interest rate swaps (FRAs/IRS) continued to expand with the participation of select public sector banks, primary dealers (PDs) and foreign and private sector banks (see Table 32).
| Table 33: Treasury Bills in the Primary Market |
|||||||
| Month |
Notified Amount |
Average Implicit Yield at Minimum |
Bid-Cover Ratio |
||||
| (Rs. crore) |
Cut-off Price (Per cent) |
||||||
| 91-day |
182-day |
364-day |
91-day |
182-day |
364-day |
||
| 1 |
2 |
3 |
4 |
5 |
6 |
7 |
8 |
| 2004-05 |
|||||||
| April |
13,500 |
4.38 |
4.44 |
2.15 |
2.47 |
||
| May |
12,000 |
4.39 |
4.33 |
2.93 |
2.46 |
||
| June |
14,000 |
4.44 |
4.55 |
2.61 |
1.28 |
||
| July |
10,000 |
4.46 |
4.60 |
2.39 |
2.06 |
||
| August |
10,000 |
4.76 |
5.00 |
1.81 |
3.36 |
||
| September |
12,000 |
4.72 |
5.14 |
2.51 |
2.83 |
||
| October |
16,000 |
5.15 |
5.46 |
1.82 |
2.75 |
||
| November |
5,500 |
5.47 |
5.71 |
2.80 |
2.64 |
||
| December |
9,500 |
5.30 |
5.69 |
2.69 |
2.81 |
||
| January |
12,000 |
5.31 |
5.69 |
2.19 |
2.06 |
||
| February |
12,000 |
5.25 |
5.65 |
2.99 |
2.81 |
||
| March |
12,000 |
5.24 |
5.63 |
2.31 |
2.74 |
||
| 2005-06 |
|||||||
| April |
19,000 |
5.17 |
5.36 |
5.62 |
4.03 |
4.48 |
2.54 |
| May |
15,000 |
5.19 |
5.35 |
5.58 |
3.30 |
3.37 |
2.29 |
| June |
18,000 |
5.29 |
5.37 |
5.61 |
1.54 |
2.42 |
1.81 |
| July |
11,500 |
5.46 |
5.67 |
5.81 |
1.21 |
2.58 |
1.68 |
| August |
21,000 |
5.23 |
5.42 |
5.63 |
3.07 |
2.68 |
2.54 |
| September |
23,000 |
5.24 |
5.37 |
5.70 |
1.52 |
1.45 |
1.61 |
| October |
15,000 |
5.50 |
5.71 |
5.84 |
1.69 |
1.53 |
3.44 |
| November |
11,000 |
5.76 |
5.87 |
5.96 |
2.12 |
1.97 |
2.30 |
| December |
5,000 |
5.89 |
6.04 |
6.09 |
3.07 |
2.97 |
2.36 |
| Note: 182-day TBs were reintroduced with effect from April 2005. |
|||||||
Treasury Bills
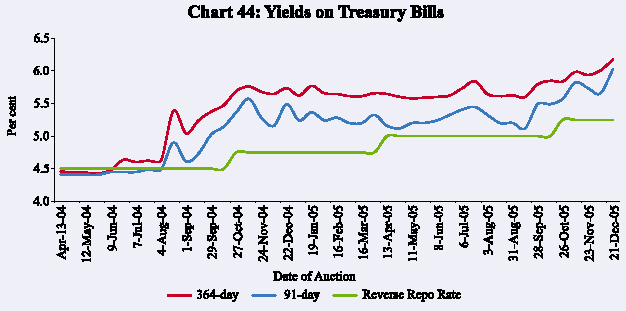
Yields in Treasury Bill (TB) auctions increased during October-December 2005, reflecting tight liquidity conditions (Table 33). In view of liquidity conditions, the Reserve Bank rejected all the bids for the TB auctions under the MSS scheduled on November 9, 2005 and reduced the notified amount in subsequent auctions by discontinuing absorption under the MSS, effective November 16, 2005. Yields in December 2005 were 39-67 basis points higher over their September 2005 levels and 46-68 basis points higher over their March 2005 levels. The average yield spread between the 91-day and 364-day TBs at 20 basis points in December 2005 was lower than the March 2005 level (39 basis points) (Chart 44).
Foreign Exchange Market
In the foreign exchange market, the Indian rupee exhibited two-way movements vis-à-vis the US dollar during the third quarter of 2005-06: depreciation during October to mid-December 2005 and appreciation since then. On the whole, the rupee depreciated by 2.4 per cent vis-à-vis the dollar during
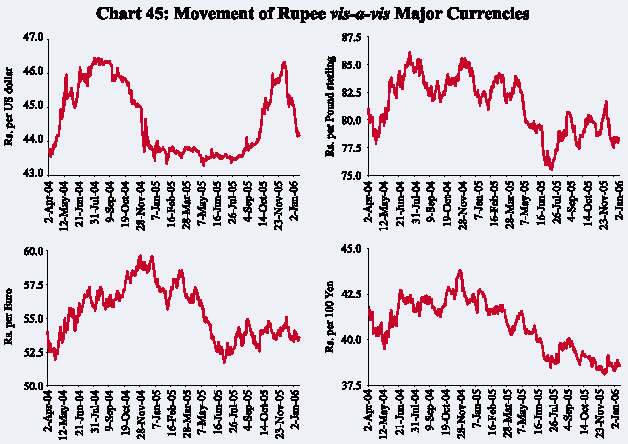
the third quarter of 2005-06. The rupee has moved in a range of Rs.43.30–46.33 per US dollar during 2005-06 so far (up to January 18, 2006). The rupee initially appreciated against the US dollar from Rs.43.76 at end-March 2005 to Rs.43.30 per US dollar on May 12, 2005, despite outflows by FIIs and a higher merchandise trade deficit. Subsequently, the rupee depreciated, reaching Rs.43.76 per US dollar on June 2, 2005 due to strengthening of the US dollar in the international markets. With the revaluation of the Chinese renminbi on July 21, 2005, there were appreciation pressures and the rupee stood at Rs.43.56 per US dollar on August 18, 2005. The Reserve Bank made net market purchases of US $ 4.0 billion during July-August 2005. The rupee again came under pressure in the last week of August 2005 and reached Rs.44.12 per US dollar on September 1, 2005, under the impact of oil prices touching a peak of US $ 70.8 per barrel. The rupee faced further pressure in the first week of October 2005 in the face of sharp increase in the current account deficit and strong US dollar. The pressures continued till the first half of December 2005 and the rupee reached Rs.46.33 per US dollar on December 8, 2005. With the revival of FII inflows and weakening of the US dollar in the international markets, the rupee strengthened in the second half of December 2005. The exchange rate stood at Rs.44.48 per US dollar on January 18, 2006. At this level, the Indian rupee has depreciated by 1.6 per cent over its level on March 31, 2005. Reflecting cross-currency movements, the rupee has, however, appreciated against the other major international currencies since end-March 2005: the Euro (5.2 per cent), the Pound sterling (4.8 per cent) and the Japanese yen (6.1 per cent) (Chart 45).
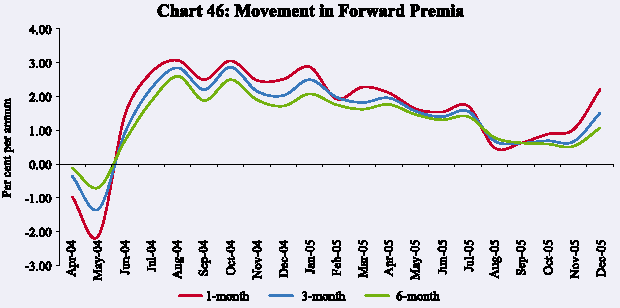
Forward premia increased during December 2005 reflecting higher domestic call money rates. Premia had declined during the first half of 2005-06 in tandem with narrowing interest differential following the hikes in the US interest rates (Chart 46).
the third quarter of 2005-06. The rupee has moved in a range of Rs.43.30–46.33 per US dollar during 2005-06 so far (up to January 18, 2006). The rupee initially appreciated against the US dollar from Rs.43.76 at end-March 2005 to Rs.43.30 per US dollar on May 12, 2005, despite outflows by FIIs and a higher merchandise trade deficit. Subsequently, the rupee depreciated, reaching Rs.43.76 per US dollar on June 2, 2005 due to strengthening of the US dollar in the international markets. With the revaluation of the Chinese renminbi on July 21, 2005, there were appreciation pressures and the rupee stood at Rs.43.56 per US dollar on August 18, 2005. The Reserve Bank made net market purchases of US $ 4.0 billion during July-August 2005. The rupee again came under pressure in the last week of August 2005 and reached Rs.44.12 per US dollar on September 1, 2005, under the impact of oil prices touching a peak of US $ 70.8 per barrel. The rupee faced further pressure in the first week of October 2005 in the face of sharp increase in the current account deficit and strong US dollar. The pressures continued till the first half of December 2005 and the rupee reached Rs.46.33 per US dollar on December 8, 2005. With the revival of FII inflows and weakening of the US dollar in the international markets, the rupee strengthened in the second half of December 2005. The exchange rate stood at Rs.44.48 per US dollar on January 18, 2006. At this level, the Indian rupee has depreciated by 1.6 per cent over its level on March 31, 2005. Reflecting cross-currency movements, the rupee has, however, appreciated against the other major international currencies since end-March 2005: the Euro (5.2 per cent), the Pound sterling (4.8 per cent) and the Japanese yen (6.1 per cent) (Chart 45).
Forward premia increased during December 2005 reflecting higher domestic call money rates. Premia had declined during the first half of 2005-06 in tandem with narrowing interest differential following the hikes in the US interest rates (Chart 46).
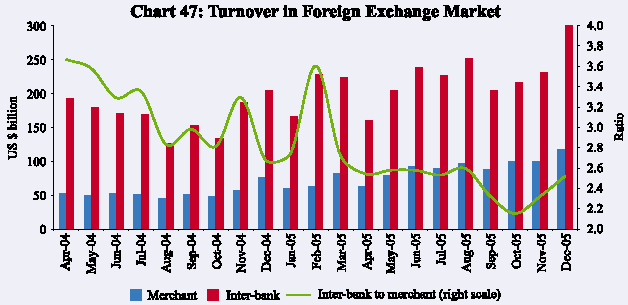
The turnover in the foreign exchange market (both merchant and inter-bank) increased during the quarter from US $ 292.8 billion in September 2005 to US $ 418.8 billion in December 2005 (Chart 47).
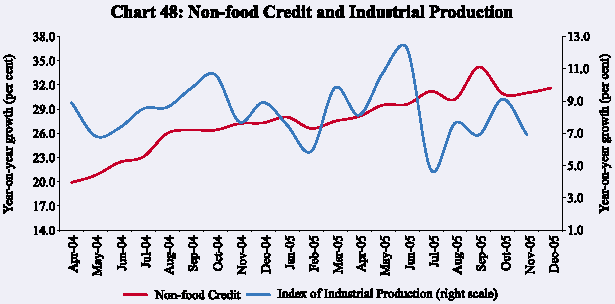
Credit Market
The demand for credit from the commercial sector remained strong during the third quarter of 2005-06 (Chart 48). As on January 6, 2006, the non-food credit extended by scheduled commercial banks grew, year-on-year, by 32.0 per cent on top of 26.6 per cent growth a year ago (net of conversion). Food credit growth recorded a deceleration over its end-March 2005 level on account of lower procurement.
Demand for bank credit has been broad-based led by agriculture, industry and housing (Table 34). The increase in industrial credit was mainly on account
| Table 34: Deployment of Non-food Bank Credit |
|||||||
| (Amount in Rupees crore) |
|||||||
| Sector/Industry |
Outstanding |
Financial Year Variations |
|||||
| as on |
Apr-Oct 2004 |
Apr-Oct 2005 |
|||||
| October 28, 2005 |
Absolute |
Per cent |
Absolute |
Per cent |
|||
| 1 |
2 |
3 |
4 |
5 |
6 |
||
| Non-food Gross Bank Credit |
11,57,769 |
92,054 |
12.6 |
1,57,981 |
15.8 |
||
| of which |
|||||||
| Agriculture and Allied Activities |
1,41,612 |
11,267 |
12.4 |
16,362 |
13.1 |
||
| Industry (Small, Medium and Large) |
4,75,915 |
26,738 |
8.5 |
49,023 |
11.5 |
||
| Small Scale Industries |
78,780 |
1,322 |
2.0 |
4,192 |
5.6 |
||
| Trade |
69,315 |
7,580 |
30.5 |
11,367 |
19.6 |
||
| Housing |
1,53,267 |
N.A. |
N.A. |
24,539 |
19.1 |
||
| Advances against Fixed Deposits |
30,283 |
-651 |
-2.5 |
433 |
1.5 |
||
| Other Sectors |
1,40,082 |
46,469 |
15.5 |
26,048 |
22.8 |
||
| Real Estate Loans |
20,148 |
2,663 |
47.7 |
6,846 |
51.5 |
||
| Non-Banking Financial Companies |
25,672 |
604 |
3.6 |
3,188 |
14.2 |
||
| Memo: |
|||||||
| Priority Sector |
4,33,422 |
26,181 |
9.9 |
51,946 |
13.6 |
||
| Industry (Small, Medium and Large) |
4,75,915 |
26,738 |
8.5 |
49,023 |
11.5 |
||
| Food Processing |
26,259 |
-361 |
-1.7 |
1,826 |
7.5 |
||
| Textiles |
48,229 |
-44 |
-0.1 |
4,252 |
9.7 |
||
| Paper & Paper Products |
7,910 |
181 |
3.0 |
1,028 |
14.9 |
||
| Petroleum, Coal Products & Nuclear Fuels |
20,549 |
3,533 |
28.8 |
4,980 |
32.0 |
||
| Chemical and Chemical Products |
40,723 |
-847 |
-2.8 |
1,231 |
3.1 |
||
| Rubber, Plastic & their Products |
5,596 |
249 |
9.6 |
1,930 |
52.6 |
||
| Iron and Steel |
42,138 |
10 |
0 |
6,137 |
17.0 |
||
| Other Metal & Metal Products |
13,968 |
1,006 |
12.3 |
2,332 |
20.0 |
||
| Engineering |
32,694 |
-1,033 |
-3.9 |
3,298 |
11.2 |
||
| Vehicles, Vehicle Parts and Transport |
|||||||
| Equipments |
15,825 |
262 |
4.9 |
3,963 |
33.4 |
||
| Gems & Jewellery |
17,880 |
2,323 |
25.3 |
3,574 |
25.0 |
||
| Construction |
10,726 |
1,716 |
28.7 |
2,604 |
32.1 |
||
| Infrastructure |
96,639 |
14,169 |
27.6 |
17,630 |
22.3 |
||
| N.A. : Not Available. |
|||||||
of infrastructure (viz., power and telecommunications), textiles, petroleum, iron and steel, gems and jewellery, engineering, vehicles, rubber and plastic products, and construction. Credit to agriculture recorded a strong growth reflecting various policy initiatives to improve the flow of credit to the sector. Strong demand for credit to the housing sector benefited from low interest rates and tax incentives. Credit to the commercial real estate continued to increase sharply.
During the third quarter, deposit rates increased by 25-100 basis points across various maturities (Table 35). As regards lending rates, while the
| Table 35: Movements in Deposit and Lending Rates |
||||||
| (Per cent) |
||||||
| Interest Rate |
March |
March |
June |
September |
December |
|
| 2004 |
2005 |
2005 |
2005 |
2005 |
||
| 1 |
2 |
3 |
4 |
5 |
6 |
|
| 1. |
Domestic Deposit Rate |
|||||
| Public Sector Banks |
||||||
| Up to 1 year |
3.75-5.25 |
2.75-6.00 |
2.75-6.00 |
2.00-6.00 |
2.00-6.00 |
|
| More than 1 year and up to 3 years |
5.00-5.75 |
4.75-6.50 |
5.25-6.25 |
5.25-6.25 |
5.50-6.50 |
|
| More than 3 years |
5.25-6.00 |
5.25-7.00 |
5.50-6.50 |
5.50-6.00 |
5.80-7.00 |
|
| Private Sector Banks |
||||||
| Up to 1 year |
3.00-6.00 |
3.00-6.25 |
3.00-6.25 |
3.00-6.25 |
3.50-6.25 |
|
| More than 1 year and up to 3 years |
5.00-6.50 |
5.25-7.25 |
5.00-7.00 |
5.00-7.00 |
5.50-7.00 |
|
| More than 3 years |
5.25-7.00 |
5.75-7.00 |
5.50-7.25 |
5.75-7.25 |
6.00-7.25 |
|
| Foreign Banks |
||||||
| Up to 1 year |
2.75-7.75 |
3.00-6.25 |
3.00-5.50 |
3.00-5.75 |
3.00-5.75 |
|
| More than 1 year and up to 3 years |
3.25-8.00 |
3.50-6.50 |
3.50-6.50 |
3.50-6.50 |
4.25-6.00 |
|
| More than 3 years |
3.25.800 |
3.50-7.00 |
4.00-7.00 |
4.00-7.00 |
5.00-7.00 |
|
| 2. |
Benchmark Prime Lending Rate |
|||||
| Public Sector Banks |
10.25-11.50 |
10.25-11.25 |
10.25-11.25 |
10.25-11.25 |
10.25-11.25 |
|
| Private Sector Banks |
10.50-13.00 |
11.00-13.50 |
11.00-13.50 |
11.00-13.50 |
11.00-13.50 |
|
| Foreign Banks |
11.00-14.85 |
10.00-14.50 |
10.00-14.50 |
10.00-14.50 |
10.00-14.50 |
|
| 3. |
Actual Lending Rate* |
|||||
| Public Sector Banks |
4.00-16.00 |
2.75-16.00 |
3.35-16.50 |
4.00-15.50 |
N.A. |
|
| Private Sector Banks |
4.50-22.00 |
3.15-22.00 |
3.15-24.94 |
4.00-20.00 |
N.A. |
|
| Foreign Banks |
3.75-23.00 |
3.55-23.50 |
4.00-25.00 |
2.85-25.00 |
N.A. |
|
| N.A. : Not available. |
||||||
Benchmark Prime Lending Rates (BPLRs) remained unchanged, banks revised upwards their sub-BPLRs.
Government Securities Market
Yields in the Government securities market moved in a narrow range during the third quarter of 2005-06, continuing with the trend witnessed since May 2005. Intra-year movements in yields have been influenced by domestic liquidity conditions, inflationary expectations and volatility in crude oil prices. Yields edged up from the second week of April 2005 reflecting concerns arising from the persistent rise in international crude oil prices, higher than expected inflation and the hike in the reverse repo rate. The 10-year benchmark yield firmed up from 6.65 per cent on March 31, 2005 to 7.31 per cent on April 30, 2005. With the easing of headline WPI inflation, yields softened during May 2005 touching 6.94 per cent in early June 2005. The yields edged up again during the first half of July 2005 reaching 7.23 per cent on July 13, reflecting higher crude oil prices, liquidity concerns and anticipation of an increase in the reverse repo rate. With the reverse repo rate being left unchanged on July 26, 2005 in the First Quarter
Review of the Annual Statement on Monetary Policy and comfortable liquidity conditions, yields softened, reaching 6.98 per cent on July 29. The yields remained broadly stable hovering at around seven per cent during August-September 2005. In October 2005, the yields increased marginally in anticipation of hike in the repo/reverse repo rates in the Mid-Term Review of Annual Policy Statement on October 25, 2005. Despite increases in the repo and reverse repo rates by 25 basis points, the yields fell marginally due to some moderation in international crude oil prices and easing of headline inflation.
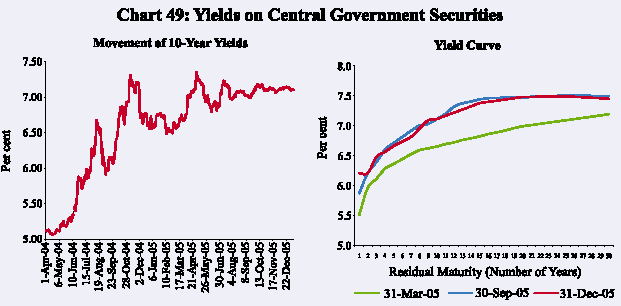
Although money markets were marked by liquidity tightness during November-December 2005, yields in the Government securities market remained range bound as domestic inflation and inflation expectations remained well-contained, aided by a moderation in international crude oil prices. The yields on 10-Year Government securities moved in a range of 7.06 - 7.18 per cent during the quarter ended December 2005. The 10-year yield stood at 7.11 per cent on January 18, 2006, one basis point lower than its end-September 2005 level and 46 basis points higher than its end-March 2005 level. The spread between 1-year and 10-year yields narrowed to 91 basis points at end-December 2005 (from 114 basis points at end-March) and that between 10-year and 30-year yields narrowed to 34 basis points (from 54 basis points at end-March) (Chart 49).
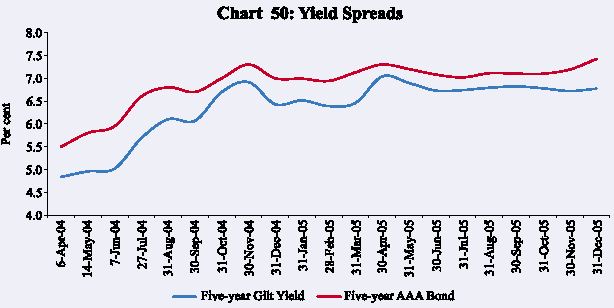
The yield on 5-year AAA-rated corporate bonds increased by 32 basis points during the quarter ended December 2005. The yield spread over 5-year Government securities increased to 65 basis points at end-December 2005 from 28 basis points at end-September 2005 but was almost unchanged from that at end-March 2005 (67 basis points) (Chart 50).
Equity Market
Capital markets continued to exhibit buoyancy during the third quarter of 2005-06. Resources raised by Indian corporates through initial public offerings and Euro issues increased further during October-December 2005, driven by bullish trend in the secondary market, robust macroeconomic fundamentals, congenial investment climate and sound business outlook. Indian stock markets touched historical high levels during December 2005. Satisfactory progress of the monsoon, robust industrial growth combined with satisfactory first half 2005-06 financial results of the corporates, strong investments by FIIs and mutual funds and firm trends in international stock markets enthused the market sentiment. On a point-to-point basis, the BSE Sensex increased by 8.8 per cent during the third quarter of 2005-06.
Primary Market
Resources raised through the public issues segment increased by 60.9 per cent during April-December 2005 (Table 36). With the number of public issues more than doubling during April-December 2005, average size of public issues, however, came down to Rs.214 crore during April-December 2005 from Rs.301 crore during the corresponding period of the previous year. Non-Government public limited companies (private sector) accounted for the bulk (86.6 per cent) of resources mobilised by way of public issues during April-December 2005. Three public sector banks raised equity worth Rs.2,520 crore during April-December 2005. Out of 88 issues during April-December 2005, 47 issues were initial public offerings (IPOs), constituting 47.6 per cent of resource mobilisation as compared with 17 out of 39 issues being IPOs during the corresponding period of the last
| Table 36: Mobilisation of Resources from the Primary Market |
|||||||
| (Amount in Rupees crore) |
|||||||
| Item |
April-December 2004 |
April-December 2005 P |
|||||
| No. of Issues |
Amount |
No. of Issues |
Amount |
||||
| 1 |
2 |
3 |
4 |
5 |
|||
| A. Prospectus and Rights Issues* |
|||||||
| 1. Private Sector (a+b) |
38 |
9,041 |
85 |
16,351 |
|||
| a) |
Financial |
6 |
3,755 |
6 |
6,982 |
||
| b) |
Non-financial |
32 |
5,286 |
79 |
9,369 |
||
| 2. Public Sector (a+b+c) |
1 |
2,684 |
3 |
2,520 |
|||
| a) |
Public Sector Undertakings |
– |
– |
– |
– |
||
| b) |
Government Companies |
1 |
2,684 |
– |
– |
||
| c) |
Banks/Financial Institutions |
– |
– |
3 |
2,520 |
||
| 3. Total (1+2) |
39 |
11,725 |
88 |
18,871 |
|||
| Of which: |
|||||||
| (i) |
Equity |
39 |
11,725 |
87 |
18,753 |
||
| (ii) |
Debt |
– |
– |
1 |
118 |
||
| B. |
Private Placement + |
||||||
| 1. Private Sector |
331 |
17,656 |
473 |
23,190 |
|||
| a) |
Financial |
147 |
9,590 |
181 |
13,978 |
||
| b) |
Non-financial |
184 |
8,066 |
292 |
9,212 |
||
| 2. Public Sector |
71 |
12,337 |
84 |
22,032 |
|||
| a) |
Financial |
38 |
5,802 |
63 |
13,489 |
||
| b) |
Non-financial |
33 |
6,535 |
21 |
8,543 |
||
| 3. Total (1+2) |
402 |
29,993 |
557 |
45,222 |
|||
| Memo : |
|||||||
| Euro Issues |
8 |
2,370 |
34 |
8,825 |
|||
| P:Provisional. * : Excluding offers for sale. – : Nil/Negligible. + : April-September. |
|||||||
year (constituting 22.8 per cent of resource mobilisation). All the IPOs in the current financial year so far have been by companies in the private sector. Equity issues continued to dominate the public issues market constituting 99.4 per cent of the total resource mobilisation during April-December 2005.
Mobilisation of resources through private placement witnessed a sharp turnaround – an increase of 50.8 per cent during April-September 2005 as against a decline of 9.7 per cent during April-September 2004 (Table 36). Resources mobilised by public sector entities (both financial and non-financial) increased by 78.6 per cent during April-September 2005 as against a decline of 47.2 per cent during April-September 2004. Public sector entities accounted for 48.7 per cent of total mobilisation through private placement during April-September 2005 as compared with 41.1 per cent during the same period of last year. Resources raised by financial intermediaries (both from public sector and private sector) accounted for 60.7 per cent of the total mobilisation by private placement during April-September 2005 (51.3 per cent during April-September 2004).
During April-December 2005, the resources raised through Euro issues –American Depository Receipts (ADRs), Global Depository Receipts (GDRs) and Foreign Currency Convertible Bonds (FCCBs) – by Indian corporates more than trebled to Rs.8,825 crore.
During April-December 2005, gross mobilisation of funds by mutual funds increased by 23.9 per cent to Rs.7,66,735 crore over the corresponding period of the previous year, while net funds (net of redemptions) increased substantially by 543.0 per cent during April-December 2005 over the corresponding period of the previous year (Table 37). Scheme-wise, a bulk (76.0 per cent) of the gross mobilisations of funds was under liquid/money market oriented schemes. Net inflows were witnessed in case of both income/debt-oriented schemes and growth/ equity-oriented schemes. Net mobilisation of resources under growth/equity oriented schemes maintained its trend during April-December 2005, mainly due to attractive returns from these schemes in a buoyant secondary market.
Secondary Market
The stock markets remained buoyant during the third quarter of 2005-06 with BSE Sensex and S&P CNX Nifty touching all time highs reflecting strong macroeconomic fundamentals of the Indian economy, robust corporate earnings, congenial investment climate and sound business outlook. Strong liquidity support from both foreign institutional investors (FIIs) and mutual funds, firm trend in the major international equity markets and surge in ADR prices also helped to boost the market sentiment (Chart 51).
After touching a record high on October 4, 2005 on the BSE, the stock markets turned weak during the remainder of October 2005 on account of cautious approach adopted by investors ahead of the second quarter financial results of the companies and slowdown in investments by FIIs. However, the markets resumed buoyancy in the month of November 2005. The announcement of satisfactory financial results by corporates during the second quarter (Table 38),
| Table 37: Resource Mobilisation by Mutual Funds |
|||||||
| (Rupees crore) |
|||||||
| April-December 2004 |
April-December 2005 |
||||||
| Mutual Fund |
Gross |
Net |
Net |
Gross |
Net |
Net |
|
| Mobilisation |
Mobilisation @ |
Assets * |
Mobilisation |
Mobilisation @ |
Assets * |
||
| 1 |
2 |
3 |
4 |
5 |
6 |
7 |
|
| Private Sector |
5,46,616 |
8,687 |
1,18,889 |
6,42,517 |
20,824 |
1,55,260 |
|
| Public Sector |
39,224 |
-1,439 |
10,671 |
70,094 |
5,683 |
18,760 |
|
| UTI |
32,915 |
-2,965 |
20,976 |
54,124 |
1,031 |
25,228 |
|
| Total |
6,18,755 |
4,283 |
1,50,536 |
7,66,735 |
27,538 |
1,99,248 |
|
| @: Net of redemptions. * : As at end of December. |
|||||||
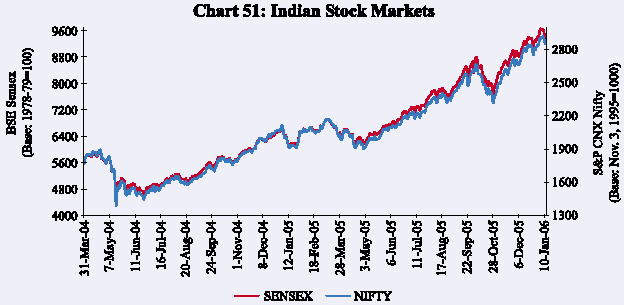
higher real GDP growth rate for the first half of 2005-06 and firm trends in major international equity markets also helped in improving the market sentiment and pushed the BSE Sensex above the 9000-mark. The BSE Sensex reached a new high of 9648 on January 4, 2006. However, the market sentiment turned subdued thereafter, mainly due to lower than expected third quarter financial results declared by some leading companies and slow down in FIIs investments in Indian equity markets. The BSE Sensex closed at 9238 on January 18, 2006.
| Table 38: Corporate Financial Performance |
||||||||||||
| (Growth rates in per cent) |
||||||||||||
| 2003-04 |
2004-05 |
2004-05 |
2005-06 |
2004-05 |
2005-06 |
|||||||
| H1 |
H1 |
Q1 |
Q2 |
Q3 |
Q4 |
Q1 |
Q2 |
|||||
| 1 |
2 |
3 |
4 |
5 |
6 |
7 |
8 |
9 |
10 |
11 |
||
| Sales |
15.4 |
25.2 |
25.1 |
17.2 |
24.8 |
23.7 |
24.1 |
21.0 |
18.5 |
16.4 |
||
| Expenditure |
12.5 |
24.0 |
23.6 |
16.6 |
23.4 |
22.4 |
24.3 |
19.8 |
18.0 |
16.3 |
||
| Gross Profits |
26.6 |
38.9 |
39.4 |
26.7 |
36.0 |
35.8 |
30.5 |
35.3 |
32.0 |
19.1 |
||
| Interest Cost |
-11.5 |
-2.0 |
2.9 |
-10.3 |
-3.2 |
2.1 |
-13.0 |
-5.4 |
-13.5 |
-8.0 |
||
| Profits After Tax |
57.9 |
53.8 |
50.1 |
41.3 |
51.2 |
45.3 |
45.5 |
51.4 |
54.2 |
27.5 |
||
| Memo: |
||||||||||||
| (Amount in Rupees crore) |
||||||||||||
| Number of |
||||||||||||
| Companies |
2,201 |
1,273 |
1,171 |
2,168 |
1,255 |
1,353 |
1,464 |
1,301 |
2,355 |
2,361 |
||
| Sales |
4,28,072 |
5,68,476 |
2,53,747 |
3,67,769 |
1,35,156 |
1,53,040 |
1,62,193 |
1,79,632 |
1,94,608 |
2,12,693 |
||
| Expenditure |
4,06,838 |
4,90,204 |
2,16,622 |
3,15,139 |
1,15,656 |
1,31,227 |
1,40,574 |
1,56,647 |
1,66,972 |
1,83,717 |
||
| Gross Profits |
48,852 |
72,406 |
33,291 |
48,781 |
17,234 |
20,448 |
20,017 |
23,736 |
25,577 |
27,620 |
||
| Interest Cost |
14,724 |
12,528 |
6,418 |
8,083 |
3,597 |
3,584 |
3,273 |
3,177 |
4,241 |
4,467 |
||
| Profits After Tax |
26,281 |
47,333 |
20,634 |
32,016 |
10,396 |
13,004 |
13,196 |
16,798 |
16,726 |
18,169 |
||
| Note:1.Growth rates are percentage change in the level for the period under reference over the corresponding |
||||||||||||
| Table 39: Stock Market Indicators |
|||||||||||||
| Indicator |
BSE |
NSE |
|||||||||||
| 2003-04 |
2004-05 |
April-December |
2003-04 |
2004-05 |
April-December |
||||||||
| 2004-05 |
2005-06 |
2004-05 |
2005-06 |
||||||||||
| 1 |
2 |
3 |
4 |
5 |
6 |
7 |
8 |
9 |
|||||
| Average BSE Sensex/ |
|||||||||||||
| S&P CNX Nifty |
4492 |
5741 |
5489 |
7668 |
1428 |
1805 |
1728 |
2339 |
|||||
| Volatility |
22.95 |
11.15 |
9.32 |
12.17 |
23.3 |
11.28 |
9.70 |
11.26 |
|||||
| P/E Ratio (End-period)* |
18.57 |
15.61 |
17.07 |
18.61 |
20.70 |
14.60 |
15.32 |
17.16 |
|||||
| Turnover (Rs. crore) |
5,02,618 |
5,18,716 |
3,65,614 |
5,47,923 |
10,99,535 |
11,40,071 |
8,27,295 |
10,75,345 |
|||||
| Market Capitalisation |
|||||||||||||
| (Rs. crore) |
|||||||||||||
| (End-period) |
12,01,207 |
16,98,429 |
16,85,750 |
24,89,384 |
11,20,976 |
15,85,585 |
15,79,161 |
23,22,392 |
|||||
| * : For 30 scrips included in the BSE Sensex and 50 scrips included in the S&P CNX Nifty. |
|||||||||||||
During the current financial year so far (up to January 18, 2006), the BSE Sensex has risen by 42.3 per cent over its end-March level, while the S&P CNX Nifty has increased by 38.0 per cent. The price-earnings (P/E) ratio of BSE Sensex stood at 17.9 as on January 18, 2006 as compared with 15.6 at end-March 2005 (Table 39).
The rally in the stock markets during the current fiscal has been widespread (Chart 52). On a point-to-point basis during current financial year so far (up to January 18, 2006), BSE 500 has increased by 38.3 per cent, while BSE
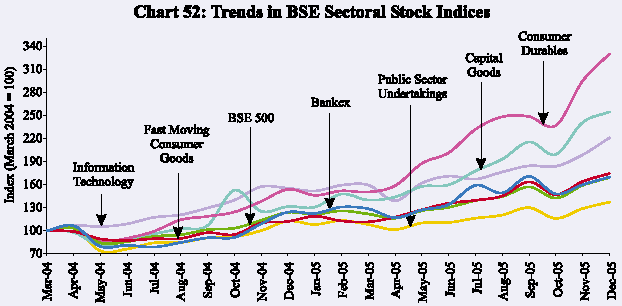
Small-cap and BSE Mid-cap has increased by 63.0 per cent and 48.0 per cent, respectively. Amongst the major sectors, BSE consumer durables index registered the highest gain (111.7 per cent) over end-March 2005, followed by capital goods (86.6 per cent), fast moving consumer goods (FMCG) (53.7 per cent), IT sector (31.4 per cent), banking index (30.3 per cent) and public sector undertakings (PSUs) (26.8 per cent). The consumer durables index rose sharply on account of robust corporate results led by increase in sales in electronics and auto segments and merger and acquisition activities in that sector. The FMCG sector performed well mainly due to normal progress of monsoon and its expected positive effect on sales of the FMCG products. The capital goods scrips were buoyant due to robust industrial activity, specifically in the manufacturing sector and continued encouraging investment climate. Satisfactory corporate results, increasing demand for Indian IT products from abroad and good performance of ADRs of IT sector companies led to a sharp increase in IT sector scrips.
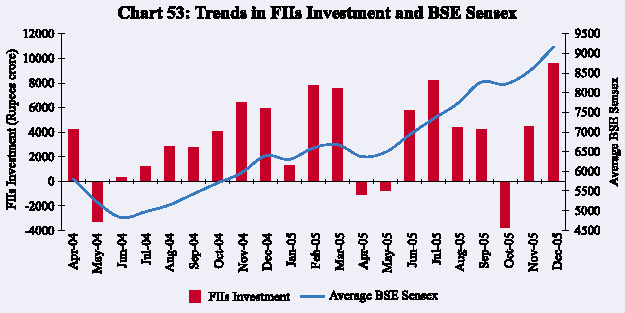
As per the Securities and Exchange Board of India (SEBI), foreign institutional investors (FIIs) have made net investment of Rs.32,964 crore (US $ 7.4 billion) in the equity market during 2005-06 so far (up to January 17, 2006) on top of net purchases of Rs.24,619 crore (US $ 5.4 billion) during the corresponding period of the previous year (Chart 53). Mutual funds have also made net purchases in equities of Rs.10,195 crore during 2005-06 so far (up to January 17, 2006) as against net sales of Rs.1,255 crore during the corresponding period of the previous year.
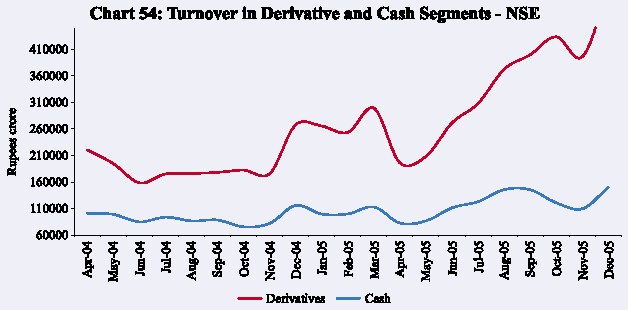
At NSE, the total turnover in the cash segment increased by 30.0 per cent to Rs.10,75,345 crore during April-December 2005 from Rs.8,27,295 crore during the corresponding period of the previous year. The turnover in the NSE’s derivative segment continued to be higher than in the cash segment. It increased by 79.8 per cent to Rs.31,09,089 crore during April-December 2005 (Chart 54).

شارك هذه الصفحة:


Install the RBI mobile application and get quick access to the latest news!


