
V. Financial Markets - ربی - Reserve Bank of India


V. Financial Markets
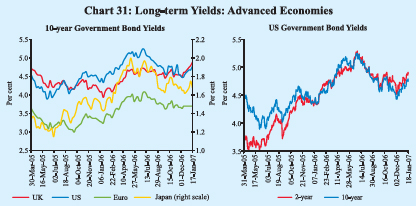
International Financial Markets During the third quarter (October-December 2006) of 2006-07, short-term interest rates increased further in major advanced economies as some central banks further tightened their policies to contain inflation and stabilise inflationary expectations (Table 33). Since end-September 2006, the European Central Bank has increased its policy rate by 25 basis points each on October 5, 2006 and December 7, 2006. The UK raised its policy rate by 25 basis points each on November 9, 2006 and January 11, 2007. Other advanced economies such as Australia, Sweden and Norway have also increased their policy rates since end-September 2006. The increase in short-term rates in the US since end-September 2006 has been lower than other major advanced economies as the fed funds rate has remained unchanged since end-June 2006. Short-term interest rates declined in a number of emerging market economies (EMEs) as the central banks in some of these economies cut their rates or kept them unchanged. In line with the upward trend in short-term rates, long-term Government bond yields increased in major advanced economies. Between end-September
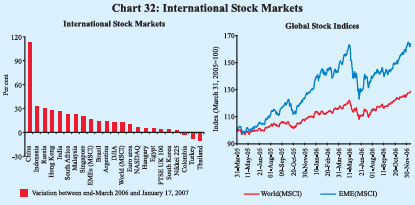
2006 and January 17, 2007, 10-year yields increased by 43 basis points in the UK, 19 basis points in the US, seven basis points in the euro area and five basis points in Japan (Chart 31). The hardening of yields in the euro area and the UK could be attributed to higher short-term rates in view of further tightening and improved growth prospects. US yields edged higher on the back of stronger than expected data. Since early June 2006, 10-year US bond yields have remained below those on 2-year bonds. Global equity markets recorded further gains during the third quarter of 2006-07 (Chart 32). The MSCI World and MSCI emerging markets indices
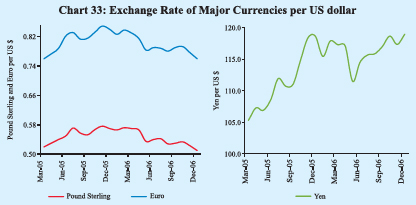
increased by 8.5 per cent and 15.2 per cent, respectively, between end-September 2006 and January 17, 2007. Since end-March 2006, these indices have gained 11.9 per cent and 15.7 per cent, respectively. Strong corporate results, better than expected growth in the euro area, strong merger and acquisition activity, pause by the US Federal Reserve and decline in crude oil prices provided support to the equity markets during the third quarter of 2006-07. Stock markets in Thailand declined by 14.8 per cent on December 19, 2006 (over its level on the previous day) following the decision of the Bank of Thailand (BoT) to impose unremunerated reserve requirement (URR) of 30 per cent on short-term capital flows to discourage speculative short-term capital flows. The markets, however, recovered some of these losses the next day as the BoT exempted investments in stock markets from the URR. In the current fiscal year (up to January 17, 2007) amongst major economies, stock markets in China recorded the largest gains (113.3 per cent), followed by Indonesia (32.9 per cent), Russia (30.1 per cent), Hong Kong (27.4 per cent) and India (26.4 per cent). In the foreign exchange market, the US dollar depreciated against the Pound sterling and the euro during the third quarter of 2006-07, reflecting narrowing of interest rate differentials, moderation of activity in the US and robust growth in the euro area (Chart 33). Between end-September 2006 and January 19, 2007, the US dollar depreciated by 5.2 per cent against the Pound sterling and 2.3 per cent against the euro but appreciated by 3.0 per cent against the yen. Amongst Asian currencies, the US dollar depreciated by 5.0 per cent against Malaysian Ringgit, 3.9 per cent against Thai Baht, 1.6 per cent against Chinese Yuan and 0.9 per cent against Korean Won.
Domestic Financial Markets Indian financial markets remained largely orderly during the third quarter of 2006-07. Short-term money rates remained generally within the reverse repo rate and repo rate corridor till mid-December 2006. However, during the last fortnight of December 2006, call rates shot up. In the foreign exchange market, the Indian rupee appreciated vis-à-vis the US dollar during the third quarter. Yields on the longer maturity bonds in the Government securities market softened during October and November 2006 but hardened subsequently. Banks’ deposit and lending rates edged up further during the quarter in the wake of strong credit demand. The stock markets recorded further gains, reaching record highs (Table 34). Resources
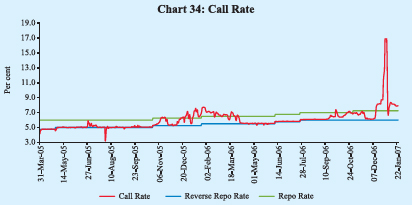
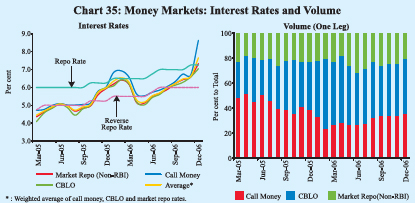
raised in the primary market segment of the equity market during the third quarter of 2006-07 were higher than the preceding quarter. Money Market Call money rate remained generally close to the reverse repo rate up to mid-September 2006 (). Liquidity conditions, however, became relatively tighter in the second half of September 2006 on account of advance tax outflows and festival season currency demand amidst high Chart 34credit demand. Call rates crossed the repo rate and touched 7.38 per cent as on September 29, 2006. Call rates eased below the repo rate by early October 2006 and remained mostly within repo-reverse repo corridor till early November 2006 as liquidity pressures eased, partly on account of reduction in Centre’s surplus. Call rates eased further to reverse repo levels by the last week of November 2006, but edged higher from the second week of December 2006, crossing the repo rate to touch 16.88 per cent on December 29, 2006 under the impact of advance tax outflows and hike of 25 basis points each in the cash reserve ratio (CRR) effective the fortnights beginning December 23, 2006 and January 6, 2007. Call rates eased in the first week of January 2007 on the back of improvement in liquidity conditions. The call rate was 7.88 per cent as on January 23, 2007, 81 basis points higher than that at end-September 2006 and 124 basis points higher than that at end-March 2006. A screen-based negotiated quote-driven system for all dealings in call/ notice and term money markets (NDS-CALL), as announced in the Annual Policy Statement for the year 2005-06, was launched on September 18, 2006. The
dealing on this platform is optional; 80 banks (including 15 co-operative banks) and 10 primary dealers have taken membership of NDS-CALL so far. Trading on NDS-CALL is expected to bring about increased transparency and better price discovery in the call money market. Interest rates in the collateralised segments of the money market – the market repo (outside the LAF) and the Collateralised Borrowing and Lending Obligation (CBLO) – remained below the call rate during the third quarter. Till mid-December 2006, these rates remained within repo - reverse repo rate corridor. In tandem with tightness in money markets, interest rates in these segments also edged up and crossed the repo rate in the second half of December 2006, but remained below the call rates. During October-December 2006, the CBLO and market repo rates averaged 6.64 per cent and 6.79 per cent, respectively, as compared with 7.36 per cent in the call market. During the fiscal year 2006-07 (up to December 2006), interest rates averaged 5.92 per cent and 5.99 per cent in the CBLO and market repo segments, respectively, as compared with 6.36 per cent in the call money market. The weighted average interest rate of call, CBLO and market repo increased from 6.29 per cent in March 2006 and 6.22 per cent in September 2006 to 7.66 per cent in December 2006; the weighted average interest rate was 7.49 per cent as on January 23, 2007. The collateralised market is now the predominant segment in the money market, with a share of around 65 per cent in total volume during 2006-07 so far (Chart 35 and Table 35). Mutual funds and financial institutions are the major lenders in the CBLO market with nationalised banks being the major borrowers. In the market repo segment, mutual funds are the major provider of funds, while foreign banks, private sector banks and primary dealers are the major borrowers.
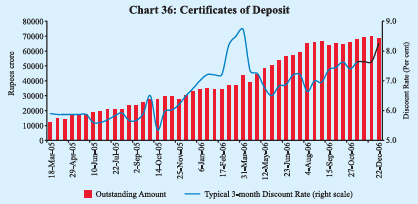
Certificates of Deposit The outstanding amount of certificates of deposit (CDs) increased further during the third quarter of 2006-07 as banks continued to supplement their efforts at deposit mobilisation to support sustained credit demand (Table 35 and Chart 36). The amount of outstanding CDs increased from Rs.65,274 crore at end-September 2006 (4.5 per cent of aggregate deposits of issuing banks with significant intra-group variation) to Rs.68,619 crore (4.3 per cent) by December 22, 2006. The weighted average discount rate (WADR) of CDs of ‘6 months to less than 1 year’ maturity at 8.28 per cent as on December 22, 2006 was 48 basis points higher than its level (7.80 per cent) at end-September 2006. Mutual funds have emerged as key investors in CDs. The fact that CDs can be traded makes them attractive for investors like mutual funds, who look for easily encashable investments.
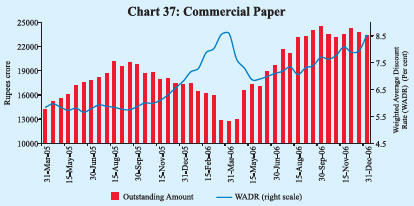
Commercial Paper After increasing in each of the previous two quarters, the outstanding amount of commercial papers (CPs) declined marginally during the third quarter from Rs.24,419 crore as on September 30, 2006 to Rs.23,336 crore as on December 31, 2006 (Chart 37). The weighted average discount rate (WADR) on CPs increased from 7.70 per cent on September 30, 2006 to 8.52 per cent as on December 31, 2006 in tandem with the increase in the money market rates. The discount rate on CPs moved from a range of 7.10-9.25 per cent during the fortnight ended September 30, 2006 to 7.74-10.00 per cent during the fortnight ending
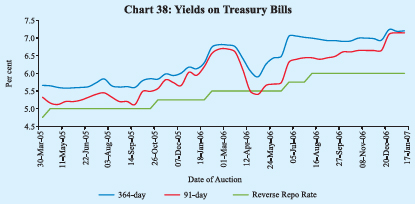
December 31, 2006. The most preferred tenors of CPs were ‘61 to 90 days’ and ‘181 days and above’. Leasing and finance companies continued to remain the pre-dominant issuers of CPs in the absence of the access of these companies to public deposits (Table 36). The primary market yields on Treasury Bills (TBs), after remaining broadly unchanged during October-November 2006, increased during December 2006 (Chart 38). The yield spread between 364-day and 91-day TBs narrowed to eight basis points in December 2006 from 40 basis points in September 2006 (Table 37).
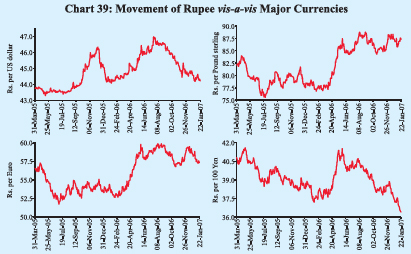
Notified amount of Rs.1,500 crore each for auctions of the 91-day TBs under the Market Stabilisation Scheme (MSS) were not fully subscribed at some of the auctions during the quarter October-December 2006, reflecting tight liquidity conditions. There was, however, no devolvement on the PDs. Foreign Exchange Market In the foreign exchange market, the Indian rupee appreciated vis-à-vis the US dollar during the quarter ended December 2006. The rupee, which had started to appreciate from the last week of July 2006 on the back of revival of FII inflows and easing of international crude oil prices, rose further amidst weakness of the US dollar in the international markets. The rupee has moved in a range of Rs.44.20–46.97 per US dollar during 2006-07 so far (up to January 23, 2007) (Chart 39). The exchange rate was Rs.44.22 per US dollar as on January 23, 2007; it has recorded an appreciation of 3.9 per cent over its level as at end-September 2006. On a fiscal year basis (up to January 23, 2007), the
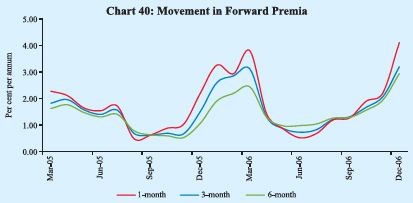
rupee has appreciated by 0.9 per cent vis-à-vis the US dollar and 4.6 per cent against the Japanese yen but depreciated by 11.1 per cent against the Pound sterling and 5.3 per cent against the euro. Forward premia increased further during the third quarter of 2006-07, reflecting increase in domestic interest rates (Chart 40).
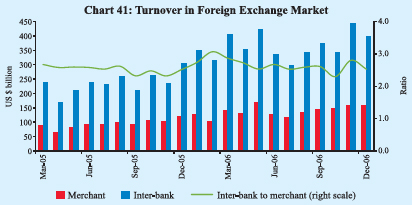
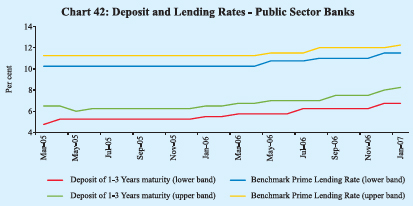
The turnover in the inter-bank as well as merchant segments of the foreign exchange market increased to US $ 549 billion (monthly average) during the third quarter of 2006-07 from US $ 376 billion in the corresponding period of 2005-06. While inter-bank turnover increased from US $ 267 billion during the third quarter of 2005-06 to US $ 394 billion in the third quarter of 2006-07, the merchant turnover increased from US $ 109 billion to US $ 155 billion (Chart 41). The ratio of inter-bank to merchant turnover was marginally higher at 2.5 during the third quarter of 2006-07 as compared with 2.4 a year ago. Credit Market The interest rates offered by public sector banks (PSBs) on deposits of maturity of more than one year and up to three years were placed in the range of 6.75-8.25 per cent in January 2007 as compared with 6.25-7.50 per cent in September 2006 while those on deposits of maturity of above three years were placed in the range of 7.00-8.50 per cent in January 2007 as compared with 6.50-8.00 per cent in September 2006 (Table 38 and Chart 42). The interest rates offered by private sector banks on deposits of maturity up to one year were placed in the range of 3.00-8.25 per cent in January 2007 as compared with 3.00-7.25 per cent in September 2006 while those on deposits of maturity above three years were placed in the range of 7.00-9.25 per cent in January 2007 as compared with 6.75-8.50 per cent in September 2006. As regards foreign banks, the rates offered on deposits of maturity up to one year were placed in the range of 3.00-8.00 per cent in January 2007 as compared with 3.00-7.50 per cent in September 2006. On the lending side, most PSBs and some private sector banks have raised their Benchmark Prime Lending Rates (BPLRs) since
September 2006. The range of BPLRs of PSBs changed to 11.50-12.25 per cent in January 2007 from 11.00-12.00 per cent in September 2006. The weighted
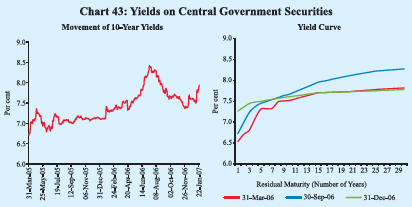
average BPLR of PSBs increased from 10.7 per cent in March 2006 to 11.3 per cent in September 2006 and further to 11.6 per cent in December 2006. The weighted average BPLR of private sector banks increased from 12.4 per cent in March 2006 to 12.9 per cent in September 2006 and further to 13.2 per cent in December 2006. The weighted average BPLR of foreign banks at 12.7 per cent in December 2006 was the same as that in March 2006 and September 2006. Government Securities Market Yields on 10-year paper hardened in the first quarter to reach a peak of 8.40 per cent on July 11, 2006, an increase of 88 basis points over end-March 2006. Subsequently, yields softened in consonance with easing of Government bond yields in the US, the Fed’s decision to keep the fed funds rate unchanged, easing of crude oil prices and increased demand for gilts from banks to meet their SLR requirements. The announcement of the borrowing calendar of the Central Government for the second half of 2006-07 was in accordance with market expectations. The 10-year yield reached a low of 7.38 per cent as on November 28, 2006. There was, however, hardening of the yields from the second half of December 2006 in tandem with the tightness in liquidity conditions on the back of advance tax outflows and hike in the cash reserve ratio. The 10-year yield was 7.87 per cent as on January 23, 2007, 20 basis points higher than the level at end-September 2006 and 35 basis points higher than the level as on March 31, 2006 (7.52 per cent) (Chart 43). The yield curve flattened during the quarter, with the spread between 1-10 year yields narrowing from 94 basis points at end-September 2006 to 34 basis points at end-December 2006. The spread between 10-year and 30-year yields also narrowed from 61 basis points at end-September 2006 to 17 basis points at end-December 2006 (30 basis points at end-March 2006).
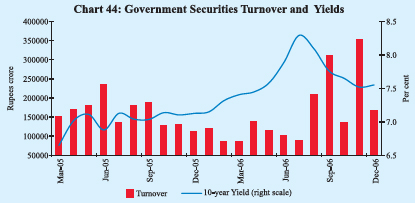
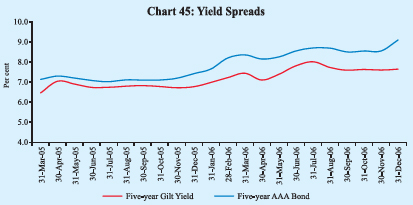
The turnover in Government securities has increased since August 2006 in tandem with easing of yields (Chart 44). The decline in turnover in October 2006 partly reflected lower number of trading days while that in December 2006 could be attributed to tight liquidity conditions. The yields on 5-year AAA-rated corporate bonds increased during the third quarter of 2006-07. The yield spread between 5-year AAA-rated bonds and 5-year Government securities, thus, widened to 146 basis points at end-December 2006 from that of 91 basis points at end-September 2006 as well as at end-March 2006 (Chart 45).
Equity Market Primary Market Resources raised through the public issues segment picked-up during the quarter ended December 2006 vis-à-vis the previous quarter. Cumulative resources raised through public issues during April-December 2006 increased by 33.0 per cent to Rs. 25,365 crore, even as the number of issues came down from 88 to 78 (Table 39). The average size of public issues increased from Rs.217 crore during April-December 2005 to Rs.325 crore during April-December 2006. Except one issue, all public issues during April-December 2006 were in the form of equity. Out of 78 issues during April-December 2006, 41 issues were initial public offerings (IPOs), accounting for 78.7 per cent of resource mobilisation.
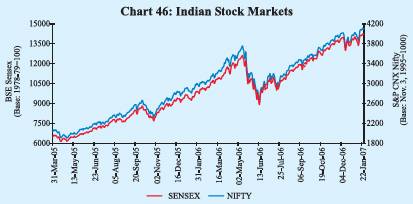
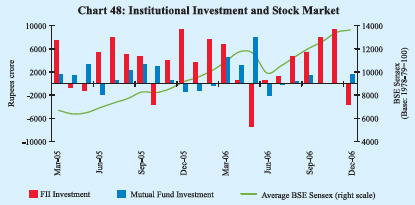
Mobilisation of resources through private placement increased by 55.5 per cent to Rs.71,038 crore during April-September 2006 over the corresponding period of the previous year (Table 39). Resources mobilised by private sector entities increased by 67.0 per cent, while those by public sector entities increased by 43.8 per cent during April-September 2006. Financial intermediaries (both from public sector and private sector) accounted for the bulk (70.2 per cent) of the total resource mobilisation from private placement market during April-September 2006 (61.1 per cent during April-September 2005). The resources raised through Euro issues - American Depository Receipts (ADRs) and Global Depository Receipts (GDRs) - by Indian corporates during April-December 2006 at Rs.8,841 crore were almost the same as in the corresponding period of previous year (Table 39). During April-December 2006, net mobilisation of resources by mutual funds increased substantially by 190 per cent to Rs.79,708 crore over the corresponding period of 2005 (Table 40). Bulk of the net mobilisation of funds was under income/debt-oriented schemes (73.0 per cent of total), while growth/ equity-oriented schemes accounted for 25.8 per cent of the net mobilisation of funds. Secondary Market The domestic stock markets remained buoyant and recorded further gains during the third quarter of 2006-07 (Chart 46). Continued buying by FIIs on the back of strong domestic fundamentals, robust corporate results, upward trend in the international equity markets and decline in global crude oil prices provided support to domestic stock markets. Domestic stock markets declined during May-June, 2006 in consonance with global trends amidst
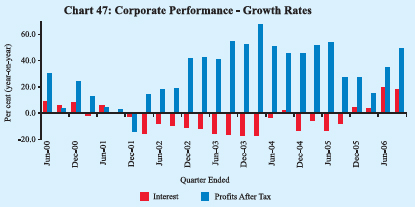
increased risk aversion over concerns of slowdown in global growth, increase in global inflation, higher international interest rates and meltdown in base metal prices. The BSE Sensex reached 8929 as on June 14, 2006, a decline of 29.2 per cent over the then all-time high of 12612 reached on May 10, 2006. Stock markets recovered these losses in the following months, reflecting fresh buying by FIIs, recovery in base metal prices and decline in international crude oil prices amidst continuing robust macroeconomic fundamentals. The BSE Sensex reached a new high of 13972 on December 7, 2006. The markets witnessed some correction in the next few days, inter alia, due to profit taking at higher levels, deceleration in industrial activity for October 2006, announcement of CRR hike and the decision of the Bank of Thailand (BoT) to impose unremunerated reserve requirement (URR) on short-term capital flows. The markets, however, recovered in the next few days. The BSE Sensex closed at all-time high of 14218 on January 18, 2007. The Sensex was 14041 on January 23, 2007, 24.5 per cent above its end-March 2006 level. Profits after tax of corporates exhibited further improvement in the second quarter of 2006-07. Ratio of profits after tax to sales also improved to 11.0 per cent during the quarter ended September 2006 from 10.6 per cent in the preceding quarter and 8.5 per cent a year ago (Table 41 and Chart 47).
made net investments of Rs.12,172 crore in the current financial year so far (up to January 19, 2007) as compared with net purchases of Rs.9,438 crore during the corresponding period of last year.
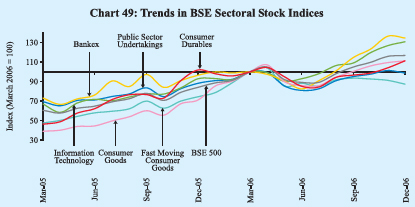
Major indices and sectors have shown mixed trends during 2006-07 so far (Chart 49). On a point-to-point basis (up to January 22, 2007), BSE 500, BSE Mid-cap and BSE Small-cap increased by 20.7 per cent, 13.8 per cent and 14.8 per cent, respectively. Amongst major sectors, bank stocks recorded gains of 42.0 per cent over end-March 2006, followed by oil and gas (34.7 per cent), IT stocks (32.8 per cent), consumer durables (20.2 per cent), capital goods (15.1 per cent), auto (6.2 per cent), public sector undertakings (1.9 per cent), metals (1.3 per cent) and healthcare (1.0 per cent). However, fast moving consumer goods registered losses of 10.7 per cent (Chart 49).
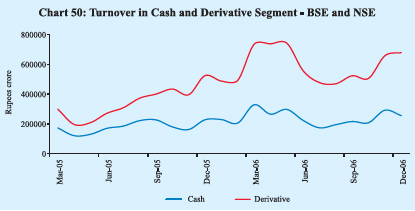
The price-earnings (P/E) ratio for the 30 scrips included in the BSE Sensex increased from 20.9 at end-March 2006 to 22.8 at end-December 2006 (Table 42). The market capitalisation of the BSE increased by 19.9 per cent between end-March 2006 and end-December 2006. Volatility during April-December 2006 was lower than that in the same period a year ago. Total turnover (BSE and NSE) in the cash segment during April-December 2006 at Rs.21,23,724 crore was 30.8 per cent higher than that in the corresponding period of 2005 (Chart 50). Total turnover (BSE and NSE) in the derivative segment increased by 72.0 per cent during April-December 2006 to Rs.53,49,595 crore.
|
|||||||||||||||||||||||||||||||||||||||||||||||||||||||||||||||||||||||||||||||||||||||||||||||||||||||||||||||||||||||||||||||||||||||||||||||||||||||||||||||||||||||||||||||||||||||||||||||||||||||||||||||||||||||||||||||||||||||||||||||||||||||||||||||||||||||||||||||||||||||||||||||||||||||||||||||||||||||||||||||||||||||||||||||||||||||||||||||||||||||||||||||||||||||||||||||||||||||||||||||||||||||||||||||||||||||||||||||||||||||||||||||||||||||||||||||||||||||||||||||||||||||||||||||||||||||||||||||||||||||||||||||||||||||||||||||||||||||||||||||||||||||||||||||||||||||||||||||||||||||||||||||||||||||||||||||||||||||||||||||||||||||||||||||||||||||||||||||||||||||||||||||||||||||||||||||||||||||||||||||||||||||||||||||||||||||||||||||||||||||||||||||||||||||||||||||||||||||||||||||||||||||||||||||||||||||||||||||||||||||||||||||||||||||||||||||||||||||||||||||||||||||||||||||||||||||||||||||||||||||||||||||||||||||||||||||||||||||||||||||||||||||||||||||||||||||||||||||||||||||

شارك هذه الصفحة:


Install the RBI mobile application and get quick access to the latest news!


