
VI Management of Capital Flows (Part 1 of 3) - ربی - Reserve Bank of India


VI Management of Capital Flows (Part 1 of 3)
Introduction
6.1 One of the most significant developments in the world economy in the 1990s has been the spectacular surge in international capital flows. These flows emanated from a greater financial liberalisation, improvement in information technology, emergence and proliferation of institutional investors such as mutual and pension funds, and a spate of financial innovations. There was increasing recognition that gains from international portfolio diversification, albeit less than that accrued from international trade, could still be significant. A number of studies have confirmed that financial globalisation can contribute significantly to promoting growth in developing countries by augmenting domestic savings, reducing cost of capital, transferring technology, developing domestic financial sector and fostering human capital formation (Prasad, et al., 2003). At the same time, however, it has been recognised that sudden and large surges in capital flows cause several concerns. Large capital flows could push up monetary aggregates, engender inflationary pressures, destabilise exchange rates, exacerbate the current account position, adversely affect the domestic financial sector, and disrupt domestic growth trajectories if and when such flows get reversed or drastically reduced (Reddy, 1998; Hoggarth and Stern, 1999; Rangarajan, 2000; Mohan, 2003). Volatility of capital flows, particularly portfolio flows and their consequent impact on the emerging market economies has been well documented. Indeed, the experience of living with capital flows since the 1970s has fundamentally altered the context of development finance (Mohan, 2003). It has also brought about a drastic revision in the manner in which monetary policy is conducted.
6.2 With the increase in capital flows and participation of foreign investors and institutions in the financial markets of developing countries, the capital account has been the focus of attention since the late 1980s and especially so in the 1990s. It is noteworthy that the expansion of capital flows has been much larger than that of international trade flows. The process has been reinforced by the ongoing abolition of impediments and capital controls and the widespread liberalisation of financial markets in developing countries during the 1990s. Not
surprisingly, there is ample evidence of high and increasing degree of international capital mobility among the major industrial and developing countries (Montiel, 1993). A striking feature of the enlarged capital flows to developing countries in the recent period is that private (debt and equity) flows, as opposed to official flows, have become a dominant source of financing large current account imbalances. Another noteworthy feature has been a shift away from debt flows and towards equity flows, especially direct investment. Private capital flows appear, however, to be concentrated in a few key emerging market economies (EMEs).
6.3 India’s experience with private capital flows has been somewhat recent. Traditionally, external aid was the major component of the capital account of India’s balance of payments. In recent years, however, the dependence on aid has been nearly eliminated. The capital account has been dominated by flows in the form of foreign direct investment (FDI), portfolio investments including ADR/GDR issues, external commercial borrowings, non-resident deposits and special deposit schemes such as India Development Bonds (IDBs), Resurgent India Bonds (RIBs) and India Millennium Deposits (IMDs). Indeed, the change in the size and composition of the capital account has played a significant role in the growing strength of the external sector of the Indian economy.
6.4 Against the background of the global financial developments in the 1990s, this Chapter highlights the trends and compositional shifts in capital flows in respect of the Indian economy and traces their major determinants as well as their implications for growth and monetary management. The Chapter begins with a discussion on the trends in global capital flows and its macroeconomics. This is followed in Section II by a discussion of the trends in capital flows to India, in the context of the broad policy objectives in respect of capital flows. The following five sections (i.e., Section III to Section VII) focus on specific components of capital flows: foreign direct investment (Section III), portfolio investment (Section IV), external commercial borrowings (Section V), non-resident deposits (Section VI) and external aid (Section VII). Theoretical underpinnings as well as the cross-country experiences have been provided in each section. Section VIII then
MANAGEMENT OF CAPITAL FLOWS
discusses India’s transactions with the IMF highlighting India’s participation in IMF’s Financial Transaction Plan thereby emerging as a creditor country. The next Section then brings together the Indian experience with monetary management in the context of capital flows. Emerging issues relating to capital flows and demography are discussed in Section X that follows. The next section deals with capital flows and growth. Concluding observations are provided in the last section.
I. TRENDS IN GLOBAL CAPITAL FLOWS
6.5 Gross capital flows at global level have increased substantially since the late 1980s (see Chapters VIII and IX). Net capital flows to developing countries increased sharply during early 1990s and after reaching a peak at US $ 298 billion in 1997 declined to US $ 160 billion by 2002. Against this backdrop, this section examines the trends in capital flows with a focus on their upsurge and compositional shifts during the 1990s. The section also elucidates the volatility associated with large capital flows, analyses their determinants and highlights the high degree of concentration in capital flows to a few emerging markets.
Trends in External Capital Inflows towards Developing Countries
6.6 In the post-World War II period up to the 1970s, international capital flows were primarily confined among industrial economies. Net capital inflows towards developing countries started picking up in the early 1970s in the aftermath of the first oil price shock. Such flows were mainly debt flows in the form of syndicated bank lending. This phase continued unabated until the early 1980s. As a result of increased bank lending, the debt of the developing countries increased significantly – at a compound annual rate of 24 per cent – until the Latin American debt crisis of 1982 burst the bubble (World Bank, 2003b). This led to a considerable slowdown in capital flows particularly in respect of commercial bank lending to developing countries. Between 1983 and 1989, capital flows declined to less than a third of their level in 1977-82.
6.7 With receding commercial bank lending, foreign direct investment (FDI) inflows to developing countries started picking up in the early 1980s. The quantum of FDI, however, continued to remain lower than debt flows. By the end of the 1980s, direct investment inflows to developing countries were only one-eighth of the flows to developed countries, while portfolio flows to developing countries were virtually non-existent. Net FDI inflows towards developing countries, however, increased at a sustained and high pace between 1987
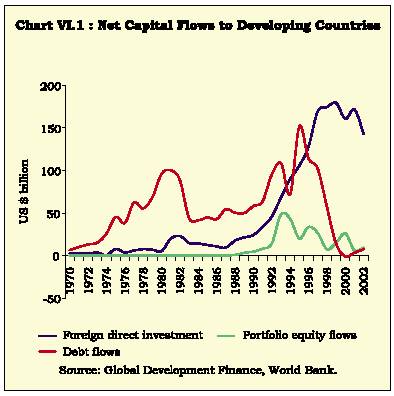
and 1997. In 1994, these flows surpassed net debt flows for the first time. Net external debt flows as well as inflows in the form of portfolio capital also gathered momentum in the early 1990s (Chart VI.1).
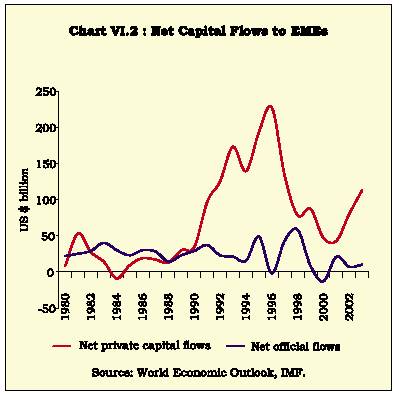
6.8 As a result of an increase in all forms of capital inflows, net capital flows surged to pre-1914 levels by 1996, notwithstanding an ephemeral slowdown in the context of the ERM crisis of 1992. The impact of the Mexican crisis of 1994 was contained by the large mobilisation of official financing which acted as a buffer (Mohan, 2003) (Chart VI.2).
REPORT ON CURRENCY AND FINANCE
6.9 The composition of flows in respect of emerging market economies also altered significantly, with private flows exceeding official flows by the end of the 1980s. Furthermore, while bank lending was the major component of capital flows to emerging markets in the 1970s, equity and bond investors became dominant starting in the early 1990s. Portfolio investment exceeded bank lending in eight years of the last decade. The range of investors purchasing emerging market securities broadened. Specialised investors such as hedge funds and mutual funds accounted for the bulk of portfolio inflows up to mid-1990s. In the subsequent years, pension funds, insurance companies and other institutional investors increased their presence in emerging markets. Although portfolio flows became important, it was FDI which accounted for the bulk of private capital flows to emerging market economies - witnessing a six-fold jump between 1990 and 1997. International bank lending to developing countries also increased sharply during this period, and was most pronounced in Asia, followed by Eastern Europe and Latin America. Much of the increase in bank lending was in the form of short-term claims, particularly on Asia.
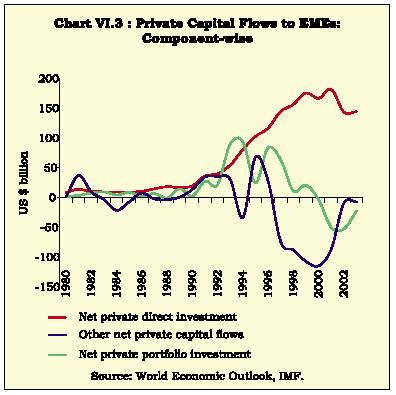
6.10 The volatility and the possibility of reversals associated with capital flows were brought out quite strikingly by the East Asian and the subsequent financial crises. In the late 1990s, capital flows to developing countries received severe shocks – first from the Asian crisis of 1997-98, then by the turmoil in global fixed income markets, more recently by the collapse of the Argentine currency board peg in 2001 and the spate of corporate failures and accounting irregularities in the US in 2002. Net flows to developing countries declined in the immediate aftermath of East Asian financial crisis. The fall was particularly sharp in the form of bank lending and bonds, reflecting uncertainty and risk aversion. On the other hand, FDI inflows to EMEs were relatively stable over the period 1997-2002 (Chart VI.3). This highlights the stabilising feature of FDI inflows vis-à-vis other private capital flows (both debt and equity). In 2000, there was, in fact, a net outflow from developing countries on account of debt flows. In 2002, net capital flows fell again, remaining far below the 1997 peak due to the global economic slowdown and a series of accounting and corporate failures which severely undermined investor confidence. Flows to Latin America were particularly affected, reaching their lowest level in a decade. Flows to Asia began a hesitant recovery in 2002 with new bank lending exceeding repayments for the first time in five years. Global FDI inflows into developing countries, fell by 41 per cent in 2001,
followed by a decline of another 21 per cent in 2002, attributable to weak economic growth, large sell-offs in equity markets, lower corporate profits, slowdown in corporate restructuring and a plunge in cross-border mergers and acquisitions. The USA and the UK accounted for more than half of the decline. Flows to Asia were held up by China (Table 6.1). Some positive aspects of the 1990s were a steady consolidation of external debt by developing countries cushioned by the resilience of FDI, and the growth of local-currency bond markets as an innovation to manage credit risk.
6.11 Despite the global uncertainties, conditions for capital flows have improved in 2003 (IMF, 2003). Sell-offs in international bond markets in June and July 2003 reflected upward revisions in investors’ expectations about growth prospects. Spillovers to credit and equity markets were limited, accompanied by a narrowing of spreads on international bonds of EMEs in the secondary market which reflected lower risk premia. Emerging markets, in general, outperformed the mature markets. Net capital flows are currently limping back from the severe retrenchment imposed by the Asian financial crisis.
Determinants of Capital Flows: Push and Pull Factors
6.12 The pace, magnitude, direction and composition of international capital flows have crucial implications for the recipient countries. The surge in private capital inflows to developing economies in the 1990s coincided with a period of low international interest rates in the advanced economies and
MANAGEMENT OF CAPITAL FLOWS
| Table 6.1: Net External Capital Inflows to Developing Countries |
||||||||
| (US $ billion) |
||||||||
| Region |
1970 |
1980 |
1985 |
1990 |
1995 |
2000 |
2002 |
|
| 1 |
2 |
3 |
4 |
5 |
6 |
7 |
8 |
|
| All Developing Countries |
||||||||
| FDI |
2.2 |
5.3 |
12.4 |
24.1 |
105.4 |
160.6 |
143.0 |
|
| Portfolio |
.. |
.. |
.. |
4.5 |
20.2 |
26.0 |
9.4 |
|
| Debt |
6.4 |
96.0 |
44.8 |
58.0 |
151.7 |
-1.0 |
7.2 |
|
| East Asia & Pacific |
||||||||
| FDI |
0.2 |
1.3 |
2.9 |
10.3 |
51.3 |
44.0 |
57.0 |
|
| Portfolio |
.. |
.. |
.. |
1.6 |
9.1 |
19.3 |
5.4 |
|
| Debt |
1.0 |
11.9 |
9.6 |
19.0 |
54.2 |
-18.0 |
-8.3 |
|
| Europe & Central Asia |
||||||||
| FDI |
0.1 |
.. |
0.1 |
1.2 |
17.0 |
29.2 |
29.0 |
|
| Portfolio |
.. |
.. |
.. |
0.3 |
1.7 |
1.2 |
1.4 |
|
| Debt |
0.5 |
13.5 |
5.6 |
2.3 |
23.4 |
22.0 |
11.2 |
|
| Latin America & Caribbean |
||||||||
| FDI |
1.2 |
6.4 |
6.0 |
8.2 |
30.5 |
75.8 |
42.0 |
|
| Portfolio |
.. |
.. |
.. |
2.5 |
4.8 |
-0.4 |
1.0 |
|
| Debt |
2.8 |
46.1 |
5.8 |
20.4 |
61.3 |
-1.1 |
3.5 |
|
| Middle East & North Africa |
||||||||
| FDI |
0.3 |
-2.8 |
2.1 |
2.8 |
-0.6 |
2.5 |
3.0 |
|
| Portfolio |
.. |
.. |
.. |
.. |
0.1 |
0.2 |
.. |
|
| Debt |
0.5 |
8.7 |
12.8 |
0.8 |
2.7 |
-6.5 |
-0.3 |
|
| South Asia |
||||||||
| FDI |
0.1 |
0.2 |
0.3 |
0.5 |
2.9 |
3.1 |
5.0 |
|
| Portfolio |
.. |
.. |
.. |
0.1 |
1.6 |
1.7 |
0.8 |
|
| Debt |
0.8 |
5.8 |
5.7 |
8.4 |
2.5 |
3.4 |
0.9 |
|
| Sub-Saharan Africa |
||||||||
| FDI |
0.4 |
0.1 |
1.0 |
1.0 |
4.3 |
6.1 |
7.0 |
|
| Portfolio |
.. |
.. |
.. |
.. |
2.9 |
4.0 |
0.7 |
|
| Debt |
0.9 |
10.1 |
5.3 |
7.1 |
7.6 |
-0.9 |
0.2 |
|
| Memo: |
||||||||
| Middle income |
||||||||
| FDI |
1.9 |
4.8 |
10.5 |
21.5 |
91.4 |
154.9 |
– |
|
| Portfolio |
.. |
.. |
.. |
4.0 |
17.1 |
25.6 |
– |
|
| Debt |
4.1 |
76.6 |
31.1 |
34.1 |
132.5 |
-2.5 |
– |
|
| .. : Nil / Negligible. |
— |
: Not Available. |
||||||
| Source : Global Development Finance, World Bank, 2003. |
||||||||
domestic policy reform in the developing world. There has been a debate in the literature whether the surge is driven primarily by domestic or by external factors. The literature on determinants of cross-country capital flows has identified various factors which, inter alia, include the overall macroeconomic scenario, political risk perception, regulatory regime, fiscal concessions and business strategy of the entity from which the capital flow originates. The literature usually distinguishes between two broad sets of factors affecting capital movements, viz., (i) country-specific 'pull' factors reflecting domestic opportunity and risk, and (ii) global or 'push' factors such as the stimulus provided by the decline of US interest rates that has taken place in recent years.
REPORT ON CURRENCY AND FINANCE
6.13 A survey of the accumulated formal evidence on this issue highlights that pull or domestic factors operating at project and country levels, reflect essentially the improved policies that increase the long-run expected return or reduce the perceived risk on real domestic investment. These include measures that increase the openness of the domestic financial market to foreign investors; liberalisation of FDI; credible structural or macroeconomic policies; sustainable debt and debt service reduction ensuring timely repayments; stabilisation policies that affect the aggregate efficiency of resource allocation; policies that affect the level of domestic absorption relative to income; and the ability of the economy to absorb shocks from changes in international terms of trade (Fernandez-Arias and Montiel, 1996). FDI may be attracted by the opportunity to use local raw materials or employ a local labour force that are relatively cheap. The push or exogenous factors include lower foreign interest rates, recession abroad and herd mentality in international capital markets.
6.14 Views differ on the relative importance of the push and pull factors. It is often argued that the new wave of private capital inflows is being 'pushed' by external factors and is, therefore, beyond the control of policymakers in developing countries (Calvo et al., 1993 and Fernandez-Arias and Montiel, 1995). On the other hand, Chuhan et al. (1993) find, using panel data for 1988-92, that portfolio flows to a sample of Latin American and Asian countries are equally sensitive to push and pull factors. They also find that equity flows, relative to bond flows, are more responsive to global factors; bond flows, however, are more responsive to a country’s credit rating and to the secondary market price of debt. An assessment of the empirical evidence suggests a role for both push and pull factors. While the push factors can explain the timing and magnitudes of capital inflows, the pull factors determine the geographic distribution of the flows amongst the recipient economies (Montiel and Reinhart, 1999).
6.15 It is notewor thy that an overwhelming proportion of international capital flows towards developing countries is directed towards middle-income countries. Notwithstanding fluctuations over the years, this concentration has increased, especially with regard to FDI and portfolio flows. In particular, share of East Asia and Pacific region in portfolio investment has increased. Inflow of debt-creating capital towards developing countries declined sharply in the wake of the East Asian crisis. In 2002, East Asia and Pacific turned into net exporters of debt-creating capital flows (Table 6.2).
| Table 6.2: Region-wise Share of FDI, Portfolio and Debt Flows to Developing Countries |
|||||||
| (Per cent) |
|||||||
| Region |
1970 |
1980 |
1985 |
1990 |
1995 |
2000 |
2002 |
| 1 |
2 |
3 |
4 |
5 |
6 |
7 |
8 |
| East Asia & Pacific |
|||||||
| FDI |
9.1 |
24.8 |
23.6 |
42.9 |
48.6 |
27.4 |
39.9 |
| Portfolio |
.. |
.. |
.. |
36.1 |
45.2 |
74.1 |
57.6 |
| Debt |
15.1 |
12.4 |
21.5 |
32.7 |
35.7 |
.. |
-115.0 |
| Europe & Central Asia |
|||||||
| FDI |
2.6 |
0.5 |
1.0 |
5.1 |
16.1 |
18.2 |
20.3 |
| Portfolio |
.. |
.. |
.. |
5.9 |
8.4 |
4.6 |
14.9 |
| Debt |
7.8 |
14.1 |
12.5 |
4.0 |
15.4 |
.. |
155.1 |
| Latin America & Caribbean |
|||||||
| FDI |
53.7 |
120.7 |
48.2 |
33.9 |
28.9 |
47.2 |
29.4 |
| Portfolio |
.. |
.. |
.. |
56.6 |
23.6 |
-1.5 |
10.6 |
| Debt |
44.1 |
48.0 |
12.9 |
35.3 |
40.4 |
.. |
48.7 |
| Middle East & North Africa |
|||||||
| FDI |
11.7 |
-52.8 |
17.1 |
11.7 |
-0.5 |
1.5 |
2.1 |
| Portfolio |
.. |
.. |
.. |
0.1 |
0.3 |
0.9 |
0.3 |
| Debt |
7.5 |
9.1 |
28.5 |
1.3 |
1.8 |
.. |
-4.2 |
| South Asia |
|||||||
| FDI |
3.1 |
3.7 |
2.1 |
2.2 |
2.8 |
1.9 |
3.5 |
| Portfolio |
.. |
.. |
.. |
2.3 |
7.8 |
6.4 |
8.5 |
| Debt |
12.4 |
6.0 |
12.8 |
14.5 |
1.7 |
.. |
11.9 |
| Sub-Saharan Africa |
|||||||
| FDI |
20.1 |
2.3 |
7.9 |
4.2 |
4.1 |
3.8 |
4.9 |
| Portfolio |
.. |
.. |
5.7 |
.. |
14.6 |
15.5 |
7.7 |
| Debt |
13.4 |
10.5 |
11.7 |
12.2 |
5.0 |
.. |
3.4 |
| Note : Figures against FDI under a particular region in this table are per cent to total |
|||||||
| portfolio and debt flows are per cent to total portfolio flows and total debt flows to |
|||||||
| .. : Nil / Negligible. |
|||||||
| Source : Global Development Finance, World Bank, 2003. |
|||||||
MANAGEMENT OF CAPITAL FLOWS
6.16 A new feature emerging in the context of capital flows to developing countries is the recycling of such flows, particularly from EMEs of Asia, mainly to the US. The US has accumulated twin deficits - current account deficit (CAD) of five per cent of GDP and fiscal deficit of six per cent (a sharp turnaround from a surplus of 1.2 per cent in 2000). Ironically, it is the developing countries of Asia who are funding the CAD of the US and exhibiting current account surpluses. In contrast to the earlier situation when the fiscal deficits in the US were largely financed by the domestic private sector, now the central banks of Asia are financing the bulk of the US fiscal deficits as well. While the growing imbalance of the US economy is increasingly recognised as being unsustainable, there are no shortcut solutions since the problems are deep, structural and inter-dependent. These cannot be solved through independent or unilateral action. Hence, relatively coordinated medium-term action is called for among the major economies of the world (Mohan, 2003).
Capital Flows: The Balance Sheet Approach
6.17 Weaknesses in certain sectoral balance sheets like the government sector, financial sector including banks and financial institutions, non-financial private sector including corporates and households could lead to a country-wide balance of payments crisis. Yet they may not be visible in a country’s aggregate balance sheet as evident from traditional macroeconomic aggregates. The balance sheet approach pays particular attention to the balance sheets of key sectors of the economy and explores how weaknesses in one sector can cascade and ultimately generate a broader crisis.
6.18 The balance sheet approach is focussed on identifying financial inter-linkages, imbalances, vulnerabilities and risks in the economy. It focuses on four types of balance sheet mismatches which help to determine a country’s ability to service debt in face of shocks: (i) maturity mismatches; (ii) currency mismatches; (iii) capital structure problems - heavy reliance on debt rather than equity financing; and (iv) solvency problems - the present value of the future revenue streams being insufficient to cover liabilities including contingent liabilities. These mismatches can lead to solvency risk, but solvency risk can also arise from simply borrowing too much or from investing in low yielding assets (Allen et al., 2002).
6.19 The composition and size of the liabilities and assets of the financial balance sheet are crucial as they can be an important source of vulnerability in EMEs with large private capital flows. Large capital inflows are often associated with an increase in asset prices, inflationary pressures, appreciation of the real exchange rate, and deterioration in current account of the balance of payments. This happens not only when the inflows themselves lead to an appreciation of the real exchange rate that, in turn, leads to the so-called Dutch disease, but also when the inflows result in large accumulated external debt which the recipient country may find difficult to service. There is also a danger, as was evident in the recent East-Asian crisis, that capital inflows could lead to speculative investment aided by a rampant surge in domestic lending and asset prices. Increased financing of unsustainable consumption, especially as reflected by the widening current account deficit also engenders a similar risk. Such developments, in turn, induce further capital inflows leading to real appreciation of the exchange rate. If real appreciation takes place, it could lead to larger inflows unless domestic interest rates are brought down commensurately. Such softening of interest rates could, however, lead to a rise in bank liquidity and credit creation directed towards riskier areas. Subsequently, the post-inflow equilibrium is established when the increase in the inflows is matched by a deterioration in the current account and/or by a rise in the foreign exchange reserves.
6.20 Large capital inflows could lead to a situation where long-term capital flows get supplemented by short-term flows which are inherently volatile and unpredictable. In this context, an open capital account and integrated financial system exacerbate concerns about asset quality - which can provoke creditors to shift towards foreign assets leading to capital outflows - and thus, reinforce the importance of the balance sheet approach. This approach is seen to be better suited to understand the vulnerabilities associated with an open capital account and the dynamics of capital account crises. Models of exchange rate crisis - both Krugman’s first generation and Obstfeld’s second generation models - provided rich analytical lessons for conducting macroeconomic policies in open economies. The ‘second generation’ crisis models developed after the ERM crisis in 1992 and the Mexican crisis in 1994-95 can be seen to have first formally recognised the role of multiple equilibria where good equilibria can suddenly change to bad equilibria, because of sudden shift in sentiments of market participants. Following the experience of the East Asian crisis of 1997-98, where private sector vulnerabilities rather than fiscal imbalances played a key role in precipitating the crisis, ‘third generation’ models have been explicitly based on this analysis. The third generation models have explicitly brought to the fore the role of balance sheet mismatches in causing financial crises.
REPORT ON CURRENCY AND FINANCE
II. CAPITAL FLOWS TO INDIA
6.21 Following liberalisation and structural adjustment since 1991, India has embarked on a policy of encouraging capital flows in a cautious manner. The strategy has been to encourage long-term capital inflows and discourage short-term and volatile flows. Broadly speaking, India’s approach towards external capital flows could be divided into three main phases. In the first-phase, starting at the time of Independence and spanning up to the early 1980s, India’s reliance on external flows was mainly restricted to multilateral and bilateral concessional finance. Subsequently, however, in the context of the widening of the current account deficit during the 1980s, India supplemented the traditional external sources of financing with recourse to commercial loans including short-term borrowings and deposits from non-resident Indians (NRIs). As a result, the proportion of short-term debt in India’s total external debt increased significantly by the late 1980s.
6.22 Until the 1980s, India’s development strategy was focused on self-reliance and import-substitution. There was a general disinclination towards foreign investment or private commercial flows. Since the initiation of the reform process in the early 1990s, however, India’s policy stance has changed substantially. India has encouraged all major forms of capital flows, though with caution from the viewpoint of macroeconomic stability. The broad approach to reform in the external sector after the Gulf crisis was delineated in the Report of the High Level Committee on Balance of Payments (Chairman: C. Rangarajan). It recommended, inter alia, a compositional shift in capital flows away from debt to non-debt creating flows; strict regulation of external commercial borrowings, especially short-term debt; discouraging volatile elements of flows from non-resident Indians; gradual liberalisation of outflows; and dis-intermediation of Government in the flow of external assistance. In the 1990s, foreign investment has accounted for the major part of capital inflows to the country. The broad approach towards foreign direct investment has been through a dual route, i.e., automatic and discretionary, with the ambit of the automatic route progressively enlarged to many sectors, coupled with higher sectoral caps stipulated for such investments. Portfolio investments are restricted to select players, viz., Foreign Institutional Investors (FIIs). The approach to external commercial borrowings has been one of prudence, with self imposed ceilings on approvals and a careful monitoring of the cost of raising funds as well as their end use. External commercial borrowings are also subject to a ‘dual route’; these can be accessed without any discretionary approvals up to a limit, beyond which specific approvals are needed from the Reserve Bank/Government. Short-term credits above US $ 20 million require prior approval of the Reserve Bank. In respect of NRI deposits, some control over inflows is exercised through specification of interest rate ceilings. In the past, variable reserve requirements were stipulated to modulate such flows. At present, however, reserve requirements are uniform across all types of deposit liabilities.
6.23 As regards external assistance, both bilateral and multilateral flows are administered by the Government of India and the significance of official flows has declined over the years. Thus, in managing the external account, adequate care is taken to ensure a sustainable level of current account deficit, limited reliance on external debt, especially short-term external debt. Non-debt creating capital inflows in the form of FDI and portfolio investment through FIIs, on the other hand, are encouraged. A key aspect of the external sector management has, therefore, been careful control over external debt since 1990s (Reddy, 1998). India has adopted a cautious policy stance with regard to short-term flows, especially in respect of the debt-creating flows. It is worth noting that many countries had earlier viewed appropriate maturity structure of cross-border flows as a part of micro decision-making process. This, however, is increasingly being recognised as a macro factor with crucial implication for financial stability (Reddy, 1999).
6.24 In respect of capital outflows, the approach has been to facilitate direct overseas investment through joint ventures and wholly owned subsidiaries and provision of financial support to promote exports, especially project exports from India. Resident corporates and registered partnership firms have been allowed to invest up to 100 per cent of their net worth in overseas joint ventures or wholly owned subsidiaries, without any separate monetary ceiling. Exporters and exchange earners have also been given permission to maintain foreign currency accounts and use them for permitted purposes which facilitate their overseas business promotion and growth. Thus, over time, both inflows and outflows under capital account have been gradually liberalised.
6.25 Since the introduction of reforms in the early 1990s, India has witnessed a significant increase in
MANAGEMENT OF CAPITAL FLOWS
| Table 6.3: Composition of Capital Inflows to India |
|||||||||||
| Variable |
1990-91 |
1995-96 |
1996-97 |
1997-98 |
1998-99 |
1999-00 |
2000-01 |
2001-02 |
2002-03 |
||
| 1 |
2 |
3 |
4 |
5 |
6 |
7 |
8 |
9 |
10 |
||
| Total Capital Inflows (Net) |
7.1 |
4.1 |
12.0 |
9.8 |
8.4 |
10.4 |
10.0 |
10.6 |
12.1 |
||
| (US $ billion): |
|||||||||||
| Composition of Capital flows (Per cent to total) |
|||||||||||
| 1. |
Non-debt Creating Inflows |
1.5 |
117.5 |
51.3 |
54.8 |
28.6 |
49.7 |
67.8 |
77.1 |
46.6 |
|
| a) |
Foreign Direct Investment |
1.4 |
52.4 |
23.7 |
36.2 |
29.4 |
20.7 |
40.2 |
58.0 |
38.5 |
|
| b) |
Portfolio Investment |
0.1 |
65.1 |
27.6 |
18.6 |
-0.8 |
29.0 |
27.6 |
19.1 |
8.1 |
|
| 2. |
Debt Creating Inflows |
83.3 |
57.7 |
61.7 |
52.4 |
54.4 |
23.1 |
59.4 |
9.2 |
-10.6 |
|
| a) |
External Assistance |
31.3 |
21.6 |
9.2 |
9.2 |
9.7 |
8.6 |
4.3 |
11.4 |
-20.0 |
|
| b) |
External Commercial |
||||||||||
| Borrowings # |
31.9 |
31.2 |
23.7 |
40.6 |
51.7 |
3.0 |
37.2 |
-14.9 |
-19.4 |
||
| c) |
Short- term Credits |
15.2 |
1.2 |
7.0 |
-1.0 |
-8.9 |
3.6 |
1.0 |
-8.4 |
8.1 |
|
| d) |
NRI Deposits |
21.8 |
27.0 |
27.9 |
11.4 |
11.4 |
14.7 |
23.1 |
26.0 |
24.6 |
|
| e) |
Rupee Debt Service |
-16.9 |
-23.3 |
-6.1 |
-7.8 |
-9.5 |
-6.8 |
-6.2 |
-4.9 |
-3.9 |
|
| 3. |
Other Capital @ |
15.2 |
-75.2 |
-13.0 |
-7.2 |
17.0 |
27.2 |
-27.2 |
13.7 |
64.0 |
|
| 4. |
Total (1 to 3) |
100.0 |
100.0 |
100.0 |
100.0 |
100.0 |
100.0 |
100.0 |
100.0 |
100.0 |
|
| Memo: |
|||||||||||
| Stable flows* |
84.7 |
33.7 |
65.4 |
82.4 |
109.7 |
67.4 |
71.4 |
89.3 |
83.8 |
||
| # |
: |
Refers to medium and long-term borrowings |
|||||||||
| @ |
: |
Includes leads and lags in exports (difference between the custom and the banking channel data), banking capital |
|||||||||
| institutions and quota payment to IMF. |
|||||||||||
| * |
: Stable flows are defined to represent all capital flows excluding portfolio flows and short-term credits |
||||||||||
| Note : Data on FDI have been revised since 2000-01 with expanded coverage to approach international best practices. |
|||||||||||
| Source : Reserve Bank of India. |
|||||||||||
cross-border capital flows. The net capital inflows have more than doubled from an average of US $ 4 billion during the 1980s to an average of about US $ 9 billion during 1993-2000. The proportion of non-debt flows in total capital flows has increased from about 5 per cent in the latter half of the 1980s to about 43 per cent during 1990s (Table 6.3). Notwithstanding a significant increase in overall capital inflows, particularly foreign investment during the 1990s, these remain smaller than other countries of similar economic size.
6.26 Capital flows have witnessed shar p occasional swings, which have engendered an appropriate policy response: the policy measures include changes in reserve requirements for financial entities, variations in the pace and sequencing of the reform measures and revisions in conditions governing end-use of external funds. Coordinated policy actions involving signalling changes, open market operations and sterilisation of foreign inflows were also undertaken to prevent undue pressure on the exchange rate (see Section IX). Measures have also been taken to deepen and widen the foreign exchange market (see Chapter VII). The basic objective has been to maintain orderly conditions in the financial markets and to ensure that capital flows promote efficiency without having an adverse impact on economic stability.
III. FOREIGN DIRECT INVESTMENT
6.27 Most developing countries consider FDI as an important channel for accessing resources for economic development. FDI represents transfer of a bundle of assets like capital, technology, access to export markets, skills and management techniques and modern environmental management systems. It may be noted, however, that a liberal policy towards FDI inflow is necessary, but not sufficient for reaping the benefits of globalisation. Market failures may occur for attracting FDI flows and the governments may have to intervene as they may face trade-offs between different benefits and objectives.
REPORT ON CURRENCY AND FINANCE
6.28 There is no ideal strategy with respect to the use of FDI that is applicable to all countries at all times. Any good strategy must be context specific, reflecting a country’s level of economic development, the resource base, the specific technological context, the competitive setting, and the government’s capabilities to implement policies. For instance, countries like Malaysia, Singapore and Thailand pursued policies to rely substantially on FDI, while integrating the economy into transnational corporations (TNCs) production networks and promoting competitiveness by upgrading within those networks. On the other hand, China and Korea pursued policies to develop domestic enterprises and autonomous innovative capabilities, relying on TNCs mainly as sources of technology.
6.29 Economic benefits of FDI are generally difficult to measure with precision. Over the last two decades there has been a change in the approach towards assessing the impact of FDI flows on the recipient economy. In the earlier approaches, the impact of FDI on growth was found to be limited in the short-run since long-term growth was largely considered to be contingent upon technological progress (Grossman and Helpman, 1991). On the other hand, according to the more recent endogenous growth theory, FDI is considered as a composite of capital, know-how and technology (Balasubramanyam et al., 1996). Under this approach, FDI can have a permanent positive impact on economic growth by generating increasing returns to scale through externalities and positive productivity spillovers (de Mello, 1997). The positive impact of FDI is likely to be higher as value-addition under FDI increases. Apart from increasing capital formation, FDI is expected to encourage use of new inputs and technology in the recipient economy. In addition, FDI or even purely technical collaborations have been considered as a vehicle for change in management practices and organisational arrangements in the recipient developing countries (de Mello and Sinclair, 1995).
6.30 A related contentious issue revolves around the direction of causation between productivity and FDI. Cross-country studies are not conclusive in this regard. Empirical investigations have found that the positive impact of FDI is generally higher for recipient countries with a higher level of development (Blomstorm et al., 1994). Such findings support the arguments that in the absence of a minimum threshold level of development, the positive impact of FDI would remain confined to particular FDI enclaves of the economy (Borensztein et al., 1995). Moreover, the benefits of FDI can be realised fully only if the economy’s savings rate is less than domestic investment, i.e., in the context of a current account deficit. On the other hand, if the absorptive capacity of the economy is weak, higher FDI inflows could end up in higher foreign exchange reserves. The spillover effect of FDI is also found to be the highest in industries with high level of technical development and low concentration of foreign firms. Indigenous technological capabilities have been found to be positively associated with technology import, research and development in the recipient country, output growth and manufacturing exports (Zhao, 1995). Some studies have found that compared with firms under pure domestic ownership, FDI firms generally have higher capital intensity, exports to sales ratio and imported input component (O’Sullivan, 1993). There is, however, a tendency of technology imports to shift from physical capital-intensive to human capital-intensive type over time.
A Primer on the Determinants of FDI
6.31 The motivation and determinants of FDI differ among countries and across economic sectors. These factors include the policy framework, the extent of business facilitation and other economic determinants such as macroeconomic fundamentals and availability of infrastructure (Box VI.1).
6.32 Most studies conclude that FDI is a relatively stable type of capital flow (Radelet and Sachs, 1998). During the period 1992-97, commercial bank loans displayed the highest volatility, as measured by the coefficient of variation, followed by portfolio investment and FDI. Another study in respect of 12 major developing economies and countries in transition for the same period, based on annual data, confirmed that the volatility of foreign portfolio investment was generally higher than that of FDI (UNCTAD, 1998).
Trend in Global FDI Flows
6.33 Most FDI has been directed towards the developed world, although the share of developing countries had been growing steadily until 1997, when it reached a peak of around 40 per cent (Tables 6.4 and 6.5). Three important features characterise FDI flows to EMEs in the 1990s. First, there was a rapid increase in FDI inflows in the 1990s, owing largely to the adoption of macroeconomic and structural reforms by a number of these countries and the strengthening of their growth prospects. Second, the surge in FDI, especially in the latter half of the 1990s, was led by increased merger and acquisition activity. A number of EMEs in Latin America and Eastern Europe –
MANAGEMENT OF CAPITAL FLOWS
Box VI.1
Host Country Determinants of FDI
I. Policy Framework
• Economic, political and social stability
• Rules regarding entry and operations
• Standards of treatment of foreign affiliates
• Policies on functioning and structure of markets (especially competition and M&A policies)
• International trade and investment agreements
• Privatisation policy
• Trade policy (tariffs and non-tariff barriers) and coherence of FDI and trade policies
• Tax policy
II. Economic Determinants (A+B+C) A. Market-seeking
• Market size and per capita income
• Access to regional and global markets
• Country-specific consumer preferences
• Structure of markets
B. Resource/asset-seeking
• Raw materials
• Low-cost unskilled labour
• Skilled labour
Source : World Investment Report, 1998.
• Technological, innovatory and other creative assets (i.e., brand names), including as embodied in individuals, firms and clusters
• Physical infrastructure (ports, roads, power, telecommunications)
C. Efficiency-seeking
• Cost of resources and assets listed under B, adjusted for productivity for labour resources
• Other input costs, e.g. transport and communications costs to/from and within host economy and costs of other intermediate products
• Membership of a regional integration agreement conducive to the establishment of regional corporate networks
III. Business Facilitation
• Investment promotion (including image-building and investment-generating activities and investment facilitation services)
• Investment incentives
• Hassle costs (corruption, administrative efficiency, etc.)
• Social amenities (bilingual schools, quality of life, etc.)
• Alternate investment services
including Argentina, Brazil, Mexico and the Czech Republic – undertook extensive privatisation of State-owned assets during this period which in many cases took the form of mergers and acquisitions. Third, for a number of countries there was a significant shift of FDI into the services sector in tandem with the
| Table 6.4: FDI Inflows by Host Region and Economy |
|||||||
| (US $ billion) |
|||||||
| Host Region/Economy |
1991-1996 |
1997 |
1998 |
1999 |
2000 |
2001 |
2002 |
| (Average) |
|||||||
| 1 |
2 |
3 |
4 |
5 |
6 |
7 |
8 |
| World |
254.3 |
481.9 |
686.0 |
1079.1 |
1393.0 |
823.8 |
651.2 |
| Developed Economies |
154.6 |
269.7 |
472.3 |
824.6 |
1120.5 |
589.4 |
460.3 |
| Central and Eastern Europe |
8.2 |
19.0 |
22.5 |
25.1 |
26.4 |
25.0 |
28.7 |
| Developing Economies |
91.5 |
193.2 |
191.3 |
229.3 |
246.1 |
209.4 |
162.1 |
| of which: |
|||||||
| Latin America and the Caribbean |
27.1 |
73.3 |
82.0 |
108.3 |
95.4 |
83.7 |
56.0 |
| Argentina |
4.3 |
9.2 |
7.3 |
24.0 |
11.7 |
3.2 |
1.0 |
| Brazil |
3.6 |
19.0 |
28.9 |
28.6 |
32.8 |
22.5 |
16.6 |
| Chile |
2.2 |
5.3 |
4.6 |
8.8 |
3.6 |
4.5 |
1.6 |
| Colombia |
1.3 |
5.6 |
2.8 |
1.5 |
2.2 |
2.5 |
2.0 |
| Mexico |
7.4 |
14.2 |
12.2 |
12.9 |
15.5 |
25.3 |
13.6 |
| Asia |
59.4 |
109.1 |
100.0 |
108.5 |
142.1 |
106.8 |
95.0 |
| China |
25.5 |
44.2 |
43.8 |
40.3 |
40.8 |
46.8 |
52.7 |
| Hong Kong, SAR |
6.1 |
11.4 |
14.8 |
24.6 |
61.9 |
23.8 |
13.7 |
| India |
1.2 |
3.6 |
2.5 |
2.2 |
4.0 |
6.1 |
4.7 |
| Indonesia |
3.0 |
4.7 |
-0.4 |
-2.7 |
-4.6 |
-3.3 |
-1.5 |
| Korea, Republic of |
1.2 |
2.8 |
5.4 |
9.3 |
9.3 |
3.5 |
2.0 |
| Malaysia |
5.4 |
6.3 |
2.7 |
3.9 |
3.8 |
0.6 |
3.2 |
| Philippines |
1.2 |
1.3 |
1.7 |
1.7 |
1.3 |
1.0 |
1.1 |
| Singapore |
6.9 |
13.5 |
7.6 |
13.2 |
12.5 |
10.9 |
7.7 |
| Taiwan, Province of China |
1.3 |
2.2 |
0.2 |
2.9 |
4.9 |
4.1 |
1.4 |
| Thailand |
2.0 |
3.9 |
7.5 |
6.1 |
3.4 |
3.8 |
1.1 |
| Source: World Investment Report, UNCTAD, 2003; |
|||||||
REPORT ON CURRENCY AND FINANCE
| Table 6.5: FDI Inflows by Host Region and Economy: Shares to Total |
|||||||
| (Per cent) |
|||||||
| Host Region/Economy |
1991-1996 |
1997 |
1998 |
1999 |
2000 |
2001 |
2002 |
| (Average) |
|||||||
| 1 |
2 |
3 |
4 |
5 |
6 |
7 |
8 |
| World |
100.0 |
100.0 |
100.0 |
100.0 |
100.0 |
100.0 |
100.0 |
| (Per cent share of World) |
|||||||
| Developed Economies |
60.8 |
56.0 |
68.8 |
76.4 |
80.4 |
71.5 |
70.7 |
| Central and Eastern Europe |
3.2 |
3.9 |
3.3 |
2.3 |
1.9 |
3.0 |
4.4 |
| Developing Economies |
36.0 |
40.1 |
27.9 |
21.2 |
17.7 |
25.4 |
24.9 |
| of which: |
(Per cent share of Developing Economies) |
||||||
| Latin America and the Caribbean |
29.6 |
37.9 |
42.9 |
47.2 |
38.8 |
40.0 |
34.5 |
| Argentina |
4.7 |
4.7 |
3.8 |
10.5 |
4.7 |
1.5 |
0.6 |
| Brazil |
4.0 |
9.8 |
15.1 |
12.5 |
13.3 |
10.7 |
10.2 |
| Chile |
2.4 |
2.7 |
2.4 |
3.8 |
1.5 |
2.1 |
1.0 |
| Colombia |
1.4 |
2.9 |
1.5 |
0.6 |
0.9 |
1.2 |
1.3 |
| Mexico |
8.0 |
7.3 |
6.4 |
5.6 |
6.3 |
12.1 |
8.4 |
| Asia |
64.9 |
56.5 |
52.3 |
47.3 |
57.7 |
51.0 |
58.6 |
| China |
27.8 |
22.9 |
22.9 |
17.6 |
16.6 |
22.4 |
32.5 |
| Hong Kong, SAR |
6.6 |
5.9 |
7.7 |
10.7 |
25.2 |
11.4 |
8.5 |
| India |
1.3 |
1.9 |
1.3 |
0.9 |
1.6 |
2.9 |
2.9 |
| Indonesia |
3.3 |
2.4 |
-0.2 |
-1.2 |
-1.8 |
-1.6 |
-0.9 |
| Korea, Republic of |
1.3 |
1.5 |
2.8 |
4.1 |
3.8 |
1.7 |
1.2 |
| Malaysia |
5.9 |
3.3 |
1.4 |
1.7 |
1.5 |
0.3 |
2.0 |
| Philippines |
1.3 |
0.7 |
0.9 |
0.8 |
0.5 |
0.5 |
0.7 |
| Singapore |
7.5 |
7.0 |
4.0 |
5.8 |
5.1 |
5.2 |
4.7 |
| Taiwan, Province of China |
1.4 |
1.2 |
0.1 |
1.3 |
2.0 |
2.0 |
0.9 |
| Thailand |
2.1 |
2.0 |
3.9 |
2.7 |
1.4 |
1.8 |
0.7 |
| Source: World Investment Report, UNCTAD, 2003; |
|||||||
increasing share of services activities in these host countries. It may be noted that traditionally, FDI was directed towards the development of natural resources and manufacturing enterprises.
6.34 After reaching a peak in 2000, global FDI inflows declined in the subsequent years. In 2002, a handful of countries like China, Brazil, Hong Kong, Mexico, Singapore, India and Malaysia accounted for around 70 per cent of total FDI flowing into developing countries (Table 6.5). The source of FDI in East Asia has predominantly been the region itself - Hong Kong and Taiwan together account for about 45 per cent of FDI in the major recipient countries in the region including China. These two sources are inseparable, since a significant amount of investment from Taiwan is channelled through Hong Kong and they together account for almost 70 per cent of FDI in China. After the East Asian Newly Industrialised Economies (NIEs), Japan ranks as the second largest investor in the region - its investments are spread more or less equally between China, Malaysia and Thailand.
Trends in Foreign Direct Investment in India
6.35 With the liberalisation of the capital account and the initiation of structural reforms, there has been a marked shift in the magnitude and instruments of capital flows to India during the 1990s, reflecting the
growing confidence among international investors. FDI to India which stood at a low level of US $ 97 million during 1990-91, picked up significantly thereafter, reaching a peak of US $ 6.1 billion in 2001-02 (Table 6.6). Cumulative foreign direct investment has been over US $ 30 billion over the period 1990-91 to 2002-03. FDI inflows have, however, slowed down in 2002-03 in tune with the global scenario.
6.36 At the global level, the financial sector accounts for the largest share of inward FDI followed by the trade sector. The position of financial services (banks, insurance, securities and other financial companies) as the top recipient has not changed over the past decade in view of increased financial liberalisation undertaken by many developing countries. Furthermore, in recent years, FDI in services has been growing at a faster rate than in other sectors. A discernable consistency in the source and direction of FDI flows to India has been evident in the 1990s. As regards the sources, inflows from Mauritius and USA dominated during most of 1990s. Many companies routed their investment to India through Mauritius to avail of the tax benefits under the bilateral tax treaty. The most favoured industries have been engineering and chemical and allied products in the 1990s. The services sector and computers have been attracting large FDI flows of late (Table 6.7).
MANAGEMENT OF CAPITAL FLOWS
| Table 6.6: Foreign Direct Investment Inflows into India |
|||||||||||
| (US $ million) |
|||||||||||
| Items |
1990-91 |
1995-96 |
1996-97 |
1997-98 |
1998-99 |
1999-00 |
2000-01 |
2001-02 |
2002-03 (P) |
||
| 1 |
2 |
3 |
4 |
5 |
6 |
7 |
8 |
9 |
10 |
||
| Total Foreign Direct Investment |
97 |
2,144 |
2,821 |
3,557 |
2,462 |
2,155 |
4,029 |
6,131 |
4,660 |
||
| I. |
Equity (a+b+c+d+e) |
– |
2,144 |
2,821 |
3,557 |
2,462 |
2,155 |
2,400 |
4,095 |
2,700 |
|
| a. Government (SIA/FIPB) – |
1,249 |
1,922 |
2,754 |
1,821 |
1,410 |
1,456 |
2,221 |
||||
| b.RBI – |
169 |
135 |
202 |
179 |
171 |
454 |
767 |
739 |
|||
| c.NRI – |
715 |
639 |
241 |
62 |
84 |
67 |
35 |
.. |
|||
| d.Acquisition of shares @ – |
11 |
125 |
360 |
400 |
490 |
362 |
881 |
916 |
|||
| e.Equity capital of unincorporated Bodies – |
– |
– |
– |
– |
61 |
191 |
126 |
||||
| II. |
Re-invested Earnings $– |
– |
– |
– |
– |
– |
1,350 |
1,646 |
1,498 |
||
| III. |
Other Capital $$– |
– |
– |
– |
– |
– |
279 |
390 |
462 |
||
| P : Provisional. |
|||||||||||
| – : Not Available. |
|||||||||||
| @ : Relates to acquisition of shares of Indian companies by non-residents under Section 5 of FEMA, 1999. |
|||||||||||
| $ : Data for 2002-03 are estimated as average of previous two years. |
|||||||||||
| Note : Data on FDI have been revised since 2000-01 with expanded coverage to approach international best practices. |
|||||||||||
| Source : Reserve Bank of India. |
|||||||||||
6.37 A recent study (Banga, 2003) based on firm level data for the period 1993-94 to 1999-2000 shows that Japan-affiliated FDI firms have higher average productivity growth as compared to domestic firms and US-affiliated firms. Moreover, US-affiliated firms rely mainly on technological improvements to achieve
| Table 6.7: Foreign Direct Investment to India: Country-wise and Industry-wise Inflows* |
|||||||||||
| (US $ million) |
|||||||||||
| Source/Industry |
1992-93 |
1993-94 |
1994-95 |
1995-96 |
1996-97 |
1997-98 |
1998-99 |
1999-00 |
2000-01 |
2001-02 |
2002-03 |
| 1 |
2 |
3 |
4 |
5 |
6 |
7 |
8 |
9 |
10 |
11 |
12 |
| Total |
280 |
403 |
877 |
1,418 |
2,057 |
2,956 |
2,000 |
1,581 |
1,910 |
2,988 |
1,658 |
| Country-wise Inflows |
|||||||||||
| Mauritius |
– |
– |
197 |
507 |
846 |
900 |
590 |
501 |
843 |
1,863 |
534 |
| USA |
22 |
99 |
203 |
195 |
242 |
687 |
453 |
355 |
320 |
364 |
268 |
| UK |
7 |
98 |
144 |
71 |
54 |
– |
– |
– |
61 |
45 |
224 |
| Germany |
21 |
35 |
35 |
100 |
166 |
151 |
114 |
31 |
113 |
74 |
103 |
| Netherlands |
21 |
47 |
45 |
50 |
124 |
159 |
53 |
82 |
76 |
68 |
94 |
| Japan |
26 |
37 |
95 |
61 |
97 |
164 |
235 |
142 |
156 |
143 |
66 |
| France |
9 |
10 |
14 |
– |
– |
– |
– |
– |
93 |
88 |
53 |
| Singapore |
3 |
10 |
25 |
60 |
76 |
– |
– |
– |
22 |
54 |
39 |
| Switzerland |
35 |
23 |
26 |
– |
– |
– |
– |
– |
8 |
6 |
35 |
| South Korea |
– |
– |
12 |
24 |
6 |
333 |
85 |
8 |
24 |
3 |
15 |
| Others |
136 |
45 |
76 |
351 |
446 |
562 |
470 |
462 |
194 |
280 |
227 |
| Industry-wise Inflows |
|||||||||||
| Chemical and Allied Products |
47 |
72 |
141 |
127 |
304 |
257 |
376 |
120 |
137 |
67 |
53 |
| Computers |
8 |
8 |
10 |
52 |
59 |
139 |
106 |
99 |
306 |
368 |
297 |
| Engineering |
70 |
33 |
132 |
252 |
730 |
580 |
428 |
326 |
273 |
231 |
262 |
| Electronics and Electrical |
|||||||||||
| Equipment |
33 |
57 |
56 |
130 |
154 |
645 |
228 |
172 |
213 |
659 |
95 |
| Finance |
4 |
42 |
98 |
270 |
217 |
148 |
185 |
20 |
40 |
22 |
54 |
| Food and Dairy Products |
28 |
44 |
61 |
85 |
238 |
112 |
19 |
121 |
75 |
49 |
35 |
| Pharmaceuticals |
3 |
50 |
10 |
55 |
48 |
34 |
28 |
54 |
62 |
69 |
44 |
| Services |
2 |
20 |
93 |
100 |
15 |
321 |
368 |
116 |
226 |
1,128 |
509 |
| Others |
85 |
79 |
276 |
348 |
292 |
720 |
262 |
553 |
578 |
395 |
309 |
| — : Negligible/Nil |
|||||||||||
| * : Data in this table exclude FDI inflows under the NRI direct investment route through the Reserve Bank and inflows |
|||||||||||
| Source : Annual Report, Reserve Bank of India (various issues). |
|||||||||||
REPORT ON CURRENCY AND FINANCE
productivity growth while the major thrust to productivity growth in Japan-affiliated firms emanates from efficiency improvements. The study also highlights the fact that domestic firms are catching up with higher productivity levels of foreign firms in the same industry.
Foreign Direct Investment in China and India
6.38 India and China received large FDI flows in the 1990s. FDI flows to China are, however, ten times of that in respect of India (Table 6.8). The timing, pacing and content of FDI liberalisation and the overall development strategy in the two countries seem to account for the difference in FDI performance. India ranked 122nd in UNCTAD’s FDI Performance Index. China was placed much higher at the 54th position. A recent business environment survey indicated that China is more attractive than India in terms of the macroeconomic environment, market opportunities and policy orientation towards FDI. India, on the other hand, scored better on the political environment, taxes and financing (EIU, 2003). A confidence tracking survey in 2002 indicated that China was the top FDI destination, displacing the United States for the first time in the investment plans of the TNCs surveyed; India ranked 15th in the survey (AT Kearney, 2002). A Federation of Indian Chambers of Commerce and Industry (FICCI) survey also suggests that China has a better FDI policy framework, market growth, consumer purchasing power, rate of return, labour law and tax regime than India (FICCI, 2003).
6.39 The differential performance of India and China in attracting the FDI inflows has been the subject of increasing attention at the international level (UNCTAD, 2003). A detailed analysis indicates that the difference in FDI inflows to India and China can be attributed partly to definitional and conceptual issues (Box VI.2).
6.40 Notwithstanding the differences in the quality of data, divergence in data coverage and treatment of various forms of capital inflows, differences in FDI flow towards China and India remain significant. Recent literature suggests that domestic market size is a major factor in inducing FDI inflows (IMF, 2003). At present, the Chinese economy is two and a half times that of the Indian economy while per capita income is twice as high. The growth induced local demand for durables and non-durables, competitive business environment, wage-adjusted productivity of labour, higher literacy, better infrastructure and education rates drive the efficiency seeking investors to China (UNCTAD, 2003). FDI in China is also driven by ‘peer pressure’ since many firms have followed their competitors into China to preserve their global market share. In contrast to the role of the Chinese business networks abroad and their significant investment in mainland China, the overseas networks and investment in India are much smaller (Bhalla, 2002).
6.41 Another major factor could be the earlier initiation of reform measures in China (1978) as compared to India (1991). Moreover, China’s manufacturing sector productivity is 1.6 times that of India and, in some sectors, as much as five times (McKinsey, 2001). Flexible labour laws, a better labour climate and entry and exit procedures for business, business-oriented and more FDI-friendly policies also make China an attractive destination
| Table 6.8: China and India: Selected FDI indicators |
||||||
| Item |
Country |
1990 |
2000 |
2001 |
2002 |
|
| 1 |
2 |
3 |
4 |
5 |
6 |
|
| 1. |
FDI Flows (US $ billion) |
China |
3.5 |
40.8 |
46.8 |
52.7 |
| India |
0.1 |
4.0 |
6.1 |
4.7 |
||
| 2. |
Inward FDI Stock (US $ billion) |
China |
24.8 |
348.3 |
395.2 |
447.9 |
| India |
1.5 |
21.0 |
27.1 |
31.8 |
||
| 3. |
Growth of FDI Inflows (Annual %) |
China |
2.8 |
1.1 |
14.9 |
12.5 |
| India |
-76.3 |
87.0@ |
52.2 |
-24.0 |
||
| 4. |
FDI Stock to GDP (%) |
China |
7.0 |
32.3 |
33.2 |
36.2 |
| India |
0.5 |
4.5 |
5.6 |
6.2 |
||
| 5. |
FDI Flows to Gross Fixed Capital |
China |
3.5 |
10.3 |
10.5 |
– |
| Formation (%) |
India |
0.1 |
3.9 |
5.8 |
– |
|
| 6. |
FDI Flows per Capita (US $) |
China |
3.0 |
32.0 |
36.5 |
40.7 |
| India |
0.1 |
3.9 |
5.9 |
4.5 |
||
| @: The large increase is due to change in definition. |
– : Not Available. |
|||||
| Source: World Investment Report, UNCTAD, 2003 and Reserve Bank of India. |
||||||
MANAGEMENT OF CAPITAL FLOWS
Box VI.2
Data Reporting on FDI: China and India
Arguably, a part of the difference in FDI inflows to India and China can be traced to data reporting. A sizable portion of the FDI in China is investment made by the resident Chinese from foreign locations - the so called 'round tripping' - and this takes place to a large extent due to special treatment extended by the Chinese authorities towards foreign investors vis-à-vis domestic investors. The round tripping is much smaller in India and takes place mainly through Mauritius for tax purposes. Estimates suggest that as much as 30 per cent of the reported FDIs in China may in fact be a result of round-tripping (UNCTAD, 2003).
The IMF definition of FDI includes as many as twelve different elements - equity capital, reinvested earnings of foreign companies, inter-company debt transactions, short-term and long-term loans, financial leasing, trade credits, grants, bonds, non-cash acquisition of equity, investment made by foreign venture capital investors, earnings data of indirectly-held FDI enterprises, control premium and non-competition fee. Until recently, Indian data on FDI did not include any other element other than equity capital reported on the basis of issue or transfer of equity or preference shares to foreign direct investors. China, on the other hand, includes all these in its definition of FDI. China also classifies imported equipment as FDI, whereas India includes these as imports in its trade data. In order to bring India’s FDI data reporting system into alignment with international best practices, a committee was constituted which recommended that apart from equity capital, reinvested earnings (retained earnings of FDI companies) and other direct capital (inter-corporate debt transactions between related entities) should be included in the data in keeping with international norms. After the incorporation of new items, FDI inflows into India during 2000-01 and 2001-02 were revised upwards by US $ 1.7 billion and US $ 2.2 billion, respectively. However, even after adjusting for round tripping in China and considering the new FDI data for India, the difference in FDI in China and India at US $ 40 billion and US $ 6 billion, respectively, in 2001 continues to remain considerable.
In this context, it is also important to point out that India receives large private transfers in the form of remittance inflows from non-residents and also capital inflows in the form of NRI deposits. In recent times, gross workers’ remittances to India per annum have been around US $ 13-14 billion while yearly net inflow in the form of NRI deposits is around US $ 3 billion. Inflow to China from Chinese diaspora, on the other hand, is recorded largely as FDI.
(AT Kearney, 2001). Investors underscore the predictability and stability of the tax system as an important factor in determining investment decisions. Higher import duties on raw materials in India result in higher prices of inputs, as most domestic players resort to import parity pricing. China has a flat 17 per cent VAT rate, while India’s indirect taxes range from 25 per cent to 30 per cent of the retail price for most manufactured products. The emergence of China as a member of World Trade Organisation (WTO) in 2001 is a stabilising anchor and has led to substantial liberalisation in the services sector.
6.42 It is also important to note that India and China focused on different types of FDI and pursued different strategies for industrial development. India encouraged FDI only in higher technology activities, whereas China favoured expor t-oriented FDI concentrated in manufacturing sector. China’s strategy is based on the premise that an increasing proportion of international trade is inter-firm trade between multinationals and between vertically integrated affiliates of the same multinational, and in such an environment there is no alternative to attracting FDI for export. China’s FDI-driven merchandise exports grew at an annual rate of 15 per cent between 1989 and 2001. In 1989, foreign affiliates accounted for less than nine per cent of total Chinese exports; by 2002
these accounted for half of the exports and in high tech industries the propotion was much higher (World Investment Report, 2003). In contrast, in India, given its product reservation policy for Small Scale Industries (SSIs), FDI is not permitted in SSI reserved products such as garments and toys, which has adverse implications for export growth. In India, exports by FDI companies grew at an average of around nine per cent during 1990-91 to 2001-02. A major factor in the growth of Chinese exports was the relocation of labour-intensive activities by TNCs to China. However, in India, this has happened mainly in the services sector. Almost all major US and European information technology firms have presence in India now. Foreign companies dominate India’s call centre industry, with a 60 per cent share of the annual US $ 1.5 billion turnover (World Investment Report, 2003).
6.43 Despite large FDI flows, restrictions on the organisational forms of FDI entry are still prevalent in China. For instance, in 31 industries the establishment of wholly foreign-owned enterprises is not allowed and the Chinese partners must hold majority shareholdings or a dominant position in another 32 sectors (OECD, 2002). A view has been expressed that China’s large absorption of FDI is not necessarily a sign of the strength of its economy; instead, it may be a sign of some, rather substantial, distortions (Huang, 2003). It is argued that FDI plays a major role in the Chinese economy due to systematic and pervasive discrimination against efficient and entrepreneurial domestic firms. Furthermore, unlike India, a vibrant private sector is absent in China and most of the foreign investors must perforce tie up with only state-owned behemoths for joint ventures.
Foreign Investment in India: A Policy Review
6.44 India’s policy regarding foreign investment can be broadly classified into four distinct phases: (i) cautious non-discrimination in controls during the period 1948 to mid/late 1960s; (ii) selective restrictions and control from the mid/late 1960s to the end 1970s with the promulgation of the Foreign Exchange Regulation Act (FERA), 1973 and the Industrial Licensing Policy, 1973, as the main instruments of control; (iii) gradual and partial liberalisation in the 1980s with special incentives for investment in export-oriented units; and, (iv) full-fledged liberalisation regarding foreign investment along with medium-term adjustment and long term structural reform that has been the hallmark since 1991.
REPORT ON CURRENCY AND FINANCE
6.45 Major changes in foreign investment policy were introduced in 1991 as a part of the economic reforms programme. Foreign investment is now freely allowed in all sectors including the services sector, subject to specified sectoral ceilings. Since 2000, all industries, except a small list, have been brought under the purview of the automatic route. Under the automatic route, prior approval is not required; only the reporting stipulations have to be met for monitoring purposes.1 The policy towards FDI inflows is reviewed regularly (Box VI.3). In mid-January 2004, the Central Government revised FDI limits in several sectors, including banking, petroleum and natural gas to create an enabling environment for FDI inflows along with infusion of new technologies and management practices. In case of private sector banks, for example, the FDI limit (including both direct and porfolio investment) has been hiked to 74 per cent. Concurrently, overseas investments in Joint Ventures (JVs) and Wholly Owned Subsidiaries (WOSs) have been recognised as important avenues for promoting global business by Indian entrepreneurs. Accordingly, rules and procedures on various aspects of Indian overseas investments have been liberalised significantly.
6.46 Although the importance of a strategic FDI policy has been underscored in recent years, cross-country experience suggests that there is no unique universal strategy. Any strategy needs to be dynamically consistent with the evolving changes in a country’s economic environment as well as its
Box VI.3
Report of the Steering Committee on Foreign Direct Investment
The Planning Commission constituted a Steering Committee on Foreign Direct Investment in 2001 to delve into various aspects of FDI inflows into India and suggest ways of improving their quantum while introspecting on causes for the low levels of existing FDI. The major recommendations of the Committee were:
• Enactment of Foreign Investment Promotion Law that incorporates and integrates aspects relevant to FDI promotion.
• FIPB may give initial Central level registrations and approvals where possible to hasten implementation. Foreign Investment Implementation Authority may be empowered to expedite the processing of administrative and policy approvals.
• States may enact special investment law relating to infrastructure to expedite investment therein and remove hurdles to its production.
• Aggregate FDI target for the Tenth Plan may be disaggregated in terms of various sectors and Ministries/
Departments for greater accountability. This would enable policy measures for specific sectors for greater FDI inflows.
• Sectoral FDI caps should be reduced to the minimum and also eliminate entry barriers except for defence industry.
• Company specific targeting approach rather than a broad approach should be practised. To this end, the Foreign Investment Promotion Council should be revamped.
• SEZs should be developed to be most competitive for export related FDI by simplifying applicable laws. The focus should be on accelerated/immediate implementation of reforms in SEZs rather than tax sops.
• Domestic policy reforms in the power sector, urban infrastructure and real estate and also de-control / delicensing should be expedited to promote investment - domestic and foreign.
1 Separate approvals, however, are required for foreign investment in sectors which require an industrial licence, proposals in which the foreign collaborator has a previous venture or a tie-up in India, proposals relating to the acquisition of shares in an existing Indian company and proposals outside the sectoral policy/caps, or under sectors in which FDI is not permitted.

شارك هذه الصفحة:


Install the RBI mobile application and get quick access to the latest news!


