 IST,
IST,


After a Decade - What do the Trends and Progress of Fiscal Management of Uttarakhand Suggest?
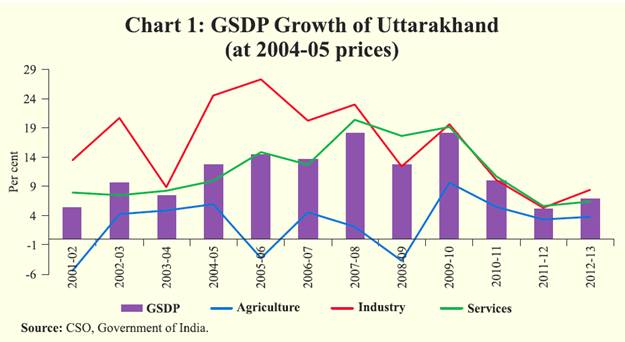
P. S. Rawat* This paper attempts to provide an overview of fiscal situation of the youngest Himalayan state of Uttarakhand after a decade since its inception in November 2000. Analysis reveals that the State has progressed rapidly to become one of the fastest growing regions in the country within a decade. During the same period, the annual per capita income in the State also increased to Rs.52642 in 2012-13 from Rs.18,910 in 2001-02. In order to accelerate the growth momentum further, priorities should be given to public policies that improve productive efficiency while ensuring the protection of the enriched biosphere keeping in view the potential of forest driven growth. Further, the paper assesses finances of Uttarakhand with the aim of understanding structural aspects of budgetary transactions. It also provides empirical results of the relationship between economic growth and components of revenues and expenditure and their likely projections under various growth scenarios. Based on fiscal management patterns observed, structural issues pertaining to fiscal management as well as State’s debt from the perspective of sustainability point of view are highlighted. Introduction The youngest Himalayan State of Uttarakhand also known as the ‘Dev-Bhoomi’ came into existence in November 2000 and became the 27th State of the Republic of India. After successful completion of a decade, this young state provides an opportunity to assess the progress made in several areas including that on the fiscal front. Nestled in the Himalayan ranges with vast repository of natural resources, the State has progressed rapidly to become one of the fastest growing regions in the country in a short span of time. The growth rate of Uttarakhand has reached 6.7 per cent in 2012-013 from 2.9 per cent in 2000. During the same period, the annual per capita income in the State also increased to Rs.52642 from Rs 18910. Uttarakhand has taken many remarkable initiatives to promote growth and employment in the state. In order to accelerate the growth momentum further, the State government should assign priorities to public policies that improve productive efficiency while ensuring the protection of the enriched biosphere. Keeping in view the importance of forest driven growth, the Eleventh Finance Commission had placed due emphasis on environment protection by recommending that Uttarakhand should be compensated for keeping sixty per cent of the land under forest with special schemes for unemployed youth with an incentive to take up self-employment in forest and agriculture based allied activities. On the whole, an ecologically sustainable development in the State must continue with the encouragement to investments in hydro-power, tourism, agro-processing and horticulture, information technology, bio-technology and small & medium industries. Thus in such States with special characteristics, the public policy becomes critical for supporting sustainable growth and setting priorities and targets with the needs of various sectors in the state economy. As a general rule, while the major part of the expenditure should be devoted to the creation of environmental friendly productive assets, the taxation policies should use innovative mechanisms for increasing revenue yield without compromising the principle of equity. At the same time, there is imperative need to maintain state finances in a healthy shape with avoidance of unsustainable build up of debt so that revenue receipts of the State are productively deployed and not largely appropriated by interest or non-essential expenses. It is encouraging to note that the State has been taking forward fiscal reforms in due earnest. Based on the Twelfth Finance Commission recommendation, the government enacted the Fiscal Responsibility and Budget Management (FRBM) Act in October 2005. According to the Act, the State government was expected to bring the revenue deficit to zero and bring down the fiscal deficit to 3.0 percent of Gross State Domestic Product (GSDP) by March-2009. The Act also mandated that the State government shall bring down the ratio of debt to GSDP to 25 per cent by 2015. Introduction of VAT and a new pension scheme, imposition of ceiling on guarantees and constitution of consolidated sinking fund and guarantee redemption fund further contributed to better fiscal management of Uttarakhand. However, continuing fiscal rectitude not only requires monitoring the quality of public expenditures but also cutting down unproductive expenditure to ensure stable and sustainable fiscal environment consistent with equitable growth. This paper undertakes a technical assessment of the performance of government finances of Uttarakhand since its inception with the aim of understanding structural aspects of budgetary transactions. Section I reviews the macroeconomic performance of the state over the decade followed by Section II providing an overview of the fiscal situation in Uttarakhand. Section III discusses structural issues that come to light in respect of the patterns observed in Section II. Section IV provides empirical results of the relationship between economic growth and components of revenues and expenditure and their likely projections under various growth scenarios. Section V presents analysis of State debt from the point of view of its sustainability. Section I Since its inception, average annual growth in Uttarakhand has remained at 11.2 per cent, highest among Himalayan States of India (Chart 1). In terms of sectoral composition of GSDP, the shares of services and industry have increased, while the share of agriculture & allied activities has decreased (Table 1). Nevertheless, Uttarakhand is still an agriculture dominant economy.
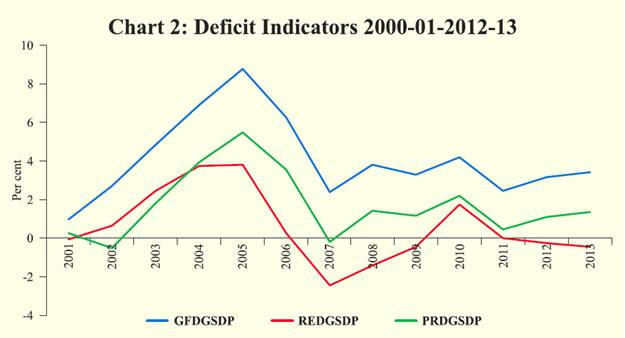
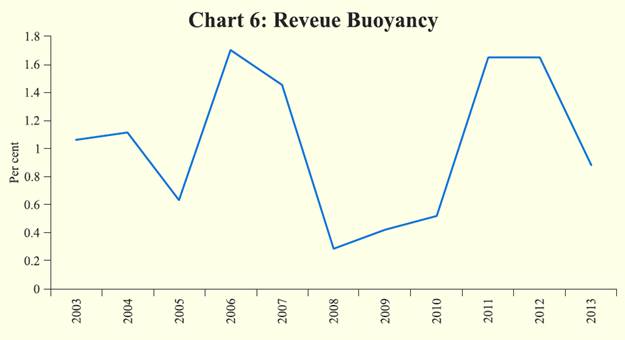
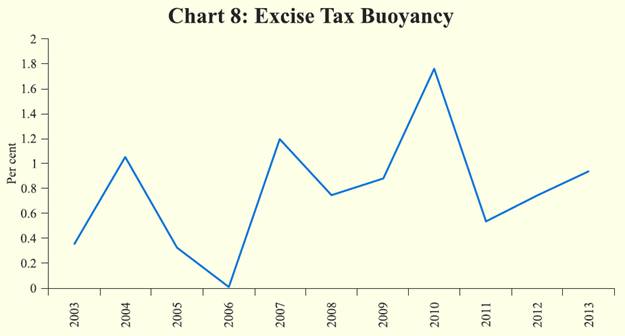
Primary sector in Uttarakhand is well diversified across major components of agriculture, forestry and mining. However, the State has attained a low growth rate of less than 2 per cent in almost all components of primary sector including agriculture. Only forestry and logging has grown over the above national average. State’s secondary sector is in advantageous position due to substantial contribution of two components, viz. (i) construction and (ii) electricity, gas and water supply. Uttarakhand has great potential to produce and sell electricity, given its vast resources of hydropower. Registered as well as unregistered manufacturing sectors have very low base in the state as compared to the national economy. Although, during 2003-04 to 2005-06, the registered manufacturing sector contributed significantly to the economy but it started decelerating thereafter. Of late, deceleration in this sector reflects the impact of global financial crisis. In the tertiary sector, Uttarakhand reveals clear advantage in community and social services due to high expenditure on account of public administration. Apart from impressive growth rate registered by Uttarakhand over the decade, it lacks in critical areas such as trade, hotel and restaurant, transport and communication, which are the most important factors for expanding the base of services sector and creating infrastructure for tourism in the State. Section II The demarcation of the State of Uttrarakhand resulted in the division of revenue and financial assets/liabilities of Uttar Pradesh under the provisions of Uttar Pradesh Reorganisation Act promulgated in 2000. The Uttar Pradesh Reorganisation (UPR) Act, 2000 provided the criteria for distribution of revenues, authorisation of expenditure and apportionment of assets and liabilities. Accordingly, the State was burdened with total liability of Rs.3,185.91 crore, which included Rs.1,113.86 crore as internal debt, Rs. 1,619.74 crore as loans and advances from Central Government and small savings, and Rs. 432.31 crore as liabilities under provident fund, etc. This led to an accumulated deficit of Rs. 3,630.27 crore at the end of the financial year 2000-01. The assets comprised of capital outlays, loans and advances given by the State government and the cash balances. Besides, the benefits available under ‘Special Category Status’ (SCS) were available only after an interregnum of two years in 2002-03. This paper assesses fiscal performance covering the period from 2000-01 to 2012-13. From analytical perspective, the sample period is divided into two sub-periods namely the pre-FRBM period from 2000- 01 to 2005-06 and the post FRBM period from 2006-07 to 2012-13. The State finances data available from the Reserve Bank of India have been used for analysis. For each of these time periods, simple averages of key fiscal indicators have been computed to assess the fiscal stress in the State. The picture that emerges from Table 2 shows that in terms of GFD/ GSDP, a measure of fiscal soundness, Uttrarakhand appears to have performed well in the post FRBM period. The fiscal deficit to gross state domestic product (GSDP) ratio of the State declined from 5.1 per cent in first (pre-FRBM) period to 3.2 per cent in the second (post-FRBM) period. A similar progress was seen in terms of revenue account which turned into surplus during 2006-07 to 2012-13. Not only the tax-GSDP ratio in Uttarakhand was highest among special category States, it was also above the national average. Thus, satisfied with the performance, the Thirteenth Finance Commission has not recommended any targeted increases in the tax-GSDP ratio until 2014-15. Moreover, considering the excellent fiscal performance of special category States including Uttarakhand that have eliminated non-plan revenue deficits, the Thirteenth Finance Commission noted that “this marks major progress by these States, particularly, in view of the known cost disabilities and other challenges that special category States face”. Overall, this suggests that the state has been following the spirit of the FRBM Act in its right earnest. The budget estimates for 2012-13, however, show a sharp jump in non-plan revenue expenditure by as much as one and half the times of the level in 2008-09. Nevertheless, the gap between revenue receipts and non-plan revenue expenditure still remains in surplus, thereby preserving the State’ eligibility of availing performance incentive grants announced by the Thirteenth Finance Commission. Section III The trend in three key deficit indicators namely, (i) Gross Fiscal Deficit to GSDP ratio (GFDGSDP), (ii) Revenue Deficit to GSDP ratio (REDGSDP) and, (iii) Primary Deficit to GSDP ratio (PRDGSDP) is shown in Chart 2. All the three ratios have shown consistent deterioration until 2004-05 but improved thereafter as consequence of the enactment of the State FRBM Act in October 2005. The improvement was particularly discernible from 2005-06 as reflected by the progressive improvement in the all three key deficit indicators. The fiscal performance has, however, deteriorated since 2007-08 with all deficit indicators showing an upward trend, although they have continued to remain lower than the worst levels reached between 2003 and 2006. The revenue deficit, however, continued to be in surplus during the years from 2005-06 to 2008-09 on the back of containment of revenue expenditure and increase in State’s share in central taxes consequent to the Twelfth Finance Commission award. The revenue account, however, turned into deficit in 2009-10 on account of expenditure implications of the Sixth Pay Commission award. States’ revenue account has again turned into surplus since 2011. Since 2010-11, GFD of state has remained within the indicative target of 3.5 per cent suggested by the Thirteenth Finance Commission. Chart 3 displays the balance of revenue (RED) and capital account (CED) along with capital outlay (COL). Trend suggests that the capital outlay has increased consistently since the State has come into existence. Between 2000-01 and 2012-13, State’s capital outlay increased at a compound annual growth rate of 30.6 per cent. As a result, the capital outlay as a ratio to GDP increased from 1.0 per cent in 2000-01 to 3.7 per cent in 2012-13. A noteworthy feature of the post- FRBM period is the financing of capital account deficit by means of surpluses generated in the revenue account. This is in contrast to the pre-FRBM period which was marked by the use of capital account surpluses for financing of the revenue deficit. Trends in Expenditure The trends in expenditure pattern of Uttrarakhand shows a progressive improvement in capital outlay from 1.0 per cent (2000-01) of GSDP to 3.7 per cent (2012-13) although the revenue expenditure grew at much faster rate from 6.3 per cent to 16 per cent during the same period. During the period, the development revenue expenditure on social and economic services as ratio to GSDP increased from 4.5 per cent in 2000-01 to 15.0 per cent in 2012-13 while non-development revenue expenditure increased from 1.5 per cent in 2000-01 to 9.3 per cent in 2012-13. The compound annual growth rate of development expenditure between 2000-01 and 2012-13 at 24.8 per cent reflects the importance placed by the State Government on promoting development activities. Further, there has been a greater emphasis on expenditure on social services in comparison to economic services in the revenue account. Among social services, the share of education, art and culture is the highest, followed by shares of medical and public health services and urban development. However, the sharp rise in non-plan expenditure on social services in 2009-10, particularly in education and medical and public health sectors, is attributable to the increase in staff salaries following the implementation of the Sixth Pay Commission award. On the non-development expenditure side, interest payments, particularly on account of National Small Saving Fund (NSSF) and market loans constitute the largest component followed by pensions and administrative services. The central government’s debt swap scheme during the year 2002-05, helped the State to reduce interest expenses in 2003-04, albeit this reduction was offset by higher interest payments on account of market loans. There was a sharp spike in interest payments in the following year both due to higher payments on account of market loans and withdrawal of high cost NSSF borrowings. Chart 4 presents the interest payments as a share of revenue expenditure. The interest payments as a ratio to revenue expenditure increased sharply during the early years of the State reaching as high as 17 per cent in 2001-02 on account of the burden of financial liabilities transferred to the State consequent upon the enactment of the UP Reorganisation Act. The burden of interest payments, however, decelerated over time and has been remained in the range of 12.5 to 16.0 per cent indicating State’s commitment on economising the interest expenditure. The average share of interest revenue expenditure during 2000-01 to 2012- 13 is estimated at 14.4 per cent of the total revenue expenditure. Chart 5 displays the movements in the share of development and non-development capital expenditures as shares of GSDP over the period 2000-01 to 2012-13. The development expenditure in the capital account is observed to have steadily increased during 2003-04 to 2005- 06. It has declined thereafter albeit maintained a steady level between 4-5 per cent of GSDP. During all the years, the development capital outlay constituted almost 90 per cent of the total capital outlay. On the other hand, the ratio of non-development capital expenditure to GSDP was contained at below 1.0 per cent throughout the period. Except for 2000-01, the share of non-development capital expenditure in total capital outlay remained about 10 percent during the rest of the years. Unlike the composition of revenue expenditure, the development capital expenditure in Uttarakhand is committed more for supporting economic than social services. Within economic services, higher tangible capital expenditure is allocated for roads, bridges, irrigation and minerals, etc. These investments are obviously of greater importance for the State, given its topology and potential for productive use of abundant water resources. The budgetary operations of the State have, however, been compromised by the inability to plan for economising large accumulation of cash balances since 2005-06. These cash surpluses result in revenue losses arising from the difference between payment on market/NSSF borrowings and the return on 14 day Treasury Bills and / or idle cash balances lying with the Reserve Bank. Improved revenue realisations, net accretion from public account and more than necessary borrowings for precautionary purposes generally lead to receipt and expenditure mismatches and hence creation of idle surpluses. While the Thirteenth Finance Commission has given some relief on interest payable on NSSF borrowings by States, it would be nonetheless prudent to optimise cash holdings in the larger interest of public finances at all times. In the case of Uttarakhand, this aspect became more evident during the years 2006-08 with large accumulation of cash in public account whereas the position improved thereafter as these balances were drawn down. Thus, it is imperative for the State to make attempt for building up the capacity for better cash management. It may be suggested that apart from greater coordination among the Government entities required for making realistic assessment of cash needs, the State should also attempt to avoid unnecessary build-up of cash surpluses by adopting advanced forecasting and monitoring mechanism. With proper cash management and better synchronisation of cash inflows and outflows, the State will be able to calibrate borrowing requirement and hence avoid the loss due to the holding balances that provide lower return than that payable as borrowing cost. A simple correlation analysis for the period 2005-06 to 2007-08 shows that cash balances are highly correlated (correlation coefficient 0.77) with capital receipts. The correlation coefficient between cash balances and total borrowings at 0.40 suggests that the State needed to calibrate its borrowings more carefully than it did during the period under review. The surplus cash balance level fell to zero during the two year 2008-09 which may not, perhaps, be desirable given the expenditure exigencies at the very beginning of the year. Trend in Receipts The efficiency in the government’s functioning can be gauged from the trend pattern of States’ own tax and non-tax revenues, although own tax revenue suffers from the limitation of exportation of tax revenue forgone for goods and services sold in other state jurisdictions. During the post-FRBM period, own tax revenue component as share of revenue expenditure (‘tax effort’) increased from 30 per cent to 37 per cent as compared to the pre-FRMB period (Table 3). The share of own taxes as proportion of revenue receipts has also increased from 33 per cent to 36 per cent during the two reference periods due to sizeable expansion of the tax base as well as higher growth and huge investments made in the State by manufacturing companies on the back of special concessional package awarded by the Government. This package offered benefits of 100 per cent central excise exemption for ten years, 100 per cent exemption from income tax in the first five years of operations and 30 per cent exemption from income tax in the next five years of operations. Apart from above, Government of Uttarakhand has taken initiatives in respect of rationalisation and simplification of commercial taxes, excise duties, stamp and registration fee, transport and entertainment taxes and announced a mid-term Fiscal Reconstruction Policy (FRP) to increase revenue and curtail expenditures. Besides, initiatives have been taken to computerise tax filing in procedures in the Commercial Tax Department, Transport Department, Treasuries and Stamp and Registrar Offices. Going forward, such reforms are likely to help the State to tap the increased industrial tax base more effectively. The revenue buoyancy with respect to GSDP has exhibited fluctuating trend and State continues to largely depend on the Grantsin- aid from the Central Government. From less than 1.0 per cent in 2003-04, revenue buoyancy of the State improved to 1.7 in 2006-07 coinciding with the increased revenue receipts as a consequence of the implementation of the Twelfth Finance Commission award in 2005-06. The decline in tax buoyancy ever since 2006-07, however, needs some introspection and prudent tax administration although the buoyancy of revenue receipts continues to be above unity (Chart 6). Decline in the buoyancy can be attributed partly to concessions to industries in central sales tax and interest in the form of concessional package given to industries by the State Government and partly to subsidies in transport and capital investment. A similar analysis in respect of major sources of tax revenues such as sales and excise taxes offer a mixed picture. The buoyancy of sales tax suggests that it has followed a similar pattern as the overall revenue buoyancy – increasing up to 2004-05 and declining thereafter and increase in 2007-08 and further increase in 2010-11 and decrease thereafter (Chart 7). Overall revenue buoyancy of State has generally followed a pattern of buoyancy in sales tax which contributes around 20 per cent to revenue receipts. Similarly, the trend in excise buoyancy suggests a fluctuating trend in tandem with industrial growth of the state (Chart 8). The ratio of other component of revenue receipts namely, nontax revenue in revenue expenditure increased in the second period compared to the first period while its share in revenue receipts declined between the two periods. Hence, efforts need to be accelerated towards particularly meaningful tariff adjustments in the power and irrigation sectors. The non-tax revenue receipts from economic and social services have increased steadily over time. The composition of capital receipts suggests that borrowings from the market constitute the largest share followed by that from the NSSF and WMAs. This is in contrast to the position between 2000-01 and 2006-07 when loans from the NSSF made up the largest share of capital receipts. The dependence on loans and advances from the centre which were growing as part of capital receipts until 2004-05 came down significantly in 2005-06 with the increase in the grants from the centre. This may also have been on account of the expiration of the debt swap scheme in 2004-05 resulting in conscious policy choice of substituting high cost central loans with market borrowings which were available at lower cost. Section IV The genesis of indebtedness of Uttarakhand can be traced to the timing of the creation of the State and enactment of the recommendations of the Eleventh Finance Commission (2000-05), which was implemented w.e.f April 2000. Since the state was created in November-2000, it could not benefit from recommendations of the Finance Commission. However, in the post-award period of Eleventh Finance Commission, Uttarakhand was declared a Special Category State (SCS). Nevertheless the State was deprived of the benefit of revenue deficit grants admissible to other SCS States. Uttarakhand received a grant of Rs. 5296 crore during the period of Eleventh Finance Commission. Apart from this, to fund the plan expenditure, the Central government allowed the State to raise additional borrowings from market and other sources, which led to increase in the indebtedness of the State. Based on the recommendations of the Twelfth Finance Commission (2005-10), Uttarakhand Government initiated a series of fiscal reforms. Enactment of FRBM Act, implementation of the VAT and maintaining revenue surplus budgets till the award of the Sixth Pay Commission have enabled fiscal correction in the state. Uttarakhand, on basis of recommendations of the Twelfth Commission, has been allocated a total amount of Rs. 12194 crore, out of which Rs. 5762 crore is under share in central taxes & duties and Rs. 5115 crore for non-plan Revenue Deficit under Grants-in-Aid. The recommended amount is being received since 2006-07. The Thirteenth Finance Commission has not only increased States share in central taxes to 32.0 per cent from 30.5 per cent recommended by the Twelfth Finance Commission but also offered debt relief to States by restructuring the interest rate on loans from National Small Savings Fund (NSSF) and recommending write-off of central loans to States, which are administered by Central Ministries other than the Ministry of Finance. However, both these debt relief schemes are available to States only if they amend/legislate FRBM in accordance with the recommendations of the Commission which inter alia require them to eliminate revenue deficit and achieve fiscal deficit of 3 per cent of their respective GSDP latest by 2014-15. The borrowing limits of the States would thus be fixed by the Centre in line with these targets. This development may be viewed in conjunction with the future benefits that would accrue to the state on account of the possible debt relief announced by the Thirteenth Finance Commission if the stipulated conditions are met. In its award, the Thirteenth Finance Commission also recommended performance incentive grant of Rs.1000 crore for Uttarakhand spread over 2010-11 to 2012-13 (Rs.400 crore, Rs.300 crore and Rs.300 crore respectively.) for graduating out of non-plan revenue deficit since 2006-07; though the overall receipt of grants from the Centre, particularly that obtained in lieu of filling the gap of non-plan revenue deficit, may be expected to decline in 2010-11.This is because the non-plan revenue expenditure projected by the Thirteenth Finance Commission for 2010-11 is less by Rs. 1594.47 crore compared to the same in 2009-10. However, given the sharp upward spike seen in nonplan revenue expenditure in 2009-10 due to the Sixth Pay Commission award, and it appears unlikely that the above order of compression in non-plan revenue expenditure could be easily undertaken particularly in expenditure related to salaries, pensions and interest payments. Further, according to the Mid Term Fiscal Policy statement of the State Government, going forward, the salary and pension component of the non-plan expenditure is unlikely to retract from the levels reached in 2009-10. Assuming that the plan and non-plan revenue expenses remain more or less at the same level as in 2009-10, and the statutory non-plan grant that will be obtained from the center in 2010-11 continues to remain at the same level as in 2009-10, the revenue balance in 2010-11 would turn into surplus of about Rs. 275 crore after adding the performance incentive grant of Rs.400 crore for 2010-11. Despite the increase in the share of States in Union tax revenues, of which the absolute amount is not known in advance, the reduction in revenue deficit in 2010-11 from Rs. 213 crore to a surplus of Rs. 275 crores would help the state reach the Commission’s GFD target of 3.5 per cent of GSDP by 2010-11. Taking the annual growth in nominal GSDP at 11.95 per cent (Thirteenth Finance Commission projection) for 2010-11, the GFD reduction to 3.5 per cent should be achieved by compression of GFD balance by an absolute amount of Rs.446 crore. Net gain of Rs. 319.36 crore from interest relief on NSSF combined with revenue surplus would easily help the state to reach the GFD target of 2010-11. The additional devolution by way of increased share of Union tax revenues or grants as per the Thirteenth Finance Commission award would support this objective as well. From the above facts and figures, it appears that Uttarakhand will be able to reach the GFD target of 3.0 per cent by 2013-14 thereby becoming eligible for the benefit of debt write-off of Rs. 80 crore announced by the Thirteenth Finance Commission. These estimates are strictly contingent on the assumption that the statutory non-plan grants from the center are not curtailed drastically. In the extreme case that State does not receive any nonplan grant as it has graduated out of non-plan revenue deficit, the fiscal situation could deteriorate. Section V Since resources raised by Uttrarakhand thus far have fallen short of expenditure needs, the State has been compelled to borrow. This is the case with most of other State Governments. Given the large scale borrowings resorted to by all State Governments, the debt sustainability issue become pertinent. A careful analysis of the structure and composition of debt assumes greater importance from the point of view of debt analysis. The total debt of a state has three main components viz., (i) public debt, i.e., internal debt and loans from central government (ii) borrowings from small savings and provident fund and, (iii) reserve fund and deposits and advances. Since the inception, the total liabilities of Uttarakhand grew at an annual average rate of 18.2 percent. The growth in liabilities has moderated within the range of 10-12 per cent since 2006-07. In terms of share of GSDP ( at 2004-05 prices), the debt burden over the years increased from 28.3 per cent in 2000-01 to 40.1 per cent by 2005-06 and decreased thereafter to 30 per cent in 2012-13. The burden of outstanding liabilities as share of GSDP increased sharply in 2003-04 to 40.5 percent from 34.0 per cent in 2002-03, which remained sticky till 2005-06. Although efforts made by Uttarakhand government have reduced debt burden to 30 per cent of GSDP, serious efforts are still needed to bring State’s debt-GSDP ratio to 25 per cent by March 2015 as recommended by the Thirteenth Finance Commission for States. Excluding the extreme year 2001-02, the interest payment on outstanding liabilities increased at an annual average growth rate of 15.2 per cent between 2002-03 to 2012-13. Currently, the annual growth in interest payment is at 17 per cent which is quite high and needs to be reined in, even as the average share of interest payments in total revenue expenditure appears to be stabilising around 14.7 per cent. In line with recommendations of Thirteenth Finance commission, some relief to State on interest burden should be available due to the rationalisation of interest rate on NSSF. Of the outstanding liabilities, the share of loans and advances from the Center remained as a predominant source of capital receipts until 2001-2002 which has subsequently reduced to 1.52 per cent in 2012-13 from 44.91 per cent in 2000-01. However, there was sharp increase in the share of internal debt which increased to 69.25 per cent from 22.70 per cent during the same corresponding period. (Table 4). The increased share of state development loans, loans from NSSF and banks and financial institutions and the declining share of loans from Centre owe to the benefit derived by the State from the debt swap scheme introduced by the Center in 2002-03 which allowed swapping high cost central loans with additional market borrowings. By 2012- 13, while the share of central loans and advances to outstanding liabilities declined to 1.52 per cent, that of provident fund increased to 16.77 per cent. However the share of contingency fund declined from 13.76 per cent in 2000-01 to 7.44 per cent in 2012-13.
To provide robust numerical underpinnings to debt dynamics of Uttarakhand, a simultaneous equations model was estimated and simulated dynamically to derive the sensitivity of various fiscal variables upon an assumed change in GSDP growth (Annex 1). The model considers the debt dynamics taking into account the relationships between GSDP, revenue receipts, revenue expenditure and capital outlay to derive the sensitivity of outstanding liabilities and GFD to changes in GDP growth. Table 4 provides the estimated changes in revenue expenditure, revenue receipts, total liability, gross fiscal deficit and revenue deficit over a period of nine year (2005 to 2013) on account of one per cent increase in GDP as one time initial shock. As shown in in Table 4, a positive shock (increase) in GSDP growth leads positive response in revenue receipts facilitating narrowing of fiscal and revenue deficits. The Table 5 shows the annual average multipliers for various key fiscal parameters. The total dynamic impact (cumulative) over the 9 years of simulated trajectories for each of the fiscal parameters can be computed by multiplying the annual estimate by 9. The state has completed more than a decade of satisfactory fiscal regime. Double digit GSDP growth rate has placed the state on a high growth trajectory. Agriculturally dominated economy of Uttarakhand seems to be gradually transforming into industry driven economy thereby paving the way for services driven growth and fulfilling the criteria of Rostow’s Stages of growth. Given the socio-geographic aspects, setting the priority of development is the most crucial for the Government. Forestry and Tourism appear to be potential growth drivers in the State. However, the topology of the State is the biggest challenge that needs to confronted in order to maintain regional economic balance as the development of hilly area has always been an objective in the heart of Uttarakhand. Fiscal management under rule based fiscal regime of the State reflects the seriousness of the State Government. The State was created in a time when the finances of undivided Uttar Pradesh were passing through acute crises. Accordingly, the Uttar Pradesh Reorganisation (UPR) Act, 2000 demarcated the criteria of distribution of revenues, authorisation of expenditure and apportionment of assets and liabilities and the State was born with a total liability of Rs. 3185.91 crore. The State took about two years’ time in obtaining the ‘Special Category Status’ (SCS). However, during the initial years, Uttarakhand has not been able to come out of the legacy of fiscal problems inherited from Uttar Pradesh and the liabilities have increased significantly. In view of recommendations of Twelfth Finance Commission towards rule based fiscal regime, the enactment of FRBM Act and implementation of VAT in 2005 has all been instrumental in improving the fiscal health of the State. The fiscal deficit declined from 5.06 per cent in first (pre- FRBM) period to 3.2 per cent in the second (post-FRBM) period. A similar progress was also seen in terms improvement in revenue deficit at 28.2 percent in the post-FRBM period reflecting surplus in the revenue account for the period 2006-07 to 2012-13. The State has not only maintained the highest level of tax-GSDP ratio among special category States but also remains above the national average in this respect. Satisfied with the performance of the State, Thirteenth Finance Commission has, therefore, not recommended any targeted increases the tax-GSDP ratio until 2014-15. The trends in expenditure over the decade shows a progressive improvement in capital outlay from 1.0 per cent (2000-01) of GSDP to 3.7 per cent (2012-13) although the revenue expenditure grew at much faster pace from 6.3 per cent of GSDP to 16 per cent during the same period. The compound annual growth rate of development expenditure between 2000-01 and 2012-13 at 24.8 per cent reflects the importance placed by the State Government on promoting development activities and creation of economic infrastructure. In terms of plan reallocation and development expenditure, there is need to place priority on creating socio-economic balance between hilly and plain areas – an area that currently poses a constant challenge to the State Government. It is observed that the growth rate of non-hilly districts has been much higher than the hilly districts and this issue should be accorded proper attention in the budget allocations. The efficiency in the government’s tax administration is reflected in the trends observed in the mobilisation of own tax and own non-tax revenues. The revenue buoyancy of major taxes is above unity which augurs well for sustained increase in revenues ahead of GSDP growth. The tax revenue of Uttarakhand is primarily driven by the sales tax/ trade tax, which constitutes more than 50 per cent of the tax revenue and growing at an average annual rate of 16 per cent. Further, the implementation of VAT has improved the tax collection with increasing income of the state and rising consumption. During the post-FRBM period, the average own tax revenue component as share of revenue expenditure (‘tax effort’) increased from 30 per cent to 36 per cent as compared to the pre-FRMB period. Although the revenue buoyancy remains higher than unity, the average share of own taxes as proportion of revenue receipts remained more or less constant during the both subperiods in spite of the expansion of the tax base due to both higher growth and huge investments made in the State by manufacturing companies on the back of special concessional package. Going forward this ratio is likely to improve as GSDP growth accelerates further. After performing better during initial years of post-FRBM period, the state government has experienced the mismatch in revenue and expenditure during 2009-10 as slackness in tax collection was evident due to global financial crisis and extra burden of revenue expenditure emanated from the Sixth Pay commission award. Although the budgetary targets in respect of revenue and fiscal deficits have been missed during the Sixth Pay Commission award, the Finance Commission has given temporary extension for achieving the said targets in the next two years. In terms of share of GSDP, the debt burden over the years increased significantly from 28.31 per cent in 2000-01 to about 41.17 per cent by 2012-13. Efforts need to be made to reduce this burden in view of the recommendation of the Thirteenth Finance Commission for States to reduce their debt to GSDP ratio to 25 per cent by March 2015. Taking account of the projections made and the additional incentives provided by the Thirteenth Finance Commission, an initial assessment of budgetary numbers shows that Uttarakhand may be able to achieve fiscal consolidation in the manner advised by the Commission in the normal course. Putting all these things together, Uttarkhand seems to be following better fiscal management practices except the slack in managing internal debt. Although ten years of fiscal regime is not enough to assess the fiscal performance, yet the need for fiscal prudence and good governance must take precedence to distribute the benefits of development fully. In order to analyse the outcome of budgetary expenditure, introduction of Performance and Outcome Budgeting may help as the Union Government also has emphasised this fact. Performance budgeting takes budgetary analysis beyond expenditures and attempts to link these to outcomes. While there is sufficient evidence that the state accorded priority for developmental capital expenditure, the growth in revenue expenditure may have to be contained to avoid unsustainable liabilities. There are also issues with respect to increasing number of loss-making state public sector undertakings (SPUs), and growing size of salary and pension bills. To sum up, the nature has blessed Uttarakhand with the abundance of natural resources ranging from hydro electricity, rich bio-diversity, splendid destinations for tourism. Higher rate of literacy can be tapped to give a thrust to sustainable and equitable development of the State. The exodus of working population from the State in search of employment in other States is one of the most serious social issues, which certainly needs attention of the policy makers to generate employment opportunity in Uttarakhand to transform money order economy into home earned economy. Such priorities need to better relflect in State budget allocations which ensure a balanced development of State by providing ample opportunities within the State. Annex- 1 Revenue Expenditure = f( Revenue Expenditure t-1, Revenue Deficitt-1) …………...(1) Revenue Receipts = f(Nominal GSDP) …………...(2) Capital Outlay = f(Gross Fiscal Deficit, Total Liabilitiest-1) …………...(3) Total Liabilities = f(Gross Fiscal Deficitt-1) …………...(4) Revenue Deficit ≡ Revenue Expenditure- Revenue Receipts …………...(5) Gross Fiscal Deficit ≡ Revenue Deficit + Capital Outlay + Net Lending …………...(6) This simple model has four estimable equations and two identities. The simulation of the model is conducted using dynamic Gauss Seidel algorithm. The results provided in Table 4 are based on giving a positive one per cent shock to nominal GDP in 2005. The dynamic responses/ multipliers are then averaged over nine years from 2005 to 2013 for calculating average impact on fiscal parameters.
References (i) Awasthi, I. C. 2010. ‘‘Migration Pattern in Hill Economy of Uttarakhand’’, Indian Economic Journal, Vol. 57, January-March. (ii) Comptroller and Auditor General, ‘‘Civil and Finance Accounts’’, Uttarakhand, Report for various years. (iii) Finance Commission of India, Reports of Eleventh, Twelfth and Thirteenth Finance Commission. (iv) Gupta, Sanjeev et al. 2002. “Expenditure Composition, Fiscal Adjustment and Growth in Low-Income Countries”, IMF Working Paper 02/77, International Monetary Fund, Washington, D.C. (v) Government of Uttarakhand, ‘Budget Documents, (various years) (vi) Rajaraman, Indira et al. 2005. “A Study of Debt Sustainability at State Level in India”, Reserve Bank of India. (vii) Rangarajan, C. and D. Subbarao. 2007. “The Importance of Being Earnest About Fiscal Responsibility”, Monograph 3/2007, Madras School of Economics, Chennai. (viii) Rao, M. Govinda and R. Kavita Rao. 2005. “Trends and Issues in Tax Policy and Reforms in India”, Working Paper 1, NIPFP, New Delhi. (ix) Rao, M. Govinda. 2005. “Tax System Reform in India: Achievements and Challenges Ahead”, Paper presented at International Symposium on Tax Policy and Reform in Asian Countries, Tokyo, Japan, July 1-2. (x) Report of First State Finance Commission of Uttarakhand. (xi) Report of Second State Finance Commission of Uttarakhand. (xii) Reserve Bank of India, ‘‘A Study of State Budgets’’ (various issues). (xiii) Reserve Bank of India. 2010. ‘‘Handbook of Statistics on State Government Finances’’, Reserve Bank of India. (xiv) Tolia, R. S. 2008. ‘‘Inside Uttarakhand Today’’ Bishen Singh Mahendra Pal Singh, Dehradun. (xv) Tolia, R. S. 2007. ‘‘Patwari Gharat and Chai’’ Bishen Singh Mahendra Pal Singh, Dehradun. * Author is Assistant Adviser in the Department of Economic and Policy Research of the Reserve Bank of India, Mumbai. The author is thankful to Shri B.M. Misra, Officer in Charge, Department of Economic and Policy Research for his encouragement. The author is thankful to Dr. Himanshu Joshi (Director, DEPR) for their valuable guidance. Views expressed in the paper are entirely personal and not of the institution, he belongs to. |
|||||||||||||||||||||||||||||||||||||||||||||||||||||||||||||||||||||||||||||||||||||||||||||||||||||||||||||||||||||||||||||||||||||||||||||||||||||||||||||||||||||||||||||||||||||||||||||||||||||||||||||||||||||||||||||||||||||||||||||||||||||||||||||||||||||||||||||||||||||||||||||||||||||||||||||||||||||||||||||||||||||||||||||||||||||||||||||||||||||||||||||||||||||||||||||||||||||||||||||||||||||||||||||||||||||||||||||||||||||||||||||||||||||||||||||||||||||||||||||||||||||||||||||||||||||||||||||||||||||||||||||||||||||||||||||||||||||||||||||||||||||||||||||||||||||||||||||||||||||||||||||||||||||||||||||||||||||||||||||||||||||||||||||||||||||||||||||||||||||||||||||||||||||||||||||||||||||||||||||||||||||||||||||||||||||||||||||||||||||||||||||||||||||||||||||||||||||||||||||||||||||||||||||||||||||||||||||||||||||||||||||||||||||||||||||||||||||||||||||||||||||||||||||||||||||||||||||||||||||||||||||||||||||||||||||||||||||||||||||||||||||||||||||||||||||||||||||||||||||||


এই পৃষ্ঠাটো শ্বেয়াৰ কৰক:


ভাৰতীয় ৰিজাৰ্ভ বেংক মোবাইল এপ্পলিকেষ্যন ইনষ্টল কৰক আৰু নৱীনতম বাতৰিৰ প্ৰৱেশাধিকাৰ পাওক!
আমাৰ এপটো ইনষ্টল কৰিবলৈ QR ক’ড স্কেন কৰক


পৃষ্ঠাটো শেহতীয়া আপডেট কৰা তাৰিখ:


