 IST,
IST,


Developments in Co-operative Banking
The balance sheet growth of urban co-operative banks (UCBs) moderated in 2019-20 on the back of lower deposit accretion on the liabilities side, and muted growth in loans and advances on the assets side. While UCBs posted net losses due to heightened provisioning requirement, their asset quality deteriorated. Within the short-term rural co-operatives arena, the performance of state co-operative banks improved in terms of GNPA ratio and profitability, whereas performance of district central co-operative banks continued to deteriorate. 1. Introduction V.1 Co-operative institutions provide an alternative approach to financial inclusion in India through their geographic and demographic outreach to the urban and rural populace. During 2019-20, the co-operative sector, however, faced certain financial challenges. Episodes of frauds during the year affected the asset quality and profitability of urban co-operative banks (UCBs). During 2020-21 so far, uncertainties related to COVID-19 have affected the operations of this sector, as they did for the other financial institutions. Despite these weaknesses, this period also witnessed steering of reforms in the form of setting up of an umbrella organisation that will ease funding constraints to these banks, and amendment to the Banking Regulation Act which addressed the vexing issue of dual regulatory control. V.2 Against this backdrop, this chapter analyses the performance of urban and rural co-operative banks during the period under review. Section 2 reviews the structure and regulation of the co-operative sector. Section 3 sheds light on the balance sheet developments, financial performance, and asset quality of UCBs. Section 4 examines the short-term and long-term rural co-operative banks from the point of view of their financials and viability1. Section 5 concludes with an overall assessment of the sector and some policy perspectives. 2. Structure and Regulation of the Co-operative Sector V.3 At end-March 2020, the sector consisted of 1,539 UCBs and 97,006 rural co-operative banks2. Rural co-operatives make up 65 per cent of the total asset size of all co-operatives taken together (Chart V.1). V.4 Despite the crucial role played by the sector, its asset size was only around 10 per cent compared to that of SCBs at end March-2020. Although the focus of rural co-operative lending is on agriculture, its share in total agricultural lending has diminished considerably over the years, from as high as 64 per cent in 1992-93 to 11.3 per cent in 2019-20 (Table V.1). 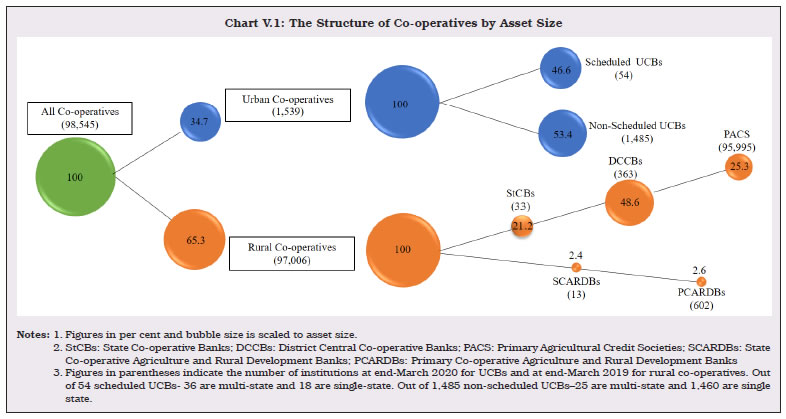 V.5 The financial soundness of this sector has been of concern over the last few years. Since April 1, 2015, 52 UCBs have been placed under All Inclusive Directions by the Reserve Bank.3 Out of the total claims settled by the Deposit Insurance and Credit Guarantee Corporation (DICGC) since inception, around 94.3 per cent of claims pertained to co-operative banks that were liquidated, amalgamated, or restructured. V.6 Over the years, the Reserve Bank has undertaken several steps to strengthen the sector, including entering into Memoranda of Understanding with State and Central Governments to facilitate coordination of regulatory policies, formation of Task Force for Urban Co-operative Banks, a comprehensive set of capacity building initiatives, and measures to bring in efficiency through adoption of technology. The Graded Supervisory Action introduced in 2003 was replaced by a Supervisory Action Framework in 2012 based on various trigger points, which was further amended in 2014 and 2020. These initiatives notwithstanding, several structural issues confront the sector such as dual regulation by the Reserve Bank and the Central/State governments, inability to combine the principles of co-operation with professionalism, lack of avenues to raise additional capital, the need of technological upgradation and more recently, incidences of frauds. The enactment of the Banking Regulation (Amendment) Act, 2020 is expected to address some of these problems (Box V.1).
V.7 The Reserve Bank liberalised the licensing policy for UCBs in 1993, resulting in proliferation in their number in the country. Nearly one-third of the newly licensed UCBs, however, became financially unsound within a short period. The Reserve Bank’s Vision Document 2005 reversed the liberal licensing policy while envisaging a multi-layered regulatory and supervisory strategy aimed at shoring up their viability. This included merger or amalgamation of weak but viable UCBs with stronger ones and closure of the unviable ones. Since 2003, 385 UCBs have had their licences cancelled or withdrawn, or have been merged with stronger ones (Chart V.2). V.8 Despite the fall in the number of UCBs, their combined asset size continuously increased, underscoring the improvement in their financial position and effectiveness of the consolidation drive (Chart V.3). V.9 Beginning in 2004-05, UCBs have undergone 136 mergers till March 2020, with Maharashtra accounting for more than half of them (Chart V.4). 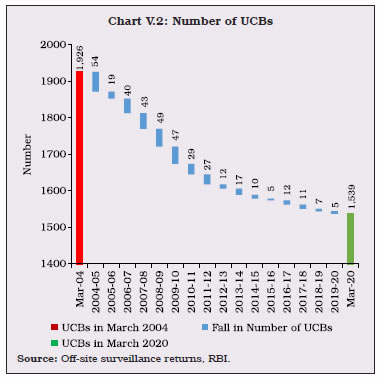 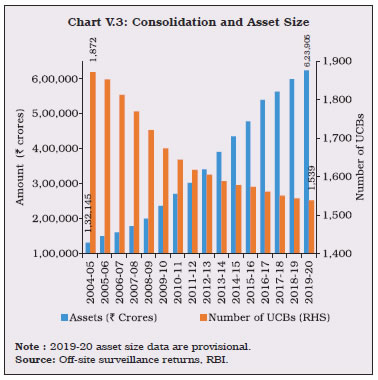 V.10 UCBs are classified into Tier-I and Tier-II categories for regulatory purposes5. By definition, Tier II UCBs have a larger depositor base and wider geographical presence than their Tier I counterparts. Due to the active consolidation drive, there has been a continuous increase in the share of Tier II UCBs in terms of both numbers and asset size (Table V.2). 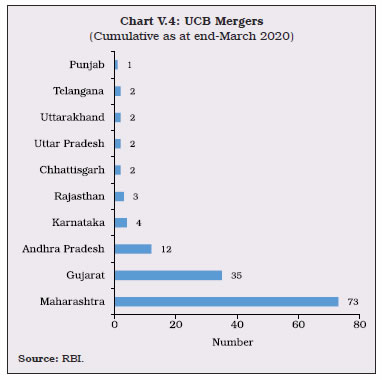 3.1 Balance Sheet V.11 The combined balance sheet of UCBs expanded consistently in the decade following the consolidation drive. This was propelled by robust players with strong and profitable financial performance. In recent years, however, as UCBs faced competition from other niche players like small finance banks and non-banking financial companies (NBFCs), and also had to reaffirm their credibility to depositors, their balance sheet growth has moderated (Chart V.5).  V.12 The distribution of UCBs in terms of asset size used to be bi-modal before 2016-17, with the two peaks in ₹25 crore to ₹50 crore and ₹100 crore to ₹250 crore asset brackets. Subsequently, however, the asset concentration has increased, and distribution has become unimodal, with UCBs with assets worth ₹100 crore to ₹250 crore forming the modal class. In 2019-20, the peak plateaued compared to the previous year. The distribution has, however, continued to move rightwards as an increasing number of UCBs fall in higher asset brackets, and the share of UCBs with assets less than ₹50 crores has consistently decreased from 41.9 per cent in 2014-15 to 31.4 per cent in 2019-20 (Chart V.6).  V.13 Growth in deposits, that constitute 90 per cent of the total resource base6 of UCBs, decelerated in 2019-20 after a revival in the previous year. The average growth rate of deposits declined from 13.1 per cent in the first decade of the consolidation drive to 8 per cent during 2014-15 to 2019-20, in line with the growth in balance sheet size. Since 2017-18, the deposit deceleration in UCBs was starker than in SCBs, pointing to the difficulties faced by UCBs in raising resources (Chart V.7). The deposit deceleration was led by Scheduled UCBs (SUCBs)7. Supervisory data available with the Reserve Bank suggest continuation of deceleration well into 2020-21. V.14 After growing at an average rate of 7.8 per cent from 2015-16 till the previous year, loans and advances of UCBs almost stagnated in 2019-20, reflecting anaemic credit demand. The marginal credit expansion was mainly driven by non-scheduled UCBs (NSUCBs), while credit from SUCBs contracted. Although deposit growth slumped, low credit demand contained borrowings from market and SCBs (Table V.3).  V.15 Consolidation has also catalysed a shift in the distribution of UCBs in terms of deposits. The modal class has consistently shifted rightwards, with an expansion of the customer base of UCBs and increase in average deposit per customer. As a result, the share of number of UCBs with deposits below ₹25 crore decreased from 56.7 per cent in 2007-08 to 20.5 per cent in 2019-20, while the share of number of UCBs with deposits between ₹25 crore and ₹250 crore increased from 37.8 per cent to 57.6 per cent in the same period (Table V.4 and Chart V.8a). V.16 In line with the trend of the past several years, UCBs with advances in the range of ₹10 crore to ₹25 crore formed the modal class during 2019-20 as well, contrary to the trend in deposits (Chart V.8b). Concomitantly, however, a gradual shift towards higher advances is also discernible through the years. In 2016-17, there were 38 UCBs with loan books of more than ₹1,000 crore; in 2019-20, their number increased to 50.  V.17 Usually, in times of low credit growth, banks increase investments in a bid to maintain their profitability. During 2019-20, however, UCBs’ investments in Central Government securities contracted as they booked trading profits on softening yields. The progressive reduction in statutory liquidity ratio (SLR) requirements for UCBs – even though liquidity coverage ratio (LCR) requirements are not applicable to them – further facilitated this reduction (Table V.5). V.18 The credit-to-deposit ratio of UCBs has always been lower than that of SCBs due to higher reliance on deposits as a source of funds, and a relatively lower share of assets disbursed as loans and advances. A similar pattern is observed in the case of the incremental credit-to-deposit ratio, except in the two years immediately after demonetisation (Chart V.9 a).  V.19 The investment-to-deposit ratio of UCBs fell below that of SCBs for the first time in 2015-16, as the balances of UCBs with DCCBs and StCBs ceased to be treated as SLR investments since April 1, 2015. The ratio continues to be lower for UCBs, despite a comparable incremental investment-to-deposit ratio (Chart V.9 b). 3.2 Soundness V.20 Based on the directions received from the Board for Financial Supervision (BFS), the extant CAMELS-based rating model for UCBs was reviewed. The revised CAMELS rating model implemented from April 1, 2019 gives a composite rating of A/B+/B/C/D (in decreasing order of performance) to UCBs, wherein capital adequacy, asset quality, earnings and liquidity are assessed through objective indicators, and management and systems and controls are assessed subjectively. V.21 Analysed on the new scale, UCBs in the top-ranking categories with ratings of A, B+, and B formed the majority of the sector. The number of UCBs with the lowest rating (viz. D rating) increased marginally over the previous year, although with a caveat that the scale of the earlier approach is not strictly comparable with the new scale (Table V.6). V.22 A majority of UCBs fall under ‘B’ rating (Chart V.10). 3.3 Capital Adequacy V.23 Under the Basel I norms, UCBs are required to maintain a minimum capital to risk-weighted assets ratio (CRAR) of 9 per cent, at par with the SCBs. However, additional requirements like a capital conservation buffer and common equity tier 1 (CET-1) capital ratio are not applicable to UCBs. At end-March 2020, more than 95 per cent of UCBs maintained CRAR above the statutory requirement (Chart V.11).   V.24 NSUCBs, that are characterised by a smaller business size, have stronger capital positions than SUCBs. During 2019-20, 4.8 per cent of NSUCBs had CRARs less than 9 per cent as opposed to 3.7 per cent in the previous year, while the corresponding figure for SUCBs remained around 7.4 per cent. On the upside, however, around 84 per cent of UCBs in each category maintained CRARs greater than 12 per cent during the year (Table V.7). 3.4 Asset Quality V.25 Historically, UCBs have had higher level of NPAs than SCBs. Since 2015-16, however, this position reversed, with the asset quality review (AQR) resulting in greater NPA recognition in SCBs, while the asset impairment of UCBs inched up gradually over time. In 2019-20, the GNPA ratio of UCBs again surpassed that of SCBs. The change was driven by improvement in the asset quality of SCBs for two consecutive years while the slippages of UCBs increased (Chart V.12). V.26 In 2019-20, the asset quality of both SUCBs and NSUCBs deteriorated, with the latter recording a larger increase in the GNPA ratio. The rise in NPAs may partly be attributable to stagnant growth in loans and advances and weak balance sheets (Table V.8). V.27 While both gross NPAs and provisioning increased during 2019-20, the growth in the latter was not fully commensurate with the growth in the former, resulting in an increase in net NPA ratio (Chart V.13). 3.5 Financial Performance and Profitability V.28 The overall operating profit of UCBs took a major hit in 2019-20 as their interest income, that constitutes around 89 per cent of total income, declined for the second consecutive year due to deceleration in investments and high growth of NPAs. This was accompanied by an increase in interest and non-interest expenditure. These factors combined with higher provisioning for contingencies – which more than doubled during the year – resulted in net losses in the consolidated balance sheet. The decline was mainly driven by the SUCBs, although marginal profits of NSUCBs provided a silver lining (Table V.9).  V.29 The strained profitability of SUCBs was evident in return on assets (RoA) and return on equity (RoE), where the former turned negative after a gap of more than 15 years. The net interest margin (NIM) in 2019-20 was lowest ever recorded as per the data available from 2000-01. The shrinking income drove up the cost-to-income ratio. While the profitability indicators of NSUCBs also deteriorated, they fared better than SUCBs in terms of RoA and RoE, reversing the position of the previous year (Table V.10 and Chart V.14). 3.6 Priority Sector Advances V.30 UCBs are required to meet a priority sector lending target of 40 per cent of adjusted net bank credit (ANBC) or credit equivalent amount of off-balance sheet exposures (CEOBSE), whichever is higher. This includes a mandated sub-target of 10 per cent of advances to weaker sections. UCBs’ lending to the priority sector has historically been higher than the prescribed targets. During 2019-20, priority sector lending jumped by 14.8 per cent as compared to the level in the previous year, while its share in total lending increased by 6 percentage points (Table V.11). Thus, the UCBs exceeded the priority sector target by ₹31,700 crore or by 10.38 per cent in 2019-20. Incidentally, UCBs’ participation in priority sector lending certificates (PSLCs) is low due to technical challenges. Going forward, their share of priority sector lending is expected to rise further as per the revised target of 75 per cent of ANBC or CEOBSE, whichever is higher, to be complied with by March 31, 2024, with defined interim milestones8.  V.31 Rural co-operatives, which were established to address the ‘last mile’ problem associated with delivery of affordable credit to farmers, can be broadly classified into short-term and long-term institutions, each with distinct mandates. The former primarily provide short-term crop loans and working capital loans to farmers and rural artisans, while the latter typically provide longer duration loans for making investments in agriculture, including land development, farm mechanisation and minor irrigations, rural industries, and housing. V.32 At end-March 2019, short-term co-operatives comprising State Co-operative Banks (StCBs), District Central Co-operative Banks (DCCBs) and Primary Agricultural Credit Societies (PACS) accounted for 95 per cent of the total assets of rural co-operatives. This share has consistently increased over the years (Table V.12 and Chart V.15). 4.1 Short-term Rural Co-operatives V.33 Short-term co-operatives are arranged in a three-tier structure in most of the states, with StCBs at the apex level, DCCBs at the intermediate level and PACS at the grassroots level. In ten states9 and four union territories however, short-term co-operatives operate through a two-tier structure consisting of StCBs at the apex level and PACS at the field level. V.34 Historically, deposits are the major sources of funds for StCBs and DCCBs. On the other hand, PACS rely more heavily on borrowings from StCBs and DCCBs and owned funds, even though the share of deposits has inched up over the years (Chart V.16).   4.1.1 State Co-operative Banks V.35 State Co-operative Banks (StCBs), the apex institutions in the short-term rural co-operative structure, mobilise deposits and provide liquidity and technical assistance to DCCBs and PACS. StCBs also mobilise refinance support from higher refinancing institutions like the NABARD for supporting the crop loan needs of affiliated DCCBs and PACS. Over time, StCBs have diversified their operations towards providing medium-term loans for investments in agriculture in particular, and the rural sector, in general. Balance Sheet Operations V.36 In 2018-19, the consolidated balance sheet of StCBs expanded on the back of deposits on the liabilities side and advances on the assets side, both of which constitute more than half of the size of the balance sheet (Table V.13). V.37 During 2019-20, StCBs’ balance sheet shift was impacted by the amalgamation of 13 DCCBs with the Kerala State Co-operative Bank in November 2019 (Table V.14). Profitability V.38 Net profits of StCBs accelerated during 2018-19 after a deceleration in the previous year. Operating profits, too, accelerated as the increase in income – especially interest earnings – outpaced expenditure, despite a steep rise in provisions and contingencies. The operating expenses of StCB in Kerala increased by 686 per cent, on account of write-off of excess income recognised in respect of some investments, and the implementation of a one-time settlement scheme (Table V.15). Asset Quality V.39 The asset quality of StCBs improved during 2018-19, albeit marginally. Technical write-offs and improvement in recovery, especially from state governments post implementation of loan waiver schemes, helped in containing loss assets (Table V.16). V.40 The improvement in the asset quality of StCBs during 2018-19, although overshadowed by the large decline in NPAs of SCBs, contrasted with the worsening GNPA ratios of UCBs (Chart V.17). V.41 From a regional perspective, the all-India decrease in the NPA ratio was driven by the north-eastern, western, and southern states. In the northern region, states continued to report the lowest NPA ratio, while southern states surpassed those in the northern region in reporting the highest recovery-to-demand ratio (Chart V.18a and V.18b).   4.1.2 District Central Co-operative Banks V.42 District central co-operative banks (DCCBs) - the intermediate tier in the short-term rural co-operatives structure-mobilise deposits from the public and provide credit to them as well as to PACS. DCCBs’ borrowings comprise of loans and advances from StCBs and direct refinancing from the NABARD. They have a wide depositor base, garnered through an extensive branch network. Accordingly, DCCBs typically have a lower credit-to-deposit ratio than StCBs, despite higher credit disbursal (Chart V.19). Balance Sheet operations V.43 The expansion in the consolidated balance sheet of the DCCBs during 2018-19 was fuelled by the growth of deposits, that constitute 66 per cent of liabilities. Deposit growth was matched by acceleration in loans and advances and investments on the assets side (Table V.17). Profitability V.44 The net profit of DCCBs diminished for the third consecutive year, with the pace of reduction increasing in 2018-19. Although both interest and non-interest income picked up, a jump in provisions and contingencies, and operating expenses, especially the wage bill, overshadowed the former (Table V.18). DCCBs typically have a higher burden of wage bills in comparison to StCBs due to their district level presence (Chart V.20).  Asset Quality V.45 The asset quality of DCCBs deteriorated marginally in 2018-19, with an increase in sub-standard and doubtful assets. Loss assets, however, declined on receipt of loan waiver scheme payments from state governments (Table V.19).  V.46 Similar to StCBs, there is considerable variation in the financial health of DCCBs across regions. The central region continued to report the highest NPA ratio, while the western states recorded the largest deterioration in asset quality. The states in the southern region reported the highest recovery-to-demand ratio (Chart V.21a and V.21b). V.47 DCCBs have persistently suffered higher NPA ratios and lower recovery-to-demand ratios than StCBs. The share of agricultural lending in the loans portfolio of DCCBs is higher than that of StCBs; hence, they are relatively more exposed to the vagaries of nature and volatility in agricultural performance (Chart V.22). 4.1.3 Primary Agricultural Credit Societies V.48 Primary Agricultural Credit Societies (PACS) form the grass-root level tier of the short-term rural co-operative structure that directly interfaces with individual borrowers to provide them short-term and medium-term credit. They also arrange for the supply of agricultural inputs, distribution of consumer articles and marketing of produce for their members. V.49 On the liabilities side of the consolidated balance sheet of PACS, the substantial improvement in owned funds was contributed by both paid-up capital and reserves. Both deposits and borrowings grew at a healthy pace (Appendix Table V.5).   V.50 While overall lending contracted, it was sharp in the case of non-agricultural lending (-71.9 per cent) relative to agricultural loans (-0.4 per cent). As a result, the share of agriculture in total lending of PACS increased from 54.9 per cent in 2017-18 to 81.2 per cent in 2018-19. During the year, 48.9 per cent PACS were profitable while 87.1 per cent were deemed viable or potentially viable. In the consolidated balance sheet of PACS however, losses overwhelmed profits for the second consecutive year (Appendix Table V.6). V.51 Since PACS extend credit only to their members, the borrower-to-member ratio is a useful indicator for evaluating the access to and demand for credit from PACS. The ratio remained low at 38.7 per cent during 2018-19, indicating that slightly more than a third of members benefitted from the credit facility. On the positive side, the share of marginal farmers in total members as well as borrowers increased to constitute a majority, suggesting that the most vulnerable strata of society are benefitting from the PACS network (Appendix Table V.7). 4.2 Long Term Rural Co-operatives V.52 Long-term co-operatives play an important role in enhancing agricultural productivity and rural development by providing long term finance for capital formation and rural non-farm projects. They consist of state co-operative agriculture and rural development banks (SCARDBs) operating at the state level and primary co-operative agriculture and rural development banks (PCARDBs) operating at the district/block level. While short-term co-operatives in most states have a three-tier structure, the structure of long term co-operative institutions varies across states. At present, five (Gujarat, Jammu & Kashmir, Puducherry, Tripura and Uttar Pradesh) out of the thirteen fully functional SCARDBs, are unitary, i.e., they operate through their branches with no separate PCARDBs. Six (Haryana, Karnataka, Kerala, Punjab, Rajasthan and Tamil Nadu) are federal, operating through PCARDBs, and two (Himachal Pradesh and West Bengal) have mixed structures, with SCARDBs operating through PCARDBs as well as through their own branches. 4.2.1 State Co-operative Agriculture and Rural Development Banks (SCARDBs) V.53 The consolidated balance sheet of SCARDBs contracted for the second consecutive year in 2018-19, as accumulated losses eroded their equity capital base (Appendix Table V.8). The financial woes of SCARDBs continued as they reported net losses for the third consecutive year. Although operating profits remained positive, they declined year-on-year by 21.9 per cent due to an increase in operating expenses and decline in non-interest income (Appendix Table V.9). Asset quality also deteriorated, and the recovery-to-demand ratio declined marginally (Appendix Table V.10). Among the states, Kerala and Tripura maintained the lowest and highest NPA ratios, respectively (Appendix Table V.11). 4.2.2 Primary Co-operative Agriculture and Rural Development Banks (PCARDBs) V.54 After expanding for two consecutive years, the consolidated balance sheet of PCARDBs contracted in 2018-19, dragged down by reserves and borrowings on the liabilities side and loans and advances on the assets side (Appendix Table V.12). PCARDBs registered operating profits in 2018-19, despite a decline in interest income, which was compensated for by the substantial rise in non-interest income (Appendix Table V.13). Like the SCARDBs, both the NPA ratio and the recovery-to-demand ratio of PCARDBs deteriorated (Appendix Table V.14). PCARDBs in the northern states reported the highest NPA ratios, while those in the southern states reported the lowest (Appendix Table V.15). V.55 The unearthing of a fraud in a major UCB during 2019-20 affected its asset quality and profitability, with ripple effects on other related banks. Although the spillover was largely contained, this episode brought to the fore the systemic risks stemming from a low capital base, weak corporate governance, slower adoption of new technology and inadequate systems of checks and balances. In this light, the government and the Reserve Bank have undertaken several measures to improve governance and oversight of co-operative banking system, including by an amendment to the BR Act that empowered the Reserve Bank with greater regulatory control over UCBs, StCBs and DCCBs. The formation of an umbrella organisation should help ease funding constraints appreciably. V.56 The co-operative sector has been facing numerous shocks in recent years. Meanwhile, commercial banks’ expansion of reach and presence in rural and remote areas by leveraging on technology and the banking correspondents’ network has also intensified competitive pressures on them. Moreover, inherent structural weaknesses alluded to in this chapter constrain the sector and pose persistent and recurring challenges. Given their overwhelming contribution to financial inclusion and massive reach, however, the need to strengthen the sector and render it self-sustaining cannot be overemphasised in the interests of the communities they serve. 1 Although primary agricultural credit societies (PACS) and long-term co-operatives are outside the regulatory purview of the Reserve Bank, data and a brief description of their activities are covered in this chapter for providing a complete outline of the sector. 2 Data on rural co-operatives are available with a lag of one year, i.e., they relate to 2018-19. 4 For multi-state co-operative banks 5 (a) Tier I UCBs are defined as: i) Banks with deposits below ₹100 crore operating in a single district, ii) Banks with deposits below ₹100 crore operating in more than one district provided the branches are in contiguous districts and deposits and advances of branches in one district separately constitute at least 95 per cent of the total deposits and advances respectively of the bank, and iii) Banks with deposits below ₹100 crore, whose branches were originally in a single district but subsequently, became multi-district due to reorganisation of the district. (b) All other UCBs are defined as Tier-II UCBs. 6 Resource base comprises capital, reserves, deposits and borrowings. 7 All banks which are included in the Second Schedule to the Reserve Bank of India Act, 1934 are Scheduled Banks. These banks comprise Scheduled Commercial Banks and Scheduled Co-operative Banks. 8 As per the revised guidelines issued on March 13, 2020, priority sector lending targets for UCBs have been revised and increased to 75 per cent of ANBC or CEOBSE, whichever is higher. UCBs shall comply with the above target by March 31, 2024, with 45 per cent, 50 per cent, and 60 per cent of ANBC or CEOBSE, whichever is higher by end-March 2021, 2022 and 2023, respectively. 9 After the final approval by the Reserve Bank, thirteen out of fourteen DCCBs (except Malappuram DCCB) of Kerala were amalgamated with the Kerala State Co-operative Bank on November 29, 2019. |

এই পৃষ্ঠাটো শ্বেয়াৰ কৰক:


ভাৰতীয় ৰিজাৰ্ভ বেংক মোবাইল এপ্পলিকেষ্যন ইনষ্টল কৰক আৰু নৱীনতম বাতৰিৰ প্ৰৱেশাধিকাৰ পাওক!
আমাৰ এপটো ইনষ্টল কৰিবলৈ QR ক’ড স্কেন কৰক


পৃষ্ঠাটো শেহতীয়া আপডেট কৰা তাৰিখ:


