|
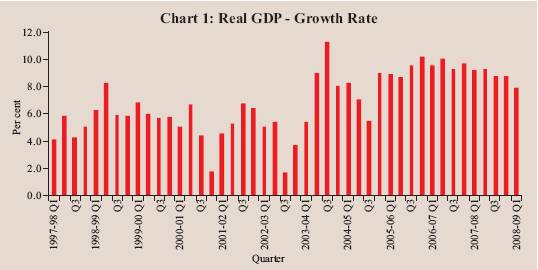
The Indian economy continued to record robust growth during the first quarter of 2008-09 (April-June), although the pace of expansion moderated in comparison with the average growth rate of real GDP during last five years. According to the first quarter estimates of 2008-09 released by the Central Statistical Organisation (CSO) in August 2008, real GDP growth was placed at 7.9 per cent during the first quarter of 2008-09 as compared with 9.2 per cent during the corresponding quarter of previous year and 9.0 per cent during 2007-08. The deceleration was spread across all the three sectors, viz., agriculture and allied activities, industry and services (Table 1 and Chart 1). The growth rate of real GDP during the last five years (2003-04 to 2007-08) averaged 8.8 per cent. The moderation during the first quarter of 2008-09 reflected a cyclical downturn, while the structural drivers of the growth process continued to be favourable. Notwithstanding the moderation, the growth rate of the Indian economy continuous to be one of the highest in the world.
Table 1: Growth Rates of Real GDP @ |
(Per cent) |
Sector |
2000-01 to
2007-08
(Average) |
2005-06 |
2006-07* |
2007-08# |
2007-08 |
2008-09 |
Q1 |
Q2 |
Q3 |
Q4 |
Q1 |
1 |
2 |
3 |
4 |
5 |
6 |
7 |
8 |
9 |
10 |
1. |
Agriculture and Allied Activities |
2.9 |
5.9 |
3.8 |
4.5 |
4.4 |
4.7 |
6.0 |
2.9 |
3.0 |
|
|
|
(20.9) |
(19.6) |
(18.5) |
(17.8) |
|
|
|
|
|
2. |
Industry |
7.1 |
8.0 |
10.6 |
8.1 |
9.6 |
8.6 |
8.6 |
5.8 |
5.2 |
|
|
|
(19.6) |
(19.4) |
(19.5) |
(19.4) |
|
|
|
|
|
|
2.1 |
Mining and Quarrying |
4.9 |
4.9 |
5.7 |
4.7 |
1.7 |
5.5 |
5.7 |
5.9 |
4.8 |
|
2.2 |
Manufacturing |
7.8 |
9.0 |
12.0 |
8.8 |
10.9 |
9.2 |
9.6 |
5.8 |
5.6 |
|
2.3 |
Electricity, Gas and
Water Supply |
4.8 |
4.7 |
6.0 |
6.3 |
7.9 |
6.9 |
4.8 |
5.6 |
2.6 |
3. |
Services |
9.0 |
11.0 |
11.2 |
10.7 |
10.6 |
10.7 |
10.0 |
11.4 |
10.2 |
|
|
|
(59.6) |
(61.1) |
(61.9) |
(62.9) |
|
|
|
|
|
|
3.1 |
Trade, Hotels,
Restaurants, Transport,
Storage and
Communication |
10.3 |
11.5 |
11.8 |
12.0 |
13.1 |
11.0 |
11.5 |
12.4 |
11.2 |
|
3.2 |
Financing, Insurance,
Real Estate and
Business Services |
8.8 |
11.4 |
13.9 |
11.8 |
12.6 |
12.4 |
11.9 |
10.5 |
9.3 |
|
3.3 |
Community, Social
and Personal services |
5.8 |
7.2 |
6.9 |
7.3 |
5.2 |
7.7 |
6.2 |
9.5 |
8.4 |
|
3.4 |
Construction |
10.6 |
16.5 |
12.0 |
9.8 |
7.7 |
11.8 |
7.1 |
12.6 |
11.4 |
4. |
Real GDP at Factor Cost |
7.3 |
9.4 |
9.6 |
9.0 |
9.2 |
9.3 |
8.8 |
8.8 |
7.9 |
|
|
|
(100) |
(100) |
(100) |
(100) |
|
|
|
|
|
Memo:(Amount in Rupees crore) |
|
a) |
Real GDP at Factor Cost
(1999-2000 prices) |
|
26,12,847 |
28,64,310 |
31,22,862 |
|
|
|
|
|
|
b) |
GDP at Current Market Prices |
35,80,344 |
41,45,810 |
47,13,148 |
|
|
|
|
|
@ : At 1999-2000 prices.
* : Quick Estimates.
# : Revised Estimates.
Note : Figures in parentheses indicate shares in real GDP.
Source : Central Statistical Organisation. |
Agricultural Situation
Monsoon set in over Kerala on May 31, 2008 coinciding almost with its normal date of arrival (June 1). It advanced rapidly and covered parts of south peninsula and entire North-Eastern States by June 2, 2008. Northward advance of monsoon over East and Central India also was near normal. Monsoon covered the entire country by July 10, 2008, five days ahead of the normal schedule of July 15. Rainfall during this year's monsoon (June 1 to September 30) has been near normal, with rainfall over the entire country amounting to two per cent below normal as against five per cent above normal during the corresponding period of the previous year (Table 2). Out of the 36 meteorological sub-divisions, 32 received excess/normal rainfall this year as compared with 30 last year. As on October 1, 2008, the total live water storage of 81 important reservoirs, accounting for around 72 per cent of the total reservoir capacity of the country, was 74 per cent of the full reservoir level (FRL) as compared with 79 per cent recorded during the corresponding period of the previous year. The average live water storage as per cent of FRL for the last ten years was at 66 per cent.
Table 2: Rainfall - South-West Monsoon (June-September 2008) |
Year |
Cumulative
Rainfall#
(per cent) |
Spatial Distribution
(Number of Meteorological Sub-Divisions) |
Excess
Rainfall |
Normal
Rainfall |
Deficient
Rainfall |
Scanty/
No Rain |
1 |
2 |
3 |
4 |
5 |
6 |
1998 |
6 |
12 |
21 |
3 |
0 |
1999 |
-4 |
3 |
26 |
7 |
0 |
2000 |
-8 |
5 |
23 |
8 |
0 |
2001 |
-8 |
1 |
30 |
5 |
0 |
2002 |
-19 |
1 |
14 |
19 |
2 |
2003 |
2 |
7 |
26 |
3 |
0 |
2004 |
-13 |
0 |
23 |
13 |
0 |
2005 |
-1 |
9 |
23 |
4 |
0 |
2006 |
-1 |
6 |
20 |
10 |
0 |
2007 |
5 |
13 |
17 |
6 |
0 |
2008 |
-2 |
2 |
30 |
4 |
0 |
# : Percentage deviation from long period average rainfall with (-)
indicating below normal rainfall.
Excess : +20% or more Normal : +19% to -19% Deficient : -20% to -59%
Scanty : -60% to -99% No Rain : -100%
Source : India Meteorological Department. |
As on October 10, 2008, area sown under all kharif crops at all-India level was placed at 100.9 million hectares as compared with 103.6 million hectares during the corresponding period of the previous year. While area sown under rice and oilseeds increased, that sown under coarse cereals, pulses, sugarcane and cotton declined due to floods in some parts of the country and weak spell of rainfall during June/July, particularly in Maharashtra and Karnataka (Table 3).
Table 3: Progress of Area Sown under Kharif
Crops - 2008-09 |
(Million hectares) |
Crop |
Normal
Area |
Area Coverage
(as on October 10) |
2007 |
2008 |
Variation |
1 |
2 |
3 |
4 |
5 |
Rice |
39.1 |
37.1 |
38.2 |
1.1 |
Coarse Cereals |
22.7 |
21.1 |
19.8 |
-1.4 |
of which: |
|
|
|
|
Bajra |
9.2 |
8.3 |
7.8 |
-0.5 |
Jowar |
4.2 |
3.4 |
2.9 |
-0.5 |
Maize |
6.4 |
7.4 |
7.1 |
-0.2 |
Total Pulses |
10.9 |
12.3 |
10.4 |
-1.9 |
Total Oilseeds |
15.9 |
17.7 |
18.3 |
0.6 |
of which: |
|
|
|
|
Groundnut |
5.4 |
5.4 |
5.3 |
-0.1 |
Soyabean |
7.3 |
8.8 |
9.6 |
0.9 |
Sugarcane |
4.1 |
5.3 |
4.4 |
-0.9 |
Cotton |
8.4 |
9.2 |
9.1 |
-0.1 |
All Crops |
101.9 |
103.6 |
100.9 |
-2.7 |
Source : Ministry of Agriculture, Government of India. |
The Ministry of Agriculture has set target for foodgrains production for 2008-09 at 233.0 million tonnes. According to the First Advance Estimates, the kharif foodgrains production during 2008-09 at 115.3 million tonnes is likely to belower than that of the previous year by 4.7 per cent (Table 4). The decline in foodgrains production could be attributed to a fall in the production of both pulses (27.7 per cent) and the coarse cereals (13.6 per cent). However, rice production is expected to exhibit a marginal improvement over the previous year. Among the commercial crops, while the output of sugarcane (13.5 per cent), oilseeds (9.6 per cent), cotton (8.0 per cent) are expected to witness a significant decline, the production of jute and mesta is expected to witness a marginal loss as compared to the previous year.
Table 4: Agricultural Production |
(Million tonnes) |
Crop |
2004-05 |
2005-06 |
2006-07 |
2007-08@ |
2008-09 |
Target |
Achievement @@ |
1 |
2 |
3 |
4 |
5 |
6 |
7 |
Rice |
|
83.1 |
91.8 |
93.4 |
96.4 |
97.0 |
|
|
Kharif |
72.2 |
78.3 |
80.2 |
82.8 |
83.0 |
83.3 |
|
Rabi |
10.9 |
13.5 |
13.2 |
13.6 |
14.0 |
|
Wheat |
68.6 |
69.4 |
75.8 |
78.4 |
78.5 |
|
Coarse Cereals |
33.5 |
34.1 |
33.9 |
40.7 |
42.0 |
|
|
Kharif |
26.4 |
26.7 |
25.6 |
31.7 |
32.6 |
27.4 |
|
Rabi |
7.1 |
7.3 |
8.3 |
9.0 |
9.4 |
|
Pulses |
13.1 |
13.4 |
14.2 |
15.1 |
15.5 |
|
|
Kharif |
4.7 |
4.9 |
4.8 |
6.5 |
5.9 |
4.7 |
|
Rabi |
8.4 |
8.5 |
9.4 |
8.7 |
9.6 |
|
Total Foodgrains |
198.4 |
208.6 |
217.3 |
230.7 |
233.0 |
|
|
Kharif |
103.3 |
109.9 |
110.6 |
121.0 |
121.5 |
115.3 |
|
Rabi |
95.1 |
98.7 |
106.7 |
109.7 |
111.5 |
|
Total Oilseeds |
24.4 |
28.0 |
24.3 |
28.8 |
31.8 |
|
|
Kharif |
14.1 |
16.8 |
14.0 |
19.8 |
20.0 |
17.9 |
|
Rabi |
10.2 |
11.2 |
10.3 |
9.0 |
11.8 |
|
Sugarcane |
237.1 |
281.2 |
355.5 |
340.6 |
340.0 |
294.7 |
Cotton # |
16.4 |
18.5 |
22.6 |
25.8 |
26.0 |
23.9 |
Jute and Mesta ## |
10.3 |
10.8 |
11.3 |
11.2 |
11.0 |
11.1 |
@ : Fourth Advance Estimates as on July 9, 2008.
# : Million bales of 170 kgs. each.
@@ : First Advance Estimates for 2008-09.
## : Million bales of 180 kgs. each.
Source : Ministry of Agriculture, Government of India. |
Food Management
The procurement of foodgrains (rice and wheat) during 2008-09 (up to October 20, 2008) aggregated 34.1 million tonnes, 65.7 per cent higher than that in the corresponding period of the previous year (Table 5). This was mainly on account of a more than two-fold increase in wheat procurement during the current year as compared with the previous year. The offtake of foodgrains (rice and wheat) during 2008-09 so far (up to July 31, 2008) at 12.1 million tonnes was marginally lower than that during the corresponding period of the previous year. The total stocks of foodgrains with the Food Corporation of India (FCI) and other Government agencies were at around 34.3 million tonnes as on August 1, 2008, which were higher by 61.8 per cent than that a year ago. The stocks of both rice (9.8 million tonnes) and wheat (24.4 million tonnes) were higher than their norms (9.8 million tonnes and 17.1 million tonnes, respectively) for July 1, 2008.
Table 5: Management of Food Stocks |
(Million tonnes) |
Month |
Opening Stock of Foodgrains |
Procurement of Foodgrains |
Foodgrains Offtake |
Closing Stock |
Norms |
Rice |
Wheat |
Total |
Rice |
Wheat |
Total |
PDS |
OWS |
OMS- Domestic |
Exports |
Total |
1 |
2 |
3 |
4 |
5 |
6 |
7 |
8 |
9 |
10 |
11 |
12 |
13 |
14 |
2004-05 |
13.1 |
6.9 |
20.7 |
24.0 |
16.8 |
40.8 |
29.7 |
10.6 |
0.2 |
1.0 |
41.5 |
18.0 |
|
2005-06 |
13.3 |
4.1 |
18.0 |
26.7 |
14.8 |
41.5 |
31.4 |
9.8 |
1.1 |
0.0 |
42.3 |
16.6 |
|
2006-07 |
13.7 |
2.0 |
16.6 |
26.7 |
9.2 |
35.9 |
31.6 |
5.1 |
0.0 |
0.0 |
36.8 |
17.9 |
|
2007-08 |
13.2 |
4.7 |
17.9 |
26.4 |
11.1 |
37.5 |
33.5 |
3.9 |
0.0 |
0.0 |
37.4 |
19.8 |
|
2008-09@ |
13.8 |
5.8 |
19.8 |
11.5 |
22.6 |
34.1 |
11.2 |
0.9 |
0.0 |
0.0 |
12.1 |
.. |
|
|
|
|
|
(9.5) |
(11.1) |
(20.6) |
(11.1) |
(1.2) |
(0.0) |
(0.0) |
(12.3) |
|
|
2007 |
January |
12.0 |
5.4 |
17.5 |
4.3 |
0.0 |
4.3 |
2.7 |
0.4 |
0.0 |
0.0 |
3.1 |
18.1 |
20.0 |
February |
12.6 |
5.4 |
18.1 |
2.4 |
0.0 |
2.4 |
2.7 |
0.5 |
0.0 |
0.0 |
3.1 |
19.1 |
|
March |
14.0 |
5.1 |
19.1 |
1.2 |
0.0 |
1.2 |
2.7 |
0.5 |
0.0 |
0.0 |
3.2 |
17.9 |
|
April |
13.2 |
4.7 |
17.9 |
0.9 |
7.9 |
8.7 |
2.6 |
0.2 |
0.0 |
0.0 |
2.8 |
25.1 |
16.2 |
May |
13.5 |
11.6 |
25.1 |
1.5 |
2.6 |
4.0 |
2.8 |
0.2 |
0.0 |
0.0 |
3.0 |
25.9 |
|
June |
12.6 |
13.3 |
25.9 |
1.3 |
0.7 |
2.0 |
2.7 |
0.2 |
0.0 |
0.0 |
3.0 |
23.9 |
|
July |
11.0 |
12.9 |
23.9 |
0.8 |
0.0 |
0.8 |
2.9 |
0.4 |
0.0 |
0.0 |
3.2 |
21.2 |
26.9 |
August |
9.2 |
12.0 |
21.2 |
0.1 |
0.0 |
0.1 |
2.8 |
0.3 |
0.0 |
0.0 |
3.0 |
17.9 |
|
September |
6.9 |
11.0 |
17.9 |
0.1 |
0.0 |
0.1 |
2.7 |
0.3 |
0.0 |
0.0 |
2.9 |
15.6 |
|
October |
5.5 |
10.1 |
15.6 |
7.4 |
0.0 |
7.4 |
2.7 |
0.3 |
0.0 |
0.0 |
2.9 |
19.7 |
16.2 |
November |
10.7 |
9.0 |
19.7 |
1.8 |
0.0 |
1.8 |
2.7 |
0.3 |
0.0 |
0.0 |
2.9 |
18.5 |
|
December |
10.1 |
8.4 |
18.5 |
3.5 |
0.0 |
3.5 |
2.7 |
0.3 |
0.0 |
0.0 |
3.0 |
19.2 |
|
2008 |
January |
11.5 |
7.7 |
19.2 |
4.5 |
0.0 |
4.5 |
2.9 |
0.3 |
0.0 |
0.0 |
3.2 |
21.4 |
20.0 |
February |
14.0 |
7.2 |
21.4 |
3.0 |
0.0 |
3.0 |
2.9 |
0.4 |
0.0 |
0.0 |
3.4 |
21.4 |
|
March |
14.7 |
6.5 |
21.4 |
1.6 |
0.0 |
1.6 |
3.1 |
0.5 |
0.0 |
0.0 |
3.5 |
19.8 |
|
April |
13.8 |
5.8 |
19.8 |
1.1 |
12.6 |
13.7 |
2.7 |
0.0 |
0.0 |
0.0 |
2.8 |
30.7 |
16.2 |
May |
12.9 |
17.7 |
30.7 |
2.1 |
8.8 |
10.9 |
3.0 |
0.2 |
0.0 |
0.0 |
3.1 |
36.4 |
|
June |
12.1 |
24.1 |
36.4 |
1.2 |
0.9 |
2.2 |
3.0 |
0.2 |
0.0 |
0.0 |
3.1 |
36.3 |
|
July |
11.3 |
24.9 |
36.3 |
0.1 |
0.2 |
0.3 |
2.8 |
0.3 |
0.0 |
0.0 |
3.1 |
34.3 |
26.9 |
August |
9.8 |
24.4 |
34.3 |
0.8 |
0.0 |
0.8 |
.. |
.. |
.. |
.. |
.. |
.. |
|
September |
.. |
.. |
.. |
1.4 |
0.0 |
1.4 |
.. |
.. |
.. |
.. |
.. |
.. |
|
October* |
.. |
.. |
.. |
4.9 |
0.0 |
4.9 |
.. |
.. |
.. |
.. |
.. |
.. |
16.2 |
PDS: Public Distribution System.
OWS: Other Welfare Schemes.
OMS : Open Market Sales.
.. : Not Available.
@ : Procurement up to October
20, 2008 and offtake up to July 31, 2008.
* : Procurement up to October 20, 2008.
Note :
1. Closing stock figures may differ from those arrived at by adding the opening stocks and procurement and
deducting offtake, as stocks include coarse grains also.
2. Figures in parentheses indicate procurement/offtake of foodgrains during the corresponding period of 2007-08.
3. Total minimum stocks are to be maintained, as on April 1, July 1, October 1, and January 1, by public agencies under the 'new buffer stocking policy' with effect from March 29, 2005. Source : Ministry of Consumer Affairs, Food and Public Distribution, Government of India. |
Industrial Performance
The industrial production decelerated during April-August 2008-09, with the year-on-year expansion being 4.9 per cent as against 10.0 per cent during April-August 2007-08 (Chart 2 and Table 6). The deceleration was on account of a lower growth in both the manufacturing and electricity sectors. According to the data on Index of Industrial Production (IIP), manufacturing recorded growth of 5.2 per cent during April-August 2008-09 as compared with 10.6 per cent during the corresponding period of the previous year. The electricity sector slowed down sharply to 2.3 per cent - the lowest growth in 1993-94 series for April-August period - on account of deceleration in power generation in thermal and decline in power generation in nuclear and hydro-power plants. The mining sector also decelerated to 4.1 per cent during the period from 4.9 per cent during April-August 2007-08.
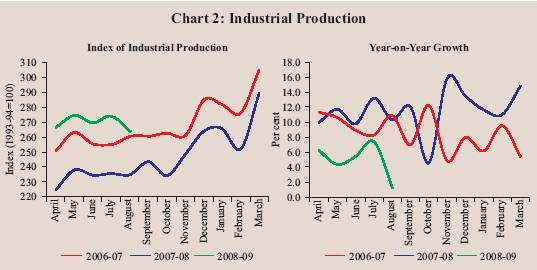
Table 6: Index of Industrial Production: Sectoral and Use-Based |
Classification of Industries |
(Per cent) |
Industry Group |
Weight in the IIP |
Growth Rate |
Weighted Contribution# |
2007-08 |
2007-08 |
2008-09 P |
2007-08 |
2007-08 |
2008-09 P |
April-August |
April-August |
1 |
2 |
3 |
4 |
5 |
6 |
7 |
8 |
Sectoral |
|
|
|
|
|
|
|
Mining |
10.5 |
5.1 |
4.9 |
4.1 |
4.2 |
3.4 |
5.4 |
Manufacturing |
79.4 |
9.0 |
10.6 |
5.2 |
89.5 |
89.3 |
90.7 |
Electricity |
10.2 |
6.3 |
8.3 |
2.3 |
6.3 |
7.3 |
3.9 |
Use-Based |
|
|
|
|
|
|
|
Basic Goods |
35.6 |
7.0 |
9.9 |
3.8 |
24.7 |
29.8 |
23.0 |
Capital Goods |
9.3 |
18.0 |
20.1 |
9.2 |
25.0 |
22.0 |
22.3 |
Intermediate Goods |
26.5 |
8.9 |
9.9 |
0.7 |
27.4 |
26.8 |
3.8 |
Consumer Goods (a+b) |
28.7 |
6.1 |
6.7 |
7.8 |
22.9 |
21.5 |
49.4 |
a) Consumer Durables |
5.4 |
-1.0 |
-2.3 |
5.6 |
-1.0 |
-1.9 |
8.6 |
b) Consumer
Non-durables |
23.3 |
8.5 |
10.0 |
8.6 |
24.0 |
23.5 |
40.8 |
General |
100.0 |
8.5 |
10.0 |
4.9 |
100.0 |
100.0 |
100.0 |
P : Provisional.
# : Figures may not add up to 100 due to rounding off.
Source : Central Statistical Organisation. |
The slowdown in the growth of manufacturing was on account of 13 industry groups, with a combined weight of 67.8 per cent in the IIP, recording decelerated/ negative growth during April-August 2008-09 (Table 7). While some industry groups such as ‘wool, silk and man-made fibre textiles’, ‘metal products and parts’, ‘rubber, plastic, petroleum and coal products’, ‘other manufacturing industries’, ‘jute and other vegetable fibre textiles’, ‘food products’ and ‘wood and wood products’ recorded decline in production, others such as ‘leather and leather and fur products’, ‘machinery and equipment’, ‘chemicals and chemical products’, ‘basic metal and alloy industries’, ‘non-metallic mineral products’, and ‘cotton textiles’ recorded decelerated growth.
Table 7: Growth of Manufacturing Groups |
(Per cent) |
Industry Group |
Weight in
the IIP |
Growth Rate |
Weighted Contribution # |
2007-08 |
2007-08 |
2008-09 P |
2007-08 |
2007-08 |
2008-09 P |
April-August |
April-August |
1 |
2 |
3 |
4 |
5 |
6 |
7 |
8 |
1 |
Food products |
9.08 |
7.0 |
16.0 |
-2.1 |
6.3 |
9.3 |
-2.4 |
2 |
Beverages, tobacco and related products |
2.38 |
12.0 |
9.2 |
25.1 |
6.8 |
4.6 |
23.3 |
3 |
Cotton textiles |
5.52 |
4.3 |
7.4 |
0.2 |
2.0 |
3.0 |
0.1 |
4 |
Wool, silk and man-made fibre textiles |
2.26 |
4.8 |
5.6 |
-1.2 |
1.5 |
1.6 |
-0.6 |
5 |
Jute and other vegetable fibre textiles
(except cotton) |
0.59 |
33.0 |
28.0 |
-7.4 |
0.9 |
0.7 |
-0.4 |
6 |
Textile products
(including wearing apparel) |
2.54 |
3.7 |
5.2 |
5.8 |
1.4 |
1.8 |
3.5 |
7 |
Wood and wood products,
furniture & fixtures |
2.70 |
40.5 |
86.5 |
-10.5 |
5.3 |
7.8 |
-3.0 |
8 |
Paper and paper products and printing,
publishing and allied Industries |
2.65 |
2.7 |
0.5 |
1.8 |
0.9 |
0.2 |
0.9 |
9 |
Leather and leather & fur products |
1.14 |
11.7 |
9.7 |
1.0 |
1.1 |
0.8 |
0.1 |
10 |
Chemicals and chemical products
(except products of petroleum & coal) |
14.00 |
10.6 |
9.5 |
7.5 |
22.4 |
18.3 |
26.8 |
11 |
Rubber, plastic, petroleum and
coal products |
5.73 |
8.9 |
12.4 |
-4.1 |
6.1 |
7.5 |
-4.8 |
12 |
Non-metallic mineral products |
4.40 |
5.7 |
7.4 |
1.2 |
4.1 |
4.7 |
1.4 |
13 |
Basic metal and alloy industries |
7.45 |
12.1 |
20.3 |
6.4 |
13.4 |
18.1 |
11.6 |
14 |
Metal products and parts
(except machinery and equipment) |
2.81 |
-5.6 |
1.4 |
-1.2 |
-1.5 |
0.3 |
-0.4 |
15 |
Machinery and equipment other than
transport equipment |
9.57 |
10.5 |
14.8 |
8.4 |
19.0 |
21.8 |
24.1 |
16 |
Transport equipment and parts |
3.98 |
2.9 |
2.0 |
13.0 |
2.3 |
1.3 |
14.8 |
17 |
Other manufacturing industries
|
2.56 |
19.8 |
8.2 |
-4.1 |
8.0 |
2.9 |
-2.7 |
|
Manufacturing - Total |
79.36 |
9.0 |
10.6 |
5.2 |
100.0 |
100.0 |
100.0 |
P: Provisional. # : Figures may not add up to 100 due to rounding off. |
Source : Central Statistical Organisation. |
In terms of use-based classification of the IIP, all the sectors, except consumer durables, recorded decelerated growth. The basic goods sector decelerated sharply to 3.8 per cent during April-August 2008-09 from 9.9 per cent during April-August 2007-08, mainly due to decline in production of phosphatic fertilisers, and certain steel and aluminium products. Decline in production of some yarns, particle board, corrugated boxes, etc., contributed to the subdued growth of the intermediate goods sector.
The capital goods sector growth was impacted by the lacklustre performance of machinery and equipments, and computer systems and peripherals during the period. The growth of the consumer goods sector recorded a marginal acceleration due to a turnaround in the consumer durables sector. The turnaround in the growth of consumer durables sector occurred primarily on account of strong growth in motor cycle, passenger cars, two wheeler tyres and metal utensils. The consumer non-durables segment moderated during April-August 2008-09 on account of base-effect and decline in production of sugar, wheat flour/maida, and certain edible oils.
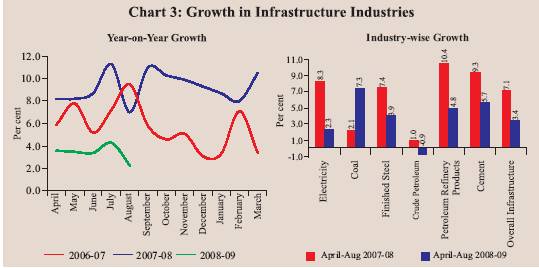
Infrastructure
The core sector recorded a lower growth of 3.4 per cent during April-August 2008-09 as compared with 7.1 per cent during April-August 2007-08 (Chart 3). Sharp deceleration in the electricity sector and subdued performance of petroleum refinery products adversely affected the growth of infrastructure during April-August 2008-09. The coal sector, on the other hand, posted higher growth. The cement and steel sectors recorded decelerated growth due to capacity constraints. The production of the crude oil sector declined during April-August 2008-09 due to decline in production in the oil fields of ONGC Ltd. on account of monsoon rains, shortage of input equipments and power shutdowns. The production of the petroleum refinery sector decelerated sharply on account of base-effect and dismal performance of some of public sector refineries.
Services Sector
The services sector recorded double-digit growth during the first quarter of 2008-09, although the growth rate moderated. With this, the services sector recorded double-digit growth for the fourteen consecutive quarters. The deceleration in growth was mainly on account of lower growth witnessed by ‘trade, hotels, restaurants, transport, storage and communication’ and ‘financing, insurance, real estate and business services’ sub-sectors during the quarter. The ‘construction’ and ‘community, social and personal services’ sub-sectors, however, recorded higher year-on-year growth (Table 8).
Table 8 : Services Sectors – Contribution to Real GDP Growth |
(percentage points) |
Year/Quarter |
Construction |
Trade, Hotels, |
Financing, Insurance, |
Community, Social |
Total |
Transport and
Communication |
Real Estate
and Business
Services |
and Personal
Services |
Services |
1 |
2 |
3 |
4 |
5 |
6 |
2000-01 |
0.4 |
1.6 |
0.5 |
0.7 |
3.2 |
2001-02 |
0.2 |
2.0 |
0.9 |
0.6 |
3.8 |
2002-03 |
0.5 |
2.2 |
1.1 |
0.6 |
4.3 |
2003-04 |
0.7 |
2.9 |
0.8 |
0.8 |
5.2 |
2004-05 |
1.0 |
2.7 |
1.2 |
1.0 |
5.8 |
2005-06 |
1.1 |
3.0 |
1.5 |
1.0 |
6.6 |
2006-07 |
0.8 |
3.1 |
1.9 |
1.0 |
6.8 |
2007-08 |
0.7 |
3.2 |
1.7 |
1.0 |
6.6 |
2007-08 : Q1 |
0.6 |
3.4 |
1.8 |
0.7 |
6.5 |
: Q2 |
0.9 |
3.0 |
1.9 |
1.1 |
6.9 |
: Q3 |
0.5 |
3.0 |
1.6 |
0.8 |
5.9 |
: Q4 |
0.9 |
3.4 |
1.5 |
1.3 |
7.1 |
2008-09 : Q1 |
0.8 |
3.0 |
1.4 |
1.1 |
6.4 |
Source : Central Statistical Organisation. |
The lead indicators of services sector activity for 2008-09, so far suggest acceleration in growth in respect of railway revenue earning freight traffic, commercial vehicles production and export cargo handled by civil aviation during April-July 2008-09 as compared with April-July 2007-08. On the other hand, growth decelerated in respect of cargo handled at major ports and other indicators of civil aviation excluding export cargo. Some deceleration was also observed in production of cement and steel during April-August 2008-09, which are among the important leading indicators of the construction industry (Table 9).
|
Table 9: Indicators of Service Sector Activity |
|
(Growth rates in per cent) |
|
Sub-sector |
2006-07 |
2007-08 |
2007-08
|
2008-09 |
|
April-July |
|
1 |
2 |
3 |
4 |
5 |
Tourist arrivals |
13.0 |
12.2 |
12.1 @ |
8.9 @ |
Commercial vehicles production# |
33.0 |
4.8 |
3.4* |
8.9* |
Railway revenue earning freight traffic |
9.2 |
9.0 |
6.1 |
9.4 |
New cell phone connections |
85.4 |
38.3 |
57.6 |
31.0 |
Cargo handled at major ports |
9.5 |
11.9 |
14.9 |
8.3 |
Civil aviation |
|
|
|
|
a) Export cargo handled |
3.6 |
7.5 |
3.6 |
8.1 |
b) Import cargo handled |
19.4 |
19.7 |
23.4 |
6.6 |
c) Passengers handled at international terminals |
12.1 |
11.9 |
11.8 |
7.9 |
d) Passengers handled at domestic terminals |
34.0 |
20.6 |
27.3 |
-2.2 |
Cement** |
9.1 |
8.1 |
9.3 * |
5.7 * |
Steel** |
13.1 |
5.1 |
7.4 * |
3.9 * |
Aggregate deposits of SCBs |
23.8 |
22.4 |
10.0 @@ |
7.7 @@ |
Non-food credit of SCBs |
28.5 |
23.0 |
6.1 @@ |
7.8 @@ |
@ : April-September. # : Leading Indicator for transportation.
* : April-August.
** : Leading indicators for construction.
@@ : Up to September 26.
SCBs : Scheduled Commercial Banks.
Source : Ministry of Tourism; Ministry of Commerce and Industry;
Ministry of Statistics and Programme Implementation;
The Reserve Bank of India; and Centre for Monitoring Indian Economy. |
Aggregate Demand
The share of total final consumption expenditure at 70.1 per cent during the first quarter of 2008-09 was the same as that during the first quarter of 2007-08. The share of real gross fixed capital formation (GFCF) increased marginally to 32.3 per cent in the first quarter of 2008-09 as compared with 32.0 per cent in the corresponding period of 2007-08 (Table 10).
Table 10: Expenditure Side of GDP (Base: 1999-2000) |
(Rates as per cent of GDP at Market Prices) |
Item |
2006-07* |
2007-08# |
2007-08 |
2008-09 |
Q1 |
Q2 |
Q3 |
Q4 |
Q1 |
1 |
2 |
3 |
4 |
5 |
6 |
7 |
8 |
1. Total Final Consumption |
|
|
|
|
|
|
|
Expenditure |
68.4 |
67.8 |
70.1 |
68.2 |
69.0 |
64.6 |
70.1 |
(i) Private Final Consumption
Expenditure |
58.6 |
58.2 |
59.8 |
59.5 |
60.7 |
53.4 |
59.8 |
(ii) Government Final
Consumption Expenditure |
9.8 |
9.6 |
10.3 |
8.7 |
8.3 |
11.2 |
10.3 |
2. Gross Fixed Capital
Formation |
30.6 |
31.9 |
32.0 |
33.4 |
31.0 |
31.6 |
32.3 |
3. Change in Stocks |
2.1 |
2.0 |
2.1 |
2.1 |
1.9 |
1.9 |
2.1 |
4. Valuables |
1.2 |
1.3 |
1.2 |
1.3 |
1.4 |
1.1 |
1.3 |
5. Exports |
20.6 |
20.3 |
23.8 |
16.8 |
19.0 |
21.6 |
26.3 |
6. Less: Imports |
24.7 |
24.4 |
24.9 |
24.8 |
25.4 |
22.8 |
28.0 |
7. Discrepancies |
1.8 |
1.1 |
-4.3 |
3.1 |
3.0 |
1.9 |
-4.1 |
Memo: |
|
|
|
|
|
(Rupees crore) |
Real GDP at market prices |
31,17,372 |
33,98,767 |
7,69,871 |
7,88,514 |
8,99,098 |
9,41,283 |
8,30,681 |
* : Provisional Estimates. # :
Quick Estimates.
Source :Central Statistical Organisation. |
Corporate Performance
Sales by the corporate sector grew at a higher rate during the first quarter of 2008-09 in comparison with that of the first quarter of 2007-08. However, growth in net profits in the first quarter of 2008-09 was significantly lower as compared with that of first quarter of 2007-08 and double digit growth rates recorded in the previous quarters (Table 11). The net profits grew by 8.2 per cent as against 33.9 per cent in first quarter of 2007-08. Increase in expenditure on account of rising input and staff costs in the past few quarters exerted pressure on profits. Interest payments also rose sharply by 59.7 per cent reflecting the general hardening of interest rates.
|
Table 11: Corporate Sector - Financial Performance |
(Growth rates in per cent) |
Item |
2005-06 |
2006-07 |
2007-08 |
2007-08 |
2008-09 |
|
|
|
|
Q 1 |
Q 2 |
Q 3 |
Q 4 |
Q 1 |
1 |
2 |
3 |
4 |
5 |
6 |
7 |
8 |
9 |
Sales |
17.9 |
26.5 |
18.3 |
19.2 |
16.0 |
18.0 |
20.6 |
30.0 |
Other Income |
19.7 |
31.3 |
46.2 |
106.7 |
45.2 |
70.2 |
28.5 |
2.6 |
Expenditure |
18.9 |
24.7 |
18.4 |
18.0 |
15.3 |
18.9 |
23.3 |
34.5 |
Depreciation |
11.6 |
17.2 |
14.8 |
18.1 |
15.8 |
17.9 |
15.4 |
15.2 |
Gross profits |
20.5 |
44.7 |
22.8 |
31.9 |
22.5 |
20.4 |
16.8 |
13.1 |
Interest payments |
1.7 |
24.9 |
28.8 |
4.4 |
18.4 |
45.7 |
35.8 |
59.7 |
Profits after tax |
28.2 |
44.0 |
26.2 |
33.9 |
22.7 |
29.4 |
14.1 |
8.2 |
Select Ratios (Per cent) |
Gross Profits to Sales |
12.4 |
14.2 |
16.3 |
16.7 |
16.3 |
16.2 |
15.0 |
14.6 |
Profits After Tax to Sales |
8.4 |
9.6 |
11.8 |
11.6 |
11.5 |
12.2 |
10.3 |
9.9 |
Interest to Sales |
2.3 |
2.3 |
2.2 |
2.0 |
2.1 |
2.5 |
2.2 |
2.4 |
Interest to Gross Profits |
18.6 |
16.1 |
13.8 |
11.8 |
12.8 |
15.3 |
14.6 |
16.7 |
Interest Coverage (Times) |
5.4 |
6.2 |
7.3 |
8.5 |
7.8 |
6.5 |
6.8 |
6.0 |
Memo: (Amount in Rupees crore) |
No of Companies |
3,016 |
3,016 |
2,359 |
2,342 |
2,228 |
2,329 |
2,357 |
2,315 |
Sales |
9,32,524 |
11,80,089 |
11,41,711 |
2,80,814 |
2,97,110 |
3,06,238 |
3,50,917 |
3,56,498 |
Other Income * |
40,901 |
53,722 |
30,958 |
9,151 |
8,057 |
9,221 |
10,082 |
8,108 |
Expenditure # |
8,34,079 |
10,40,205 |
9,56,930 |
2,37,698 |
2,49,194 |
2,57,472 |
3,02,105 |
3,10,320 |
Depreciation Provision |
38,886 |
45,558 |
40,664 |
10,173 |
10,576 |
10,961 |
11,805 |
11,413 |
Gross Profits |
1,16,362 |
1,68,351 |
1,86,665 |
46,780 |
48,296 |
49,717 |
52,583 |
51,985 |
Interest Payments |
21,652 |
27,050 |
25,677 |
5,504 |
6,194 |
7,609 |
7,703 |
8,698 |
Profits After Tax |
78,520 |
1,13,081 |
1,34,291 |
32,699 |
34,266 |
37,470 |
36,109 |
35,270 |
* : Other income excludes extra extraordinary income/expenditure if reported explicitly.
# : The increase or decrease in stock in trade is accounted under total income instead of total expenditure as was hitherto done.
Notes :
1. Data for 2005-06 and 2006-07 are based on audited balance sheets, while those for 2007-08 and 2008-09 are based on abridged financial results of the select non-Government non-financial public limited companies.
2. Growth rates are percentage changes in the level for the period under reference over the corresponding period of the previous year for common set of companies.
3. The quarterly data may not add up to annual data due to differences in the number and composition of companies covered in each period. |
Business Expectation Surveys
According to the quarterly business expectations survey of the National Council of Applied Economic Research (NCAER) released in July 2008, the overall business confidence index (BCI) for the next six months has declined (Table 12). Despite the lower overall business confidence, sales and growth in output were expected to show a positive growth. A component-wise analysis shows that all the four components of BCI, viz., overall economic conditions, investment climate, financial position of firms and capacity utilisation declined over the previous round. All five constituting sectors of the BCI, viz., consumer goods (durables and non-durables), intermediates, capital goods and services declined sharply over the previous period.
Table 12: Business Expectations Surveys |
(Per cent) |
Organisation |
Business Expectations |
Growth over a year ago |
Growth over previous round |
Period |
Index |
1 |
2 |
3 |
4 |
5 |
NCAER |
July-December 2008 |
Business Confidence Index |
-8.8 |
-15.4 |
FICCI |
July-December 2008 |
Expectation Index |
-20.3 |
-5.1 |
RBI |
October-December 2008 |
Business Expectation Index |
-4.4 |
-2.6 |
Dun & Bradstreet |
July-September 2008 |
Business Optimism Index |
-28.1 |
1.8 |
According to the latest (October 2008) business confidence survey conducted by Federation of Indian Chambers of Commerce and Industry (FICCI), the overall business confidence index during April-June 2008 declined by 5.1 per cent over the previous quarter on account of rise in interest rates and stricter credit availability. The FICCI’s expectation index for July-December 2008 also declined by 5.1 per cent over the previous quarter and 20.3 per cent over the previous year.
The composite business optimism index for October-December 2008 compiled by Dun and Bradstreet (D&B) increased by 1.8 per cent as compared with the previous quarter, while it declined by 28.1 per cent as compared with the previous year. All the six optimism indices – volumes of sales, net profits, selling prices, new orders, inventory levels and employee levels – declined as compared with the corresponding quarter of the previous year. Optimism was particularly low among respondents in the consumer durables and basic goods sectors.
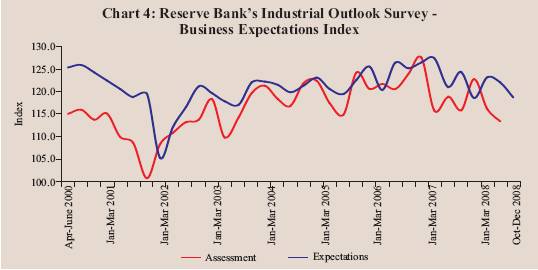
According to the Reserve Bank's Industrial Outlook Survey of manufacturing companies in the private sector, the business expectations indices based on assessment for July-September 2008 and on expectations for October-December 2008 declined by 2.4 per cent and 2.6 per cent, respectively, over the corresponding previous quarters. Similar trend was observed in these indices when compared over the corresponding quarters of the previous year (Chart 4).
During the period under review, the confidence of manufacturing corporates has declined for major indicators, such as, overall business situation, financial situation, availability of finance, production, order books and profit margins (Table 13). Increasing raw material prices have added to negative sentiments of the respondents significantly. Higher input costs are expected to affect profit margins significantly during July-December 2008 and, therefore, to protect their profit margins, more corporates may increasingly pass on the price increase to the consumers.
Table 13: Reserve Bank's Industrial Outlook Survey - Net Response on
‘A Quarter Ahead’ Expectations About the Industrial Performance |
(Per cent) |
Parameter |
Response |
July-Sept
2007 |
Oct-Dec
2007 |
Jan-Mar
2008 |
April-June
2008 |
July-Sept
2008 |
Oct-Dec
2008 |
1 |
2 |
3 |
4 |
5 |
6 |
7 |
8 |
1. |
Overall business situation |
Better |
49.5 |
50.2 |
47.7 |
46.0 |
41.8 |
33.7 |
|
|
|
(41.2) |
(42.1) |
(42.9) |
(42.7) |
(42.6) |
(44.1) |
2. |
Financial situation |
Better |
41.3 |
40.1 |
40.3 |
36.6 |
32.7 |
27.7 |
|
|
|
(49.8) |
(51.3) |
(50.3) |
(51.6) |
(53.0) |
(52.5) |
3. |
Working capital finance requirement |
Increase |
34.5 |
32.2 |
34.7 |
36.6 |
33.6 |
33.8 |
|
|
|
(59.2) |
(62.6) |
(60.3) |
(56.5) |
(57.3) |
(57.7) |
4. |
Availability of finance |
Improve |
32.1 |
33.8 |
31.1 |
32.3 |
30.2 |
23.3 |
|
|
|
(58.6) |
(58.8) |
(59.5) |
(58.3) |
(57.9) |
(59.0) |
5. |
Production |
Increase |
46.6 |
49.0 |
43.9 |
45.2 |
43.5 |
39.8 |
|
|
|
(41.1) |
(40.9) |
(42.3) |
(41.0) |
(36.6) |
(42.1) |
6. |
Order books |
Increase |
43.6 |
44.1 |
37.1 |
41.5 |
38.5 |
35.7 |
|
|
|
(46.1) |
(46.0) |
(48.6) |
(44.3) |
(43.5) |
(46.1) |
7. |
Pending orders, if applicable |
Below normal |
-2.2 |
-3.5 |
0.4 |
-4.3 |
2.2 |
4.6 |
|
|
|
(82.6) |
(82.4) |
(80.2) |
(81.3) |
(80.9) |
(82.0) |
8. |
Cost of raw material |
Decrease |
-46.0 |
-42.4 |
-44.1 |
-48.2 |
-54.7 |
-61.1 |
|
|
|
(49.7) |
(51.0) |
(49.2) |
(46.0) |
(39.1) |
(32.3) |
9. |
Inventory of raw material |
Below average |
-5.4 |
-6.3 |
-7.3 |
-7.0 |
-3.8 |
-7.6 |
|
|
|
(85.0) |
(85.0) |
(84.8) |
(83.2) |
(81.8) |
(77.6) |
10. |
Inventory of finished goods |
Below average |
-2.7 |
-3.5 |
-4.5 |
-5.8 |
-1.5 |
-4.3 |
|
|
|
(87.1) |
(86.4) |
(86.1) |
(84.5) |
(84.5) |
(82.6) |
11. |
Capacity utilisation (Main product) |
Increase |
27.0 |
28.4 |
24.2 |
25.6 |
22.2 |
26.4 |
|
|
|
(61.4) |
(61.5) |
(62.3) |
(59.9) |
(58.8) |
(56.0) |
12. |
Level of capacity
utilisation (Compared to the average in
the preceding four quarters) |
Above normal |
9.4 |
10.7 |
6.4 |
9.4 |
3.6 |
-0.5 |
|
|
|
(76.5) |
(77.2) |
(78.3) |
(77.0) |
(74.9) |
(78.7) |
13. |
Assessment of the production capacity (With regard to expected demand in |
More than |
3.0 |
4.2 |
4.7 |
8.0 |
4.6 |
5.7 |
|
the next six months) |
adequate |
(82.2) |
(83.0) |
(83.8) |
(81.2) |
(81.3) |
(81.7) |
14. |
Employment in the company |
Increase |
17.4 |
16.7 |
14.6 |
20.8 |
15.8 |
16.6 |
|
|
|
(73.5) |
(74.1) |
(75.6) |
(68.2) |
(71.5) |
(70.4) |
15. |
Exports, if applicable |
Increase |
32.6 |
31.4 |
24.3 |
27.7 |
27.7 |
27.3 |
|
|
|
(55.6) |
(55.9) |
(58.3) |
(53.3) |
(54.9) |
(54.3) |
16. |
Imports, if any |
Increase |
23.7 |
20.8 |
20.1 |
25.3 |
21.3 |
21.4 |
|
|
|
(68.2) |
(68.6) |
(70.5) |
(65.6) |
(66.5) |
(67.9) |
17. |
Selling prices are expected to |
Increase |
19.0 |
13.0 |
14.9 |
19.1 |
21.0 |
26.2 |
|
|
|
(67.1) |
(68.5) |
(67.1) |
(66.0) |
(61.5) |
(57.6) |
18. |
If increase expected in selling prices |
Increase at |
10.4 |
3.7 |
13.3 |
9.0 |
3.0 |
0.6 |
|
|
lower rate |
(65.0) |
(58.9) |
(66.7) |
(64.0) |
(61.3) |
(54.7) |
19. |
Profit margin |
Increase |
7.5 |
9.6 |
5.4 |
7.2 |
3.8 |
-3.6 |
|
|
|
(62.6) |
(59.6) |
(60.0) |
(61.0) |
(59.8) |
(54.7) |
Note :
1. ‘Net response’ is measured as the percentage share differential between the companies reporting ‘optimistic’
(positive) and ‘pessimistic’ (negative) responses; responses indicating status quo (no change) are not reckoned.
Higher ‘net response’ indicates higher level of confidence and vice versa.
2. Figures in parentheses are the percentages of respondents with ‘no change over the preceding quarter’ as
responses. |
The Centre for monitoring Indian Economy (CMIE) revised their estimate for overall industrial growth downwards to 8.3 per cent from 9.1 per cent for 2008-09. According to the CMIE, the downward revision reflected specific problems faced by certain industries rather than any general industrial slowdown. On the other hand, the growth projections were revised upwards for those industries which performed better than expected during the current financial year so far. Sectors such as electricity, crude oil and petroleum products, according to the CMIE, are likely to show acceleration in growth in the second half of the 2008-09 and push up the overall industrial growth. Furthermore, the CMIE has again raised the issue of inadequacy of the estimates of industrial production (as per the IIP) in capturing the actual production trends.
The ABN-AMRO Purchasing Managers’ Index (PMI)1 for manufacturing for September 2008 was at 57.3, which, though slightly lower than 57.8 in August 2008, suggests improvement in the health of the industry. Business conditions within the Indian manufacturing sector improved in September 2008, driven by growth in both production and new order levels. New orders from both domestic and foreign markets increased in September 2008 on account of strong market demand and successful promotional activities. Overall, the PMI for September shows some improvement in output along with a pick-up in input and output price inflation.
Survey of Professional Forecasters2
The results of professional forecasters’ survey conducted by the Reserve Bank in September 2008 suggest further moderation in economic activity for 2008-09 on the whole (Table 14). The median forecast of real GDP growth for 2008-09 was 7.7 per cent in the fifth round of the survey (September 2008) as compared with 7.9 per cent in the previous round (June 2008). The sectoral growth rate forecasts for the agriculture and services were, however, kept unchanged. The sectoral growth rate forecast for industry was placed at 7.0 per cent as compared with 7.5 per cent in the previous round. The annual growth rate of imports was expected to be 27.2 per cent as compared with 29.5 per cent.
Forecasts by various agencies for real GDP growth in 2008-09 are set out in Table 15.
|
Table 14: Median Forecasts of Select Macroeconomic Indicators by |
Professional Forecasters |
Indicators |
Actual
2007-08 |
2008-09 |
2009-10 |
Annual |
Q2 |
Q3 |
Q4 |
Q1 |
E |
L |
E |
L |
E |
L |
E |
L |
E |
L |
1 |
2 |
3 |
4 |
5 |
6 |
7 |
8 |
9 |
10 |
11 |
12 |
1 |
Real GDP growth rate at factor cost |
|
|
|
|
|
|
|
|
|
|
|
|
(in per cent) |
9.0 |
7.9 |
7.7 |
8.0 |
7.7 |
7.7 |
7.6 |
7.6 |
7.6 |
7.5 |
7.5 |
|
a Agriculture & Allied Activities |
4.5 |
3.0 |
3.0 |
3.1 |
3.0 |
3.4 |
2.5 |
3.1 |
3.0 |
3.8 |
3.0 |
|
b. Industry |
8.1 |
7.5 |
7.0 |
7.1 |
6.9 |
7.0 |
6.9 |
7.4 |
7.5 |
7.3 |
7.3 |
|
c. Services |
10.7 |
9.5 |
9.5 |
9.9 |
9.5 |
9.6 |
9.5 |
9.6 |
9.3 |
9.5 |
9.4 |
2 |
Gross Domestic Saving (per cent of |
|
|
|
|
|
|
|
|
|
|
|
|
GDP at current market price) |
34.8* |
35.0 |
34.8 |
- |
- |
- |
- |
- |
- |
- |
- |
3 |
Gross Domestic Capital Formation |
|
|
|
|
|
|
|
|
|
|
|
|
(per cent of GDP at current |
|
|
|
|
|
|
|
|
|
|
|
|
market price) |
35.9* |
36.3 |
36.3 |
36.6 |
36.3 |
36.0 |
36.2 |
35.8 |
36.0 |
36.1 |
36.0 |
4 |
Corporate profit after tax |
|
|
|
|
|
|
|
|
|
|
|
|
(growth rate in per cent) |
26.2 |
16.0 |
18.0 |
20.3 |
17.4 |
17.4 |
17.5 |
16.0 |
17.8 |
19.5 |
18.0 |
5 |
T-Bill 91 days Yield |
|
|
|
|
|
|
|
|
|
|
|
|
(per cent-end period) |
7.1 |
8.2 |
8.4 |
- |
- |
- |
- |
- |
- |
- |
- |
6 |
10-year Govt. Securities Yield |
|
|
|
|
|
|
|
|
|
|
|
|
(per cent-end period) |
7.9 |
8.8 |
8.5 |
- |
- |
- |
- |
- |
- |
- |
- |
7 |
Export (growth rate in per cent) |
23.7 |
20.0 |
20.0 |
- |
- |
- |
- |
- |
- |
- |
- |
8 |
Import (Growth rate in per cent) |
29.9 |
29.5 |
27.2 |
- |
- |
- |
- |
- |
- |
- |
- |
9 |
Trade Balance (US $ billion) |
-90.1 |
- |
- |
-31.1 |
-31.0 |
-32.1 |
-31.0 |
-31.1 |
-29.0 |
-29.0 |
-32.0 |
E : Earlier Projection. L : Latest Projection. * : Pertains to 2006-07.
- : Not Available.
Note : Latest round refers to fifth round for the quarter ended September 2008,
while earlier round refers to fourth round
for the quarter ended June 2008.
Source : Survey of Professional Forecasters, Second Quarter 2008-09. |
Table 15: Projections of Real GDP for India by Various Agencies - 2008-09 |
(per cent) |
Agency |
Overall
Growth |
Agriculture |
Industry |
Services |
Month of
Projection |
1 |
2 |
3 |
4 |
5 |
6 |
ASSOCHAM # |
7.6 |
4.0 |
7.2 |
9.0 |
Jul-08 |
|
7.9 |
2.6 |
7.6 |
9.7 |
Apr-08 |
Confederation of Indian Industries (CII) |
above 8 |
- |
- |
- |
Sep-08 |
|
8.0 -8.5 |
- |
- |
- |
Mar-08 |
Citigroup |
7.2 |
2.0 |
6.1 |
9.4 |
Oct-08 |
|
7.5 |
2.0 |
6.8 |
9.6 |
Aug-08 |
|
7.7 |
3.0 |
7.5 |
9.2 |
Mar-08 |
|
8.3 |
3.0 |
8.0 |
10.1 |
Feb-08 |
Merrill Lynch |
7.5 |
3.0 |
5.6 |
9.3 |
Oct-08 |
|
7.6 |
3.0 |
6.3 |
9.3 |
Aug-08 |
|
7.9 |
2.5 |
7.4 |
9.6 |
June-08 |
|
8.2 |
3.0 |
7.6 |
9.9 |
Mar-08 |
Centre for Monitoring Indian Economy (CMIE) |
8.7 |
3.2 |
8.7 |
10.4 |
Oct-08 |
|
9.4 |
3.2 |
11.1 |
10.6 |
Aug-08 |
|
9.5 |
3.2 |
11.4 |
10.6 |
July-08 |
|
9.1 |
- |
- |
- |
Feb-08 |
NCAER @ |
7.6 |
2.3 |
8.2 |
8.9 |
Oct-08 |
|
7.8 |
2.5 |
8.4 |
9.1 |
July-08 |
|
8.1 |
3.0 |
8.1 |
9.7 |
May-08 |
|
9.1 |
- |
- |
- |
Feb-08 |
Standard & Poor's, CRISIL |
7.8 |
3.0 |
7.5 |
9.5 |
June-08 |
|
8.1 |
3.0 |
8.3 |
10.3 |
Apr-08 |
|
8.5 |
- |
- |
- |
Feb-08 |
Asian Development Bank |
7.4 |
|
|
|
Sep-08 |
|
8.0 |
- |
- |
- |
Apr-08 |
|
8.5 |
- |
- |
- |
Feb-08 |
International Monetary Fund * |
7.9 |
- |
- |
- |
Oct-08 |
|
8.0 |
- |
- |
- |
July-08 |
|
7.9 |
- |
- |
- |
Apr-08 |
|
8.4 |
- |
- |
- |
Oct-07 |
UNCTAD** |
7.6 |
|
|
|
Sep-08 |
United Nations Organisation |
8.2 |
- |
- |
- |
Jan-08 |
Economic Advisory Council to Prime Minister |
7.7 |
2.0 |
7.5 |
9.6 |
Aug-08 |
|
8.5 |
- |
- |
- |
Jan-08 |
Reserve Bank of India |
around 8.0 |
- |
- |
- |
July-08 |
|
8.0-8.5 |
- |
- |
- |
Apr-08 |
- : Not Available. * : Calendar year.
# : The Associated Chambers of Commerce and Industry of India.
@ : National Council of Applied Economic Research.
** : United Nations Conference on Trade and Development. |
1 The PMI is a composite indicator designed to provide an overall view of activity in the manufacturing sector. A PMI of 50.0 indicates no change while values above or below this level indicate an expansion or a contraction of the manufacturing activity.
2 Introduced by the Reserve Bank from the quarter ended September 2007. The forecasts made in the section are that of professional forecasters and not that of the Reserve Bank. |
 IST,
IST,


