R. Kannan, Siddhartha Sanyal and Binod Bihari Bhoi*
In India, against the backdrop of continuous development and integration of financial markets – both domestically and with the global economy – the role of rate channels in influencing monetary conditions has increased substantially in the recent past in contrast to the exclusive dominance of the quantum channel during the 1980s. This paper attempts to construct a monetary conditions index (MCI) for India in order to take both interest rate and exchange rate channels simultaneously into consideration while evaluating the stance of monetary policy and evolving monetary conditions. A “broad” MCI has also been constructed which incorporates credit growth as an additional indicator of monetary conditions. Our results reveal interest rate to be more important than exchange rate in influencing monetary conditions in India. In the Indian context, MCI has been effective to put together more than one indicator in order to provide a better assessment of the stance of monetary policy and reveals its role as a leading indicator of economic activity and inflation. Accordingly, our findings underscore the potential of MCI as a valuable indicator of monetary policy in India supplementing the existing set of multiple indicators adopted by the monetary authority.
JEL Classification : E52, E58
Keywords : Monetary Conditions Index (MCI), Rate Channel, Monetary Policy
Central banks, in the current globalised economic order, often face the difficult task of pursuing multiple objectives such as price stability, financial stability and non-inflationary growth even though it is widely recognised that price stability assumes prime importance, and other objectives are corollary to the prime one. For several emerging economies, the additional objectives of maintaining a stable exchange rate, a desired current account balance and an optimal level of reserves pose added challenges to the conduct of monetary policy. With such multiple – and often conflicting – objectives, no single channel of monetary transmission alone is considered enough today for any central bank to rely upon. Monetary policy affects output and prices through its influence on key financial variables such as interest rates, exchange rates, asset prices, credit and monetary aggregates with different lags. The variability of the lags is accentuated by the ongoing financial deregulation and innovations, both financial and technological, in a large number of economies. For monetary policy to be effective, it is, therefore, essential to have a broad understanding of these channels of monetary transmission. Accordingly, central banks have been increasingly monitoring and analysing multiple transmission channels simultaneously in drawing policy perspectives.
Consistent with the evolving policy objectives, the choice of intermediate targets is also transforming with time. Financial innovations and widespread cross-border capital flows in the recent past has made the conventional monetary targeting difficult to pursue in view of the doubts about the stability of the money demand function. This prompted several central banks to switch from exclusively targeting monetary or credit aggregates. Greater degree of trade openness and increasing capital flows have also imparted difficulties in targeting exchange rates inducing central banks to increasingly adopt flexible exchange rate regimes. Exclusive reliance on either monetary targeting or exchange rate targeting, thus, does not appear to be optimal for central banks in the conduct of contemporary monetary policy. However, in the absence of fully developed and integrated financial markets, central banks in most emerging market economies (EMEs) find it difficult to do away with the quantitative aggregates in their conduct of monetary policy. In particular, credit markets often play an important role to direct flow of resources to productive sectors of the economy. Thus, even as central banks in developing economies make use of short-term interest rates, monetary policy continues to aim at influencing aggregate demand by altering the quantity and timely availability of credit along with changes in the price of credit.
Structural, institutional and recent technological developments led to greater integration of various segments of the financial market in the recent past. This, in turn, has facilitated faster transmission of monetary policy impulses, thereby helping interest rates to emerge as the most preferred operating instrument for several central banks. However, with the fast integration of financial markets across the globe, conduct of monetary policy is becoming increasingly interdependent imposing constraints on the discretionary power of local monetary authorities in pursuing their domestic goals. Thus, instead of relying on any single instrument, it has become necessary for central banks to assess overall monetary conditions arising out of changes in both domestic as well as external macroeconomic factors. To capture the relative importance of domestic and external factors, certain central banks during the 1990s attempted to construct a monetary conditions index (MCI), a combination of interest rates and exchange rates, to evaluate the efficacy of their monetary management. The shift in focus of monetary policy in many countries from intermediate targets to more explicit emphasis on final policy goals also called for quantifying the effects of policy instruments on inflation and growth.
The aim of construction of MCI is to take both interest rate and exchange rate channels into consideration and is motivated from the standard open-economy macro models. MCI is typically measured as the weighted sum of the change in the short-term interest rate and exchange rate relative to a base period, with the weights being generally derived from empirical econometric models reflecting estimated impact of these variables on output or inflation. Thus, MCI encapsulates the extent of internal and external influences on the overall monetary conditions of a country. Higher the weight of the interest rate relative to that of the exchange rate in the MCI, greater is the importance of the former relative to the latter in influencing aggregate demand or prices. The rise in interest rate or appreciation of the exchange rates of the domestic currency, ceteris paribus, causes the economy to slow down and lowers inflationary pressures. A fall in interest rates or a depreciation of the domestic currency, on the other hand, generally stimulates the economy, albeit with the possibility of higher inflationary pressures in the long run. The change in MCI, thus, captures in a single number the degree of tightening or easing of the monetary conditions.
This paper attempts to construct MCI in the Indian context as an indicator supplementing the existing set of information variables (under the multiple indicator approach adopted by the Reserve Bank of India since 1998) employed in identifying the sources of changes in monetary conditions. Furthermore, it is also expected to provide a gauge on the relative importance of interest rates and exchange rate in the transmission mechanism of monetary policy in India.
The rest of the paper is organised as follows. Section II sets out the theoretical construct. Section III narrates the cross-country experience and presents a brief literature survey. Section IV describes the evolution of monetary conditions in India in the recent past and narrates the construction of “narrow” and “broad” MCI for India. Section V discusses the results and implications of MCIs in the Indian context. Section VI presents the conclusion.
II. The Theoretical Construct
As mentioned earlier, MCI is a weighted average of the change in the domestic interest rates and exchange rates, relative to their values on a pre-specified base date. MCI could be constructed in terms of the effect of the interest rate and exchange rate changes on either “aggregate demand” or “prices” (Freedman, 1994).
It can be computed using either nominal or real variables. In real terms, MCI at time tcan be written as:
MCIt = wr (rt – r0) + we (et – e0) ..................... (A)
where rt is the short-term real interest rate in period t, et is the logarithm of the real effective exchange rate (where a rise in et represents an appreciation of the domestic currency) in period t, and r0 and e0 are interest rate and the exchange rate, respectively, in a given base period and wr and we are the MCI’s weights, with wr + we = 1 and the ratio reflecting the relative impact of interest rate wr/we and exchange rate on a medium-run policy goal (e.g., output or inflation).
It may be noted that, since the index is constructed using differences between actual and an “arbitrarily” chosen base period, the index only represents a relative degree of change and not an absolute measure. No significance is usually attached to the level of the index and it should not be interpreted too mechanistically. The index is usually used to judge the degree of tightening or easing in monetary conditions from the base or some other reference period.
MCI can be used for monetary policy in various ways – as an operational target, as a monetary policy rule or as an indicator of policy stance. For its use as an operational target, the construction of MCI is based on the deviation of interest and exchange rates from certain equilibrium values, thereby implying deviation of current MCI from its “desired” level, which is believed to be associated with the long run objectives of monetary policy. The use of MCI in this way is complicated as it is not only difficult to estimate equilibrium values of the variables, but they are also subject to unanticipated shocks. For its use as a policy-rule, MCI is re-arranged by normalising on the interest rate where the interest rate is set to offset movements in the exchange rate to correct deviations of actual inflation from target or of actual output from potential. For its use as an indicator of policy stance, MCI does not require changing the level of monetary conditions to its desired path as is the case with its use as an operational target. Rather the change in MCI provides information about the policy stance. For instance, MCI calculated relative to a benchmark/ base period indicate whether policy has become “tighter” or “easier” relative to that period. In this construct, the absolute value of the MCI does not offer any meaningful interpretation, rather it is the direction of movement which reveals the change in policy stance. Accordingly, MCI as defined above in (A) is an indicator of stance, as changes in current interest rate and exchange rates are yet to have an effect on output and inflation.
Apart from interest rate and exchange rate, recent literature also emphasise on the role of bank lending channel, credit market channel and asset price channel in the transmission mechanism. However, none of the channels is considered self-sufficient independent of each other and their importance is always changing over time, adjusting with the changes in the financial system. It is argued that although central banks operate through short-term interest rates to influence the long-term rates, the connection is not well understood; regarding exchange rates, uncovered interest parity fails; on bank lending it is observed that tighter monetary policy does not necessarily imply tighter lending standards for banks; credit channel suffers as a significant portion of firm finance for investment comes from internal sources of funds such as retained earnings; and on asset prices, it is argued that monetary policy’s influence is limited (see Cecchetti, 2006). Thus, there exists a view that when there are other channels of monetary transmission in addition to interest rate or exchange rate channels, it may be desirable to consider as many of them as possible to evaluate the general stance of monetary policy.
In view of this, along with the traditional MCI based only on interest rate and exchange rate, it may, thus, be worth exploring deriving broader definitions of MCI including other variables such as credit offtake or asset prices, which have a bearing on the ultimate objectives of monetary policy. In the Indian context, for example, bank credit may be considered to be an important constituent while constructing MCI as banks play a dominant role in financial intermediation and, therefore, credit supply remains an important channel of monetary policy transmission mechanism. Accordingly, along with the traditional “narrow” MCI, in this paper, we have also attempted to derive a broader MCI in the Indian context by including credit growth along with the traditional variables, viz., interest rates and exchange rates.
III. Review of Literature and Cross Country Experience
The Bank of Canada pioneered the construction of MCI during the early 1990s in light of the close interlinkages between its money and foreign exchange markets. The adoption of the MCI as an operating target broadened the horizons of interest rate targeting by attempting to tackle exchange rate shocks. Nominal MCI served as the immediate operational target of monetary policy, supplemented by monetary data that had proved good leading indicators of output (especially real narrow money) and the inflation rate (especially broad money) (Freedman, 1994). The initial specifications of the Bank of Canada’s MCI equation eventually changed from being based on inflation to aggregate demand so as not to alarm the market, as a once-and-for-all price shock could be misinterpreted as the start of an inflationary spiral.
MCI became popular in several countries particularly during the second half of the 1990s as a way of interpreting the stance of monetary policy and its effect on the economy. Although today no central bank embraces MCIs explicitly in the form of a rule, MCIs have been used as a supplementary information variable by certain central banks in order to judge divergences between the actual and desired monetary conditions and as indicators of policy stance alongside other information variables.
The Reserve Bank of New Zealand (RBNZ) also used to take a stance on the monetary conditions based on MCI and had been announcing a future path of MCI, conditional on available information and consistent with the monetary policy stance.
Many other central banks also adopted MCI as a useful indicator of overall monetary conditions. The Norges Bank, the Bank of Iceland and the Bank of Sweden have constructed MCI as indicators of monetary conditions while the Bank of Finland adopted the MCI as a leading indicator of the influence of monetary conditions on aggregate demand. Several international agencies such as the Organisation for Economic Co-operation and Development (OECD), the International Monetary Fund (IMF) and the European Monetary Institute and investment firms such as Deutsche Bank, Goldman Sachs, J.P. Morgan have constructed MCIs to gauge monetary conditions for various countries (Table 1).
The Norges Bank used weightings produced by an inflation equation that, unlike the Phillips curve equation, did not take into account the output gap – the difference between actual GDP and potential GDP. Instead, it assigned a particularly large weight to the exchange rate and a much smaller weight to the interest rate, which suited a small open economy especially sensitive to variations in the relative value of its currency.
Frochen (1996) constructed MCIs for five European countries for the period from 1987 to 1995, with series covering the effective exchange rate and nominal short-term and long-term interest rates. The indicators showed that monetary policy might have had a stabilising influence on the comparable price level in France and Germany since 1990. These effects however, were fairly moderate in comparison with the opposite consequences of floating currencies on the economies of the United Kingdom, Italy and Spain starting in 1992. The same lack of symmetry shows up between the countries with strong currencies and those with weak currencies when the impact of monetary policy on real growth is considered.
Table 1: Select Relative Weights for MCI |
|
Central |
IMF |
OECD |
Deutcshe |
Goldman |
JP |
|
Bank |
|
|
Bank |
Sachs |
Morgan |
1 |
2 |
3 |
4 |
5 |
6 |
7 |
Australia |
|
|
2.3 |
|
|
4.3 |
Canada |
3.0 |
4.0 |
2.3 |
|
4.3 |
2.7 |
France |
|
3.0 |
4.0 |
3.4 |
2.1 |
3.5 |
Japan |
|
10.0 |
4.0 |
|
8.8 |
7.9 |
New Zealand |
2.0 |
|
|
|
|
|
Sweden |
3.0-4.0 * |
|
1.5 |
0.5 |
|
2.1 |
U.K. |
|
3.0 |
4.0 |
14.4 |
5.0 |
2.9 |
U.S.A. |
|
10.0 |
9.0 |
|
39.0 |
10.1 |
|
|
|
|
|
|
|
* : Indicates range as found in different studies.
Note : Weights are those on interest rates relative to those on exchange rates, e.g., a relative weight of 3 indicates that a one percentage point increase in interest rate is equivalent to a three percentage point increase in exchange rate in terms of their impact on aggregate demand over time.
Source : Ericsson, Jansen, Kerbeshian and Nymoen (1998) and Bank of Canada (1995). |
Patra and Pattanaik (1998) attempted to develop objective indicators in terms of indices of exchange market pressure, intervention activity and monetary conditions in case of India. The weights for exchange rate and interest rates were estimated from a reduced form equation of money demand including the exchange rate impact using a sample period of April 1990 to March 1998.
In case of a small open economy like Thailand, Hataiseree (1998) emphasised that focusing on interest rate and the exchange rate may be particularly important in policy making because the exchange rate may be a primary channel through which monetary policy affects inflation and economic activity and the MCI can be used to compare the degree of importance between interest rate and the exchange rate in influencing the future inflation rate.
Jin-Lung Lin (1999) compiled MCIs for Taiwan by deriving weights for interest rate and exchange rate from a single-equation reduced-form model for GDP with specific focus on dynamic specification, nonstationarity and parameter constancy. Empirical results show that variants of MCIs are capable of indicating the monetary stance in Taiwan.
While constructing the MCI for Turkey, Kesriyeli and Kocaker (1999), derived the weights from an estimation of a price equation rather than from an aggregate demand equation because in Turkey the exchange rate is thought to be the driving force in the price adjustment process. Furthermore, the weights in the MCI were meant to reflect the ‘linkage’ between the operational target and the final target – inflation. The findings revealed that despite the high rate of real interest and real appreciation, which reflected the tight monetary policy as seen in the MCI figures, inflation and output growth were still at very high level. The paper stressed that increases in price levels and the output growth should not be interpreted as the result of the monetary policy implemented by the central bank. Under such conditions, the central bank has adopted a relatively tight monetary policy since 1997, as indicated by the MCI, but this was not enough to cool down the economy because of general expansionary policies.
Gerlach and Smets (2000) derived a theoretical model to show that the optimal feedback rule of a central bank can be written in terms of an MCI, i.e., the central bank can optimise its objective function by setting a weighted average of interest rates and exchange rates according to macroeconomic conditions.
Peng and Leung (2005) estimated MCIs for mainland China for assessing its monetary and financial conditions, by extending the conventional MCI – a weighted sum of real interest rates and the real effective exchange rate – to capture the credit availability effect, as bank credit was viewed as an important channel through which China’s monetary policy is implemented. The MCI suggests a distinct easing of monetary conditions in 2002-03, reflecting a weaker US dollar, a relaxed lending policy by banks and an easing of deflation, which reduced the real interest rate thereby facilitating faster economic growth. However, macroeconomic measures to curb credit supply and raise interest rates in 2004 resulted in tighter monetary conditions. This was marked by a considerable rise in the MCI, which indicated a reversal of about half of the earlier easing.
Hyder and Khan (2006) constructed MCI for Pakistan using the Johansen’s cointegration techniques and pointed out eight tight and six soft periods of monetary stance during March 1991 to April 2006 in case of Pakistan. The paper noted that though the scope of its use as an operational tool is limited, MCI can serve as an important indicator of monetary policy stance in case of Pakistan, if used with caution alongside other indicators.
The review of literature and cross country experiences reveal that MCI had been used by central banks basically as an indicator for monetary conditions as well as short- and intermediate-run operational monetary target, with the weights aiming to reflect the relative impact of interest rates and exchange rates on aggregate demand or inflation. It could be seen from the literature that although it is possible to construct a weighted indicator relating to growth or inflation, there is widespread use of growth equations for the calibration of relative weights of MCI components.
Although MCIs expressed relative to a base period are relatively simple to calculate and appear to have intuitive appeal as measures of the stance of monetary policy in an open economy, they have been criticised both on their conceptual and empirical foundations [see among others, Eika, Ericsson and Nymoen (1996); Ericsson et al (1998); and Stevens (1998)]. MCI weights cannot be observed directly, so they are usually derived empirically from a model of the economy. Thus, MCI measures typically depend on the assumptions made to estimate them (including parameter constancy, cointegration, dynamics, exogeneity, estimation uncertainty and the choice of variables), and hence are model-specific. The MCI is a convex combination of an asset price and a rate of return, which may affect goal variables of monetary policy at different speeds. Thus, the responses of such goal variables to changes in the MCI will differ according to which component has changed. Different types of shocks have different implications for monetary policy. By construction, an MCI complicates the identification of exchange rate shocks because this requires focusing on movements in the exchange rate and interest rates separately, rather than aggregated together. Taken together, these factors may explain why the use of MCIs as operating targets has sometimes created difficulties. The analytical foundation of the MCI has been criticised on the ground that while the interest rate is exogeneous, the exchange rate is endogeneous and, therefore, these two variables should not be considered as substitutes in the way they are interpreted under MCI (King, 1997). Therefore, the movements in the MCI are required to be interpreted with caution. Although the frequency of outliers often tend to be less for MCI than for its constituent parts, an unidimensional pursuit of the MCI could easily lead to a “myopic” monetary policy, especially in the face of short-run shifts in market sentiment that do not affect fundamentals.
The early adopters of MCI, such as the Bank of Canada and the RBNZ, for instance, faced certain problems in continuing with MCI as operating targets. First, often market participants were inclined to take MCI as a precise short-term policy target. The Bank of Canada had to clarify that the MCI should not be treated as a narrow, precise measure, and it began to use the term “policy guide” to discourage the market to consider it as the operational target. Second, in view of the very construction of MCI, there were tendencies on the part of the market participants to treat all exchange rate movements as portfolio shocks with expectations of offsetting interest rate adjustment on the part of the central bank. On the contrary, the Bank of Canada, in fact, had to judge the source of the exchange rate shock and its persistence in order to decide its policy responses.
The MCI was particularly successful in Canada in the first half of the 1990s due to the dominance of portfolio adjustment shocks to its curreny. In the second half of the 1990s, however, real shocks on the Canadian currency were more common and, hence, offsetting interest rate responses were perceived to be unwarranted by the central bank. Accordingly, the Bank of Canada, since 1998, dropped the use MCI as the operational target. However, the Bank continued to reckon the importance of “monetary conditions” in describing its policy stance and its communication with the financial markets.
The RBNZ used to take a stance on the level of monetary conditions but did not take a view on desirable mix of interest rate and exchange rate, as it was believed that both rates could not be determined simultaneously in an open economy. The RBNZ, which initially used to announce the future path of MCI, eventually moved away from the practice since March 1999 as the use of tight indicative bands increased the day-to-day and week-to-week volatility of interest rates and did not allow sufficiently for the range and scale of events that had an impact on the New Zealand economy. However, the MCI continued to play an important role as a summary indictor of monetary conditions in monetary policy formulation at the RBNZ.
In general, with increasing trade openness and large cross-border capital flows across the globe since the second half of the 1990s, the increased dominance of real shocks to the exchange rate made it near-impossible for the central banks to project a desired path of MCI, thereby, reducing its effectiveness as an operating target. However, most of these central banks continued to reckon MCI as a useful indicator of monetary conditions. Cross-country experiences show that MCI is used by those countries which have been targeting short-term interest rates and the exchange rate as part of their intermediate targets of monetary policy. In fact, given the high degree of openness (as measured by the value of trade as proportion of GDP) of these economies, monitoring MCI is one possible way of incorporating the exchange rate directly into the framework of monetary policy. Technically, therefore, the greater the openness of an economy, the higher would be the weight of the exchange rate relative to that of the interest rate. This is particularly important in the context of a flexible exchange rate policy and growing internationalisation of economies where both interest rates and the exchange rate play a critical role in the transmission mechanism of monetary policy.
In India, in view of continuous development and integration of financial markets – both domestically and with the global economy – the role of exchange rate and interest rates in influencing monetary conditions has increased to a great extent in the recent past. With the increasing role of such rate variables in transmitting monetary policy, MCI may provide additional summary information on monetary conditions and qualify as a useful indicator under the multiple indicator approach adopted by the Reserve Bank of India (RBI) since 1998. The next Section of this paper attempts to construct MCIs for India – first, a traditional “narrow” MCI incorporating only interest rate and exchange rate and, thereafter, a “broad” MCI which uses credit as an additional variable along with interest rate and exchange rate.
IV. Monetary Conditions Index for India
The purpose of constructing an MCI for India is to assess the efficacy of the conduct of monetary policy by recognising the evolving importance of the various monetary transmission channels. Like many other EMEs, monetary policy in India has also witnessed significant changes in its operating procedures and instruments in the recent past. For instance, the conduct of Indian monetary policy had to face the challenges posed by the transition from a quantum to a rate channel of monetary transmission following financial liberalisation during the 1990s. The RBI’s Working Group on Money Supply (Chairman: Dr. Y.V. Reddy) pointed out that monetary policy exclusively based on money demand could lack precision (RBI, 1998). As a result while money supply continued to serve as an important information variable, the RBI felt it necessary to monitor a set of additional indicators for monetary policy formulation. Accordingly, the RBI adopted a multiple indicator approach from 1998 wherein, besides monetary aggregates, information pertaining to a range of rates of return in different financial market segments along with the movements in currency, credit, the fiscal position, merchandise trade, capital flows, the inflation rate, the exchange rate, refinancing and transactions in foreign exchange – which are available on a high frequency basis – were juxtaposed with data on output and the real sector activity for drawing policy perspectives. It is widely perceived that, though the medium- to long-term impact of money supply on inflation cannot be ignored for the purposes of monetary policy, the transition to a multiple indicator approach had been a logical outcome of monetary policy reforms in India, which provided the necessary flexibility to the RBI to respond more effectively to the changes in domestic and international economic and financial market conditions. Under this approach, the role of monetary aggregates as the exclusive intermediate target have been de-emphasised and short-term policy interest rates have gradually emerged as the operating target of monetary policy in contrast to the earlier reliance on reserve requirements and credit ceilings/sectoral allocation of credit. Within the multiple goals assigned to the monetary authority, the achievement of price and financial stability received greater emphasis. The overall objective has been approached in a flexible and time variant manner with a continuous rebalancing of priority between growth and price stability, depending on the underlying macroeconomic and financial conditions.
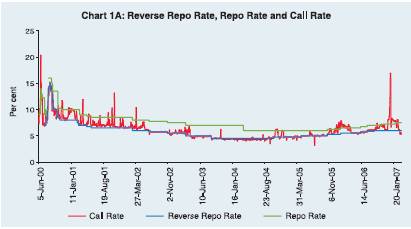
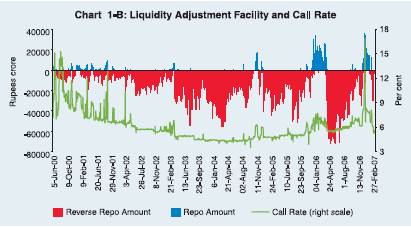
Consistent with the structural changes in the monetary policy framework, a greater degree of emphasis was placed on developing multiple rate-based channels of monetary transmission and to enhance policy effectiveness. Accordingly, the RBI simultaneously undertook the development of the domestic financial market spectrum, sequenced into the process of deregulation of interest rates, the withdrawal of statutory pre-emptions, the qualitative improvement in monetary-fiscal coordination and the progressive liberalisation of the exchange and payments regime, including institutionalising a market oriented exchange rate policy since the early 1990s. These efforts enabled a shift from direct instruments of monetary control to indirect instruments in consonance with the increasing market orientation of the economy enabling the RBI to influence short-term interest rates by modulating the liquidity in the system through the Liquidity Adjustment Facility (LAF) operations (Chart 1).
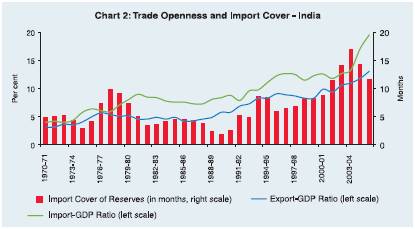
Apart from development in domestic financial markets, since the early 1990s the Indian economy witnessed a significant boost to external trade and capital flows enabled by a progressive liberalisation of the exchange and payments regime. The transition to market determined exchange rate of rupee took place in two stages. The liberalised exchange rate system (LERMS) instituted in March 1992 was a dual exchange rate arrangement under which 40 per cent of the current receipts were required to be surrendered to the Reserve Bank at official exchange rate while the rest 60 per cent could be converted at market rate. The unified market exchange rate regime replaced the dual exchange rate regime in March 1993 and since then the objective of exchange rate management in India has been to ensure that external value of the rupee is realistic and credible while reducing excess volatility in the short run and to help maintain adequate level of reserves. Exchange rate management is, thus, flexible without fixed or pre-announced targets or bands, with interventions primarily to ensure orderly market conditions. Quantitative restrictions on merchandise trade have been abolished and tariffs are progressively being brought down to international levels. Payments restrictions on
all current account transactions have been removed. A cautious and calibrated policy has been pursued for management of capital account liberalisation. The sequence and pace of liberalising capital transactions has been determined by the strength of the macroeconomic fundamentals and by the evolving international environment (RBI, 2004). Accordingly, with the phased opening up of the Indian economy to external flows and increasing trade openness, the role of the exchange rate in the transmission mechanism has also assumed greater importance in recent years (Chart 2).
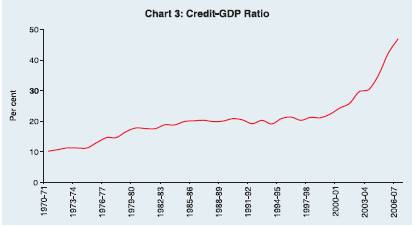
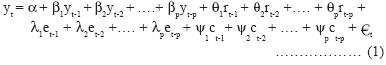
With the gaining prominence and success of the rate channels in transmitting policy signals, several measures were undertaken to strengthen the process of price discovery in the financial markets leading to higher degree of market integration and continued financial deepening. However, the pass-through of the policy signals through the rate channels alone have been inhibited by certain structural rigidities still persisting in the systems of a developing economy. In the absence of fully developed and integrated financial markets, thus, quantitative variables like bank credit continued to play an important role in the Indian context (Chart 3). Thus, even with the gaining importance of short-term interest rates and exchange rates, monetary policy continued to aim at influencing aggregate demand by altering the quantum and availability of credit along with changes in the price of credit. In general, it may be held that in less developed financial markets, by using direct monetary instruments in conjunction with market-based instruments, the overall policy effectiveness can be improved. Thus, quantitative variables, although diminishing in importance, still play an important role in the monetary transmission mechanism in India.
Accordingly, in the Indian context, along with constructing a conventional MCI using only rate variables, it may be worth incorporating quantitative variables like credit also in the construction of MCI. We now proceed to construct the indices for India and see what forms they take and what important information they provide for an objective analysis of monetary policy.
The Model
We have attempted to estimate a quarterly aggregate demand equation for deriving the relative weights of the components of MCI, i.e., real interest rate and real exchange rate. In deriving the relative importance of components of an MCI, inflation rate or output gap is commonly used in the literature as the dependent variable in the reduced form equation. In this study, however, the relative weights of the component variables in the narrow MCI are calibrated by estimating an aggregate demand equation using output growth (real GDP growth) instead of output gap as the dependent variable, because of the difficulties in estimating potential output due to the structural changes and liberalisation underway in India and also because of the presence of various price controls. Moreover, the conventional methods such as HP filter may not be appropriate in deriving potential GDP in our case because of the small sample period (1996 Q2 to 2007 Q1).
It may be observed that MCI is sensitive to the choice of the interest rate. In the Indian context, while policy rates give the signals, it is through the overnight call money rate that the market forms expectation about the policy stance. Accordingly, call rate is the most vibrant rate in the money market. Moreover, the call rate is preferred by the policy makers also over the alternative market-related short-term interest rates (e.g., Treasury Bills rate, CP rate or secondary market G-Sec yield) in order to decide on the extent and timing of intervention in the money market. In the absence of a continuous term structure of money market interest rates (constraints such as time buckets and underdeveloped CP market) call rate emerged as the preferred choice in case of India.
The construction of the narrow MCI implicitly assumes a reasonable degree of flexibility in the underlying exchange rate over time. In the Indian context, although the RBI at times intervenes in the foreign exchange market, it does not intervene with a pre-determined target for the exchange rate. It allows the exchange rate to move over time in line with the macro-economic fundamentals. The RBI’s intervention is essentially to curb excess volatility in the short-run and in order to ensure stability in the market. The recent phase of strong appreciation of the Indian Rupee and the RBI’s non-intervention provide us additional support in this regard for construction of the MCI.
While constructing the MCI, a number of issues are important. First, as MCI assumes an underlying model linking GDP or inflation to interest rates, exchange rate and other variables to obtain valid inference on the key parameters and the resulting MCI, the dynamics of the model should be correctly specified. Second, the possible existence of unit roots and cointegration should be taken into account in testing the parameter significance and interpreting parameters. The assumption of parameter constancy is essential for proper parameter estimate and should be examined. Finally, the issue of omitted variables needs to be examined as it could lead to biased parameter estimate. The following steps have been followed to deal with such issues in this paper.
First, for the purpose of estimation, the generalised aggregate demand equation takes the following form.
where y is real GDP growth rate, r is the real interest rate, e is real effective exchange rate, c is real credit growth rate and is the residual term.
In our estimation, aggregate demand is represented by the real GDP growth (excluding agricultural and allied activities, and community, personal and social services) in per cent (NANCGDPGP). Agriculture and allied activities and community, personal and social services have been excluded as they are relatively less sensitive to movements in interest rates and exchange rates. Interest rate is represented by inflation-adjusted call money rate in per cent (RCALLP), while real exchange rate is being captured by the deviation of the logarithm of the 36-country trade-based REER of the Indian rupee from its base value of 100 (ZLREER). The sample period is restricted to 1996Q2 to 2007Q1 because of non-availability of quarterly GDP data prior to 1996.
Second, we examine the issue of possible non-stationarity in the data. We test for presence of unit root for the series under investigation. The call rate, REER and credit growth turn out to be stationary at 5 per cent level of significance1. Although the real GDP growth series exhibits non-stationarity in general, the presence of a clear upward trend from the third quarter of 2001 suggests trend-stationarity. Accordingly, a trend-dummy for GDP has been introduced from 2001Q3 onwards denoted by GDPDUM.
Third, we carefully specify the dynamics of the model by incorporating appropriate lags of the dependent variable as well as the set of explanatory variables. Various types of diagnostic checking methods are employed to check if there is remaining correlation among the residuals such as the Ljung-Box Q-statistic test.
Under this freamework, narrow MCI can now be constructed as a weighted sum of deviations of interest rate and exchange rate from the base period as:
Narrow MCIt = wr (rt – r0) + we (et – e0) ………………. (2)
where t = 0 is the base period (in our case 1997Q2) and wr and we are the weights derived from the estimated coefficients of real interest rate and real exchange rate from the generalised aggregate demand equation.
In the generalised equation as specified above, the sign of qs is expected to be negative since increase in interest rate lowers aggregate demand. The sign of ls is also expected to be negative as by definition
an increase in REER signifies an appreciation of the Indian Rupee and, hence, ceteris paribus, dampen aggregate demand. Our estimate for the generalised aggregate demand equation (ignoring credit) is as follows, which exhibits expected signs for all the co-efficients and turned out to be significant.
NANCGDPGP = 0.02 + 0.73 NANCGDPGP(-1) – 0.15 RCALLP(-4) – |
(2.56)** (8.52)* |
|
(-2.34)** |
0.11 ZLREER(-3) + 0.01 GDPDUM |
|
(-2.04)** |
(2.74)* |
|
__2
R = 0.84 and Durbin’s h = -0.52 ………………. (3)
Since multiplying a constant to MCI does not change the index in any material way, it is the ratio of l/q that is critical in computing MCI, which can be derived from our estimated equation (3) as 0.73 (= 0.11 / 0.15). The estimated coefficients suggest the weights for interest rate (wr) and exchange rates (we) to be 0.58 and 0.42, respectively.
Thus, for simple economic interpretation, the MCI equation (2) can also be written as:
Narrow MCIt = (rt – r0)+ γ/θ (et – e0) ……………………..(4)
where γ/θ gives the relative importance of exchange rate vis-à- vis the interest rate. Thus, our estimation
result shows that one percentage point rise in real interest rate as equivalent to 1.36 (= 1/ 0.73) percentage point increase in REER (appreciation).
In order to further improve model specifications, we tried to include such a variable that was complementary to the price variables as far as the policy pronouncements are concerned for capturing the effect of any other possible transmission channel on the real macroeconomic variables. The literature shows that the credit stance of banks has important supplementary effects on monetary policy transmission (Bernanke and Gertler, 1995). This is important for India as banks continue to play a dominant role in financial intermediation. Moreover, policy emphasis on bank credit expansion remains an important tool for monetary policy implementation, as shown by the continuing monetary policy emphasis on priority sector lending and credit delivery mechanism and modulating prudential measures and provisioning requirements on bank exposures to specific sectors.
Accordingly, the study extends the conventional MCI to capture the credit availability effect on the real economy by taking into account bank credit also as an explanatory variable in the estimation of the reduced form equation (1). Bank credit is captured by the real (inflation-adjusted) growth rate of non-food credit extended by the scheduled commercial banks in per cent (RNFCGP)2.
Accordingly, for “broad” MCI the estimated equation is as follows:
NANCGDPGP = |
0.02 + 0.61 NANCGDPGP(-1) – 0.18 RCALLP(-4) – |
|
(3.03)* |
(6.35)* |
(-2.86)* |
|
0.13 ZLREER(-3) + 0.06 RNFCGP (-4) + 0.01 GDPDUM |
|
(-2.39)** |
(2.28)** |
(2.80)* |
_2
R = 0.86 and Durbin’s h = 0.28 …………………….. (5)
In this equation also the signs of the co-efficients of interest rate and exchange rate are expected to be negative and the sign of y, the coefficient of credit, is expected to be positive as increase in credit would, ceteris paribus, increase aggregate demand. Our estimates for equation (1) yield expected signs for all the co-efficients and turned out to be significant. The inclusion of credit did not distort the expected sign and significance of the other two variables, rather it improved the fit.
Thus, in line with equation (4), the “broad” MCI can be represented as:
Broad MCIt = (rt – r0)+ γ/θ (et – e0) + ψ/θ (ct- c0) …………….(6)
where γ/θ = 0.72 (=0.13/0.18) and ψ/θ = - 0.33 [= (-) (0.06/0.18)].
The estimated coefficients for broad MCI suggest the weights for interest rate, exchange rate and bank credit to be 0.73 and 0.51, and (-) 0.24, respectively. The ratios now need careful interpretation in view of an additional explanatory variable, i.e., bank credit. The ratio of the estimated coefficients suggest that a one percentage point rise in real interest rate is, ceteris paribus, equivalent to 1.39 percentage point rise in REER or a 3.03 percentage point decline in real credit growth. Although the two measures of MCI broadly co-move, the extent differs at times due to difference in the relative weights of the constituent variables (Chart 4).

As noted earlier, the cointegration technique should ideally be adopted for testing the parameter significance and interpreting parameters in case of construction of the MCI. However, due to the constraints of limited number of observations/data, the cointegration technique could not be applied. Accordingly, we have estimated the equation in growth rate form and various types of diagnostic checking methods are employed to check if there is remaining correlation among the residuals. The Ljung-Box Q-statistic suggests absence of autocorrelation in the estimated residuals up to 12 lags. As the sample period became short while working on quarterly GDP growth data which is available only from 1997Q2, we could not run sub-sample CUSUM test and recursive regressions to investigate the issue of parameter constancy.
V. Results and Implication
Our estimated coefficients for narrow MCI suggest the weights for interest rate (wr) and exchange rate (we) to be 0.58 and 0.42, respectively. The weights show that interest rate is relatively more important in influencing aggregate demand (58 per cent) than the exchange rate (42 per cent) during the period 1996Q2-2007Q1 and this seems to reflect the evolving dynamics of the Indian economy. This also suggests that flexibility in exchange rate and improvement in policy independence due to easing of fiscal dominance on monetary policy, along with continued policy emphasis at developing and deepening the financial markets in tandem with the deregulation of interest rates have enabled the emergence of interest rate as the main channel of monetary policy transmission in India. In a globalised environment, the higher weight for interest rate is also justified as interest rate modulations are integral parts of maintaining orderly conditions in financial markets, including the foreign exchange market. This is also in line with the increased convergence of operating procedures of monetary policy across countries.
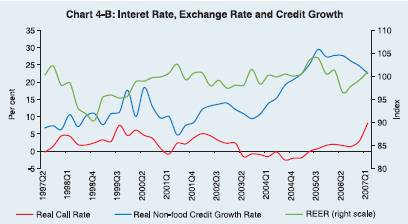
The monetary conditions so derived appears to explain the setting of monetary policy better when correlated with past economic events than that is explained by either interest rate or exchange rate independently and can be explained with the help of a phase-wise analysis of the movements in MCI (Chart 5). Economic liberalisation led to years of high growth during the latter half of the 1990s. The increase in MCI during this period emanated mostly from increases in interest rates. The phase of 1999-2002 was, on the contrary, a period of relatively subdued economic activity for India along with occasional oil price pressures. Accordingly, monetary policy response during this phase had to balance the concerns of supporting growth and mitigating the possibilities of a rise in inflation and inflationary expectations. Interest rates started stabilising with the gradual developments of the financial markets and the RBI’s liquidity management operations gaining greater precision. Real exchange rate, as depicted by the multi-country REER, followed an appreciating trajectory with larger capital inflows. The two-way movement of MCI during this phase reflected the counter-balancing movements of its constituents. The concerns of global economic slowdown since 2001 prompted many central banks to aggressively pursue an accommodative monetary policy. In India, following the significant deceleration in economic growth, the RBI also resorted to monetary easing since June 2002, which facilitated the process of economic recovery and can be traced in the easing of the MCI till September 2004. The continued
pursuance of accommodative monetary policy all over the globe helped reviving growth – world economic growth reached a high of over 5 per cent in 2004. The resultant demand pressures along with rising crude oil and other commodity prices fuelled inflationary spirals warranting several central banks, including the RBI, to pursue pre-emptive monetary tightening since September 2004 This phase of monetary tightening, in the Indian context, is also captured better by MCI compared to the trends in monetary aggregates or interest rates alone.
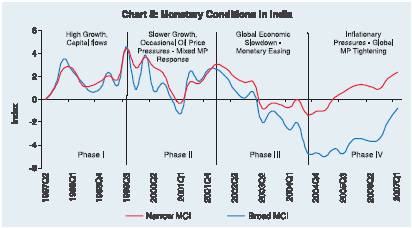
The inclusion of credit as another policy variable in the broad MCI needs careful interpretation. The estimated coefficients for broad MCI suggest the weights for interest rate, exchange rate and bank credit to be 0.73 and 0.51, and (-) 0.24, respectively. As bank credit positively associated with aggregate demand, the importance of both the rate variables on aggregate demand is estimated to have increased because of their offsetting impact when judged along with credit However, in view of pro-cyclicality in credit and counter-cyclical role of policy interest rate, the tightening or easing of monetary policy becomes a complex combination of the impact of the two forces. As such, the broad MCI behaves in a similar fashion like the narrow MCI and, in fact, better explains the extent of monetary easing during June 2002-September 2004 and the current phase of monetary tightening thereafter than what is suggested by money supply growth and narrow MCI. While the sharp growth in broad money since 2005Q1 implied monetary easing, the movement of MCI, in fact, suggests tightening of overall monetary conditions led by the continuous hikes in policy interest rates since October 2004 (Chart 6). Consequently, inflation which showed signs of deceleration by end-March 2005, eased further during 2005-06 reflecting simultaneous increases in policy rates as well as various prudential measures aimed at controlling credit to certain sectors of the economy. This along with the fiscal measures helped contain inflationary expectations in view of higher international crude oil prices. The firming up of inflation and inflationary expectations during 2006-07 led to further policy-induced tightening of monetary conditions


VI. Conclusion
The MCI, per se, is not an answer to the age-old debate regarding the conflict of objectives of monetary policy. It is, however, effective to put together more than one indicator in order to have a better assessment of the stance of monetary policy. It is actually possible to find phases when just by tracking the movements of one variable one may commit a mistake to conclude that there is a tightening (or easing) of policy unless the more-than-compensating counter-movements in the other variables are taken into account. In that context, as MCI systematically takes into account both (and even credit, in case of broad MCI) there is no room for missing such counter-movements.
This paper demonstrates that monetary policy in India is transmitted through various channels such as interest rates, exchange rates and credit and therefore combining the impact of various channels in the MCI could improve the information content and help to explain better the responses of monetary policy to the actual outturn of economic events. In view of gaining importance of exchange rate channel of monetary transmission in India, the interest rates are more aligned with the international interest rates in the last few years. On the other hand, while on its own bank credit adds to aggregate demand in the economy, the fuller impact is partly offset by the countercyclical movement in policy interest rates, thereby fine tuning the overall monetary conditions consistent with the evolving macroeconomic environment. As output appears to respond relatively quickly compared to inflation to changes in monetary policy setting, MCI and GDP growth appears to be linked more closely as compared to MCI and inflation, although the direction of change in MCI appears to be consistent with the objectives of both growth and price stability. The movement in MCI reveals its role as a leading indicator of economic activity and inflation in India when properly interpreted with the lagged responses of these variables to policy signals. MCI, thus, provides more information about the policy stance than what is revealed by either interest rates, exchange rates or credit independently. Accordingly, our findings underscore the potential of MCI as a valuable indicator of monetary policy in India under the existing multiple indicator approach.
Note
1 Using the Kwiatkowski-Phillips-Schmidt-Shin (KPSS) test statistic (with Newey-West bandwidth using Bartlett kernel).
2 The credit data series has been duly adjusted for the impact of the merger (ICICI) and conversion (IDBI) in the banking system and quarter-end and year-end aberrations in the recent past.
3 Narrow and broad MCIs for 2007 Q1 are based on the call rate series that exclude the three outliers when the call rate crossed 50 per cent during March 2007.
References
Bank of Canada (1995), Monetary Policy Report,May.
Bernanke, Ben. S. and Mark Gertler (1995), “Inside the Black Box: The Credit Channel of Monetary Policy Transmission”, Journal of Economic Perspectives, Volume 9, Number 4.
Cecchetti, S. (2006), “Sources of Central Bankers’ Influence over the Economy”, Paper presented at the Central Bank Governors’ symposium at the Bank of England, June.
Duguay, P. (1994), “Emprical Evidence on the Strength of the Monetary Transmission Mechanism in Canada: An Aggregate Approach” Journal of Monetary Economics, Vol.33 (1), pp. 39-61.
Eika, Kari H., Neil R. Ericsson and Ragnar Nymoen (1996), “Hazards in Implementing a Monetary Conditions Index”, Oxford Bulletin of Economics and Statistics, Vol 58, No.4.
Ericsson, N. R., E.S. Jansen, N. A. Kerbeshian, and R. Nymoen (1998), “Interpreting a Monetary Conditions Index in Economie Policy”, BIS Conference Papers, Vol.6, pp. 237-254.
Freedman, C. (1994), “The Use of Indicators and of the Monetary Conditions Index in Canada”, in Balino, T.J.T. and Cottarelli, C.(eds), Frameworks for Monetary Stability: Policy Issues and Country Experiences, pp. 458-476.
Frochen, P. (1996), “Monetary Conditions Indices”, Banque de France Bulletin Digest, No 31, July.
Gerlach, Stefan and Frank Smets (2000), “MCIs and Monetary Policy”,
European Economic Review (44/2000).
Hanson, B. and H. Lindberg (1994), “Monetary Conditions Index - A Monetary Policy Indicator”, Quarterly Review, Sveriges Riksbank, Vol. 3, pp. 12-17.
Hataiseree, Rungsun (1998), “The Roles of Monetary Conditions and the Monetary Conditions Index in the Conduct of Monetary Policy: The Case of Thailand under the Floating Rate Regime”, Bank of Thailand Quarterly Bulletin, September.
Hyder, Zulfikar and Muhammad Mazhar Khan (2006), “Monetary Conditions Index for Pakistan”, State Bank of Pakistan Working Paper No. 11/06, May.
Jin-Lung Lin (1999), “Monetary Condition Index in Taiwan”, Institute of Economics, Academia Sinia, August.
Kesriyeli M. and I. Ilhan Kocaker (1999), “Monetary Condition Index : A Monetary Policy Indicator for Turkey”, Discussion Paper No. 9908, Central Bank of Republic of Turkey.
King, M. (1997), “Monetary Policy and the Exchange Rate”, Quarterly Bulletin, Bank of England, pp. 225-227.
Patra, Michael Debabrata and Sitikantha Pattanaik (1998), “Exchange Rate Management in India: An Empirical Evaluation”, RBI Occasional Papers, September.
Peng, W. and F. Leung (2005), “A Monetary Conditions Index for Mainland China”, Hong Kong Monetary Authority Quarterly Bulletin, June.
Reserve Bank of India (1998), “Monetary Conditions Index”, Annual Report, 1997-98.
Reserve Bank of India (1998), Report of the Working Group on Money Supply: Analytics and Methodology of Compilation (Chairman: Dr. Y.V. Reddy).
Reserve Bank of India (2004), Report on Currency and Finance 2002-03.
Reserve Bank of New Zealand (1996), “Summary Indicators of Monetary Conditions”, Reserve Bank of New Zealand Bulletin, 59(3), pp 223-228.
Stevens, G.R. (1998), “Pitfalls in the Use of Monetary Conditions Indexes”, Reserve Bank of Australia Bulletin, August.
* Dr. R. Kannan was the Principal Adviser, Department of Economic Analysis and Policy, Reserve Bank of India when this article was finalised and currently is Member (Actuary) with the Insurance Regulatory and Development Authority. S/Shri Siddhartha Sanyal and Binod Bihari Bhoi are Assistant Adviser and Research Officer, respectively, in the Department of Economic Analysis and Policy, Reserve Bank of India.
The Authors sincerely thank S/Shri Muneesh Kapur, Sarat Chandra Dhal, Indranil Bhattacharyya, Satyananda Sahoo, Abhijit Pathak and an anonymous referee for their valuable comments. Contribution of Shri Indranil Sen Gupta to an earlier version of the paper is gratefully acknowledged which was presented at a Workshop on “Future Directions for the Indian Economy”, Gokhale Institute of Politics and Economics, Pune, December 4-6, 1998. The views expressed are those of the authors and not necessarily of the institutions they belong to.
* : Figures in parentheses are t-statistics – significant at 1 per cent level.
** : t-statistics – significant at 5 per cent level.
* : t-statistics – significant at 1 per cent level.
** : t-statistics – significant at 5 per cent level.
|
 IST,
IST,


