 IST,
IST,


Non-Banking Financial Institutions
|
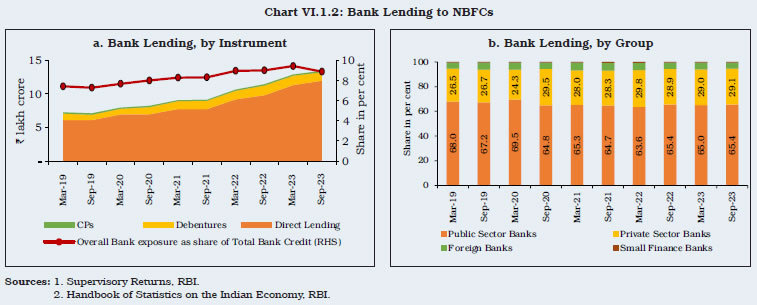
The balance sheet of non-banking financial companies (NBFCs) expanded at a fast pace in 2022-23, led by double digit credit growth. Housing finance companies (HFCs) exhibited resilience in 2022-23, with enhanced asset quality, improved profitability and robust growth in credit disbursement. The consolidated balance sheet of all India financial institutions (AIFIs) expanded in 2022-23 on the back of growth in loans and advances. With the implementation of scale based regulation (SBR), the Reserve Bank has further strengthened regulation and supervision of the NBFC sector. 1. Introduction VI.1 During 2022-23, non-banking financial institutions (NBFIs) exhibited robust balance sheet growth, accompanied by improved asset quality and enhanced capital buffers. This chapter reviews the operations and financial performance of NBFIs regulated by the Reserve Bank1, comprising of non-banking financial companies (NBFCs), housing finance companies (HFCs), all India financial institutions (AIFIs) and primary dealers (PDs) (Chart VI.1). NBFCs2 encompass diverse entities, both government and private, and play an important role in credit intermediation, including niche activities like micro-finance, factoring and FinTech. HFCs3 extend housing finance to individuals, co-operative societies and corporate bodies. AIFIs, i.e., the National Bank for Agriculture and Rural Development (NABARD); the Export-Import Bank of India (EXIM Bank); the Small Industries Development Bank of India (SIDBI); the National Housing Bank (NHB); and National Bank for Financing Infrastructure and Development (NaBFID)4 are the apex financial institutions (FIs) which provide long-term funding to agriculture, foreign trade, small industries, housing finance companies and infrastructure, respectively. PDs are, inter alia, market makers in the government securities (G-secs) market. VI.2 The rest of the chapter is ordered into four sections. An overview of the regulatory and balance sheet developments of NBFCs and HFCs during 2022-23 is provided in Section 2. Sections 3 and 4 assess the performance of AIFIs and PDs, respectively, with concluding observations in Section 5. 2. Non-Banking Financial Companies (NBFCs)5 VI.3 NBFCs are an integral part of the Indian financial system. They have consolidated their position in recent years, as reflected in a gradual rise in their credit intensity (credit to Gross Domestic Product (GDP) ratio) as well as the relative importance in credit provision vis-à-vis scheduled commercial banks (SCBs) (Charts VI.2a and b). 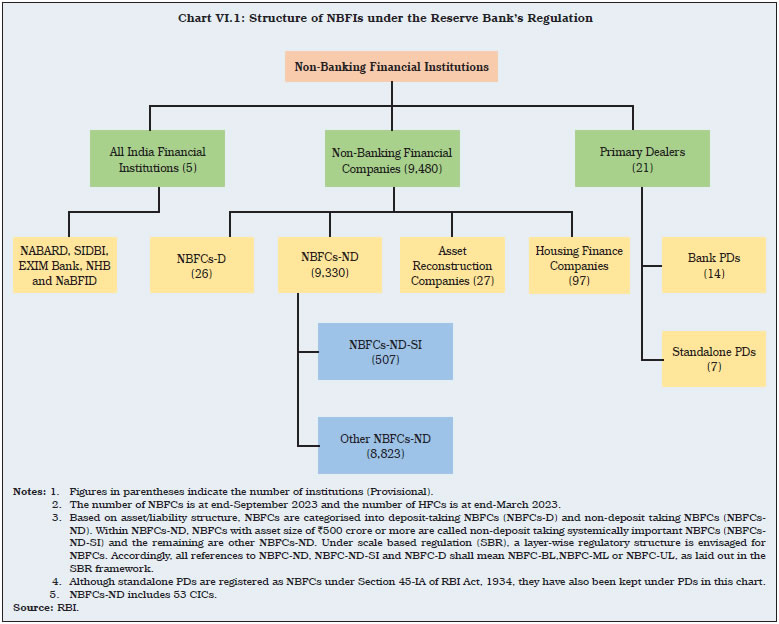 VI.4 With the implementation of Scale Based Regulation (SBR) from October 2022, NBFCs have been segregated into four layers, namely, a Base Layer (NBFC-BL), a Middle Layer (NBFC-ML), an Upper Layer (NBFC-UL) and a Top Layer (NBFC-TL), based on size, activity, and the perceived level of riskiness (Chart VI.3). The top ten eligible NBFCs in terms of asset size shall always reside in the upper layer, along with other NBFCs that are identified on the basis of a set of parameters and scoring methodology. Accordingly, 15 NBFCs6 (including five HFCs) have been placed in the upper layer and are subjected to enhanced regulatory oversight. The top layer will ideally remain empty unless the Reserve Bank identifies a considerable rise in potential systemic risk from any NBFC in the upper layer, which will be moved to the top layer. 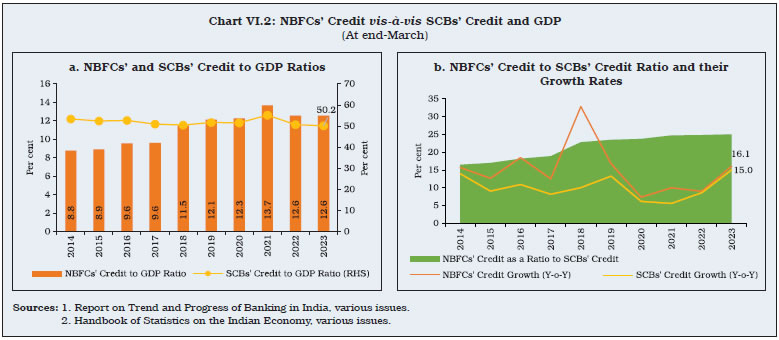 VI.5 To ensure adequate capital to mitigate risks and strengthen internal risk management techniques, NBFC-ML and NBFC-UL are required to make internal capital assessments on lines similar to the Internal Capital Adequacy Assessment Process (ICAAP) prescribed for commercial banks under Pillar 2 of Basel-III norms. While Pillar 2 capital has not been made mandatory, NBFCs are expected to factor in credit risk, market risk, operational risk, and all other residual risks to decide the level of capital, as per an internally determined methodology. A large exposure framework has also been prescribed for NBFC-UL to limit concentration risks arising from exposure to a single counterparty or a group of connected counterparties. The Prompt Corrective Action (PCA) framework for NBFCs in the upper and middle layer, which became operational from October 2022, will also be extended to government NBFCs (except those in the base layer) from October 2024. The extant regulations prescribe that companies intending to commence NBFC activities must have at least ₹10 crore as net owned funds (NOF)7. The NOF requirement for existing NBFC-ICC, NBFC-MFI and NBFC-Factors will be raised to ₹10 crores by March 2027 following a glide-path. Apart from scale, the new regulatory framework retains activity-based regulation (Table VI.1). 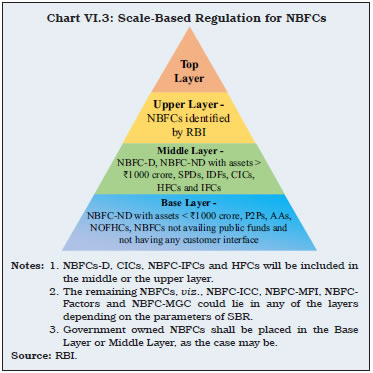 VI.6 The number of registrations and cancellations of Certificate of Registrations (CoR) of NBFCs rose in 2022-23 (Chart VI.4). Apart from cancellation of CoR by the Reserve Bank, many NBFCs surrendered their licences for business reasons or other considerations. Violations of extant regulations and guidelines on outsourcing and Fair Practices Code (FPC) by some NBFCs had led to cancellation of their licenses. To address concerns relating to unbridled engagement of third parties, mis-selling, breach of data privacy, unfair business conduct, charging of exorbitant interest rates, and unethical recovery practices, the Reserve Bank released guidelines on digital lending in September 2022 to support orderly growth of credit delivery through digital lending methods. 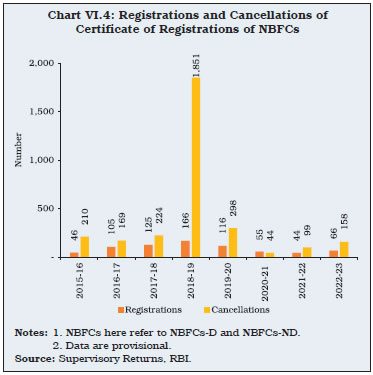 2.1 Ownership Pattern VI.7 The NBFC sector is dominated by non-deposit taking systemically important NBFCs (NBFCs-ND-SI), with a share of 85.4 per cent in the total assets of the sector at end-March 2023. This category mainly consists of non-government companies, although a few large government companies have a significant share in assets (Table VI.2). VI.8 Deposit taking NBFCs (NBFCs-D) accounted for 14.6 per cent of the total assets of the NBFCs at end-March 2023. This category is dominated by non-government public limited companies, comprising 88 per cent of total assets of NBFCs-D (Table VI.2). As deposits accepted by NBFCs-D are not insured by the Deposit Insurance and Credit Guarantee Corporation (DICGC), the Reserve Bank has adopted a cautionary approach, mandating that NBFCs-D with minimum investment grade rating for their fixed deposits shall accept fixed deposits from the public up to a limit of 1.5 times of their NOF and for a tenure of 12 to 60 months only, with interest rates capped at 12.5 per cent. In May 2022, it was mandated that minimum investment grade credit rating of ‘BBB-’ from any of the SEBI-registered credit rating agencies would be necessary for deposits of NBFCs. 2.2 Balance Sheet VI.9 The pace of expansion in the balance sheet of NBFCs accelerated in 2022-23 (Table VI.3). This was led by double digit credit growth, mainly on account of unsecured loans. Growth in investments decelerated while cash and bank balances contracted. NBFCs improved their capital positions to cater to the rise in credit demand. Amidst tightening liquidity conditions and increasing competition from banks in segments like vehicle loans and loans against gold, NBFCs focused on lending to segments such as unsecured loans, micro-finance loans and MSMEs. The growth of unsecured loans (28.1 per cent) was more than twice that of secured loans (11.5 per cent). As a result, the share of secured loans in total NBFCs credit fell from 72.4 per cent at end-March 2022 to 69.5 per cent at end-March 2023, while that of unsecured loans inched up from 27.6 per cent to 30.5 per cent over the same period. NBFCs-D have a relatively higher share of secured loans in their lending portfolio, in contrast to NBFCs-ND-SI (Chart VI.5). Credit growth accelerated further at end-September 2023, while investments declined (Appendix Tables VI.1, VI.2 and VI.3). VI.10 Maturity-wise, there has been a gradual shift towards shorter tenure loans (receivable within 12 months) in credit extended by NBFCs. The longer tenure loans (receivable after 12 months) remained the predominant category (more than two-thirds of the loan book), albeit with a declining share (Chart VI.6a). NBFCs have maximum exposures to corporates, followed by retail customers, which together account for almost 69 per cent of their loan book (Chart VI.6b). In 2022-23, retail loans grew twice as fast as loans to corporates. 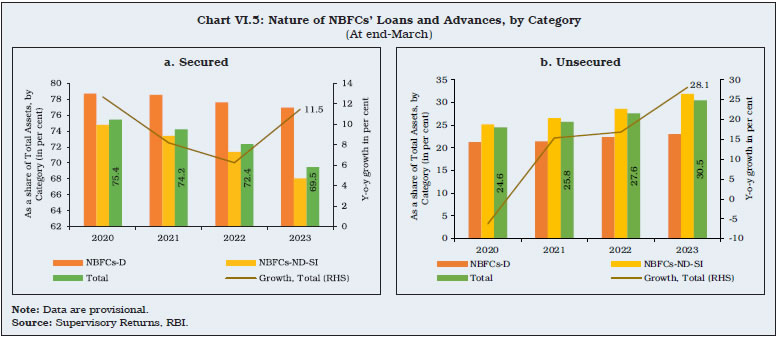 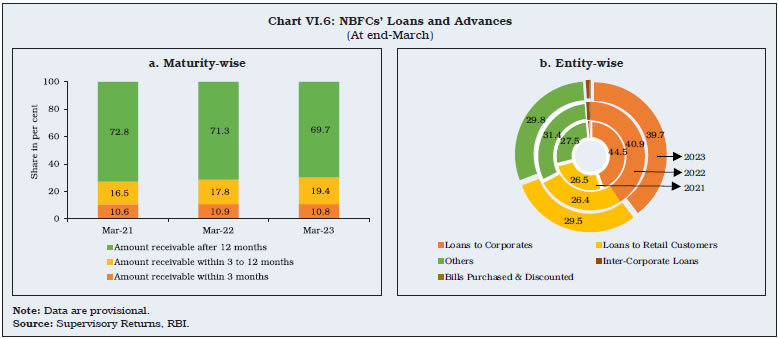 VI.11 Taken together, NBFC-ICCs and IFCs accounted for more than 95 per cent of the assets of the sector at end-March 2023 (Chart VI.7a). ICCs mainly operate in the retail space, while IFCs provide infrastructure loans. Some large government NBFCs are registered as NBFC-IFCs and work in the infrastructure space. Two government IFCs with focus on the power sector saw higher credit growth in 2022-23. In line with the government’s Panchamrit agenda which aims for non-fossil energy capacity of 500 GW by 2030, their renewable portfolio is expected to get a push in the coming years. The Ministry of Power has also allowed these NBFCs to lend to non-power infrastructure and to the logistics sector. 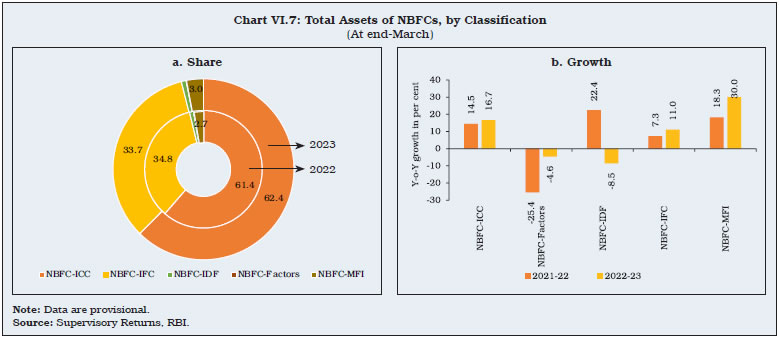 VI.12 NBFC-MFIs, an important segment in the NBFC universe, have been growing their share in total assets in recent years. In 2022-23, MFIs registered the highest growth in assets (30.0 per cent), followed by ICCs (16.7 per cent). The assets of IDFs, however, contracted in 2022-23 after growing at a healthy pace a year ago (Chart VI.7b). NBFC-Factors registered a contraction in credit in 2022-23 (Table VI.4). 2.3 Sectoral Credit of NBFCs VI.13 In the sectoral distribution of NBFC credit, industry accounted for around two-fifth of the overall lending portfolio at end-March 2023, attributable to infrastructure lending by large government-owned NBFCs, followed by retail lending with a share of around 31 per cent (Chart VI.8a). In 2022-23, growth in credit to industry by NBFCs (12.8 per cent) was above that of the banking system (5.7 per cent). Credit to the retail segment by both NBFCs and banks grew at over 20 per cent. Credit by NBFCs to the services sector rose at a robust rate, albeit marginally lower than that of banks (Chart VI.8b). 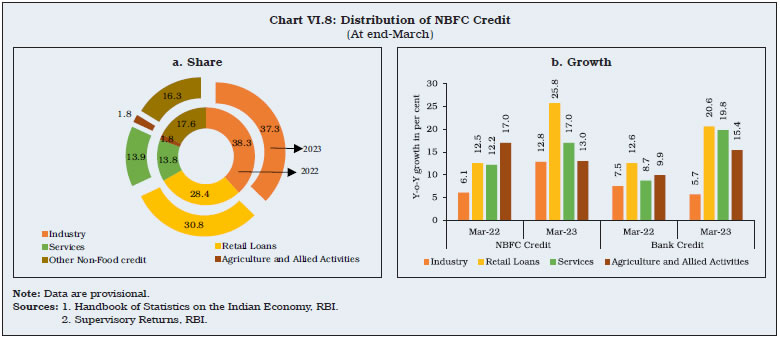 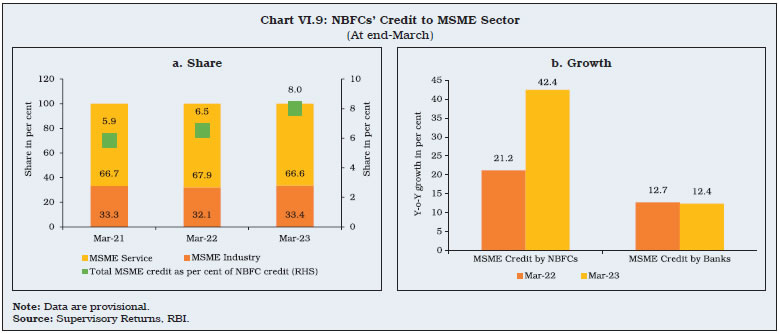 VI.14 NBFCs have steadily expanded their micro, small and medium enterprises (MSMEs) portfolio, addressing the credit needs of the sector and contributing to overall financial inclusion and economic growth. MSMEs engaged in services account for a preponderant share of NBFC credit to the sector (Chart VI.9a). Credit growth by NBFCs to the MSME sector was more than three times that of banks, benefitting from their ability to offer customised financing solutions (Chart VI.9b). The co-lending framework for priority sector lending has also facilitated flow of credit by NBFCs to the MSME sector, leveraging on the low cost of funds of banks and greater reach of NBFCs. VI.15 In 2022-23, NBFC credit to the vehicles segment rose by double digits as it emerged from the challenges of the COVID-19 pandemic (Chart VI.10). 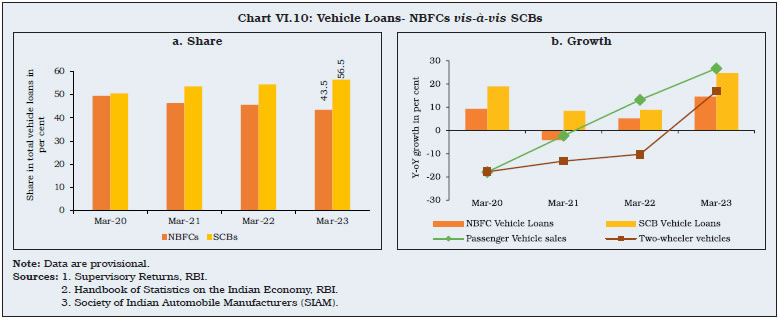 VI.16 NBFCs remain the dominant provider of gold loans although their growth trailed banks (Chart VI.11). In this space as well, banks and NBFCs are increasingly partnering with each other to realise the synergies from collaboration. VI.17 NBFC credit to the services sector expanded, driven by transport operators and retail trade, in 2022-23 (Appendix VI.4). Credit to agriculture and allied activities also grew steadily (Table VI.5). Credit growth to major sectors remained in double digits on a year-on-year basis at end- September 2023. VI.18 Amongst the various classifications of NBFCs, the lending portfolio of ICCs is dominated by retail lending, while NBFC-MFIs are leading providers of small, collateral-free loans to unserved and underserved groups who have little or no access to traditional financial services. In contrast, IFCs lend primarily to the infrastructure segment of industry, mostly power and railways (Chart VI.12). 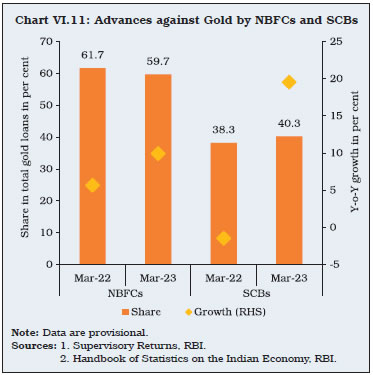 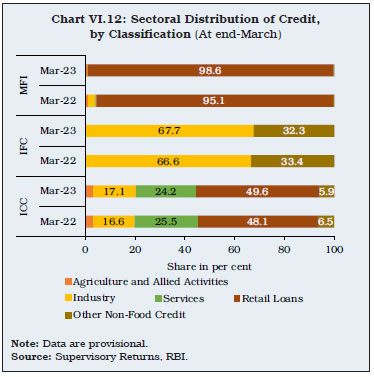 VI.19 In 2022-23, NBFC-MFIs outpaced banks in micro-credit disbursements, emerging as the largest provider of credit with nearly 40 per cent share in the microfinance segment aided, inter alia, by regulatory changes (Chart VI.13). 2.4 Resource Mobilisation VI.20 NBFCs rely on borrowings, primarily from markets and banks, to finance their operations. At end-March 2023, bank borrowings displaced debentures as the largest source of funds for NBFCs (Table VI.6). Borrowings from banks continued to exhibit high growth at end-September 2023. Around two-third of NBFCs’ borrowings is payable in more than 12 months. At end-March 2023, there was a marginal uptick in short-term borrowings which are payable in three months or less (Chart VI.14). VI.21 More than 80 per cent of non-convertible debentures (NCDs) issued by private NBFCs were rated either AAA or AA. NCD issuances increased in 2022-23 (Chart VI.15a). In Q1:2023-24, NCDs of 2-3 year tenor constituted about 50 per cent of the total NCDs issued while longer tenor issuances (greater than 10 years) had a share of around 20 per cent (Chart VI.15 b). 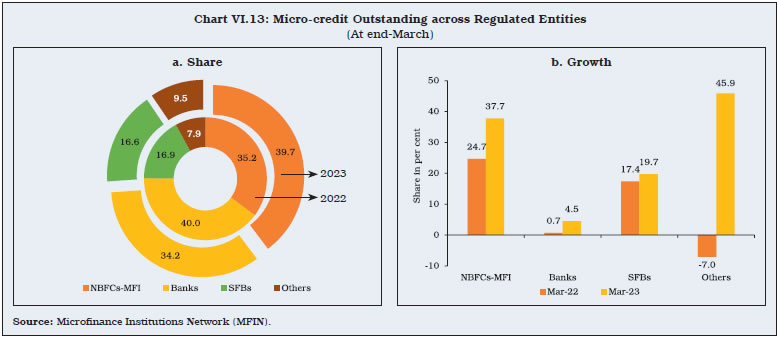 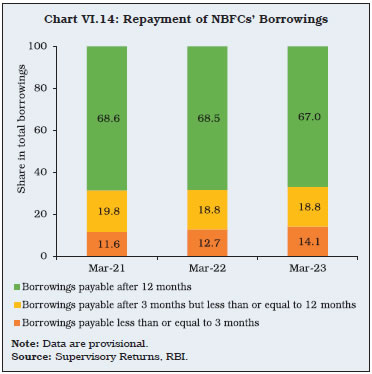 VI.22 The spreads on bonds issued by NBFCs remained below their levels in the pre-pandemic period, reflecting an improvement in activity and market confidence (Chart VI.16a and b). VI.23 The interconnectedness of NBFCs’ with banks has increased in recent years in view of their growing reliance on banks for funding needs (Box VI.1). 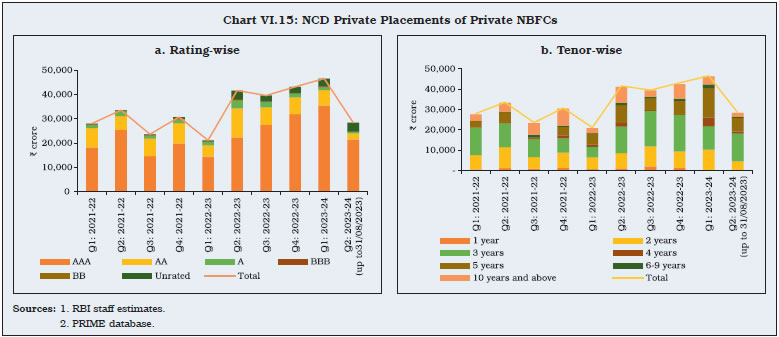 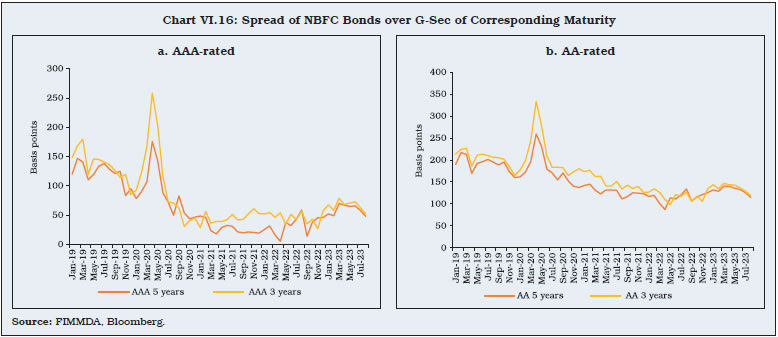 2.5 NBFCs-D: Deposits VI.24 The share of public deposits in the total borrowings of NBFCs-D has increased steadily due to competitive interest rates offered and robust credit ratings. The number of NBFCs permitted to accept deposits has been declining, however (Chart VI.17a). At end-March 2023, four NBFCs-D accounted for nearly 90 per cent of the public deposit corpus of NBFCs, with each of them having aggregate deposits of over ₹5,000 crores (Chart VI.17b).
2.6 Loan Sales and Securitisation VI.25 Loan sales are resorted to by lending institutions for reasons ranging from liquidity management, rebalancing their exposures or strategic sales. Loan sales grew swiftly in 2022-23, mainly due to one NBFC (Chart VI.18a). In securitisation, FIs sells its assets to a special purpose entity which funds the acquisition by issuing debt securities. It allows efficient distribution of credit risk amongst FIs in line with their risk appetite. Securitisation has emerged as a major source of funding for NBFCs and crossed pre-COVID levels in March 2023 (Chart VI.18b). Banks have been a major participant in both the above segments. 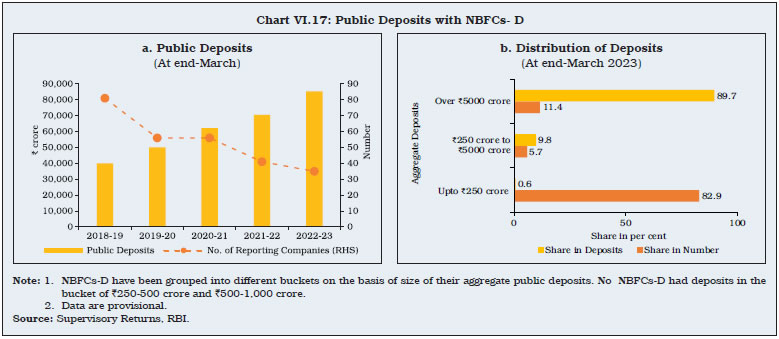 2.7 Asset Liability Profile of NBFCs VI.26 Short-term structural liquidity position in the 1-30/31 days bucket is critical for liquidity risk management10. NBFCs maintained a comfortable liquidity position in this bucket at end-March 2023, albeit at a lower level than a year ago. Furthermore, NBFCs also had a net positive position across all buckets at end-March 2023, except for 2-3 months and over five years (Chart VI.19). 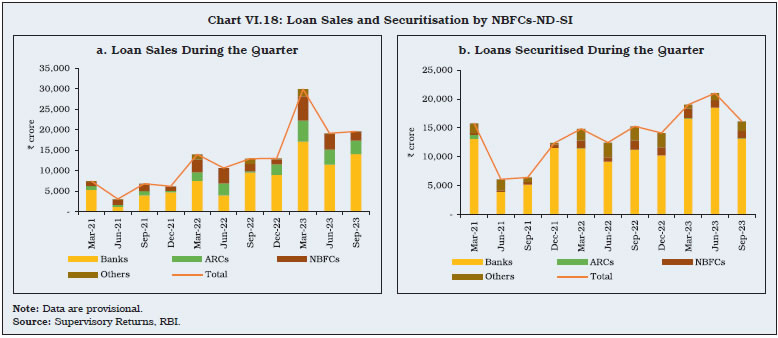 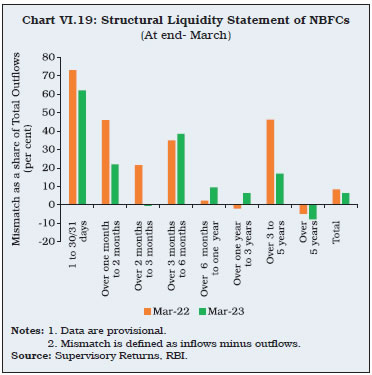 2.8 Financial Performance of NBFCs VI.27 Aggregate income of NBFCs grew steeply in 2022-23, led by interest income. About 90 per cent of the total income accruing to NBFCs in 2022-23 was from fund-based resources, even as the share of fee-based income has seen a gradual rise in recent years. Expenditure was driven by interest expenses (around one-third of their total expenditure during 2022-23) and operating costs (around one-fourth of the total) (Appendix VI.5 and VI.6). On the other hand, provisions maintained against NPAs came down during the year. With expenditure increasing at a slower pace than total income, net profit of NBFCs grew significantly. The cost to income ratio declined, indicating improvement in operational efficiency. In H1:2023-24, net profit growth remained robust (Table VI.7). VI.28 Key profitability indicators i.e., return on assets (RoA), return on equity (RoE) and net interest margin (NIM) improved during 2022-23 (Chart VI.20a). All classifications of NBFCs-ND-SI, except IFCs, registered increase in profitability ratios at end-March 2023 (Chart VI.20b). 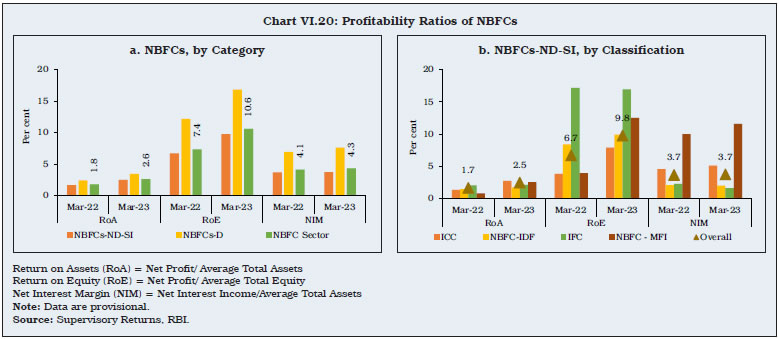 2.9 Asset Quality VI.29 The Reserve Bank allowed NBFCs time till September 30, 2022 to follow NPA upgradation norms, which clarified that loan accounts classified as NPAs may be upgraded as standard asset only if entire arrears of interest and principal are paid by the borrower. In 2022-23, the asset quality of NBFCs improved. Lower slippages also contributed to a reduction in the GNPA ratio to a five-year low in 2022-23. The provision coverage ratio (PCR) increased from 51.5 per cent at end-March 2020 to 65.1 per cent at end-March 2023 for NBFCs (Chart VI.21). As at end-September 2023, asset quality of the sector showed further improvement as the GNPA and NNPA ratios fell to 4.1 per cent and 1.5 per cent, respectively.   VI.30 In 2022-23 and H1:2023-24, the proportion of standard assets improved. All three categories of NPAs also moderated11 (Chart VI.22). VI.31 As the impact of the pandemic waned and economic activity gained traction, the overall delinquency in performing loans almost halved from 12.3 per cent at end-March 2021 to 6.1 per cent at end-March 2023. The delinquency ratios in all buckets came down during 2022-23, with the maximum delinquency in the less than 30 days bucket (Chart VI.23). The proportion of standard assets with no overdues increased from 87.7 per cent at end-March 2021 to 93.9 per cent at end-March 2023. VI.32 GNPA and NNPA ratios of ICCs, IFCs and NBFC-MFIs moderated as at end-March 2023, mirroring the overall improvement in asset quality of the segment (Chart VI.24 a and b). Similar trends were also exhibited by NBFCs-D, with lower fresh accretion to NPAs and robust growth in credit (Chart VI.24c). Asset quality of both NBFCs-ND-SI and NBFCs-D improved further at end-September 2023.  VI.33 Sector-wise, the GNPA ratio for agriculture and allied activities, industry and services at end-March 2023 remained above the overall GNPA ratio of NBFCs, while for the retail sector, it was below the overall average. MSMEs registered high GNPA ratios, although they were lower than a year ago. Within the services sector, commercial real estate showed a deterioration in asset quality. In retail loans, the vehicle loan segment registered an improvement during the period under review (Chart VI.25). Asset quality improved further across major sectors by end-September 2023.  VI.34 The share of large borrowal accounts (exposure of ₹5 crore and above) in gross advances extended by NBFCs declined marginally at end-March 2023. The large borrowal accounts accounted for over two-thirds of the total NPAs of the sector (Chart VI.26a). Special mention accounts (SMAs) classification enables a timely identification of incipient stress and remedial actions to prevent potential slippage into NPAs. At end-March 2023, while SMA-0 witnessed an uptick, SMA-1 and SMA-2 declined year-on-year. The restructured books of these accounts also expanded during the same period. The relatively higher delinquency in large borrowal accounts is reflected in a rise in their GNPA ratio to 7.2 per cent at end-March 2023 against 4.6 per cent for the NBFC sector as a whole (Chart VI.26b). 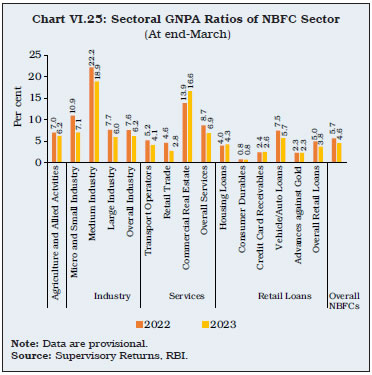 2.10 Capital Adequacy VI.35 At end-March 2023, NBFCs were adequately capitalised, with capital to risk-weighted assets ratios (CRARs) well above the regulatory requirement (not less than 15 per cent of aggregate risk-weighted assets, including both on and off-balance sheet items) (Chart VI.27a). Detailed guidelines on elements of common equity Tier 1 (CET-1) capital applicable to all NBFC-UL (except core investment companies) were issued on April 19, 2022 as a follow-up to the SBR framework. The CRAR of NBFCs-ND-SI, barring NBFC-IDF, improved during 2022-23 on the back of higher Tier I capital than a year ago (Chart VI. 27b). CRAR of the sector stood at a comfortable level of 27.6 per cent at end-September 2023. 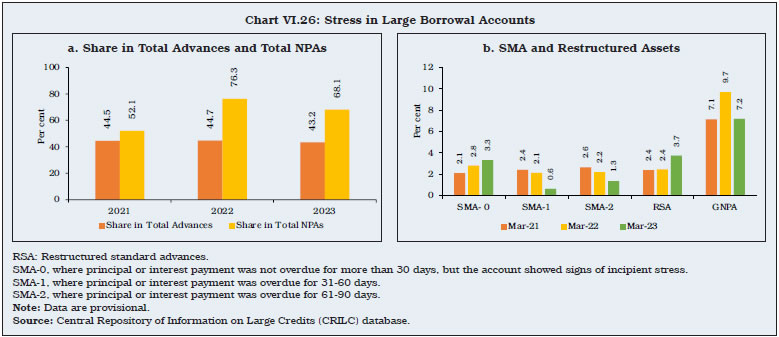 2.11 Exposure to Sensitive Sectors VI.36 Sensitive sectors constitute capital markets, real estate, investment in securities (IIS) and advances against commodities (AAC). Capital market exposure (CME) includes advances to and investment in the capital market, while IIS includes investment in quoted and un-quoted securities and equities. By end-March 2023, the exposure of NBFCs to sensitive sectors grew by around 15 per cent year-on-year although both CME and IIS recorded marginal declines in their shares (Chart VI.28). 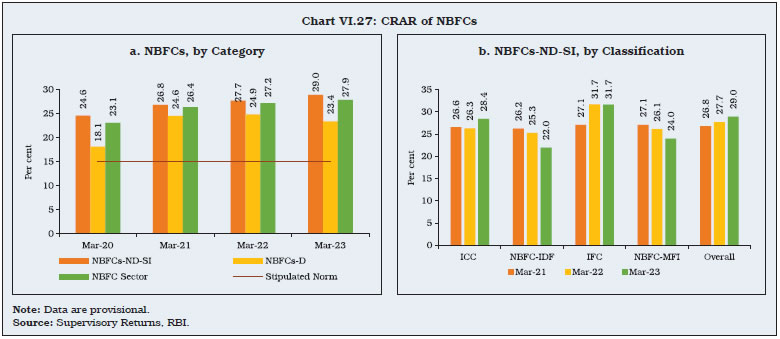 2.12 Housing Finance Companies (HFCs) VI.37 In India, housing finance companies (HFCs) have about one-third of the market share in housing finance (second only to SCBs). After the Reserve Bank assumed the role of regulator of HFCs effective from August 2019, initiatives have been undertaken to harmonise regulations between HFCs and NBFCs, with glide paths provided for existing HFCs to comply with the principal business criteria12, net owned fund (NOF) requirements, and maintenance of liquidity coverage ratio (LCR) and capital adequacy ratio (CRAR). 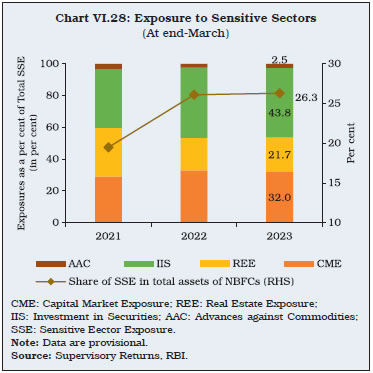 VI.38 At end-March 2023, 72 per cent of HFCs’ outstanding credit was in the form of housing loans. HFCs’ credit growth to the housing sector accelerated in 2022-23 due to the post-COVID shift in preference for homeownership, government initiatives to promote affordable housing, and attractive tax incentives (Chart VI.29). VI.39 At end-March 2023, 97 HFCs held CoRs under section 29A of the NHB Act, 1987 of which 15 were deposit taking entities. Six of the latter need to obtain prior written permission from the NHB before accepting public deposits. Non-government public limited companies dominate the segment, with a share of around 95 per cent (Table VI.8).  2.12.1. Balance Sheet VI.40 The consolidated balance sheet of HFCs expanded by 10.5 per cent in 2022-23, reflecting growth in loans and advances and investments. On the liabilities side, debentures and bank borrowings contributed to balance sheet growth. The rise in share capital and reserves and surplus also reflected the requirement for HFCs to maintain ₹20 crore as minimum NOF by March 31, 2023 (Table VI.9). 2.12.2. Resource Profile of HFCs VI.41 Debentures and borrowings from banks together constituted 69 per cent of the total resources mobilised by HFCs at end-March 2023. Their shares rose during the year (Chart VI.30).   VI.42 Public deposits, another important source of funding, turned around in 2022-23 after declining in the previous year (Chart VI.31). VI.43 Deposits with HFCs in 2022-23 were concentrated in the 6-9 per cent interest rate bracket, with moderation in the share of deposits below 6 per cent (Chart VI.32a). Maturity-wise, the maximum share of deposits was in the tenure of 1 to 5 years (Chart VI.32b). 2.12.3. Financial Performance VI.44 The consolidated income of HFCs grew in 2022-23 on account of both fund income and fee income. Expenditure growth trailed income expansion, resulting in a decline in the cost to income ratio. The overall profitability of the sector rose above pre-COVID level13 (Table VI.10). 2.12.4. Soundness Indicators VI.45 The asset quality of HFCs improved considerably in 2022-23. Both GNPA and NNPA ratios declined by end-March 2023 with higher collections under the Securitisation and Reconstruction of Financial Assets and Enforcement of Securities Interest (SARFAESI) Act and better recovery more generally (Chart VI.33).  VI.46 To sum up, HFCs recorded improved asset quality, better profitability and high growth in credit disbursement in 2022-23. Going forward, the government’s emphasis on affordable housing, favourable demographics and rising urbanisation are expected to support housing demand. HFCs are likely to play a significant role in this regard. Some HFCs have successfully operationalised co-lending models (CLM) with banks for housing as well as MSME loans. The inclusion of five HFCs in the upper layer by the Reserve Bank for the year 2023-24 in its scale -based regulatory framework highlights the systemic importance of HFCs in the Indian financial landscape.  3. All India Financial Institutions VI.47 At end-March 2023, five AIFIs namely, the National Bank for Agriculture and Rural Development (NABARD); the Export-Import Bank of India (EXIM Bank); the Small Industries Development Bank of India (SIDBI); the National Housing Bank (NHB); and National Bank for Financing Infrastructure and Development (NaBFID) were registered with the Reserve Bank. These FIs facilitate long-term financing for a range of sectors and activities. NABARD is a development bank which aims to promote sustainable and equitable agriculture and rural development. SIDBI acts as the principal FI for promotion, financing and development of MSMEs as well as of institutions engaged in similar activities. NHB operates as the primary FI for promoting housing finance institutions at local and regional levels while providing financial and other support to such institutions. EXIM Bank provides financial assistance to exporters and importers with a view of promoting the country’s international trade. NaBFID is a specialised FI focused on addressing the long-term financing needs of the infrastructure sector in India. 3.1. AIFIs’ Operations14 VI.48 Financial assistance sanctioned and disbursed by AIFIs saw healthy growth during 2022-23 primarily on account of SIDBI, which scaled up its operation to support the credit needs of the MSME sector. Total disbursements of AIFIs as a proportion of sanctions declined in 2022-23, however (Table VI.11 and Appendix VI.7). 3.2. Balance Sheet VI.49 The growth in the consolidated balance sheet of AIFIs accelerated from 15.9 per cent in 2021-22 to 19.8 per cent in 2022-23. On the assets side, this was driven by loans and advances. More than half of this expansion was due to loans by SIDBI, followed by NABARD. Aggregate investments by AIFIs declined due to lower investments by NABARD. On the liabilities side, borrowings grew sharply (58.5 per cent) in 2022-23, despite a high base. More than 80 per cent of this expansion was on account of SIDBI due to the enhancement in its borrowing limit (Table VI.12). VI.50 Total resources raised by all the AIFIs, except NABARD, increased in 2022-23. Nonetheless, NABARD, the largest AIFI by asset size, accounted for almost half of the total resources raised, followed by SIDBI. AIFIs’ reliance on short-term funds has been gradually inching upwards, constituting about 59 per cent of the total resources mobilised by end-March 2023. The share of long-term funds is declining. EXIM Bank was the lone AIFIs to raise foreign currency resources (Table VI.13). VI.51 Resources raised by AIFIs from the money market recorded rapid growth, driven by CP issuances by SIDBI. NABARD and SIDBI together accounted for around 90 per cent of the total resources raised by AIFIs from the money market. AIFIs can mobilise resources within the overall umbrella limit linked to their net owned funds (NOF). As per their latest audited balance sheet, the utilisation under this limit declined in 2022-23 (Table VI.14). 3.3. Sources and Uses of Funds VI.52 Funds raised and deployed by AIFIs declined in 2022-23. Internal funds, the dominant source, fell in 2022-23 while external funds grew strongly, led by SIDBI. Fresh deployment by AIFIs almost doubled from the levels a year ago, driven by SIDBI (Table VI.15).  3.4. Maturity Profile and Cost of Borrowings VI.53 The gradual tightening of financial conditions led to a rise in the weighted average cost (WAC) of rupee resources raised by all AIFIs, except for NHB, which had the highest weighted average maturity of rupee resources (Chart VI.34). Long-term prime lending rates (PLR) increased for all AIFIs (Chart VI.35).  3.5. Financial Performance VI.54 Income of AIFIs rebounded in 2022-23, driven up by interest income. Non-interest income of AIFIs, however, declined further due to contraction on account of NHB. Interest expenditure grew at a strong pace, mainly owing to SIDBI. Operating expenses, however, contracted on account of NABARD. Both operating profit and net profit of AIFIs recorded strong growth during 2022-23 (Table VI.16). VI.55 During 2022-23, interest income and operating profit as a per cent of average working funds improved for all AIFIs, except for NABARD (Table VI.17). VI.56 Profitability as indicated by return on assets (RoA) improved for EXIM Bank and SIDBI in 2022-23. Capital adequacy (CRAR) moderated for all AIFIs, except for NABARD. However, all AIFIs continue to maintain CRAR above the regulatory requirement (Chart VI.36). 3.6. Soundness Indicators VI.57 All AIFIs, barring EXIM Bank, reported zero net NPA (NNPA) ratios in 2022-23 on account of provisioning. Almost all assets of AIFIs were standard assets, except for EXIM Bank, for which the ratio of standard assets stood at 96 per cent of total advances (Chart VI.37). VI.58 The Reserve Bank issued master directions for prudential regulation of AIFIs, extending the application of Basel III capital framework to them. These directions also consolidate and modify exposure norms, significant investments, classification, valuation and operation of investment portfolio norms and resource raising norms. These directions were issued in September 2023 and will become applicable from April 1, 2024.   VI.59 As on March 31, 2023, there were 21 Primary Dealers (PDs) – of which 14 function departmentally as bank PDs and 7 as Standalone PDs (SPDs), registered as NBFCs under Section 45 IA of the RBI Act, 1934. 4.1 Operations and Performance of PDs VI.60 PDs are mandated to underwrite issuances of government-dated securities and participate in primary auctions. They are also mandated to achieve a minimum success ratio (bids accepted as a proportion to bidding commitments) of 40 per cent in primary auctions of T-bills and Cash Management Bills (CMBs), assessed on a half-yearly basis. In 2022-23, all PDs achieved their minimum bidding commitments, subscribing to 68.9 per cent of the total quantum of T-Bills issued during the year, as compared with 76.9 per cent achieved in the previous year. In 2023-24 (till September 2023), the share of PDs stood at 67.9 per cent in the total allotment in T-Bills. PDs’ share of allotment in the primary issuance of dated securities rose to 56.6 per cent in 2022-23 from 47.3 per cent in the previous year. This increased further to 60.9 per cent of the notified amount in H1:2023-24 (Table VI.18). VI.61 Partial devolvement on PDs took place on eight instances amounting to ₹23,053 crore during 2022-23 as against 17 instances amounting to ₹97,938 crore in 2021-22. No devolvement has taken place in 2023-24 (up to September 30, 2023). The underwriting commission paid to PDs (exclusive of GST) during 2022-23 fell to ₹91.1 crore from ₹412.7 crore in the previous year; it was ₹23.8 crore in H1:2023-24. The average rate of underwriting commission decreased from ₹3.89 paise/₹100 in 2021-22 to ₹0.76 paise in 2022-23, and to ₹0.32 paise in 2023-24 (up to September 2023) (Chart VI.38). VI.62 The guidelines on minimum turnover to be achieved by PDs in the secondary market were reviewed during the year. With effect from April 01, 2022 the turnover targets have been fixed as a specific percentage of the average of the previous 3 years’ overall outright market turnover in G-secs and T-bills, taken on an aggregate basis. The targets for 2022-23 were fixed at one per cent. All the PDs individually achieved the minimum stipulated annual turnover ratio. The targets for 2023-24 have been fixed at 1.5 per cent.  4.2 Performance of Standalone PDs VI.63 The turnover of SPDs increased in both outright and repo segments, resulting in an increase of their overall share in secondary market turnover (Table VI.19). 4.3 Sources and Application of SPDs’ Funds VI.64 Funds mobilised by SPDs rose by 44.4 per cent on a year-on-year basis in 2022-23. Borrowings remained the major source of their funding, accounting for 90.3 per cent of the total sources of funds. Both secured and unsecured loans increased during this period. The largest share of assets for SPDs was in the form of current assets which increased by 46.3 per cent during the year under review (Table VI.20). 4.4 Financial Performance of SPDs VI.65 SPDs’ profit after tax decreased in 2022-23 on account of lower trading profits and an increase in interest expenses (Table VI.21). As a result, SPDs’ return on net worth fell during the year. Their profit after tax and return on net worth, however, increased in H1: 2023-24 (Table VI 22 and Appendix Table VI.8). VI.66 The combined CRAR for all SPDs remained above the mandated 15 per cent, although it fell slightly in 2022-23 on account of an increase in their risk weighted assets vis-à-vis their net capital funds (Chart VI.39 and Appendix Table VI.9).  VI.67 Over the years, NBFCs have consolidated their position in the Indian financial sector by delivering credit and financial products to unbanked and underserved areas. NBFCs are steadily expanding their MSMEs portfolio, thereby addressing the credit requirements of the sector more actively and contributing to overall financial inclusion and economic growth. NBFCs’ double digit credit growth was driven by unsecured loans which grew more than twice as fast as secured loans. In this regard, the Reserve Bank, as part of a calibrated and targeted macroprudential measure, has increased the risk weights on select retail loans by NBFCs and on SCBs’ credit to NBFCs, which is pre-emptive in nature and in the interest of overall sustainability. NBFCs remain well capitalised with CRAR well above the regulatory requirement. With the implementation of SBR, there is a need for further enhancing governance and internal audit standards of NBFCs. VI.68 HFCs’ credit accelerated in 2022-23 mainly due to a post-pandemic shift in preference for home ownership. AIFIs recorded strong growth in loans and advances. In line with the Reserve Bank’s endeavour to ensure smooth completion of the government borrowing programme, all PDs achieved more than their minimum bidding commitments in 2022-23 and individually achieved the minimum stipulated annual secondary market turnover ratios. 1 Although merchant banking companies, stock exchanges, companies engaged in the business of stock-broking/sub-broking, nidhi companies, alternative investment fund companies, insurance companies and chit fund companies are NBFCs, they have been exempted from the requirement of registration with the Reserve Bank under Section 45-IA of the RBI Act, 1934. 2 In this chapter, usage of the term ‘category’ refers to NBFC-D and NBFC-ND, while the term ‘classification’ refers to grouping of NBFCs according to activity, i.e., NBFC-ICC, NBFC-MFI, NBFC-IDF etc. 3 The Finance (No.2) Act, 2019 (23 of 2019) amended the National Housing Bank Act, 1987, conferring certain powers for regulation of HFCs with the Reserve Bank of India. HFCs are now treated as NBFCs for regulatory purposes. 4 NaBFID has been set up as a Development Financial Institution (DFI) under the NaBFID Act, 2021, and shall be regulated and supervised as an AIFI by the Reserve Bank under Sections 45L and 45N of the RBI Act, 1934. 5 This section focuses only on NBFCs-D and NBFCs-ND-SI, excluding CICs and PDs. 6 As per the Reserve Bank’s press release dated September 14, 2023. 7 For NBFC-P2P, NBFC-AA, and NBFCs with no public funds and no customer interface, the NOF remains at ₹2 crore. Further, there is no change in the existing regulatory minimum NOF for IDFs, IFCs, MGCs, HFCs, and SPDs. 8 NBFI is a broad term which includes insurance corporations, pension funds, other financial intermediaries and financial auxiliaries. 9 OFIs include money market funds, hedge funds, other investment funds, captive financial institutions and money lenders, central counterparties, broker-dealers, finance companies, trust companies, and structured finance vehicles. 10 Structural liquidity position is arrived at by deducting cash outflows from cash inflows across various time buckets. A positive mismatch highlights a comfortable structural liquidity position which can be attributed to either an increase in cash inflows or a decrease in cash outflows in the corresponding time bucket, whereas a negative mismatch points towards shortage of cash inflows against cash outflows in the corresponding time bucket. 11 Based on their performance, assets can be classified into standard or non-performing, with the latter further categorised into sub-standard (non-performing for a period not exceeding 12 months), doubtful (asset remains sub-standard for a period exceeding 12 months) and loss assets (adjudged non-recoverable by the NBFC). 12 HFCs are required to gradually attain minimum percentages of total assets towards housing finance and total assets towards housing finance for individuals of 60 per cent and 50 per cent, respectively, by March 31, 2024. 14 The financial year for EXIM Bank, SIDBI, NABARD and NaBFID runs from April to March, while for NHB, it is from July to June. |

এই পৃষ্ঠাটো শ্বেয়াৰ কৰক:


ভাৰতীয় ৰিজাৰ্ভ বেংক মোবাইল এপ্পলিকেষ্যন ইনষ্টল কৰক আৰু নৱীনতম বাতৰিৰ প্ৰৱেশাধিকাৰ পাওক!
আমাৰ এপটো ইনষ্টল কৰিবলৈ QR ক’ড স্কেন কৰক


পৃষ্ঠাটো শেহতীয়া আপডেট কৰা তাৰিখ:


