 IST,
IST,


Decoupling Economic Growth from Emissions: A LMDI Decomposition Analysis
|
by Madhuresh Kumar, Shobhit Goel, Manu Sharma and Muskan Garg^ This article analyses the factors driving India’s CO2 emissions growth from 2012 to 2022 using LMDI decomposition. During this time, energy-related CO2 emissions increased by 706 million tons. The main contributor was economic growth (+1073 Mt), with a smaller impact from the change in fuel mix of the economy (+78 Mt). However, gains in energy efficiency (-399 Mt), structural changes (-15 Mt), and improvements in emission intensity of electricity due to increased use of renewables (-30 Mt) helped curb emissions. India’s energy efficiency improved by 1.9 percent annually, exceeding the global average. Additionally, India’s growth decoupled from emissions, with a decoupling elasticity of 0.59, comparable to other lower-middle-income countries. Introduction The mounting body of scientific evidence on climate change has catalysed a global discourse reshaping policies, economies, and societies. The mitigating actions against climate change have accelerated in recent years with the world pivoting away from fossil fuels. More than 140 countries covering 90 per cent of global emissions have pledged net zero along with thousands of companies, cities and financial institutions (United Nations, 2023). Notwithstanding, the long-term goals of reaching net zero, the countries update their nationally determined contributions (NDCs) every five years delineating their climate action plans in the short to medium term horizon. Central to most NDCs is reducing emissions intensity, aiming to decouple economic growth from carbon emissions without compromising growth. The falling prices of renewables have sparked a hope that this transition towards net zero could turn out to be much less painful than previously imagined. Yet, despite the fervent focus on renewable deployment; the solar, wind and other renewables (excluding large hydro and nuclear) currently account for a mere 2.1 per cent of India’s total primary energy consumption (Energy Statistics, 2024). Outside of the power sector, the direct use of renewables is virtually non-existent, and the indirect use through green hydrogen, particularly in manufacturing, remains in its infancy and will require time to mature. While the deployment of renewables will play a crucial role going forward, global economies have historically achieved decoupling by improving energy efficiency and shifting from dirtier fuels like coal to cleaner alternatives such as natural gas. Additionally, many countries, especially advanced economies, have transitioned from emission-intensive manufacturing to less emission-intensive service sectors. In its updated NDC, India has committed to significantly decouple emission from growth by reducing the emission intensity of its GDP by 45 percent by 2030, from 2005 level (UNFCCC, 2022). Against this background, this paper aims to examine the drivers of emission growth in India during the last decade and ascertain the decoupling elasticity that India achieved during the period. Structural Decomposition Analysis (SDA) and Index Decomposition Analysis (IDA) are two widely used methods for examining the factors influencing CO2 emissions. SDA, which is rooted in input-output analysis, breaks down changes in emissions into contributions from various economic sectors, allowing for a detailed examination of the structural changes in the economy (Miller and Blair, 2009). IDA, on the other hand, uses index number theory to decompose changes in emissions into factors such as energy intensity, economic activity, and energy mix. It is particularly valued for its simplicity and ease of application in policy analysis (Ang and Zhang, 2000). In this paper, the increase in CO2 emissions during 2012-22 has been decomposed using logarithmic mean divisia index (LMDI) which is a part of the IDA method of decomposition. Emissions growth has been decomposed into five factors viz., output effect, structural effect, energy intensity effect, fuel mix effect and emission factor effect. Although global research on LMDI decomposition has expanded significantly, and India has been included in numerous cross-country studies, there remains a notable lack of literature specifically focused on LMDI decomposition for the Indian economy. It is important to approach the results of cross-country studies cautiously, as the data used are often not fully homogeneous or directly comparable, and many lack access to more granular, detailed datasets. This paper tries to fill this gap in literature using the latest data sourced from energy statistics of India published by MoSPI. The rest of the article is organised in five sections. Section II covers the literature review while data and methodology are described in section III. Sections IV and V discuss the empirical results and decoupling analysis, respectively. Concluding remarks are set out in the last section. Index decomposition analysis (IDA) is a critical tool in energy and environmental economics, used to decompose changes in energy consumption, carbon emissions, or other aggregate indicators into their contributing factors. Over the years, various methods have been developed and refined to improve the accuracy and reliability of these decompositions. The earliest methods for decomposition analysis, including methods like the Laspeyres index, were limited by their inability to avoid residual terms, which could complicate interpretation and lead to inaccuracies (Ang and Zhang, 2000). The refined Laspeyres index approaches, such as the Fisher ideal index and the Shapley and Sun approach, provide complete decomposition, resulting in more accurate final outcomes. The Logarithmic Mean Divisia Index (LMDI) and the Arithmetic Mean Divisia Index (AMDI) are key methods within the Divisia index family. Ang (2004) outlines four tests from index number theory—factor-reversal, time-reversal, proportionality, and aggregation—to evaluate the suitability of a decomposition method. Among these, the factor-reversal test is most critical when selecting an appropriate method. Table 1 presents the properties of various decomposition methods. The factor-reversal test ensures a complete decomposition with no unexplained residue. The time-reversal test indicates that reversing the time period should yield reciprocal results. The proportionality test implies that if the determinants change by a factor of λ, the index value will also change by λ. Consistency in aggregation means that results obtained for sub-groups can be aggregated to a higher level consistently (Vartia 1976, Balk 1996, Ang 2000). Additionally, the zero-value robust test (Ang and Choi, 1997) and the negative-value robust test (Chung and Rhee, 2001) are used to determine the most appropriate decomposition method. LMDI decomposition passes most tests except the negative value robust test. However, in our dataset there are no negative values and hence LMDI has been used in this study for decomposition. The number of terms in the Shapley/Sun method formulation increases significantly as the number of factors grows, making it difficult to implement. Consequently, LMDI is more commonly used for decomposition if there are more than three factors (Ang, 2004). The literature on LMDI decomposition has proliferated after the seminal paper by Ang et al., (1998) which laid the groundwork for the application of the LMDI method in energy-related carbon emissions analysis. The authors applied the LMDI method to decompose changes in carbon emissions in Singapore and found that energy intensity was the main driver of carbon emissions reduction, while economic activity contributed to the increase in emissions. Several other studies also observed this general trend with improvements in energy intensity being the primary driver of emission reduction (Zhang et al., (2009); Wang et al., (2005); Li et al., (2018); Matisoff and Edwards (2014); Raupach et al., (2007); Nag and Parikh (2000); Vazhayil and Balasubramanian (2019); Azevedo et al., (2011); Achour and Belloumi (2016); Román-Collado and Colinet (2018)). India has been featured in several cross-country studies (Andreoni and Galmarini (2016); Shuang et al. (2016); Kangyin et al. (2019); Henriques and Kander (2010); Inglesi-Lotz (2018); Kanitkar et al. (2015); Lima et al. (2017); Marcucci and Fragkos (2015); Solaymani (2019) and Voigt et al. (2014)). However, caution is needed when interpreting the findings of these studies, as the data used are not fully homogeneous or directly comparable. Moreover, many of these studies lack access to more detailed, granular data. Surprisingly studies pertaining to Indian economy using LMDI decomposition analysis is very few. G. Ortega-Ruiz et al., (2018) using LMDI have found that the economic growth of India has been the dominating driving force contributing to the increase in CO2 emissions, while the improvement in energy intensity has been the major factor in reducing the emissions. The time period of the study spans from 1990-2015 and uses data from International Energy Agency, the United States Environmental Protection Agency and the International Agency for Atomic Energy. Das and Roy (2020) also used LMDI technique to decompose the drivers of CO2 emissions for Indian economy using energy data from energy statistics published by MoSPI. Their study spanned from 1990-2013. However, during that period the renewables deployment in India was in its infancy and therefore couldn’t capture the effects of rapid renewables deployment which picked up post 2015 in India. III.1 Data For the purpose of present study, the economy has been broadly classified into primary sector (agriculture, forestry and fishing), secondary sector (Mining and quarrying, manufacturing, Electricity, gas, water supply and other utility services and construction) and the rest of the economic activities have been clubbed as Tertiary sector. MoSPI publishes energy statistics of India annually which provides fuel wise sectoral final energy consumption. The sectoral emissions have been estimated from energy consumption using emission intensities of fuel1. Emission factor per type of fuel is taken from the US EPA (2019) which is assumed to represent long-term average values (Table 2). The emission factor for grid electricity has been obtained from our world in data. CO2 emissions are calculated using the simple formula: 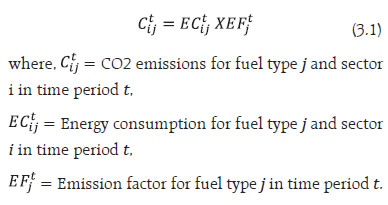 The timeframe for this study spans from 2012-13 to 2022-23. The focus is solely on energy-related emissions, with process emissions being excluded from consideration. III.2 Methodology According to energy identity analysis, CO2 emissions can be attributed to five factors: the output effect, structural effect, energy intensity effect, fuel-mix effect, and emission-factor effect (Ang, 2003) (Table 3). The overall emissions are further broken down by economic sectors and fuel types. The decomposition identity can be represented as follows: 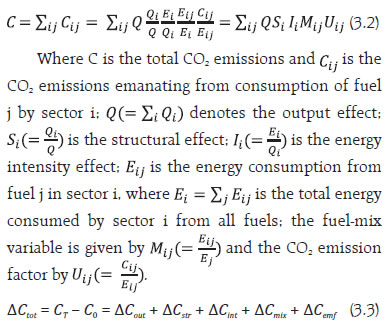 The subscripts indicate output effect, structural effect, energy intensity effect, fuel mix effect and emission factor effect. The LMDI formulae for these effects are: 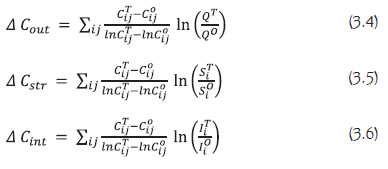 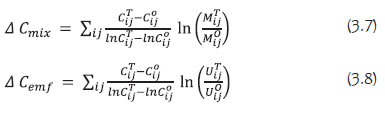 In the calculations, it is assumed that the emission factors of fuels do not change, except for electricity. Since electricity is a secondary energy source, its emission factor changes over time due to variations in its fuel mix and technical parameters. Since LMDI method relies on logarithmic functions, it cannot handle zero values. However, this issue can be resolved by substituting very small positive numbers (e.g., 10^-20) for zeros. Ang and Choi (1997) have demonstrated that LMDI tends to converge when small positive numbers replace zero values in the dataset. Another limitation of LMDI is its inability to process negative values. However, in our dataset, no negative values are present. III.3 Decoupling Analysis Tapio decoupling analysis is a method used to assess how changes in economic performance and environmental impact are related, focusing particularly on the decoupling of economic growth from carbon emissions. It helps to understand if an economy is growing while simultaneously reducing its environmental footprint. In the context of present study, we are interested in income elasticity of CO2 emissions which is defined as follows: 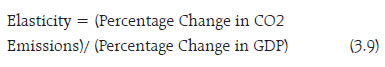 Based on the elasticity coefficient, the Tapio model categorises the relationship into nine states (Table 4). Total energy related emissions increased by 706 million tons during the period 2012-13 to 2022-23. The LMDI decomposition shows that total change in CO2 emission can be decomposed into a positive output effect (+1073 mt) and fuel mix effect (+78 mt), which is partially offset by a negative energy intensity effect (–399 mt)2. The structural (–15 mt) and emission factor effects (-30 mt) were slightly negative (Chart 1a). We break down the 10-year long period into two equal sub-periods 2012-17 and 2017-22 to investigate the individual effects. We observe similar trends that output effect is driving the emissions while improvements in energy intensity has been mitigating the rise in emissions (Chart 1b and c). We have also decomposed the sector wise changes in CO2 emissions into four factors viz., Output effect, energy intensity effect, fuel mix and emission factor effects to investigate the dynamics within the sectors (Chart 2). 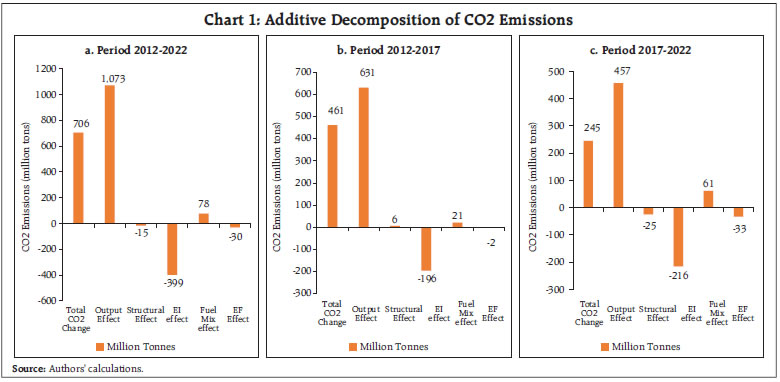 IV.1 Output Effect The Output effect denotes the increase in energy-related CO2 emissions attributable to changes in the scale of economic activity. The findings of this study align with the vast body of research, which indicates that output growth plays a significant role in driving increased energy consumption and CO2 emissions. In the 2012-2017 period, the absolute magnitude of output effect was larger than the latter period as India grew much more rapidly during this period as compared to the second half which was plagued by COVID-19. At the sectoral level, only agriculture saw a rise in its output effect in the 2017-22 period as it was less affected by COVID-19 than the rest of the sectors. 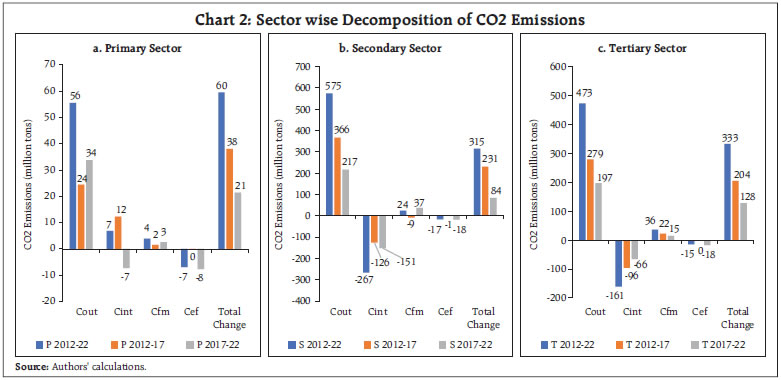 IV.2 Structural Effect The share of the tertiary sector has grown during this period, reducing the shares of both primary and secondary sectors. While the decline in the emission-intensive secondary sector would typically lead to a negative structural effect, this was offset by the decreasing share of the primary sector, which is the least emission-intensive. As a result, only a minor negative structural effect was observed overall. IV.3 Energy Intensity Effect The energy intensity (EI) effect alone contributed to a reduction of 399 MT of CO2 emissions, accounting for 56 percent of the total 706 MT emissions between 2012 and 2022. This effect was particularly significant during the 2017-22 period, where it resulted in a reduction of 216 MT, representing 88 percent of the total emissions during that time, compared to 42 percent in the previous period. During 2012-22, India’s energy efficiency improved with a CAGR of 1.67 percent for primary energy3 and 2.15 percent for final energy consumption which is broadly in line with its long-term average of 1.9 per cent (Chart 3). The energy efficiency of India has been improving at a higher rate than that of the world average during 2000-23 (Table 5).  IV.4 Fuel mix effect India’s final energy consumption is shifting towards electricity, reducing the share of coal (Table 6)4. Although oil and natural gas have seen slight increases, electricity, which is more emission-intensive than other fuels, has led to a net positive change in the fuel mix effect. The situation with electricity warrants closer examination. Electrification in transport and industry is often hailed as a major step forward in the fight against climate change. Electricity is indeed a highly efficient form of delivered energy compared to other fossil fuels. However, in countries that rely heavily on coal or lignite to power their thermal plants, CO2 emissions per kilowatt-hour (kWh) are significantly higher. In India, for example, 1 kWh of grid electricity consumed emits 0.741 kg of CO2, which is three times more polluting than other energy sources. In a traditional coal-fired power plant, about 70-73 percent of the energy from coal is lost in the conversion process from chemical to heat to electrical energy. Additionally, 21 percent of the remaining electricity is lost during transmission and distribution. However, the higher efficiency of electricity somewhat offsets its higher emission factor. IV.5 Emission Factor Effect The negative emission factor effect is primarily driven by the deployment of renewables, with additional contributions from improvements in the efficiency of existing thermal power plants. The large-scale deployment of renewables is a relatively recent development, which explains why the emission factor effect during 2012-2017 was minimal and only became significant in the latter half of the study period. Currently, solar and wind accounted for just 2.1 percent of the total primary energy supply. However, going ahead, renewables are expected to play a much larger role as their falling costs increasingly displace fossil fuels, not only in the power sector but also through the indirect electrification of industries via green hydrogen. India has already auctioned a substantial amount of green hydrogen capacity under the National Green Hydrogen Mission, which is expected to come online soon. Tapio decoupling analysis indicates that India has achieved weak decoupling during this period, with a decoupling elasticity of 0.59, which is similar to that of other lower-middle-income countries (LMICs). Rapid urbanisation and the demand for infrastructure development, including roads, buildings, and energy facilities, increases energy consumption and emissions, leading to higher elasticity. However, upper middle income and high-income countries have achieved much lower elasticities during the period (Table 7). The primary sector initially demonstrated a worsening relationship between economic growth and carbon emissions. While this trend improved in the second half of the period, emissions continued to outpace GDP growth. The secondary sector experienced the most rapid decoupling, followed by the tertiary sector. Moreover, India’s overall carbon intensity decreased at an accelerated pace during the latter part of the study, corresponding to increased renewable energy adoption and growing environmental consciousness among businesses and the public (Table 8). 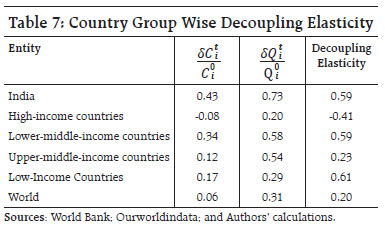 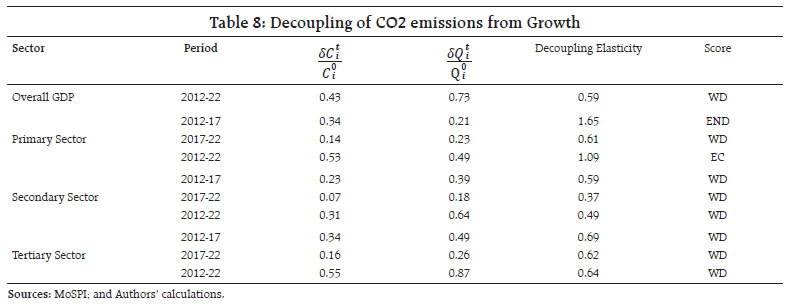 VI. Conclusion This paper has analysed the factors driving emission growth in India over the last decade (2012-2022) using LMDI decomposition. During this period, energy-related CO2 emissions rose by 706 million tons. The primary driver of this increase was the output effect (+1073 Mt), with a minor contribution from the fuel mix effect (+78 Mt), which was influenced by the growing share of electricity—a highly emission-intensive source in India. However, the energy intensity effect (-399 Mt) helped to moderate the rise in emissions, reflecting a 1.9 percent annual improvement in energy efficiency. This rate of improvement is consistent with India’s long-term trend from 2000-2023 and exceeds the global average for the same period. The structural effect (-15 Mt) was slightly negative, as the GDP share of the less emission-intensive tertiary sector increased at the expense of the more emission-intensive secondary sector. However, a decline in the low-emission primary sector’s share limited the potential emission reductions from structural changes. Additionally, the emission factor effect (-30 Mt) was also negative, driven by the reduction in emission intensity of grid electricity due to the growing share of renewable energy in the grid. It’s worth noting that this effect was minimal from 2012-2017 but became more significant in the latter half of the decade. Despite the emphasis on renewables, solar and wind accounted for only 2.1 per cent of total primary energy in 2022-23. However, going ahead, the emission factor effect is expected to play a more prominent role as renewables increasingly replace fossil fuels and green hydrogen usage expands in industries. India achieved a decoupling elasticity of 0.59 during this period, a figure that aligns with the decoupling elasticities observed in other lower-middle-income countries. While upper-middle and high-income countries have achieved much lower decoupling elasticities, India’s figure is commendable given its development needs which includes rapid urbanisation and significant investments in infrastructure and construction. India has made considerable strides in decoupling emissions from economic growth, but further efforts are essential to accelerate progress toward achieving net zero. To this end, India should intensify its focus on expanding renewable energy. Solar and wind power tariffs are now lower than those for new coal power plants, dispelling earlier concerns about the high costs of renewables (CEA, 2024 and CERC, 2024). The levelised cost of electricity (LCOE) for solar PV combined with battery storage5 in India is already more competitive than that of new coal-fired plants6 and is expected to continue decreasing (IEA, 2024). In addition to scaling up renewable energy, maintaining a strong emphasis on improving energy efficiency is crucial, as it remains a powerful tool for reducing carbon emissions. References Achour, H., & Belloumi, M. (2016). Decomposing the influencing factors of energy consumption in Tunisian transport sector using the LMDI method. Renewable and Sustainable Energy Reviews, 56, 159-169. Andreoni, V., & Galmarini, S. (2016). Drivers in CO2 emissions variation: A decomposition analysis for 33 world countries. Energy, 103, 27–37. Ang, B. W. (2005). The LMDI approach to decomposition analysis: A practical guide. Energy Policy, 33(7), 867-871. https://doi.org/10.1016/j.enpol.2003.10.010 Ang, B. W., Liu, F. L., & Chung, H. S. (2004). A generalized Fisher index approach to energy decomposition analysis. Energy Economics, 26(4), 757-763. https://doi.org/10.1016/j.eneco.2004.04.019 Ang, B. W., & Zhang, F. Q. (2000). A survey of index decomposition analysis in energy and environmental studies. Energy, 25(12), 1149-1176. Ang, B. W., Zhang, F. Q., & Choi, K. H. (1998). Factorizing changes in energy and environmental indicators through decomposition. Energy, 23(6), 489-495. Azevedo, I. M. L., Morgan, M. G., & Morgan, F. (2011). The transition to solid-state lighting. Proceedings of the IEEE, 99(10), 1780-1804. Bansal, R. S., & Gupta, A. S. (2020). Impact of structural changes on energy-related CO2 emissions in India: A decomposition approach. Energy Economics. Das, N., & Roy, J. (2020). India can increase its mitigation ambition: An analysis based on historical evidence of decoupling between emission and economic growth. Energy for Sustainable Development, 57, 189-199. Henriques, S. T., & Kander, A. (2010). The modest environmental relief resulting from the transition to a service economy. Ecological Economics, 30, 271–282. Inglesi-Lotz, R. (2018). Decomposing the South African CO2 emissions within SA BRICS countries context: Signaling potential energy rebound effects. Energy, 147, 648–654. Jain, M., & Mukherjee, S. (2019). Estimating sectoral energy use in the Indian economy using input-output approach. Indira Gandhi Institute of Development Research Working Paper, WP-2019-019. Kangyin, D., Hongdian, J., Renjin, S., & Xiucheng, D. (2019). Driving forces and mitigation potential of global CO2 emissions from 1980 through 2030: Evidence from countries with different income levels. Science of The Total Environment, 649, 335. Kanitkar, T., Banerjee, R., & Jayaraman, T. (2015). Impact of economic structure on mitigation targets for developing countries. Energy for Sustainable Development, 26, 56–61. Kant, S., Kumar, M., Khan, S., & Sharma, S. (2022). Carbon dioxide emissions from India’s manufacturing sector: A decomposition analysis. RBI Occasional Papers, 43(1). Reserve Bank of India. Lima, F., Lopes Nunes, M., Cunha, J., & Lucena, A. F. P. (2017). Driving forces for aggregate energy consumption: A cross-country approach. Renewable and Sustainable Energy Reviews, 68, 1033–1050. Li, W., Li, Z., & Ni, W. (2018). LMDI decomposition of energy-related CO2 emissions based on energy and CO2 allocation Sankey diagrams: The method and an application to China. Sustainability, 10(2), 344. Li, Y., Liu, X., & Feng, C. (2018). Exploring the driving forces of energy-related CO2 emissions in China’s agricultural sector. Journal of Cleaner Production, 195, 20-28. Mangla, S. K., & Ahuja, J. (2014). Carbon emission in BRICS countries: Trends, issues, and drivers using Kaya decomposition. FIIB Business Review, 3(3), 3-12. Matisoff, D. C., & Edwards, J. (2014). Kindred spirits or intergovernmental competition? Decomposing the effect of policy instruments on renewable energy growth. Energy Policy, 65, 743-753. Marcucci, A., & Fragkos, P. (2015). Drivers of regional decarbonization through 2100: A multimodel decomposition analysis. Energy Economics, 51, 111–124. Miller, R. E., & Blair, P. D. (2009). Input-output analysis: Foundations and extensions. Cambridge University Press. Nag, B., & Parikh, J. (2000). Indicators of carbon emission intensity from commercial energy use in India. Energy Economics, 22(4), 441-461. Ortega-Ruiz, G., Mena-Nieto, A., & Garcia-Ramos, J. E. (2020). Is India on the right pathway to reduce CO2 emissions? Decomposing an enlarged Kaya identity using the LMDI method for the period 1990–2016. Science of The Total Environment, 737, 139638. Rao, P. S., & Bhattacharya, L. N. (2019). Sectoral decomposition of CO2 emissions and its policy implications for India. Journal of Cleaner Production. Raupach, M. R., Marland, G., Ciais, P., Le Quéré, C., Canadell, J. G., Klepper, G., & Field, C. B. (2007). Global and regional drivers of accelerating CO2 emissions. Proceedings of the National Academy of Sciences, 104(24), 10288-10293. Román-Collado, R., & Colinet, M. J. (2018). The impact of economic growth on energy consumption in European emerging economies. Environmental Science and Pollution Research, 25(16), 15624-15632. Sahu, N. C., & Narayanan, K. (2011). Decomposition of industrial energy consumption in Indian states: An application of the LMDI method. Energy Policy, 39(6), 3108-3119. Shahbaz, M., Farhani, S., & Ozturk, I. (2015). Do coal consumption and industrial development increase environmental degradation in China and India? Environmental Science and Pollution Research, 22(5), 3895-3907. Sharma, A. K., & Jain, R. K. (2017). Decoupling of economic growth and CO2 emissions in India: A sectoral analysis. Environmental Science and Policy. Shuang, D., Ming, Z., & Wei, H. (2016). Decomposing the decoupling of CO2 emission from economic growth in BRICS countries. Natural Hazards, 84(2), 1055–1073. Singh, S. K., & Ghosh, V. K. (2016). Decomposition analysis of CO2 emissions in India: A study of sectoral and regional variations. Energy Policy. Solaymani, S. (2019). CO2 emissions patterns in 7 top carbon emitter economies: The case of transport sector. Energy, 168, 989–1001. Timilsina, G. R., & Shrestha, A. (2009). Transport sector CO2 emission growth in Asia: Underlying factors and policy options. Energy Policy, 37(11), 4523-4539. United Nations. (2023). For a liveable climate: Net-zero commitments must be backed by credible action. Retrieved from https://www.un.org/en/climatechange/net-zero-coalition UNFCCC. (2022). India’s updated first nationally determined contribution under Paris Agreement. Retrieved from https://unfccc.int/sites/default/files/NDC/2022-08/India%20Updated%20First%20Nationally%20Determined%20Contrib.pdf Vazhayil, J. P., & Balasubramanian, R. (2019). Decomposition analysis of carbon dioxide emissions in the Indian industrial sector. Environmental Science and Pollution Research, 26(24), 24415-24429. Voigt, S., De Cian, E., Schymura, M., & Verdolini, E. (2014). Energy intensity developments in 40 major economies: Structural change or technology improvement? Energy Economics, 41, 47–62. Wang, C., Chen, J., & Zou, J. (2005). Decomposition of energy-related CO2 emission in China: 1957–2000. Energy, 30(1), 73-83. Wang, L., Wang, J. Y., Zhao, Y. F., Li, Z., & Guo, R. (2020). Spatiotemporal characteristics of the relationship between carbon emissions and economic growth in China’s transportation industry. Environmental Science and Pollution Research, 27(30), 32962-32979. Yeo, Y., Shim, D., Lee, J. D., & Altmann, J. (2015). Driving forces of CO2 emissions in emerging countries: LMDI decomposition analysis on China and India’s residential sector. Sustainability, 7(12), 16108-16129. Zhang, M., Mu, H., Ning, Y., & Song, Y. (2009). Decomposition of energy-related CO2 emissions over 1991–2006 in China. Ecological Economics, 68(7), 2122-2128. ^ Madhuresh Kumar is Assistant General Manager in the Department of Economic and Policy Research. Shobhit Goel and Manu Sharma are from the Department of Supervision. Muskan Garg has worked as an intern in the Department of Economic Policy and Research. The views expressed in this article are those of the authors and do not represent the views of the Reserve Bank of India. 1 This approach ensures that scope 1 and scope 2 emissions of the sectors are accounted for while avoiding the risks of double counting. Scope 3 emissions are excluded to prevent the occurrence of multiple counting of emissions. 2 The results of the LMDI decomposition could be interpreted as ceteris paribus effects. 3 Primary energy refers to energy sources as they are found in nature before undergoing any conversion or transformation. A significant portion of primary energy is being lost in transformation and distribution. Final consumed energy is the energy that has been delivered to end users for consumption. It represents the energy that is actually used in homes, businesses, and industries. 4 The falling share of coal in final consumed energy should not be construed as the share of coal has fallen in the primary energy supply. In India, bulk of the electricity is being produced by coal power and the share of renewables is picking up only recently. 5 Solar PV with storage = solar PV installation paired with four-hour duration battery storage, scaled to 20 per cent of the output capacity of the solar PV. 6 The tariffs discovered in the renewable energy round the clock (RE-RTC) tenders have remained highly competitive against the conventional sources, with recent bid tariffs in the range of ₹4.0-4.5 per unit (Mint, 2023). |

এই পৃষ্ঠাটো শ্বেয়াৰ কৰক:


ভাৰতীয় ৰিজাৰ্ভ বেংক মোবাইল এপ্পলিকেষ্যন ইনষ্টল কৰক আৰু নৱীনতম বাতৰিৰ প্ৰৱেশাধিকাৰ পাওক!
আমাৰ এপটো ইনষ্টল কৰিবলৈ QR ক’ড স্কেন কৰক


পৃষ্ঠাটো শেহতীয়া আপডেট কৰা তাৰিখ:


