II.18 To sum up, significant structural changes characterise the trends in savings and investment in the economy over the period since the structural reforms were undertaken in the economy since the 1990s. While the households continue to retain their status of being financially the surplus sector, in combination with the private corporate sector, the two sectors, namely the private sector, has strengthened its relative position in the sphere of savings and investment vis-à-vis the public sector.
Interpretational Significance of the Savings and Investment Estimates
II .19 In the light of the higher growth path of the economy in recent years, a critical review of the available estimates of domestic and national savings and investment in the economy would be useful with respect to their interpretational significance. Savings and investment estimates are attracting centre stage attention globally from the standpoint of their implications for contemporary issues such as persisting global imbalances. As mentioned earlier, savings can accrue to the economy from three sectors - namely, household, corporate and public sectors. More importantly, interpretational aspects and measurement issues have come to the fore, particularly in household savings, which is a dominant savings sector in India where a number of issues related to the estimation are still unsettled. Interpretational issues have remained endemic to the savings estimates, surfacing from time to time leading thereby to formation of Committees to address these concerns.
Savings from a Macro-Economic Perspective
From a macroeconomic perspective, three important measures of savings are private savings, Government savings and national savings.
(a) Private Savings = Sp = Private disposable income – Consumption
= (Y + NFP +TR – T + INT) – C ——————————————————(1)
(b) Government Savings = Sg = Net Government Income – Government purchase
= (T – TR – INT) – G ——————————————————————(2)
Where Y = Gross Domestic Product, NFP = Net Factor Payment from Abroad, TR = Transfers received from the Government, INT = Interest Payment on the Government’s Debt, T = Taxes (including income from entrepreneurship and property), C = Consumption and
G = Government purchases (purchase of goods and services and compensation of employees).
(c ) National Savings = S = Sp + Sg
= (Y + NFP +TR– T + INT) – C + (T – TR – INT) – G
= Y + NFP – C – G
= C + I + G + NX + NFP – C – G
= I + NX + NFP
= I + CA ———————————————————————————(3)
Where NX = Net Exports and CA = Current Account Deficit.
Sp + Sg = Ip + Ig + CA—————————————————————(4)
In the Indian context, the gap between the savings and investment (Gross Capital Formation) by different sectors and its distribution for the year 1999-2000 (the latest base year for the National Accounts Statistics) is given in Table 2.3.
II.20 One analytical use of the national savings identity is to bring out an important short-run, long-run dichotomy. In the short-run, international borrowing can go up or down depending on cyclical movements, exchange rates, and a host of other factors. Very few countries do without any international borrowing or lending in a particular year. But over a longer period of time, international borrowing kept close to zero stabilises a country’s ratio of international obligations to its gross domestic product (GDP). When this liability ratio is stable, a nation’s savings is implicitly financing most of its domestic investment.
Table 2.3: Savings and Gross Capital Formation (GCF) by Institutional Sectors, 1999-2000 |
(Rs. in crore) |
Particular |
Savings |
GCF |
Savings-GCF |
1 |
2 |
3 |
4 |
1. |
Total Economy |
302835 |
312578 |
-9743 |
| |
1.1 |
Household |
350994 |
144392 |
206602 |
| |
1.2 |
Private Corporate |
41036 |
97277 |
-56241 |
| |
1.3 |
Public Sector |
-89195 |
70909 |
-160104 |
2. |
Valuables |
|
15519 |
-15519 |
3. |
Current Account Deficit |
21988 |
|
21988 |
4. |
Errors and Omissions |
|
-3274 |
3274 |
5. |
Total |
324823 |
324823 |
0 |
II.21 Secondly, persistent borrowing, keeping investment above savings, may be possible, but it is not common, and in any case it automatically implies a build-up of international liabilities relative to its national output. If a nation wants to have its investment and not pay increasing shares of income in interest or dividends, it has to finance this investment by its own national savings. Alternatively, turning the equation around, high national savings will raise future living standards, whether it finances investment directly or reduces international borrowing.
II.22 Thirdly, the identity (4) ties savings to budget and current account deficits. Both deficits are subtraction items.
II.23 The savings-investment gap in India is relatively low reflective of modest reliance on foreign savings. Among the domestic sectors, contribution-wise, the private corporate sector savings, of late, has turned out to be a significant driver in domestic savings and together with household sector, is contributing to the generation of private savings. Although the public sector savings remained in a dis-savings mode for a long time, there is a turn-around recently. Significantly, these changes are occurring when the economy remained on a high growth trajectory in the last five years.
II.24 Cross-country differences in the evolution of gross corporate savings over the past half decade have tended to reflect to a large extent those of the gross operating surplus. Such differences across countries are likely to be due to countries’ exposure to global factors (accelerated globalisation and technological progress), presumably depending on institutional framework conditions (such as product and labour market regulations), as well as the sectoral composition of their economies.
II.25 As mentioned earlier, there is an across-the board rise in savings by all the constituent sectors in a period of high growth particularly in the post-reform period of the 1990s and 2000s. To the extent there are compositional shifts within the components of savings happening in conjunction with the structural transformation of the Indian economy, these trends have been recognised as structural in nature in the literature. Within the constituent sectors, the household financial savings, the non-departmental undertakings within the Government sector and the non-financial joint stock companies within the private corporate sector contribute predominantly to the generation of domestic savings in the era of reforms.
Interpretational Difficulties that have led to Frequent Questions on Estimation
II.26 Amongst the components of national accounts statistics (NAS), it is the savings and investment estimation on which the authorities have cast doubts at frequent intervals on the grounds of interpretational difficulties faced by them in explaining some aspect of macroeconomic development or the other. Working Groups/Expert Groups were appointed to enquire into the questions and they have all come out with recommendations for improvements in the methodology of savings and investment estimation.
II.27 It may be recalled that Raj and Chelliah Expert Groups were asked to look into some of the interpretational issues then existing. First, there was the K.N. Raj Working Group (1982), which was set up when it was found that,
II.28 “The rates of gross capital formation and of gross saving have gone up significantly since the early years of the 1970s, to about 24 per cent of the gross domestic product by 1978-79; even net capital formation and savings were touching rates of around 20 per cent of the national income. This has raised a number of questions, in regard to both the estimates themselves and their interpretation, particularly since there has been evidently no corresponding improvement in growth momentum within the economy and the problems of mobilisation of resources for development seem still as severe as ever before” (RBI, 1982).
II.29 Second, there was the Chelliah Expert Group appointed in the context of the contrary development when savings fell and growth improved. It was found that:
II.30 “An important reason for this lagged recovery in private savings is the decline in the absolute amount of household savings in 1992-93 as estimated by the CSO. Since this decline is observed for a year in which the GDP growth rates rises from 0.9 per cent to 4.3 per cent and GDP growth from agriculture shows a sharp turnaround from (-) 2.5 per cent to plus 5.3 per cent, there appear to be grounds for reviewing the methodology for estimating, saving and capital formation in the economy [Economic Survey 1994-95:3].
II.31 The Chelliah Expert Group itself argued that there were large discrepancies in the estimates of saving and investment, with saving being far in excess of investment – “the order of discrepancy being almost 2 per cent of GDP in 1994-95. Indeed, this has raised questions about the quality of the estimates, and the methodology adopted for collecting data” (Department of Statistics 1996:5).
II.32 More recently, the Report of the Working Group on Savings for the Eleventh Five Year Plan, 2007-08 to 2011-12 (RBI, 2007) argued that “the procedures currently adopted for estimation of household savings and its projection needs a re-look as we move along”. This is because the estimates of household financial savings are showing a decline, despite signs of financial deepening - a puzzle for the Working Group, which has impliedly made out a case for fully measuring household income, expenditure and savings through integrated nation-wide field surveys so as to capture the complex interplay of a number of variables impacting on household savings.
II.33 The important observations that the above Committees have made on the interpretational issues of savings and investment estimates are given below.
II.34 First, the relatively small accretion to the savings rate during the ‘eighties’ underscored the need for undertaking measures to raise this rate or/and lower the incremental capital output ratio (ICOR) for effecting improvement in the overall growth rate. This position changed subsequently with rise in growth since the eighties.
II.35 Second, a sharp increase in the preference for financial assets as against physical assets in the 1990s implied that this preference is essentially a reflection of financial widening in the sense of availability of a larger menu of financial assets, and of a sharp reduction in financial controls. The growing flexibility that investors enjoyed in terms of choice of assets in the increasing financial portfolios and in terms of optimisation of rates of return with risk minimisation furthered by financial sector reforms. The Chelliah Committee (1996) noted that as the reforms are intensified, financial savings are bound to play a more crucial role in economic development than hitherto.
II.36 Third, apart from undertaking structural and institutional measures for influencing productivity, it is imperative that the investment rate in the economy is higher than the GDS rate essentially to ensure that savings of a relatively underdeveloped country such as ours is not exported. One of the aspects of the estimates of savings and investment in India is the discrepancy in the estimates of GDS and gross domestic capital formation (GDCF) in most of the years. The Chelliah Group believed that GDCF estimates are subject to errors in several respects, and methodologies need to be, therefore, improved. The savings in the form of physical assets of the household sector being a part of the estimate of capital formation of the economy would reflect the errors, which creep in the estimates of total capital formation in the economy. As physical assets of the household sector are common and critical to both the aggregates, the Chelliah Group thought it desirable to have this component independently estimated.
II.37 Fourth, the problem of obtaining the data on a regular basis is severe in the case of the household sector. This sector comprises not only farm households engaged in agricultural production, but also individual households and unincorporated enterprises engaged in industry, trade, transport, finance, private trusts, etc. The estimates for the household sector are worked out on the basis of the available data from various censuses, sample surveys, and research studies and assumed relationships. The estimates, therefore, would have errors.
II.38 Fifth, as is known, number of ratios and norms are used in the preparation of estimates of capital formation for the economy as a whole and in respect of the household sector. These ratios are based on data of somewhat remote past and their use may be unwarranted in the light of the structural changes taking place in the economy. If these ratios are updated, the estimation of capital formation would considerably improve in qualitative terms and the relative size of errors and omissions would probably come down.
II.39 Sixth, according to Mulheisen (1997), the interpretation of Indian savings trends is complicated by a number of weaknesses in the methodology for measuring both investment and savings. The most important shortcomings are:
-
The estimate for physical household savings is set equal to household investment, which itself is calculated only indirectly as a residual. Measured physical household savings has been highly volatile
-
There are errors and omissions in the estimates of both savings and investment, but adjustments are made only to investment. The underlying assumption is that the savings estimates are more reliable (based on the greater accuracy of public, financial, and corporate savings data) and, therefore, investment is adjusted to equal the sum of domestic and foreign savings. Reversing the present CSO practice, when domestic savings is adjusted to include errors and omissions, so that the sum of adjusted domestic savings and foreign savings equals the original investment estimates. This yields a much smoother, more plausible path for domestic savings (Mulheisen, 1997).
-
The estimates of corporate savings and investment are based on a small, unrepresentative sample, and rely largely on voluntary responses from enterprises.
II.40 Seventhly, as we move to the 1990s, what we see is that financial deepening has strengthened in India, judged by a host of indicators, which however has not been reflected in financial savings of the household sector contrary to the a priori expectation that financial development should spur economic growth and saving. Part of the reason could be methodological to the extent that household financial liabilities, which finance physical savings, are deducted from gross financial savings to arrive at the net financial savings.
II.41 Another issue that has come into focus in the recent literature was that if the corporate sector’s saving is going up, the household sector’s savings would come down, to the extent that unincorporated entities, constituting a part of the household sector, get incorporated and such savings are reflected as corporate savings. In future, to the extent the savings from the incorporated sectors is getting strengthened, it may lead to a decline in the share of savings of unincorporated (household) sector.
Interpretation of India’s Savings and Investment Estimates
II.42 The HLC discussed the interpretational significance of the estimates of savings and investment. It recognised that earlier Committees like Raj Committee and Chelliah Committee as also reputed economists and statisticians have endorsed India’s present procedure of estimation as conceptually sound. Notwithstanding the conceptual strength of India’s practice, the present method is subject to weaknesses mainly emanating from data quality and related problems. For correct interpretation and a clear understanding of the available estimates of domestic savings and capital formation, it is essential to first keep in mind the various data sources used and the current methodology of estimation of
savings and the capital formation. In doing so, it would be possible to indicate the areas where errors in estimation could arise. The discussions of the HLC focused mainly on savings from a macro-economic perspective to bring out certain analytical underpinnings of the estimates, interpretational issues with regard to India’s savings estimates, indicating the possibility of under or over estimation of savings mainly in the context of problems with regard to measurement, data base, method of estimation and reliability, both at the overall and sectoral levels. Similarly, a brief analysis on the investment estimates was attempted by the HLC. Based on such detailed deliberations, the HLC has made some broad observations. A synthesis of the HLC’s deliberations and the views are provided below.
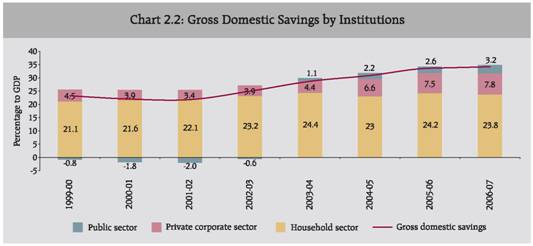
II.43 As mentioned earlier, an analysis of the recent trends in Gross Domestic Savings
(GDS), overall and across sectors, suggests that at a disaggregated level, it is the household sector, which occupies a position of dominance over the other institutional sectors like private corporate sector and the public sector in terms of generating savings. Household savings composed of both financial and physical savings, as a percentage of GDP at current market prices, increased from around 6.6 per cent in the 1950s to 23.8 per cent in 2006-07. Savings by public sector and private corporate sector are improving in recent years.
Household Savings
II .44 With regard to the household sector, over the period 1999-00 to 2006-07, while personal disposable income has grown at an average rate of 10.3 per cent per annum, private final consumption expenditure has grown at the rate of 9.2 per cent per annum, leading to an increase in household savings, in turn, attributable to both household financial and physical savings. Within the former category, a clear preference pattern changes are seen in rise in the rate of contractual savings (mainly life insurance funds) and decline in the rate of net deposits. As per the related literature, the household savings rate responds to changes in economic environment as well as to structural changes (for example, financial liberalisation) and it is expected that the quantum of the household savings tracks a host of theoretically well-established determinants, the prime among them being the growth in per capita income, financial liberalisation, favourable demographics, low wealth effects on consumption, greater opportunities for diversification across financial assets and market related returns. As already stated earlier, a documentation of the theoretical and empirical literature on savings behavior in India can be found in EPWRF-NCAER study (2003). One of the supportive factors of contemporary relevance in emerging market economies and India in particular is the low dependency ratio (measured as share of population in the total population which falls outside the working population in the age group of 15-59 years) and a near one-for-one relationship between it and national savings (Mulheisen, 1997, Rodrik and Subramanian, 2004, Poddar and Yi, 2007, and Hiroko Oura, 2007). Some of the estimated
results of the above-mentioned studies are as follows:
- Poddar and Yi (2007) find that a 1 percentage point decrease in the dependency ratio adds 0.8 to the national savings ratio.
- Hiroko Oura (IMF 2007) finds that 10 per cent increase in the savings ratio between 2005 and 2025 is on account of fall in dependency ratio.
II .45 The household savings are also driven in recent years by the physical savings, especially since 2000-01 when the household sector has shown a preference for savings in the form of physical assets. This could be attributed partly to the soft interest regime in recent years. Increase in the rate of household savings in physical asset in recent yearsreflects booming construction activities mainly of housing and accelerated industrial activities requiring machinery and equipments.
II.46 While countries like the US and UK have established a mechanism to directly estimate the savings of their respective household sector through income-expenditure surveys, India follows a unique way of estimating the household savings indirectly by a method, which is a mix of flow-of-funds and commodity flow approaches, where household sector’s share is
extracted as residual.
II.47 The estimates of financial savings in respect of households including non-profit institutions and unincorporated private business are estimated by changes in the net financial assets held by them such as: currency, deposits with financial institutions, shares and debentures, claims on Government, net equity in the life funds, provident and pension funds net of changes in financial liabilities. The estimates in respect of various financial instruments are arrived at as a residual after duly accounting for such instruments held by public and private corporate sectors. In estimating the financial savings of the households, increments in their holdings of financial assets are calculated net of increments in their financial liabilities. These annual flows are compiled instrument-wise. As the household sector is an unorganised sector and its balance sheets are not available, its financial flows are either estimated on the basis of firm information obtained from the accounts of counterpart institutions engaged in transactions with the households or as a residual after deducting the accounted financial information for the other sectors from the financial totals or are based on the information collected on sectoral distribution either directly or on the basis of surveys. Select methodological problems are the following.
II.48 First, in absence of comprehensive income-expenditure surveys, instrument-wise savings estimates are prepared in an indirect manner through the residual treatment accorded to household sector in the flow-of-funds accounts. The difficulty here is the absence of cross-validation from a direct survey. Savings is estimated either from the income-expenditure account or from the flow-of-funds account, as earned net worth, being the difference between change in asset and liabilities, adjusted for capital gains and losses. Theoretically, these two measures of savings should yield identical results. In US and UK, both the estimates are available, which help in cross-validating the income-expenditure survey based direct estimates of savings. But in India, only flow-of-funds based estimation is available for household financial savings and commodity flow based estimation is available for household physical savings.
II.49 Second, in the absence of income-expenditure survey, there is no direct estimation of household savings and as a result there is no cross validation of the indirect (residual) estimates of savings.
II.50 Third, the estimates of domestic savings are presently prepared only at current prices. The estimates at constant prices have not been attempted so far as the suitable procedure of estimation is yet to be evolved.
Some Marked Features of Trends in the Savings in India
Predominance of Household Savings
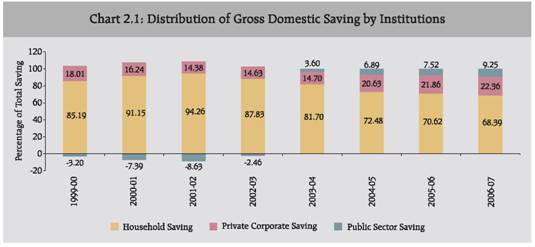
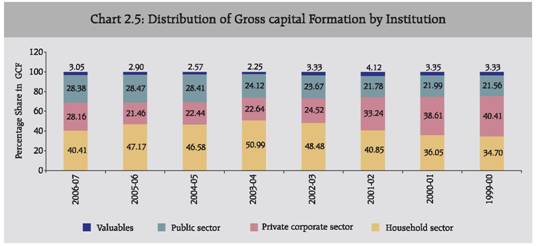
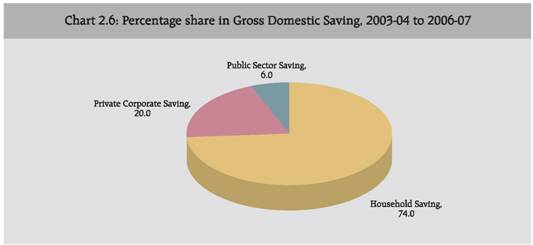
II.51 A remarkable feature of the Indian macro-economic story since independence has been the continuous rise in household savings over the decades. Since the 1950s, the household sector has remained the predominant source of the GDS, and it contributed, on an average, around 74.0 per cent to total domestic savings during the last five years ending 2006-07. Conversely, private corporate sector accounting for 20.0 per cent, occupies second place followed by the public sector (6.0 per cent) (Chart 2.6).
Structural Shift in the Household Savings
II.52 A salient feature of the 1990s was the rising trend in the household sector savings. Within the household sector savings, the rate of savings held in financial assets steadily increased during this period. Financial liberalisation has an important bearing on financial savings as it involves the creation of newer instruments and avenues of savings, and also reduces intermediation costs (McKinnon, 1973). In India, the phenomenon of improvement in financial savings could be attributed to more efficient financial intermediation, greater opportunities for diversification across financial assets and emergence of market related returns.
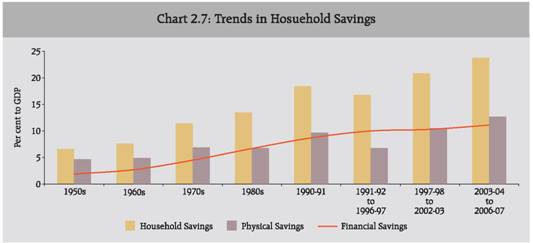
II.53 Over time, although both financial and physical savings have recorded an increase, the composition of household savings has seen a shift in favour of financial savings reflecting the spread of banking and financial services across the country. The share of household savings in physical assets in the total household savings declined from more than 70.0 per cent in the 1950s to around 53.5 per cent in last five years ending 2006-07. Concomitantly, the share of household financial savings in the total household savings increased from around 25.0 per cent in the 1950s to around 47.0 during the same period. The rate of financial savings increased from less than 2.0 per cent in the 1950s to over 11.0 per cent during 2003-04 to 2006-07 (Chart 2.7). The spread of the financial sector, in particular of bank branches, post office savings and the likes, seems to have helped in mobilising household financial savings.
 II.54 However, since 2000-01, the household sector has shown some preference for savings in the form of physical assets, which could be attributed partly to the soft interest rate regime in recent years, substantial growth in self-employment giving rise to a large number of informal sector activities as well as the rising expectation arising from rapid appreciation of the value of investments in housing. The ongoing financial deepening is facilitating larger access of bank credit for the households. As a result, household financial savings have increased only marginally from an average of 10.3 per cent during 1997-2003 to 11.3 per cent of GDP during 2003-2007. On the other hand, with increased availability of housing finance, household sector’s investment rate (physical savings) increased from 10.5 to 12.7 per cent during the same period. Thus, the widening of Savings-Investment gaps of the public and private corporate sectors combined was partly financed from household financial savings and partly by foreign savings.
Changing Composition of Household Financial Savings
II.55 The rate of household savings increased from 18.4 per cent in 1990-91 to the peak level at 24.4 per cent in 2003-04 and subsequently it declined to 23.8 per cent in 2006-07. At the average level, the rate of household savings is rising from 17.3 per cent during the five year period (1990-95) to 18.1 per cent during 1996-2000 and further to 23.2 per cent during 2006-07.
II.56 ‘Bank deposits’ is an instrument of great significance in that it constitutes the largest proportion of household financial savings (Table 2.4). Its share which fell during the 1980s, has been recovering since the 1990s. Notwithstanding financial innovations, bank deposits continued to be the most important instrument of financial savings among the households during the period of reforms. The buoyancy in bank deposits over the recent years partly reflects some migration from small savings; as this signifies only a shift in the asset portfolio composition of households.
II.57 Another important feature of household savings during the reform period has been the increasing importance of savings held in insurance funds, and provident and pension funds (together described as contractual savings). Within financial assets, preference has shifted from savings in the form of shares and debentures and deposits to claims on Government and contractual savings. A major component of contractual savings, viz, savings in life insurance funds, amounted to around 14.6 per cent of total savings during 2003-04 to 2006-07 much higher compared to the earlier periods (Table 2.4). Demographic variables like life expectancy, literacy rate and dependency ratios have emerged as key determinants of savings in addition to traditional variables like real interest rate, growth, per capita income, spread of banking facilities and rate of inflation (Athukorala and Sen, 2001). Apart from ensuring assured rates of return with tax exemptions, contractual savings also provides old age security. As disposable income rises and life expectancy continues to increase, concerns regarding old age security can be expected to result in increasing share of financial savings held in contractual instruments. Going forward, improvement in financial savings would depend on the further deepening of the financial sector, particularly through the continuation of insurance through participation of private insurance companies and pension sector reforms.
II.58 ‘Shares and debentures’ is another instrument of financial savings that was expected to get a boost from the reforms. Measures undertaken for developing the capital market were expected to divert savings from the traditional financial instruments to the capital market instruments. Reflecting this, the proportion of household savings in ‘shares and debentures’ (inclusive of investment in mutual funds) rose steeply to over 8 per cent of total financial savings in the initial years of the 1990s from 4 per cent in the 1980s. This was due to a shift away from the relatively safer modes of savings, such as small savings instruments (included under ‘claims on Government’). Following the irregularities in stock market in 1992 and the associated price uncertainty that prevailed in the subsequent period, the proportion of household financial savings held in ‘shares and debentures’, however, witnessed a decline to reach a low of around 4.0 per cent in the subsequent period. The pattern of financial savings that emerges during the decade of reforms, thus, indicates a continued preference of households for relatively safer instruments with assured returns (RBI, 2001-02).
Table 2.4: Components of Household Financial Savings |
(Percentage Share in Gross Financial Savings) |
Item |
1970s |
1980s |
1990-91 |
1991-92 to 1996-97 |
1997-98 to 2002-03 |
2003-04 to 2006-07 |
1 |
2 |
3 |
4 |
5 |
6 |
7 |
Currency |
13.9 |
11.9 |
10.6 |
10.9 |
8.6 |
9.3 |
Bank deposits |
45.6 |
40.3 |
31.9 |
33.1 |
38.5 |
4.4 |
Non- banking deposits |
3.0 |
4.6 |
2.2 |
9.4 |
2.9 |
0.7 |
Life Insurance Fund |
9.0 |
7.5 |
9.5 |
9.5 |
13.1 |
14.6 |
Provident and Pension Fund |
19.6 |
17.5 |
18.9 |
17.6 |
19.0 |
11.4 |
Claims on Government |
4.2 |
11.1 |
13.4 |
7.1 |
14.9 |
16.9 |
Shares and Debentures |
1.5 |
3.9 |
8.4 |
8.3 |
3.7 |
3.9 |
Units of UTI |
0.5 |
2.2 |
5.8 |
5.0 |
0.1 |
-0.8 |
Trade Debt (Net) |
2.7 |
0.9 |
-0.8 |
-0.8 |
-0.7 |
0 |
Total Financial Savings (Gross) |
100 |
100 |
100 |
100 |
100 |
100 |
Source: Handbook of Statistics on the Indian Economy, RBI, 2006-07. |
II.59 In sum, the rise in household savings is attributed to both household financial andb physical savings. Furthermore, at the average level, there are clear changes in the preference pattern as seen in the rise in the rate of contractual savings (mainly life insurance funds) and decline in the rate of net deposits, while as per the related literature, the quantum of the household savings tracks a host of theoretically well-established determinants, the prime among them being the growth in per capita income, financial liberalisation, greater opportunities for diversification across financial assets and market related returns. A succinct discussion can be found in Athukorala and Sen (2001), EPWRF-NCAER study (2003) and Report of the Working Group on Savings for the Eleventh Five Year Plan (2007). Financial savings have gained increasing importance and to that extent, the existing methodology has captured these critical economic changes rather well as seen from the savings estimates.
Quality and Limitations of Data Base
II.60 It may be stated that there is the possibility of under/over estimation bias in the present estimates of household sector’s savings. Some of the contributing factors have been identified in the Sources and Method, CSO, 2007. According to CSO, the savings estimates suffer from a number of limitations, mainly from deficiency of data. These are:
-
Data on Co-operative societies are not available for all the years. There is a time lag of four to five years.
-
Estimates for the household sector are built up in two parts (i) savings in financial assets, and (ii) savings in physical assets.
-
In case of savings in financial assets, the estimates of household savings in currency are estimated as 93 per cent of total currency on the basis of past trends of currency holding.
-
The estimates of provident fund of non-departmental enterprises are obtained by doubling the employers’ contribution as available in the books of accounts. No adjustments are made for withdrawals, interest, etc., since the data on these items are not available.
-
The non-Government educational institutions are being covered under the Employees Provident Fund Act, 1952 since 1981-82. However, the coverage of private educational institutions has been incomplete as many of these institutions are not making any returns to the CPFC. Thus, the estimates of PF can be improved only when the coverage of private educational institutions improves and reliable data on withdrawals, interest, etc., in respect of non-departmental enterprises becomes available.
-
The results of the RBI survey on ‘Growth of Deposits with Non-banking Companies and Ownership of Capital of Joint Stock Companies’ are not available beyond 1995-96. Estimates in respect of most of the other financial assets are based on current data, though, they mainly refer to total savings under each of these categories and households’ contributions are obtained as residuals.
-
The households’ savings in physical assets is also estimated by using the residual approach. The residual approach adopted for deriving savings estimates for households is undoubtedly not very satisfactory in all cases and has enough scope for improvement. The only approach through which this can be achieved is by conducting independent household surveys to collect direct data on income and expenditures, as far as pure households are concerned and by conducting annual surveys on household enterprises.
Private Corporate Savings
II.61 Private corporate sector, primarily characterised for its capital-intensive nature, contributed substantially to the rise in the overall domestic savings rate. The share of private corporate sector in overall savings increased markedly over the years and it stood at 22.4 per cent in 2006-07 as against average 9.5 per cent in the 1980s and 17.1 per cent in 1990s. It is interesting to observe that the rate of savings of the private corporate has increased from around 1.0 per cent in the 1950s, 1.5 per cent in the 1960s and 1970s, 1.7 per cent in the 1980s and 3.8 per cent in the 1990s to 7.8 per cent in 2006-07.
II.62 Generally higher growth in revenues vis-a-vis a slower growth in expenditure resulted in marked improvement in financial performance of the business enterprises in last few years. The reform process has helped the corporate sector favourably for more efficient business activity. The corporate tax rate is steadily reduced from 45.0 per cent in 1992-93 to 30.0 per cent by 2005-06 and was kept stable thereafter. The peak custom duty on non-farm goods was reduced gradually from 150.0 per cent in 1991-92 to just 10.0 per cent in 2007-08. Effective monetary policy has contributed to the sustained moderation of inflation leading to a reduction in nominal interest rates and, therefore, the interest burden.
II.63 The strong growth in profits reflective of improved productivity, increased efficiency through increased application of technology and lower tax rates, enabled corporates to de-leverage their balance sheets resulting in the sharp decline in the debt-equity ratio. Financial restructuring of firms also led to the reduction in overall debt equity ratios. The substantial reduction in debt servicing costs thereby added to the corporate sector’s competitiveness and profitability. Notable feature of this improved performance of the corporate sector in the recent period has been the progressive increase in retained profits, which as a share of net profits (PAT) increased from 30.9 per cent in 2001-02 to 78.3 per cent in 2006-07. The private corporate sector has financed a large part of its investment in the on-going long capex cycle from such retained earnings. Strong financial performance translated into a more than doubling of the private corporate sector savings rate from 3.4 per cent in 2001-02 to 7.8 per cent in 2006-07.
Public Sector Savings
II .64 The trends in savings of the public sector in the country in terms of rates (of GDP at market prices), since 1950-51 are presented in the following Table 2.5. From this table, it can be seen that there has been a gradual increase in the savings of the Nom-Departmental Commercial Undertakings (NDCUs) over the years, since 1950-51. However, in the case of administrative departments, till 1980s, there has been positive savings, but since then the savings of these departments has been negative, although the dis-savings is reducing gradually following the FRBM Act. The savings of Departmental Commercial Undertakings (DCUs) has more or less stagnated at about 0.6 per cent over the years, although there were decreases and increases in between.
II .65 The estimates of savings from the public sector by its various entities, since 1999- 2000, year-wise, are presented in Table 2.6. There were some changes made in the procedure/ analysis of the economic transactions of the budget analysis in the current NAS series. One such major change is identification of capital expenditure incurred under object head“office expenses”. In consultation with the State Governments and central ministries, it has been given to understand that about 25 per cent of the total expenditure incurred under the head “office expenses” relates to purchase of machinery and equipment like photocopiers, ACs, furniture, Computers, etc. Due to this, the CSO included part of purchase of goods services into other capital outlay, machinery outlay and software outlay, which in turn, resulted in additional gross fixed capital formation from current expenditure of goods and services. The consequent changes are that there is decrease in the final consumption expenditure and increase in savings as well as GFCF of public sector.
II .66 The second major change made in analysis of budgets in the new series of national accounts (base year 1999-2000) is treatment of operating losses of the DCUs as imputed subsidies. The rationale behind is that the DCUs incur losses on account of administrative policies of the Government and the losses are met through the Governments’ current revenues. This treatment was only restricted to irrigation departments earlier, but in the new series it has been extended to all DCUs incurring losses.
Table 2.5: Rates of Savings (Percentage of GDP at market prices) |
Savings |
1950-51 |
1960-61 |
1970-71 |
1980-81 |
1990-91 |
1999-00 |
2006-07 |
1 |
2 |
3 |
4 |
5 |
6 |
7 |
8 |
Public Sector |
2.0 |
3.1 |
3.3 |
4.0 |
1.8 |
-0.8 |
3.2 |
Administrative Depts. |
1.9 |
2.7 |
1.8 |
2.6 |
-1.8 |
-5.1 |
-1.3 |
DCUs |
— |
— |
0.6 |
0.2 |
0.6 |
1.3 |
0.6 |
NDCUs |
0.1 |
0.4 |
0.9 |
1.3 |
2.9 |
3.0 |
4.0 |
Note: for 1950-51 and 1960-61, DCU part is included in Administrative Departments. |
Table 2.6: Estimates of Savings from Public Sector |
( Rs. in crore) |
Sl No. |
Item |
1999-00 |
2000-01 |
2001-02 |
2002-03 |
2003-04 |
2004-05 |
2005-06 |
2006-07 |
1 |
2 |
3 |
4 |
5 |
6 |
7 |
8 |
9 |
10 |
1 |
Gross Savings |
-15494 |
-36882 |
-46186 |
-15936 |
29521 |
68951 |
92263 |
133359 |
1.1 |
Admn. Depts. |
-102221 |
-118331 |
-141033 |
-132081 |
-103976 |
-85252 |
-73513 |
-61218 |
1.2 |
DCUs |
25540 |
17368 |
12732 |
13236 |
14414 |
16250 |
18732 |
24646 |
1.3 |
NDCUs |
58473 |
61148 |
78880 |
99337 |
115057 |
133511 |
142141 |
164524 |
1.4 |
Ouasi-Govt. |
2714 |
2933 |
3235 |
3572 |
4026 |
4442 |
4903 |
5407 |
2 |
C.F.C |
73701 |
77426 |
84367 |
89626 |
96758 |
108802 |
120101 |
130944 |
2.1 |
Admn. Depts |
17126 |
18106 |
19804 |
21321 |
22885 |
25896 |
28723 |
32361 |
2.2 |
DCUs |
16528 |
11845 |
12486 |
13072 |
14271 |
16395 |
17755 |
19005 |
2.3 |
NDCUs |
38113 |
45366 |
49749 |
52700 |
56812 |
63378 |
70110 |
75684 |
2.4 |
Ouasi-Govt. |
1934 |
2109 |
2328 |
2533 |
2790 |
3133 |
3513 |
3894 |
3 |
Net Savings |
-89195 |
-114308 |
-130553 |
-105562 |
-67237 |
-39851 |
-27838 |
2415 |
3.1 |
Admn. Depts |
-119347 |
-136437 |
-160837 |
-153402 |
-126861 |
-111148 |
-102236 |
-93579 |
3.2 |
DCUs |
9012 |
5523 |
246 |
164 |
143 |
-145 |
977 |
5641 |
3.3 |
NDCUs |
20360 |
15782 |
29131 |
46637 |
58245 |
70133 |
72031 |
88840 |
3.4 |
Ouasi-Govt. |
780 |
824 |
907 |
1039 |
1236 |
1309 |
1390 |
1513 |
II.67 The role of public sector in propping up the domestic savings of the Indian economy, however, declined since the 1970s. The share of the public sector in gross savings of the country declined to 19.9 per cent in the 1980s, which further went down to 9.6 per cent in the mid-1990s. The public sector savings, however, turned negative for the first time in 1998-99. This declining trend continued for five years till 2002-03, after which the public sector savings become positive. Since 2003-04, the public sector savings have turned positive.
II.68 As per the sources of public sector savings, it is found that Government Administration accounted for a bulk of the savings in the 1970s – accounting for nearly 60 per cent of gross savings. However, the savings of Government Administration received a setback in the 1980s and since the 1990s, they have turned into huge dis-savings, which, in turn has led to declining savings in the public sector.
II.69 However, in the last two decades or so, a rise in the savings of the non-departmental enterprises has been instrumental in keeping the public sector savings positive except during 1998-99 to 2002-03, when huge dis-savings of Government Administration led to negative public sector savings. While the savings of the departmental enterprises have broadly remained lower.
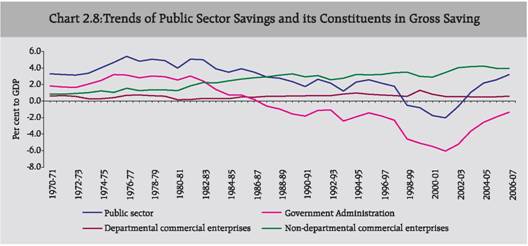
II.70 The savings of the Government Administration had been positive since the 1970s, but it turned negative since 1987-88. What led to this? Possibly, fiscal profligacy in the late 1980s was responsible for this. On examination of the trends in revenue deficit, it is observed that it also started worsening from the year 1987-88. Trends in revenue deficit and savings of the Government Departments reveal that the dis-savings of the Government Administration were reflected in the rising revenue deficit (Chart 2.8). A rise in revenue deficit led to the widening of the dis-savings of the Government Administration departments.
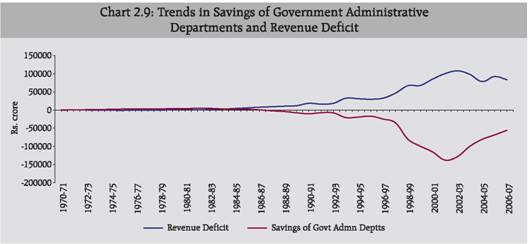
 II.71 The dis-savings of the Government Administration further worsened since the mid-1990s till 2001-02. This could have also been on account of the implementation of the Fifth Pay Commission award during 1997-98, which revised up the salaries of Government employees, which enhanced the Government expenses by about Rs.17,000 crore (Chart 2.9).
II.72 In the recent years in India, however, efforts at fiscal consolidation has led to the buoyancy in the revenues following revenue augmenting strategy encompassing moderation in tax rates, broadening the tax base, removal of exemptions, and some improvement in tax administration. This has led to improvement on revenue deficit since 2003-04. The trend is also reflected in the dis-savings of the Government Administration, which has also declined.
 II.73 Since the year 1983-84, the savings of non-departmental undertakings has become the major component of public sector savings.
II.74 Much before the public sector savings turned negative in 1998-99, the savings ratio of Government Administration turned negative much earlier in 1986-87. It is the non-departmental enterprises’ (NDEs) savings that has kept the public sector savings positive for over a decade.
II.75 The savings of the NDEs have seen a consistent improvement on account of improvement in the functioning of the public sector enterprises (PSEs). They have exhibited continued and steady improvement in their commercial functioning since the early 1990s. Consequently, since 2003-04 onwards, total public savings have turned positive again.
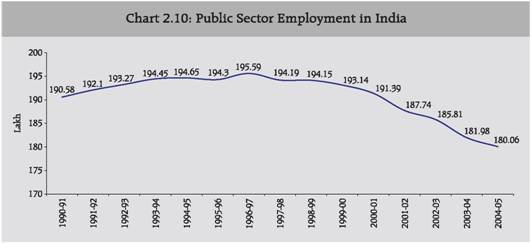
II.76 The improvement in the functioning of the PSEs is on account of the following two factors, which led to improvement in the savings of the NDEs. First, the public sector enterprises have benefitted from the autonomy given to them since the mid-1990s. In July 1997, the Government identified nine PSEs viz., BHEL, BPCL, HPCL, IOC, IPCL, NTPC, ONGC, SAIL and VSNL as Navratnas to turn these firms into global giants. This Navratna status granted of autonomy to the Boards of these PSEs. Second, there has been a decline in employment in the PSEs, which has led to improvement in the efficiency of operation of the PSEs. The employment in the public sector had been rising on a secular basis till the mid-1990s. Public sector employment reached a peak of 19.6 million in 1996-97 and since then, however, it has been declining (Chart 2.10). The public sector employment declined from 19.6 million in 1996-97 to 18.0 million in 2004-05, which represents a decline of about 8.2 per cent.
 Public Sector Savings - Data Related Issues
II .77 The present savings estimates of the public sector broadly reflect the broad set of changes that occur in the economy. For instance, a rising revenue deficit leads to either lower/decline in public sector savings, which is clearly reflected in the available savings estimates. Besides, the declining public sector employment leading to reduction in wage cost, which has led to some improvement in savings estimates for Government Administration.
- The savings estimates for the public sector are arrived at using the budget documents/ reports and audited accounts of public enterprises and, therefore, the public sector savings estimates are reasonably accurate and consistent.
- Besides, since the public sector falls within the organised sector, there are very few adjustments made to arrive at public sector savings data and, thus, the estimates are reliable.
Nonetheless, there is a need to improve the quality of savings estimates of the public sector by taking on board the related data from the local authorities and quasi-Government bodies, which might further refine the savings estimates of the public sector.
Investment
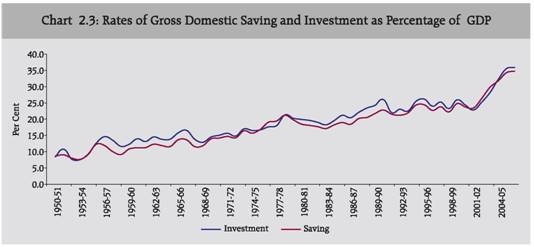
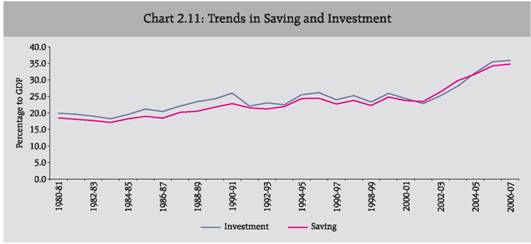
II .78 Indian economy being trapped in ‘low level equilibrium trap’ during the 1950s with subsistence level of economic activities and lack of industrialisation implied that the savings would be perpetually low for some years resulting in very small level of gross fixed capital formation (investment) in the country. Gross domestic savings have increased continuously from an average of 9.6 per cent of GDP during the 1950s to almost 35 per cent of GDP at present; over the same period, the domestic investment rate has also increased continuously from 11.2 per cent in the 1950s to close to 36 per cent by 2006-07 (Chart 2.11 and Table 2.2). A very significant feature of these trends in savings and investment rates is that Indian economic growth has been financed predominantly by domestic savings. The recourse to foreign savings – equivalently, current account deficit – has been rather modest in the Indian growth process.
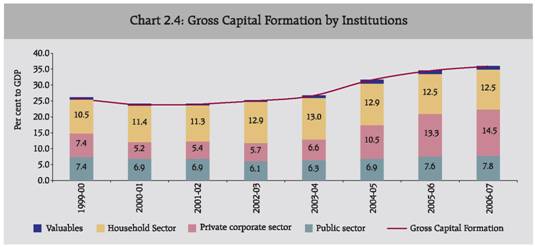
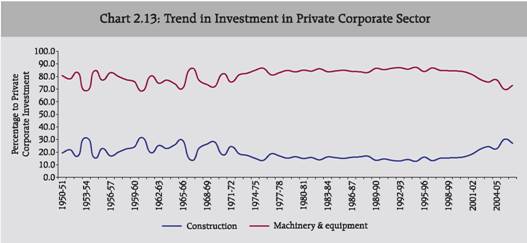
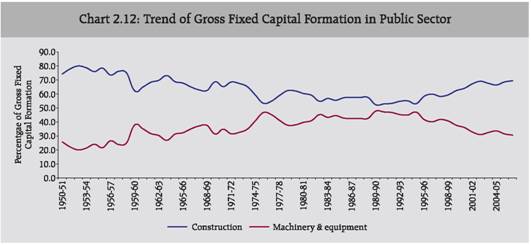 II.79 The dominant mode of investment for public and household sectors remained the construction activities with some variations over the years. The investment trends for public sector witnessed secular deterioration in the share of construction over years, while the share of machinery and equipment picked up over the same period (Chart 2.12). However, after reforms the trends have reversed with construction share rising and share of machinery and equipment falling. For private corporate sector dominant share for investment remained machinery & equipment over the years (Chart 2.13).
II.80 The increase in the rate of capital formation between the middle of the 1950s and in the middle of the 1960s was mainly in the public sector. This was on account of adoption of industrialisation in a big way by huge investments in Public sector undertakings since second plan onwards. The savings mobilised in the economy was invested by the Government in setting various projects. During this period (which coincided with the Second and Third Plans) inflows of foreign savings were considerable, ranging from 2 to 4 per cent of GDP. Since the early 1960s there has been some decline in the rate of capital formation in the private corporate sector, but this has been more than compensated for by increase in the household sector.
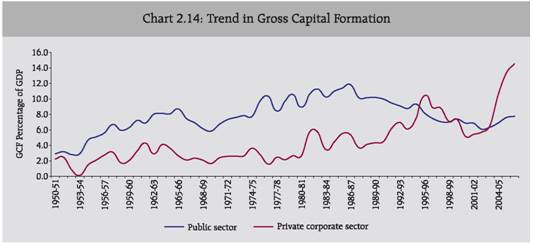
 II.81 The adoption of mixed economy after independence implied that the dominant source of investment would be public sectors with private sector playing only supportive role. The reliance on public sector for rapid industrialisation was mainly on account of absence of mature private corporate sector. The investment remained predominantly in the sphere of public sector. However, economic reforms have reversed this trend with private corporate sector overtaking the public sector in realm of investment in the economy since 1994-95 (Chart 2.14).
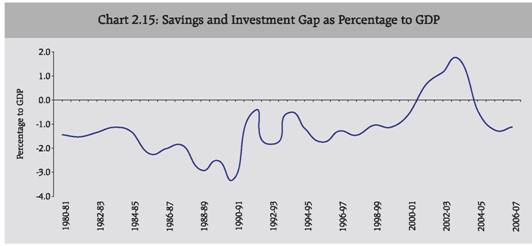
II.82 The long-term upward trends in savings and investment have been interspersed with phases of stagnation. In particular, during the 1980s, the inability of Government revenues to keep pace with the growing expenditure resulted in widening of the overall resource gap. Accordingly, the public sector savings investment gap, which averaged (-) 3.7 per cent of GDP during the period 1950-51 to 1979-80, widened sharply during the 1980s culminating in a high of (-) 8.2 per cent of GDP in 1990-91 (Chart 2.15). The resultant higher borrowing requirements of the public sector led the Government to tap financial surpluses of the household sector through enhanced statutory pre-emption from financial intermediaries at below market clearing interest rates. As fiscal deficits widened, periodic increases in the statutory liquidity ratio (SLR) were resorted to finance the rising fiscal gap, indicative of the financial repression regime in place.
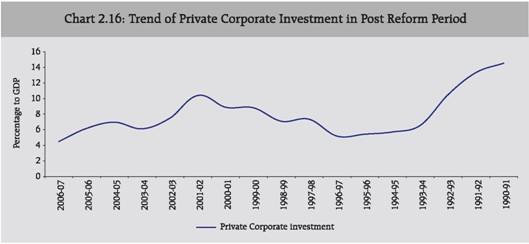
 II.83 The 1991 brought a break from planning era with economic reforms ushering structural changes in the economy. The investment trends since then have been impacted by the various changes brought in the economy. The success of structural adjustment programme (SAP) reform in bringing out a sustainable recovery in economic activity in the economy depended crucially on the behaviour of investment in the aftermath of the reform process. Since the expansion of public investment is usually constrained as a part of fiscal austerity measures embodied in SAP reform, the required recovery of investment came largely from the private sector. Investment by private corporate sector plays a significant role in sustaining the industrial growth of an economy. The economic reforms in the 1990s had a significant impact on the Indian economy. At a generic level, the reforms played a facilitative role and created a competitive environment for Indian’ companies. Industrial de-licensing provided flexibility to firms in investment decisions. This led to a surge in private investment.
II.84 Since the early 1990s, growth impulses appeared to have gathered further momentum in the aftermath of comprehensive reforms encompassing the various sectors of the economy. There was some loss of the growth momentum in the latter half of the 1990s, which coincided with the onset of the East Asian financial crisis, setbacks to the fiscal correction process, quality of fiscal adjustment, slowdown in agriculture growth affected by lower than normal monsoon years, and some slackening in the pace of structural reforms. The slowdown could also be attributed to the excessive enthusiasm and optimism in regard to investment plans in domestic industry following deregulation, which was followed by significant problems experienced in viability and competitiveness. The investment during this period remained more or less stagnant with income growth being also moderate. Thus, during the 1990s the average economic growth was moderate and the investment improved only marginally over the 1980s rates.
II.85 An important structural change in the investment behaviour of the economy in the recent past is the change in relative shares of public and private investment. Years of reforms has marked a significant break from previous trends in terms of increasing investment with major role being played by private corporate sector in last five years. The investment (gross capital formation) has increased sharply from 24.2 per cent of GDP in 2001-02 to 36.0 per cent during 2006-07 i.e., increase of 11.8 percentage point within five years (Table 2.7).
II.86 In the same period, the investment in private corporate sector trebled from 5.4 to 14.5 per cent of GDP, thus, accounting for the overall increase in investment in the economy (Chart 2.16). The rapid increase in private sector investment in the aggregate investment is in large part a reflection of the impact of the reforms initiated in the 1990s, which reduced restrictions on private investment and created a more favourable investment climate. It reflects the fact that the private sector has responded positively with an improvement in the investment climate. The reduced requirement by the centre for meeting budgetary mismatches, and for overall public sector financing has improved the availability of resources for the private sector considerably. Furthermore, the corporate sector has responded to increased global competition by improving its productivity and efficiency through increased application of technology. The economic reform process has helped greatly in making the policy environment more conducive for more efficient entrepreneurial activity.
Table 2.7: Trends in Investment in Post-Reform Era |
(As Percentage of GDP) |
| |
1990-91 1994-95 |
1995-96 1999-00 |
2000-01 |
2001-02 |
2002-03 |
2003-04 |
2004-05 |
2005-06 |
2006-07 |
1 |
2 |
3 |
4 |
5 |
6 |
7 |
8 |
9 |
10 |
Gross Capital Formation |
22.9 |
23.4 |
24.2 |
24.2 |
25.2 |
26.8 |
31.6 |
34.5 |
36.0 |
Public Sector |
9.3 |
9.0 |
6.9 |
6.9 |
6.1 |
6.3 |
6.9 |
7.6 |
7.8 |
Private Corporate Sector |
6.3 |
7.4 |
5.2 |
5.4 |
5.7 |
6.6 |
10.5 |
13.3 |
14.5 |
Household Sector |
7.3 |
7.0 |
11.4 |
11.3 |
12.9 |
13.0 |
12.9 |
12.5 |
12.5 |
Valuables |
0.0 |
0.0 |
0.7 |
0.6 |
0.6 |
0.9 |
1.3 |
1.2 |
1.2 |
Errors & Omissions |
0.9 |
0.7 |
0.2 |
-1.3 |
0.0 |
1.4 |
0.6 |
1.0 |
-0.1 |
 II.87 From the long-term perspective, it is interesting to observe that the rate of savings of the private corporate sector has increased from around 1 per cent in the 1950s, 1.7 per cent in the 1980s and 3.8 per cent in the 1990s, to almost 8 per cent at present. Higher retained profits along with availability of resources from the banking sector facilitated by the lower financing requirement of the Government and the increased access to the domestic and international capital markets led to a sharp increase in the investment rate of the corporates.
Inadequacies in Investment Estimates
-
The turnaround in public sector savings in recent years has not reflected corresponding improvement in public sector investment levels (Table 2.8). The public sector investment estimates might be underestimated particularly with reference to defence capital expenditures, local bodies and autonomous Government institutions.
-
One of the aspects of the estimates of savings and investment in India is the discrepancy in the estimates of GDS and gross domestic capital formation (GDCF). While the Raj Committee categorically mentioned that no adjustments be made to the estimates of capital formation on account of the ‘errors and omissions’, the Chelliah Group believed that GDCF estimates are subject to errors in several respects, and methodologies need to be, therefore, improved. The savings in the form of physical assets of the household sector being a part of the estimate of capital formation of the economy, would reflect the errors which creep in the estimates of total capital formation in the economy.
-
Non availability of current and reliable data on output of capital goods in respect of unregistered manufacturing sector, which is essential in the estimation of capital formation for the entire economy through the commodity-flow approach.
-
Lack of annual enterprise surveys and reliable data from benchmark enterprise surveys in respect of expenditures made by various industries on acquiring capital goods, as also on inventories, which is essential for industry-wise and State-wise estimates of capital formation.
Table 2.8: Public Sector Savings and Investment |
(As Percentage of GDP) |
| |
Public sector savings |
Public sector investment |
1 |
2 |
3 |
2001-02 |
-2.0 |
6.9 |
2002-03 |
-0.6 |
6.1 |
2003-04 |
1.1 |
6.3 |
2004-05 |
2.2 |
6.9 |
2005-06 |
2.6 |
7.6 |
2006-07 |
3.2 |
7.8 |
-
While estimating the fixed capital formation by the ‘Commodity Flow Method’, a number of rates and ratios are being used in absence of direct data. Some of these rates and ratios are based on old surveys or studies, while some of them are updated using the data available from Input Output Tables at the time of revising the base year of national accounts series.
-
The estimates in respect of local authorities are not based on actual annual expenditure data. The estimates relating to Quasi-Government bodies are prepared using the workforce estimates and the estimated value added per worker obtained from the annual reports of the research and scientific institutions. There is a need, therefore, to improve the quality of estimates of public sector with regard to local authorities and quasi-Government bodies, as also the emerging PPPs and SPVs.
-
There is under-coverage of the private corporate sector in the analysis in respect of new companies under setting up, besides the large time-lag in the availability of detailed results from the NABARD on cooperative sector. The under-coverage of capital formation in the public and private corporate sectors gets reflected in the household sector, as they are derived as residual from the overall estimates of capital formation, which are compiled through the commodity flow approach.
-
A number of ratios and norms are used in the preparation of estimates of capital formation for the economy as a whole. Some of these ratios are based on very old norms and may not be appropriate in the current economic scenario.
-
The estimates of capital formation by type of assets suffer from limitation. The proportions used for estimating the production of capital goods out of partly capital goods and part of capital goods are based on data on household durable goods as obtained from NSS survey results.
-
Estimates of GFCF by industry of use are prepared mainly following expenditure approach. A critical evaluation of the estimates in the context of data base shows that for a large percentage share of the aggregate capital formation (about 70 per cent) originating in organised industry groups like registered manufacturing, electricity, gas, railways and public administration sector etc in public sector, the estimates are based on direct annual data. For the remaining sectors (namely, private corporate and household sectors) the estimates are based on either benchmark estimates or analysis of balance sheets of selected companies in the corporate sector which leads. The estimates for some of these industry activities where private share is dominant, therefore, need to be based on more satisfactory information and current data in order to improve their reliability.
A Summary of HLC’s Observations
II.a Despite the fact that the NAS provide a consistent and coherent set of macro-economic accounts, often interpretational issues arise while analysing these data. The following points can be made in regard to the interpretational significance of the savings and investment estimates:
II.b Contribution-wise, with regard to the generation of savings, the major drivers are household sector, corporate sector and public sector in that order and for investment; they are corporate sector, household sector and public sector. While households have traditionally remained major savings sector in Indian economy reinforced by demographic dividends in turn reflecting lower dependency, of late corporate savings have emerged as savings generator responding inter alia to robust sales and corporate profitability with the economy on a high growth trajectory recently. Cross-country differences in the evolution of gross corporate savings over the past half decade have tended to reflect to a large extent those of the gross operating surplus, which in turn are likely to be due to countries’ exposure to global factors (accelerated globalisation and technological progress), presumably depending on institutional framework conditions (such as product and labour market regulations), as well as the sectoral composition of their economies. With Indian economy being increasingly gloabalised, the interplay of domestic and external factors in enhancing corporate savings can be envisaged. Within the public sector, the sources of savings are characterised by certain differential performance with the Government Administration being on a consistent deficit mode since the 1990s and the non-Departmental enterprises and Departmental enterprises in that order compensating by way of positive savings reflective of their steady improvement in commercial functioning. Significantly, these changes are occurring when the economy remained on a high growth trajectory in the last five years.
II.c As highlighted in the aforementioned paras, there are limitations in the estimation of savings and investment at the level of each of the institutional sectors. This is understandable given the predominance of unorganised sector in India. Even for the organised sectors, analysts have pointed out the data gaps and quality issues for those data that are available. Interpretational issues have, thus, remained endemic to the savings and investment estimates, surfacing from time to time leading thereby to formation of Committees to address these concerns.
II.d A point mentioned in the past Committees regarding correct interpretation and a clear understanding of the available estimates of domestic savings and capital formation, it is essential to first keep in mind the various data sources used and the current methodology of estimation of savings and the capital formation. In doing so, it would be possible to indicate the areas where errors in estimation could arise.
II.e Interpretational issues with regard to estimates of savings and investment are important to be assessed from time to time, as is the practice so far in India. In this connection, it is desirable to develop alternative data bases for these estimates for the constituent sectors so that savings estimates could be cross-validated with the help of appropriate alternative data bases, methodologies and surveys.
II.f Notwithstanding the limitations, which are well accepted, the HLC observes that the existing methodology for estimation of savings has broadly captured the changes that are taking place in the economy in general and various sectors like the household, corporate and public sectors in particular. The estimates are reasonably reliable reflective of the trends in the economy. The estimates may be reasonably reliable on account of the following factors:
-
To the extent increase in GDS is spread across all constituent sectors, the improvement in the GDS rate in the recent decades is essentially a reflection of the fundamental transformation of the structure of the economy. The rise during 2000s simultaneous with the buoyant growth performance corroborates the positive cycle of growth, savings and investment, such that as growth enhances savings, which in turn further enhances growth. The rise in savings rates in India appears to be mainly structural and one can expect savings rates to increase further with rising income and declining dependency ratio.
-
A look at the time series of ‘errors and omissions’ relative to GDP indicates that the magnitude of this item is narrowing over time which is a welcome development.
-
Seen vis-à-vis the efficiency of capital use (ICOR) trends, there is a clear movement downwards, which has enabled the same dose of capital formation leading to higher GDP growth contributed to a larger extent by services sector which is less capital intensive in nature. It may be mentioned that at the economy level, the ICOR has decreased to 4.2 during the Tenth Five Year Plan period as compared to 4.5 during the Ninth Five Year Plan.
II.g The savings and investment estimates are crucial in the decision making and planning process. They are used to compile incremental capital-output ratios (ICORs). The ICOR is a summary measure of the productivity of investment in the economy or the output generating capacity of incremental capital (ICOR = (capital employed - previous year capital employed) / (value of output - previous year value of output)). That is, the ratio of incremental capital to incremental output or the amount of incremental capital that goes to generate one unit of incremental output. The recent increases in the savings and investment rates indicate to some extent the lowering of the ICORs. As in the case of aggregates which hide inherent deficiencies at the detailed industry levels, the data on industry-wise deployment of capital formation is crucial in further identifying the key sectors of the economy, data on which are currently provided through national accounts statistics.
II.h Increasing evidences of a rise in efficiency in the economy is seen by the declining share of inputs - final use of commodities and services in gross value added (GVA). The share of inputs in the gross value added has come down to 49.7 per cent in 2003-04 as compared to 60.3 per cent in 1968-69.
II.i Another issue that has come into focus in the recent literature was that if the corporate sector’s savings is going up, the household sector’s savings would come down, to the extent
Table 2.9: Shares of Unincorporated and Incorporated Sectors in Gross Domestic Savings |
(Per cent) |
| |
1950-51 to 1959-60 |
1960-61 to 1969-70 |
1970-71 to 1979-80 |
1980-81 to 1989-90 |
1990-91 to 1999-00 |
2000-01 |
2001-02 |
2002-03 |
2003-04 |
2004-05 |
2005-06 |
2006-07 |
1 |
2 |
3 |
4 |
5 |
6 |
7 |
8 |
9 |
10 |
11 |
12 |
13 |
Unincorporated (Households) |
68.2 |
61.7 |
66.5 |
71.0 |
77.0 |
91.1 |
94.3 |
87.8 |
81.7 |
72.5 |
70.6 |
68.4 |
Incorporated |
31.8 |
38.3 |
33.5 |
29.0 |
23.0 |
8.9 |
5.7 |
12.2 |
18.3 |
27.5 |
29.4 |
31.6 |
a) Public |
21.4 |
26.3 |
24.3 |
19.9 |
6.7 |
-7.4 |
-8.6 |
-2.5 |
3.6 |
6.9 |
7.5 |
9.3 |
b) Private Corporate |
10.4 |
12.0 |
9.1 |
9.2 |
16.3 |
16.2 |
14.4 |
14.6 |
14.7 |
20.6 |
21.9 |
22.4 |
Gross Domestic savings |
100 |
100 |
100 |
100 |
100 |
100 |
100 |
100 |
100 |
100 |
100 |
100 |
Source: Central Statistical Organisation. |
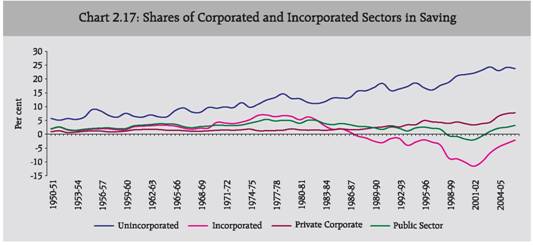
that unincorporated entities, constituting a part of the household sector, get incorporated and such savings are reflected as corporate savings. An examination of the data since the 1950s shows a declining trend in the share of unincorporated sector. If this trend continues, as to be expected, the share of household savings as a percentage of GDP may decline correspondingly with a rise in corporate sector savings (Table 2.9 and Chart 2.17).
II.j In sum, the interpretational issues with regard to estimates of savings and investment are important to be assessed from time to time, as is the practice so far in India. In this connection, it is desirable to develop alternative data bases for these estimates for the constituent sectors so that savings estimates could be cross-validated with the help of appropriate alternative data bases, methodologies and surveys. In the absence of income-expenditure survey of households and household enterprises, there is no direct estimation of household savings and as a result, there is no cross validation of the indirect (residual) estimates of savings at present which is expected to be taken up in due course enabling cross-validation of savings of the predominant household sector. With regard to private corporate sector and the public sector, the issues of inadequate data coverage and local bodies and autonomous Government institutions, respectively, are the weak areas that need to be resolved.
 Chapter III : Broad Approach adopted by the Committee
III.1 The approach adopted by the HLC in addressing various ToRs is distinctly different than those of the earlier Committees appointed to review the estimation of savings and investment. Unlike the approach followed by the past two Committees, namely Raj and Chelliah Committees, keeping in view the relatively large number of ToRs assigned to it and the intricacies involved in the estimational issues of savings and investment, the HLC set up four Sub-Committees for examining the estimational issues pertaining to the savings of the household sector, private corporate sector, public sector and one Sub-Committee for investment. The approach followed by the HLC is briefly explained below.
III.2 At the outset, the HLC examined the existing methodology adopted to estimate the savings and investment and whether household savings estimates can be based on any other alternative methodology. Perhaps this is first such attempt by any formal committee. It was recognised that the present method needs to be strengthened though updation of various rates and ratios and development of alternative data base for constant cross-validation of the estimates. Accordingly, a ‘Worksheet Approach’ was followed, wherein each and every component of financial savings in the financial savings worksheet was examined with respect to data base, data quality and methodology. A comprehensive review of the rates and ratios used in the estimation procedure was undertaken.
III.3 Secondly, keeping in view the number of rates and ratios underlying the present estimation procedure, the HLC sought the involvement of apex financial bodies for the different financial instruments as well as sectors, which provide the required data for estimation of savings and investment. This is also a maiden effort, which is expected to enable development of alternative databases for robust estimation of savings estimates and also enable alignment of the present procedures to the procedures as laid down in the National Accounts - ‘Sources and Methods, 2007’ of the CSO.
III.4 Thirdly, an effort was made for the first time to involve and elicit the views of the NSSO on the possibility of introducing a comprehensive Survey of Income and Expenditure of the household sector. Although the reference to estimate savings by direct method through a comprehensive income-expenditure household survey was made in the earlier Committees’ Reports, there was no progress on that front. The NSSO has agreed in principle to undertake such a Survey for the households initially with a pilot survey on the basis of its interaction with the HLC. When undertaken and stabilised, such a survey is expected to provide an alternative database for direct estimation of household savings, which can be cross-validated with the present estimates.
III.5 In sum, the principal approach adopted by the HLC was to examine in detail the conceptual aspects of the estimates of savings and investment and refine the procedure by eliminating the data gaps and thereby improving the data quality. Efforts were directed at strengthening the databases presently used for estimation of savings and investment. It was felt useful to involve the apex financial bodies and NSSO for development of appropriate alternatives, which could achieve eventually the desired level of accuracy at disaggregated and sectoral level.
Brief Description of the Deliberations in the HLC Meetings
III.6 The first meeting of the HLC on Estimation of Savings and Investments was held on January 24, 2008 at RBI, New Delhi. The Chairman, Dr. C. Rangarajan, in his opening remarks explained that recently, a sharp increase has been observed in the savings and investment estimates and, therefore, they require a fresh look. At the present juncture, the issues related to methodology, nature and procedure of data collection and accuracy of collected data require critical examination. In the process of estimation, the blow-up factors or ‘Rates and Ratios’ currently used require to be examined afresh in the light of evolving developments. It was, thus, decided that the Committee has to examine three aspects of Savings and Investment estimates, viz., (a) methodology; (b) procedure of data collection and identification of data gaps; and (c) validation of the data. In order to accomplish the task assigned to the Committee, it was decided to set-up four Sub-Committees that would critically examine these aspects for each of the three sectors for savings estimates and the fourth that of capital formations. The Sub-Committees were advised to report to the HLC, after due deliberations. The SubCommittees constituted were namely, Sub-Committee on Household Sector Savings, SubCommittee on Private Corporate Sector Savings, Sub-Committee on Public Sector Savings and Sub-Committee on Investment.
III.7 In the second meeting of the HLC held on April 18, 2008 the Committee discussed the draft reports submitted by the Sub-Committee on Household Sector and Sub-Committee on Private Corporate Sector. In this context, HLC had broadly agreed with the major recommendations made by the two Sub-Committees and suggested improvements in certain areas. The HLC’s discussions focused on the “worksheet” approach adopted by the SubCommittee on Household Sector, wherein each and every constituent items for household sector’s financial savings compilation was examined with respect to (a) sources of data and the underlying conceptual issues (focusing mainly on Raj Committee, Chelliah Committee, National Statistical Commission Reports wherever applicable), (b) methodology adopted for each of the parameter along with the limitations and problems, (c) prescribed procedure for estimation, (d) procedure followed in practice, (e) deviations and constraints in practice, and (f) lacunae identified in data and methodology. In this meeting, it was felt essential to involve the Apex Financial Bodies for developing an alternative database and facilitating cross-validation of the present estimation. Accordingly, it was explained that the Sub-Committee on household sector had a separate meeting with the apex financial bodies namely, SEBI, IRDA, NABARD and NHB, which were invited for an interface with the Sub-Committee on Household Sector Savings for supply of authentic, appropriate and timely data on the household financial savings instruments that come under their regulatory purview. The representatives from the apex financial bodies agreed in-principle to provide regular information, henceforth, to the RBI as per the format to be provided by the RBI.
III.8 As regards the Report of the Sub-Committee on Private Corporate Sector Savings, it was explained that four inter-related topics: (i) making a critical review of present methodology; (ii) assessing the available databases in terms of scope, definitional issues, coverage of sub-sectors and coverage of companies/entities under each sub-sector; (iii) suggesting alternative methodology; and (iv) identifying data-gaps and proposing a framework for improving data quality and timely collection of data were undertaken by them. In this meeting the HLC deliberated on the issue of treatment of ‘marked-to-market’ also. However, conceptual understanding on integrating ‘marked-to-market’ concept in estimating corporate savings is not traceable in existing literature and also there is hardly any cross-country experience available. The Sub-Committee felt that it might not be a right time to explore the issue, though future research may be undertaken to address the issue.
III.9 On the issue of methodology adopted to estimate corporate sector savings, it was explained to the HLC that the Sub-Committee reviewed the existing methodology of estimating savings of the entire sector using estimates obtained from samples. It was further explained that availability of representative samples and suitable auxiliary variables for blowing-up the sample estimates to the savings for the entire sector were two important inputs in the present method. Though this method is conceptually appealing, the estimates could suffer from low precision if samples lack representativeness of the sector and/or the auxiliary variable shares a non-proportional or poor relationship with target variable savings. Thus, review of existing methodology addressed two issues, namely, (i) representativeness and coverage of database used at present in estimating savings for the entire private corporate sector; and (ii) suitability of auxiliary variable used in the current blowing-up mechanism. The Sub-Committee felt that much of the problem could be sorted out had the data coverage been adequately large. In this context, the Sub-Committee examined the usefulness of MCA21 database, a new corporate database being collected online by the Ministry of Corporate Affairs (MCA) that features fairly large coverage. Accordingly, the Sub-Committee first assessed the consistency and comparability of the relevant data fields being reported in MCA21 with the corresponding data in company’s annual accounts available with RBI for some common set of nonGovernment financial and non-financial companies. Based on this exercise, the Sub-Committee enumerated further initiatives with regard to scope and definitions that might be undertaken to strengthen and improve the MCA21 database for the purpose of estimating savings for the corporate sector. The Sub-Committee also deliberated upon the features of the recent global initiatives of eXtensible Business Reporting Language (XBRL) and examined whether this platform would further improve and strengthen the required corporate databases for estimating savings of the corporate sector of the economy.
III.10 The third meeting of the HLC was held on July 17, 2008 at RBI, New Delhi under the Chairmanship of Dr. C. Rangarajan to consider the draft reports of the Sub-Committees on Public Sector Savings and Capital Formation. The Chairman remarked that while public sector savings were based on sound data sources like budget documents and annual reports of public enterprises, the estimates of investment are based on indirect approaches and use of a number of rates and ratios.
III.11 In the meeting, the following issues were deliberated with respect to the Report on the Public Sector Savings: (i) the discrepancy between the revenue deficit shown in the budget documents of Centre and States and that of the savings of the public authorities shown by the CSO is, to some extent, due to non-inclusion of local bodies in the budget documents; (ii) on the capital transfers made by the Centre and States, a separate table may be included in the Report showing the capital transfers made to the Quasi Government bodies; (iii) treatment of defence capital outlay; (iv) the issue of capital formation made by the public-private- partnerships (PPP) and Special Purpose Vehicles (SPV). It was observed that the problem in accounting for the investment made by these entities is similar to that of companies under construction, the HLC recommends that the CSO may try to collect information on these PPP/SPVs through nodal agencies and send the same to the RBI for analysis and compilation of estimates of savings and capital formation.
III.12 The fourth meeting of HLC on Estimation of Savings and Investment was held on October 7, 2008 at RBI, New Delhi under the Chairmanship of Dr. C. Rangarajan to consider the draft report of the Sub-Committee on Capital Formation. In the meeting, Chairman remarked that apart from the three estimates of capital formation that are being presented in the National Accounts Statistics, there is yet another estimate of savings from the income and outlay account. The Chairman enquired whether this estimate could be considered as an independent estimate of the other savings estimate being used in the estimation of gross capital formation; and also the difference between these two. Regarding the estimate of savings from the income-outlay account, it was explained that in the NAS, disposable income of the nation is estimated as sum of (i) GDP, (ii) net factor income from abroad and (iii) net current transfers from abroad. From this disposable income, if private final consumption expenditure (PFCE) and Government final consumption expenditure (GFCE) are subtracted, we arrive at a residual, which could be termed as an estimate of savings. However, since this estimate differs from the independent estimate of savings, the difference is shown as‘statistical discrepancy’ in the NAS. This is of the order of about 1.0 per cent of GDP at present. Normally, this discrepancy is attributed to PFCE, as the savings estimated in the NAS by institutions is treated as firmer estimate. In the meeting the following issues were also deliberated: (i) The issue of strengthening data base for capital formation; (ii) issue related to State level capital formation; (iii) the issue related to data on companies under construction; (iv) the issue of deteriorating quality of ASI data, particularly at the State level; (v) the issue of updation of rates and ratios, through alternative agencies like agro-economic research centres, etc. While the Sub-Committee for Capital Formation recommended that the estimates of capital formation arrived through three different methods are to be shown separately without any adjustments, the HLC observed that estimates of capital formation
arrived from the savings side could be treated as firmer estimates relative to estimates based on commodity flow/expenditure approach, as those estimates are based on a number of rates and ratios evolved from various ad hoc sources. It was, therefore, recommended that for operational convenience, only one figure of capital formation arrived at through savings route may be used for compiling rates of capital formation as is being done at present.
III.13 Further, there was also comprehensive discussion on the treatment of ‘valuables’ and ‘errors and omissions’. Regarding valuables, one point of view was that they were not contributing to the production process at all; therefore, should not be treated as capital formation. The other point of view was that ‘valuables’ were not treated either as intermediate consumption or as final consumption expenditure, therefore, should be part of gross capital formation, but outside the gross fixed capital formation, as they were not used in the production process and are kept as store of value. According to 1993 SNA, the data on expenditures made on net acquisition of valuables on precious items like gold has been included under Gross Capital Formation (GCF). It was decided that the present practice of showing net acquisition of valuables under GCF, as a separate category distinct from the Gross Fixed Capital Formation (GFCF) and Change in Stocks, may continue. There was also a detailed discussion on the issue of treatment of ‘errors and omissions’. It was decided that different independent estimates of capital formation as obtained by the commodity flow method and estimates of capital formation as obtained from the savings estimates and estimates of capital formation as obtained by the expenditure approach, should be presented as such. The issues of (i) arriving at pure household savings; (ii) examining the savings of farm sector in relation to investment; and (iii) basing savings estimates on marked to market basis were discussed in details. It was felt that at this juncture it is not possible to address these issues in the Report as no solution could be found with respect to these issues.
III.14 In the fifth meeting of the HLC at Chennai on November 20, 2008, the draft of the Report was discussed threadbare. Among the major issues discussed was the likely underestimation as per the current practice of household sector’s physical assets. It was agreed that this could be because of the fact that while household financial liabilities are increasing, the same is not reflected in the pace of expansion in the household physical assets. In this discussion, the Chairman stressed that the concept of ‘transferable savings’ is more relevant and in this context, it is useful to look at ‘gross financial savings’ and not ‘net financial savings’. As economic agents are living in an era of highly leveraged society and financial liabilities are important as the households borrow for a variety of purposes – both financial and physical investment, increased financial liabilities being a subtraction item lead to depressed net financial savings. Another issue discussed was that to be able to find out the estimates of savings for the different segments of the household sector (as per India’s national accounts framework), it is desirable that the survey of income and expenditure of ‘pure households (consumer households)’ needs to be taken up concurrently with the Enterprise Survey.
III.15 In the last meeting of the HLC held in New Delhi on December 24, 2008, the final
draft of the Report was discussed and adopted.
Chapter IV : An Overview of the Existing Methodology in Estimation of Savings and Investment
An Overview of the Existing Methodology
IV.1 The methodology currently adopted for estimating savings and investment are explained in the ‘Sources and Methods, 2007’ brought out by the Central Statistical Organisation (CSO). Savings represent the excess of current income over current expenditure. It is the balancing item of the income and outlay accounts (as per 1968 SNA) and use of disposable income account (as per 1993 SNA) of producing enterprises and households, Government administration and other final consumers. The concept emphasises the current nature of receipts and payments, thus, ruling out the inclusion of ‘flows out of past assets’ and ‘future liabilities’.
IV.2 For preparation of the estimates of domestic savings, the economy has been divided into three broad institutional sectors viz., (i) public sector, (ii) private corporate sector and (iii) household sector. The estimates of domestic savings are presently prepared only at current prices. The estimates at constant prices have not been attempted so far since the suitable procedure of estimation is yet to be evolved. In pursuance of the recommendations of the Working Group on Savings and Expert Group on Savings and Capital Formation, set up by the then Department of Statistics under the Chairmanship of Prof. K.N. Raj and Prof. Raja J. Chelliah, respectively, in 1981 and 1995, the CSO and RBI agreed on a uniform methodology and data base. It was decided that each agency would be responsible for compilation of estimates of specified sectors and supply the data to the other agency. Accordingly, the CSO now prepares the estimate of public sector and household savings in the form of physical assets, life funds, provident and pension funds, while the RBI is responsible for estimating the savings of the private corporate sector and that of the household sector in other instruments of financial savings. Thus, the estimates of gross domestic savings released by the two organisations are based on uniform methodology and same data sources. However, the two sets of estimates of gross domestic savings may differ slightly due to difference in timings of the release by the two organisations. The RBI normally releases its Annual Report in September i.e., three months before the release of the official estimates of national income and related aggregates based on the data available up to June end, whereas the estimates released by the CSO in the following January incorporate data supplied by the RBI and other agencies by December end.
IV.3 Public sector covers Government administration, departmental enterprises, quasi-Government bodies and non-departmental enterprises. The non-departmental enterprises comprise Government companies, statutory corporations and port trusts. Government administration & departmental enterprises: The gross savings of Government administration, quasi bodies and departmental enterprises is defined as the excess of current receipts over current expenditure. The current expenditure includes: (i) final consumption expenditure; (ii) interest on public debt; (iii) subsidies and (iv) current transfer, while the receipts comprise of (i) income from entrepreneurship and property; (ii) direct taxes; (iii) indirect taxes; and (iv) miscellaneous receipts. The Issue Department of the RBI, which is considered to be more akin to administrative activities of the Government, is also included here. The gross savings of the non-departmental enterprises including Banking Department of RBI is estimated from the results of the analysis of annual accounts of these companies and corporations. In the case of Life Insurance and UTI mutual funds, the savings arising out of life insurance business and management of funds respectively is included in the household sector.
IV.4 Private Corporate Sector comprises all non-Government financial/non-financial corporate enterprises, co-operative institutions and quasi corporate bodies. Non-Government non-financial enterprises include public and private limited companies registered as joint stock companies under the Companies Act, 1956. These include foreign direct investment companies as well. Non-Government financial institutions constitute all scheduled and non-scheduled commercial banks in the private sector, other financial and investment companies engaged in activities such as financing of hire-purchase, transactions in shares and commodities & financing of loans or investment in securities, housing finance companies and insurance companies. Co-operative institutions comprise all co-operative banks, cooperative credit and non-credit societies. Estimates of saving for the non-Government non-financial, financial and investment companies (excluding commercial banks) are prepared based on the analysis of balance sheets and profit and loss (P/L) accounts of select companies. Net saving is computed as retained profits adjusted for non-operating surplus/deficit. Retained profits are that proportion of total net profits that are ploughed back into business (either transferred to reserves or carried forward to balance sheet) and after making commitments to financial institutions (in the form of interest payments), Government (tax provisions), share-holders (dividend, etc.) and after making depreciation provision for various fixed assets. The savings of non-banking financial and investment companies is estimated on the basis of RBI studies on performance of financial and investment companies following the same procedure as relating to non-financial companies. The savings of private commercial banks is estimated as addition to the reserve funds. The transfers to reserve funds include net amount carried to reserves, depreciation provision, amount allocated for other special purposes and amount carried forward to next year’s account net of surplus/deficit of the previous year brought forward as available from the details of “Earnings and Expenses of Commercial Banks” published in the RBI’s ‘Statistical Tables Relating to Banks in India. Since the details of appropriation of profit are not available for the later years, the saving has been estimated on the basis of trend observed in the profit of these banks. In case of co-operative societies, data on statutory reserves/funds, bad debt reserves, and other reserves are available in the ‘Statistical Statements Relating to Co-operative Movement in India’. The gross savings is taken as the increase in statutory funds and other reserves/ funds. In the absence of relevant data, the estimates of savings are prepared on the basis of trends observed in the value added of banks and trade sector.
IV.5 The household sector comprises, apart from individuals, all non-Government, noncorporate enterprises like sole proprietorships and partnerships owned and/or controlled by individuals and non-profit institutions, which furnish educational, health, cultural, recreational and other social and community services to households. The savings of the household sector is taken as the sum of its investments in various instruments of financial savings and in the form of physical assets. Since direct annual data on household income expenditure are not available, the savings of the household sector is worked out by following the residual method except savings in the form of life insurance funds and provident & pension funds. The investment in financial savings comprises currency, net deposits, shares and debentures (including mutual funds), net claims on Government in the form of small savings, investment in Central and State Government securities, life insurance funds and provident & pension funds. Household savings in the form of currency is estimated as a residual by deducting the amount of currency held by the private corporate sector and public sector enterprises from the total currency with the public. The data on total currency with the public (i.e., notes in circulation plus circulation of Rupee Coins and Small Coins minus cash in hand with banks) for each year are available in the RBI Bulletin. On the question of cash in hand, the Advisory Committee on National Accounts in its meeting held in June 1987 had suggested that the present procedure of estimating the currency with the households by deducting from the total currency, the currency held by various institutional sectors may be examined. It had further suggested that a simple procedure of possibly taking a proportion of the total currency in circulation might serve the purpose. Accordingly, the RBI on the basis of past trends of currency holding of the households and non-households sectors, estimated this proportion to be around 0.93 of the ‘currency with public’, which has been used for estimating the currency holding of the households from 1985-86 onwards.
IV.6 Gross capital formation (GCF) refers to the aggregate of gross additions to fixed assets (i.e., fixed capital formation), increase in stocks of inventories, hereinafter referred to as change in stocks during a period of accounting and net acquisition of valuables. Broadly, two types of fixed assets namely construction and machinery and equipment (including transport equipment, software and breeding stock, draught animals, dairy cattle and the like) are covered. Construction for military purposes (other than construction or alteration of family dwellings for military personnel), defence equipments, durable goods in the hands of the households and increase in the stocks of defence materials are excluded from the scope of gross capital formation. However, capital outlays of defence enterprises on ordnance and clothing factories are included. Software which was earlier included in the machinery and equipment, is now segregated from machinery and equipment and shown as a separate item. Besides the above, a new category ‘valuables’ which covers the expenditures made on net acquisition of valuables, has been included for the first time in compilation of the gross capital formation in the New Series released with base year 1999-2000, in accordance with the recommendations of 1993 SNA.
IV.7 Construction activity covers all new constructions and major alterations and repairs of buildings, highways, streets, bridges, culverts, railroad beds, railroads, subways, airports, parking areas, dams, drainages, wells and other irrigation sources, water and power projects, communication systems such as telephone and telegraph lines, land reclamations, bunding and other land improvements, planting and cultivating new orchards (tea, coffee, rubber, mango, cashew nut, areca nut, coconut, citrus, grapes and Sapota plantations), afforestation projects, installation of wind energy systems etc.
IV.8 Machinery and equipments comprise all types of machineries like agricultural machinery, power generating machinery, manufacturing, transport equipment, furniture and furnishings. Also included are increments in livestock in respect of breeding stock, drought animals, dairy cattle and other animals raised for wool clippings. Additions to livestock other than the said fixed assets are accounted in change in stock estimates.
IV.9 The estimates of GCF for the economy as a whole include all relevant items of new capital goods which are produced domestically (exclusive of exports) and new and secondhand imported goods. According to SNA, imports should include the outlays in foreign countries of the embassies, consulates and other extra-territorial establishments of the Government of the given country on new fixed assets reduced by the net sales of their second-hand and scrapped assets. Similarly, the net outlays of foreign embassies, consulates and other diplomatic bodies located in a country, on fixed assets produced within the country are to be recorded in the exports and not in the gross fixed capital formation (GFCF) of the given country. The fixed capital outlays of international agencies located in the country are to be treated in an identical manner. Due to non-availability of data, it has not been possible to account for these. The estimation, therefore, follows the domestic concept, whereby, only additions made to stocks of fixed assets and inventories within the geographical boundary of the country have been taken into account. Accordingly, the GCF refers to gross domestic capital formation (GDCF).
IV.10 Additions to non-reproducible tangible assets such as land, mineral deposits and the natural growth of standing timber or crops have not been included in GCF. However, outlays on improvement of land and development or extension of mining sites, timber tracts and plantations are taken as part of capital formation. The outlays on incomplete construction works incurred during the period are included in the estimates of fixed assets.
IV.11 Inventories consist of materials and supplies, work-in-progress and finished products and goods in the possession of producers and dealers. Stocks of strategic materials, grains and other commodities of special importance to the nation in the possession of Government are also included in the estimates of change in stocks.
IV.12 The estimates of GFCF for the country are prepared both by type of assets viz., construction, machinery and equipment, software and by industry of use.
IV.13 The methodology adopted to estimate savings and investment as explained above can be summarised into the following four basic steps explaining the estimation procedure followed at present.
Basic Steps in Estimation of Savings and Investment
IV.14 Basic steps in estimation of savings and investment as per the existing methodology are summarised and given in Table 4.1 below:
IV.15 It is recognised that the estimates of savings suffer from a number of limitations, mainly from deficiency of data. This particularly refers to the estimates from the private corporate and the household sectors. Estimates for the private corporate sector are based on the analysis of the sample companies undertaken by the RBI and blown up on the basis of the ratio of paid up capital (PUC) of the sample companies to all companies. The PUC may not be appropriate for blowing up the sample estimates of savings, but in the absence of any other global indicator one has to use this indicator. Data on co-operative societies are not available for all the years. There is a time lag of four to five years. Estimates for the household sector are built up in two parts (i) savings in financial assets and (ii) savings in physical assets. In case of savings in financial assets the estimates of household savings in currency are estimated as 93 per cent of total currency on the basis of past trends of currency holding. This percentage may undergo a change as and when more data based on the survey results of the RBI become available. The estimates of provident fund of non-departmental enterprises are obtained by doubling the employers’ contribution as available in the books of accounts. No adjustments are made for withdrawals, interest etc., since the data on these items are not available. The non-Government educational institutions are being covered under the Employees Provident Fund Act, 1952 since 1981-82. However, the coverage of private educational institutions has been incomplete as many of these institutions are not making any returns to the Central Provident Fund Commissioners (CPFC). Thus, the estimates of PF can be improved only when the coverage of private educational institutions improves and reliable data on withdrawals, interest etc., in respect of Non-departmental enterprises becomes available. The results of RBI survey on Growth of Deposits with Non-banking Companies and Ownership of Capital of Joint Stock Companies are not available beyond 1995-96. Estimates in respect of most of the other financial assets are based on current data, though, they mainly refer to total savings under each of these categories and households, contributions are obtained as residuals. The households’ savings in physical assets is also estimated by using the residual approach. The residual approach adopted for deriving savings estimates for households is undoubtedly not very satisfactory in all cases and has enough scope for improvement. The only approach through which this can be achieved is by conducting independent household surveys to collect direct data on income and expenditures. Similarly, the coverage of public institutions is limited while estimating the public sector savings. The validity of ‘rates and ratios’ used in estimating the capital formation remain doubtful. Therefore, it is critical to periodically review the methodology used to estimating savings and investment.
Table 4.1 - Basic Steps in Estimation of Savings and Investment |
Investment |
Savings |
Step 1 |
Step 2 |
Step 3 |
Step 4 |
Unadjusted Estimates of Gross Capital Formation - According to Type of Assets* |
Estimates of Gross capital Formation - According to Sector* |
Estimates of Gross Domestic Savings |
Estimates of Gross Savings available for Domestic Capital Formation – (Firmer estimate of GCF) |
Construction |
Public Sector |
Gross Savings of the Public Sector |
Foreign Savings Inflow (Net capital inflow from abroad) - which is equivalent to current account balance, sign changed) Gross Savings of the Public Sector |
Machinery and Equipment |
Private Corporate Sector |
Gross Savings of the Private Corporate Sector |
Gross Savings of the Private Corporate Sector |
| |
Household Sector (residual) |
Savings of the Household Sector in the form of Net Addition to Financial Assets |
Savings of the Household Sector in the form of Net Addition to Financial Assets |
Change in Inventories |
Gross Savings of the Household Sector in the form of Physical Assets. |
Gross Savings of the Household Sector in the form of Physical Assets |
Valuables |
Valuables |
|
|
Errors and omissions
(+ or -) |
Note : * when “errors and omissions” (difference between Step 4 and Step 1) is added, the estimate is termed as “adjusted gross capital formation”. |
Select Country Practices in Estimation of Savings and Investment
IV.16 It is well known that the estimation of savings and investment is a complex exercise, particularly because savings is not a directly measurable macroeconomic variable and that it has to taken as an aggregation of the constituent sectors (Table 4.2) and that within the constituent sectors household sector is characterized by heterogeneity in its composition (Table 4.3). The national accounts define this aggregate as a balance. More precisely, savings is the balance item of the “Use of income account”. Income and expenditure are calculated from different data sources. Because household income and household expenditure are large aggregates, small changes to either are capable of producing a large change in gross savings.
Table 4.2: Institutional Classification for Estimation of Savings and Investment |
Country |
Institutional Classification |
1 |
2 |
3 |
4 |
Japan |
Household |
General Government |
Corporate Sector |
U.S. |
Personal |
General Government |
Corporate Sector |
UK |
Personal |
General Government |
Corporate Sector |
Australia |
Household |
General Government |
Corporate Sector |
India |
Household |
General Government |
Corporate Sector |
Table 4.3 : Coverage of Sole Proprietorships and Nonprofit private institutions serving households (NPISHs) in the Household Sector in Select Countries |
Country |
Whether Sole Proprietorships are included in Household sector |
Whether NPISHs are included In Household Sector |
1 |
2 |
3 |
Japan |
Included in Households |
Posted as an independent sector |
U.S. |
Corporations (the net worth of sole proprietorships is regarded as the assets of households) |
Included in households |
UK |
Those separated from households are regarded as corporations |
Included in households |
Germany |
Those separated from households are regarded as corporations |
Included in households |
France |
Those separated from households are regarded as corporations |
Posted as an independent sector |
India |
Included in Household Sector |
Included in Household Sector |
IV.17 A brief treatment of estimation of savings and investment methodologies of select countries is placed below.
Estimation of Savings in Select Countries
1. United Kingdom (UK)
Personal Savings
IV.18 The household savings in the United Kingdom is estimated by Office of National Statistics (ONS). Besides, the Department of Work and Pension also does surveys such as Family Resources Survey1, which capture the profile of savings and assets across the region in the UK.
IV.19 To define households sector, the new European System of Accounts (ESA 95) in UK uses the SNA 1993 definition. Accordingly, household sector covers ‘individuals or groups of individuals as consumers and possibly also as entrepreneurs producing market goods and non-financial and financial services (market producers) provided that, in the latter case, the corresponding activities are not those of separate entities treated as quasi-corporations’. This sector covers people living in traditional households, as well as those living in institutions, including those living in retirement homes, hostels, boarding houses, hotels or prisons. The household sector also includes sole traders, any non-profit institutions serving households (NPISH) which do not have separate legal status and private trusts.
IV.20 The financial account of UK shows the acquisition and disposals of financial assets and liabilities by households. Office for National Statistics (ONS) and the Bank of England work together closely to produce the financial account data. They do not produce separate accounts for households and Non Profit Institutions Serving Households (NPISH), since there is virtually no direct financial information collected from households. Therefore, the estimates are made from counterpart information, residually.
1The latest available survey was conducted in 2003-04.
General Government Savings
IV.21 This is the surplus or deficit on the use of disposable income account, and is the amount available for acquisition of physical or financial assets, or the reduction of liabilities. It represents the surplus or deficit of current resources over current uses. The public sector surplus on current budget equals public sector net savings (the surplus on the use of disposable income account after allowing for depreciation) plus receipts of capital taxes.
2. United States (US)
IV.22 Domestic capital account presents information on savings and investment for the US economy. For savings, a breakdown by sector is shown for corporate, personal, and Government savings. For investment, because of source data limitations, the breakdown is shown for private fixed and inventory investment and for Government fixed investment. The savings and investment account (also known as the capital account) records the sector’s gross savings and gross investment, where gross investment is net acquisitions of assets less net increase in liabilities.
Personal Savings
IV.23 The Bureau of Economic Analysis produces the standard measure of personal savings as part of its National Income and Product Accounts (NIPA). The savings measure is derived from the NIPA measure of disposable personal income, which is defined as personal income after the payment of payroll and income taxes. Personal savings is calculated as disposable personal income less personal outlays. It is the current savings of individuals (including proprietors and partnerships), non-profit institutions that primarily serve households, life insurance carriers, private non-insured welfare funds, private non-insured pension plans, publicly administered Government employee retirement plans, and private trust funds.
Corporate Savings
IV.24 The difference of income and expenditure is the corporate savings. Interest receipts on assets and net operating surplus are sources of private enterprise income. In the uses of income as income payments on assets (such as holders of financial liabilities and equity claims of other businesses), business current transfer payments, and income that accrues to the owners of business (namely proprietors’ income, rental income of persons, and corporate profits). Corporate profits, a widely used measure in the United States, is distributed to Government (taxes on corporate income) and to shareholders (net dividends) or is retained (undistributed profits, which can be thought of as a measure of corporate savings).
Government Savings
IV.25 Net Government savings is the difference between current receipts and current expenditures of the Federal Government and State and local Governments. Estimates of Federal Government current receipts, by component are published annually in NIPA tables along with expenditures and net Federal Government savings. The quarterly estimates are based on data from the Federal budget. The current tax receipt is one of the major items of current receipt while the Government consumption expenditure and Government social benefit are the major items of the expenditure.
3. Australia
Households’ Net Savings
IV.26 Net savings of households is equal to gross household disposable income less household final consumption expenditure and consumption of fixed capital. Household savings is estimated as the balancing item in the households income account. It includes savings through life insurance and superannuation funds (including net earnings on these funds), increased equity in unfunded superannuation schemes and the increase in farm assets with marketing boards.
Corporations’ Net Savings
IV.27 Net corporations’ savings is equal to the gross income receivable by corporations less income payable and consumption of fixed capital. Income receivable by corporations includes gross operating surplus, property income and current transfers receivable. Income payable includes property income and current transfers (including income taxes) payable.
General Government
IV.28 Net savings of general Government is the surplus of general Government gross income over current use of income. Current use of income includes final consumption expenditure and current transfers (interest and other property income payable, social assistance benefits payments to residents, transfers to non-profit institutions, subsidies, etc.).
4.Japan
IV.29 In Japan, the household savings is compiled through family survey and FoF method. In Japan, flow and stock data of the household sector are provided by the flow of funds accounts on a quarterly basis. The Bank of Japan has compiled the accounts since 1954 and a historical revision was made in 2000 to introduce the recommendations of the 1993 SNA. The household sector is determined by allocating a certain portion of residual amounts of financial assets and liabilities after allocating them to the financial, general Government, and rest of the world sectors. Therefore, the household sector depends on various financial data, rather than its own balance sheet data.
Household Savings
IV.30 Some of the methodological issues and rates and ratios such as currency holding of household sector match with India. In Japan, such allocation was made by using a fixed ratio on an assumption that 90 per cent of residual amount is held by the household sector and 10 per cent of that is held by the private non-financial corporations’ sector. This ratio is based on a study conducted by the Bank of Japan on the holding sectors of currency. As regards the issue of household sector exposure towards stock market and the impact of capital gains on the household savings, the estimation of the unlisted shares is a major challenge as the source data for the holding sectors and the market-equivalent value of those shares are limited.
Estimation of Investment in the Select Countries
1. Australia
IV.31 Gross capital formation refers to the gross additions to national wealth that result from three categories of investment:
•
gross fixed capital formation, measured by the total value of a producer’s acquisitions, less disposals, of fixed assets during the accounting period;
•
changes in inventories, equal to the value of inventories acquired by an enterprise less the value of inventories disposed of during the accounting period; and
•
acquisitions less disposals of valuables.
IV.32 Fixed capital formation estimates are shown on a ‘gross’ basis (i.e. deductions have not been made for the consumption of existing assets during the production process). However, the estimates are net of the sale of second-hand capital assets.
IV.33 Gross fixed capital formation is made up of the outlays of producers on commodities which do not add to their inventories or enter into the intermediate consumption for the period. The fundamental point of distinction between intermediate consumption and gross fixed capital formation is whether commodities are used up during the course of a particular period or whether they yield benefits beyond that period. In the case of households as consumers, all expenditure except the purchase of dwellings is treated as final consumption expenditure, whether or not it yields future benefits. Therefore, a purchase of a motor vehicle by a household (but not by an associated unincorporated enterprise) is treated as final consumption expenditure, whereas the same purchase by a business would be classified to gross fixed capital formation.
2. United Kingdom (UK)
Gross Capital Formation
Gross capital formation is made up of three components:
• Gross fixed capital formation
•
Changes in inventories
•
Acquisitions less disposals of valuables.
These components are very different in nature and magnitude.
IV.34 Gross fixed capital formation (GFCF) relates principally to investment in tangible fixed assets such as plant and machinery, transport equipment, dwellings and other buildings and structures. However, it also includes investment in intangible fixed assets, improvements to land and also the costs associated with the transfer of assets. The investment relates to assets which are used repeatedly in the production process for more than one year.
Change From Former System of Accounts
IV.35 Previously in the UK accounts GFCF had been described as GDFCF (Gross domestic fixed capital formation). The dropping of the term ‘domestic’ is of itself no significance as regards the concept and coverage of this variable. However, the new accounts extend the range of items to be regarded as capital assets. The main additions, which were previously included in intermediate consumption, are intangible fixed assets. However, also included in GFCF, all within tangible assets, are cultivated assets, such as livestock, which are used repeatedly to produce goods and services; expenditure on military structures and equipment (other than weapons), previously mostly in Government final consumption; and historic monuments.
3. Japan2
Measurement of Capital in Japan
IV.36 The Economic and Social Research Institution (ESRI), the producer of the Japanese national accounts, publishes two main estimates for capital stock. The first estimate is net capital stock, which is described in the balance sheet of the Japanese national accounts. The second estimate is Gross Capital Stock of Private Enterprises (GCSPE), which is the main data source for analysis of production by industry. In addition, the ESRI irregularly publishes gross capital stock for infrastructure.
Gross Capital Stock
IV.37 For industry analysis of the Japanese economy, the GCSPE is the main data source for the Japanese capital stock. The GCSPE covers all fixed assets, excluding residential buildings owned by private corporations and unincorporated enterprises and fixed assets owned by private non-profit institutions. The GCSPE is sometimes used as a measure of the productive capacity of the private sector. The Japanese National Wealth Survey (NWS) in 1955 as the benchmark stock. In comparison with the JSNA-NCS, whose benchmark stock is based on the 1970 NWS, this methodology is close to the perpetual inventory method. To estimate productive capacity, the GCSPE intentionally excludes the residential capital owned by private sectors.
2 Koji Nomura (March 25, 2005) “Turn the Tables! Reframing Measurement of Capital in Japanese National Accounts”, Keio University, Tokyo, Japannomura@sanken.keio.ac.jp
4. China
IV.38 In china, gross fixed capital formation refers to the value of fixed assets3 acquired minus those disposed of by all resident units during a given period. It can be categorized into gross tangible capital formation and gross intangible capital formation. The gross tangible capital formation includes the value of the construction projects, installation projects completed and the equipment, apparatus and instruments purchased (minus those disposed of), the value added from the sale of commercial house, the value of land improved, the value of newly increased draught animals, breeding stock, animals for milk, wool and for recreational purpose, and the newly increased forest with economic value during a given period. The gross intangible capital formation includes the prospecting of minerals, the acquisition of computer software, recreation, literature and art originals minus the disposal of them.
IV.39 For the initial accounting and the initial check of gross fixed capital formation, China calculates the total investment in fixed assets in the whole country as per the regular statistics requirements. For those not included in the regular statistical requirements, it is being calculated by the following:
•
For the fixed assets formed by the investment in fixed assets of a small amount that is less than 0.5 million Yuan, these are calculated by the related quarterly information.
•
For the increased fixed assets of the trial-produce of new products, these are calculated according to the expenses in the trial manufacture of new products on the basis of the expenditure information of the financial budget.
•
For the value added from the sale of commercial house after its being built, these are calculated by using the value added from the sale of that in the same period of the previous year, times the development speed, i.e. the ratio the floor space of commercial house sold in the current period divided by that in the same period of the previous year.
IV.40 In sum, it may be stated that various countries’ experience in estimating savings and investment suggests that the estimation procedures vary.
• Broadly, the savings is estimated for three sectors namely, personal savings, corporate
and Government savings.
•The flow-of-funds accounts provide useful information on the household sector. In the absence of balance sheet data for the household sector, the estimation of that sector tends to be complex. Flow-of-funds compilers need to explore the use of various statistics to improve the accuracy of data. For the international transactions and positions of the household sector, cooperation with the compilers of balance of payments and international investment positions statistics is very important.
•
In some countries there is virtually no direct financial information collected from households and, therefore, the estimates are made from counterpart information, residually. In some other economies the savings measure is derived as measure of disposable personal income, which is defined as personal income after the payment of payroll and income taxes. Others estimate household savings as the balancing item in the households income account or is compiled through family survey and FoF method.
•
As regards gross capital formation, most of the countries are doing it through expenditure side of the GDP and broadly follows the UN SNA 1993 recommendations for estimation of gross capital formation. Therefore, there is no unique method that is followed universally in estimating the savings and investment.
3The fixed assets acquired include those purchased, transferred-in and self-produced, and the disposed of refer to those sold and transferred-out.
Chapter V : Major Issues in the Estimation of Savings and Investment
A Brief History of Estimates of Savings in India
V.1 The first systematic attempt at estimating domestic savings by an official agency was first made by the Reserve Bank of India around 1959 for the period 1950-51 to 1957-58. National Council of Applied Economic Research (NCAER) also generated the estimates of savings separately for rural and urban households based on sample surveys, but the objective of the exercise had been to gather information on motivational and behavioral aspects of household savings. The resulting estimates of the NCAER survey, however, have not yielded a time series, which could throw some trend. The first set of estimates consistent with the national income series published by the CSO in 1961 covered the period since 1950-51 and since then had been a regular exercise for annual data dissemination.
Survey of Literature and an Overview of Important Issues pertaining to Savings and Investment Estimation
V.2 Even before setting up of the Raj Committee, K.N Raj (1962) himself had pointed out that the estimates of savings in the physical component are too crude. Before the setting up of Raj committee in 1982, once again V.K.R.V.Rao (1980), in his Dr. Zakir Hussain Memorial Lecture at the Aligarh Muslim University, questioned the reliability of the household sector savings data in physical assets. The Issue of indirect estimates of household physical savings was well addressed in the Raj Committee Report. Subsequently, Raja Chelliah Expert Group’s Report on Savings and Capital formation also endorsed the view points of the Raj Committee on having an independent survey for estimating household savings. Raja Chelliah Expert Group Report made a suggestion in the context of the need to cross-check and validate the indirect estimation of household savings through direct independent survey. Noted commentator Prof. T. N. Srinivasan also argued for an integrated household survey for compiling household savings.
V.3 Dr S.L. Shetty from the EPW Research Foundation has extensively commented and critically reviewed the estimation methodology and data gaps in the estimation of household savings. For instance, issues related to the estimation of deposits of non-banking financial companies (NBFCs) in the overall deposit; (ii) Share of informal sectors’ financial assets; (iii) Share of currency holdings with the public (93 per cent of which is treated as part of household savings since 1985-86); and (iv) Shares of companies for want of regular surveys on ownership of company shares etc., have been highlighted by Dr. Shetty. Apart from that he had also highlighted the need for addressing other pertinent issues pertaining to savings estimates such as treatment of valuables as a part of gross capital formation without any counter entry of it in savings side of the national accounts and treatment of capital transfers.
V.4 Dr. Saumitra Chaudhuri (2005) commenting on the high rate of savings for 2002-03 and 2003-04 felt that a close scrutiny of data does not indicate much scope for savings rate to have been significantly over estimated. However, on the investment side there might be underestimation. He feels that the increase in the savings rate of households appears consistent with the record of economic growth in recent years and past behavior.
V.5 Amongst the components of National Accounts Statistics (NAS), it is the savings and investment estimation on which the authorities have cast doubts at frequent intervals, primarily on the grounds of interpretational difficulties faced by them in explaining some aspects of macroeconomic development and appointed Working Groups/Expert Groups to enquire into the questions and come out with recommendations for improvements in the methodology of savings and investment estimation.
V.6 The debate on various issues involved in the estimation of savings and capital formation, however, remains unsettled. A number of studies have commented on the inadequacies in the current method adopted in India to estimate household sector’s savings. A large number of scholars associated with two institutions, namely, Institute of Economic Growth and Delhi School of Economics – like late Prof. V.K.R.V. Rao, late Prof. K.N. Raj, Profs. Suresh Tendulkar, B.L. Pandit, V.N. Pandit, K. Krishnamurthy, D.U. Sastry, P.D. Sharma and many others – produced technical papers on the interpretative significance of the savings behaviour and the behaviour of household savings. Most of the authors have contributed to the debate on various lacunae associated with current methodology adopted to estimate household savings and some refinements.
V.7 This section gives an overview of the major issues brought into focus in the writings of experts and official committees, as together they form substantial literature on the subject. Before this, let us first give the genesis of savings estimates in India.
Issues brought out by Reports of the Earlier Committees
V.8 There are two earlier well known formal exercises, which reviewed the savings estimation i.e., K. N. Raj Committee Report and the Raja Chelliah Expert Group, which have examined a variety of issues relating to the savings and investment estimation procedure.
K. N. Raj Committee Report on Capital Formation and Savings in India 1950-51 to 1979-80 (February 1982)
V.9 First, the K.N. Raj Working Group (1982), which was set up as “the rates of gross capital formation and of gross savings had gone up significantly since the early years of the 1970s, to about 24.0 per cent of the gross domestic product by 1978-79; even net capital formation and savings were touching rates of around 20 per cent of the national income”. This has raised a number of questions, in regard to both the estimates themselves and their interpretation, particularly since there has been evidently no corresponding improvement in growth momentum within the economy and the problems of mobilisation of resources for development seems still as severe as ever before. Second, there was the Chelliah Expert Group appointed in the context of the contrary development when savings fell and growth improved. The Government made out a case in the following words: “An important reason for this lagged recovery in private savings is the decline in the absolute amount of household savings in 1992-93 as estimated by the CSO. Since this decline is observed for a year in which the GDP growth rates rises from 0.9 per cent to 4.3 per cent and GDP growth from agriculture shows a sharp turnaround from minus 2.5 per cent to plus 5.3 per cent, there appear to be grounds for reviewing the methodology for estimating, savings and capital formation in the economy (Economic Survey 1994-95:3). The mandates of the Group were three-fold: (a) critically review the available estimates of both the aggregates and components of savings and capital formation; (b) evaluating their interpretational significance; and (c) recommend improvements in methods and procedures of estimation including suggestions as to the possibility of building up regional estimates.
Approach of the Working Group
V.10 The Working Group was mostly concerned with the differences in the estimates of savings and investment brought out by the two official agencies, CSO and RBI. The Working Group examined the differences in detail and made recommendations concerning improvements in data sources and the methodology of measurement with respect to individual sectors of the economy. The Group generally agreed that the database for the estimation of financial savings was comparatively firm. The Group felt, however, that there could be certain margin of error arising from the aggregation of financial accounts of diverse sets of financial corporations, co-operatives and banks with differing accounting years, which cannot be avoided. However, the series of steps in estimation, particularly those concerning the derivation of the ‘residual’ attributable to the household sector by deducting the estimates for the public sector and private corporate sector from the totals, involve the use of a number of ratios and proportions emerging from diverse sources and these may introduce estimation biases at various stages unless extra care is taken to ensure the accuracy of those ratios and update them regularly. Though these biases may individually appear to be of minor nature, all of them put together might result in a noticeable degree of error. In this respect, from the point of view of achieving as much of accuracy as possible in the estimation of household savings in the form of financial assets, the Working Group observed that it is necessary that the estimation procedures are tightened.
V.11 Some of the reforms suggested by the Raj Committee were: (i) for Currency with the Households, to improve the estimation, the Committee proposed to have census studies of the corporate sector as well as Government companies, particularly at the State level, at least once in five years on a regular basis; (ii) Need for a more disaggregated and quicker flow of current data, like the ratio of total bank deposits as revealed by the surveys of ownership of deposits (BSR-4) undertaken by the RBI on a biennial basis, also emphasising on the need to provide a more disaggregated and detailed classification of the ‘ownership of deposits’ of the household sector into farm households, unincorporated enterprises, and households proper in non-farm sector; (iii) Improving the quality and timeliness of statistical surveys, like the RBI surveys on ‘Growth of Deposits with Non-banking companies; (iv) on Security deposits with trusts, housing boards and Electricity Boards, such security deposits should be treated as household savings in the form of deposits, (v) on Provident fund (PF) deposits in non-Government educational institutions, the Committee suggested that the ratio of deposits to loans and advances to the employees applicable for the Government institutions should be applied to the PF of the educational institutions of the private sector; (vi) Bonus shares: The Committee observed that care should be taken to ensure that the estimates in regard to bonus shares are not duplicated at any stage; (vii) Loans from local authorities: The Committee, suggested that the State Statistical Bureaux should consolidate statistics of local bodies in this regard; and (viii) Loans from cooperatives: The Committee found that there is a considerable lag in the consolidation of data on loans and advances to households extended by the primary credit and non-credit co-operative societies. The Committee opined that the RBI may be requested to expedite such consolidation so that appropriate data for the latest year are included in the CSO’s quick estimates.
V.12 Accordingly, the reforms that were implemented are: the survey on ownership of deposits with commercial banks, which was biennial, has been made annual. Similarly, the survey results relating to growth of deposits with non-banking companies are being made available periodically, coordination between the RBI and CSO was improved, the survey on ownership of Government debt has been revived, security deposits with trusts, housing boards and Electricity Boards: Household deposits with Electricity Boards are now being covered.
Prof. Raja J. Chelliah Expert Group on Savings and Capital Formation (1996)
V.13 Given the fact that the Indian economy has gone through many changes as a consequence of major economic reforms with rapid financial liberalisation and advancement of information technology, a need was felt for radical change in the management of information. Hence, the Expert Group on Savings and Capital Formation under chairmanship of Prof. Raja J. Chelliah was set up in 1995 to undertake a critical review of the available estimates of savings and capital formation in the economy and recommend improvements in the methods and procedures of estimation with particular emphasis on the household and private corporate sectors. Prior to Chelliah Expert Group, K.N.Raj Expert Group had also favoured uniformity in estimation methodology of various agencies involved. Accordingly, the estimates of gross domestic savings released by the RBI and CSO were based on a uniform methodology and the same data sources. The estimation work for household savings is divided between these two agencies. While the CSO prepares the household sector savings in the form of physical assets, life funds, provident fund and pension fund, the responsibility for estimating financial savings of the household sector in a number of instruments, namely, Currency, Deposits, Shares and Debentures, and Claims on Government lies with RBI. The Chelliah Expert Group was also mandated to look into desirability of continuing with the residual system of estimation and to recommend a system of conducting appropriate Studies/surveys on a regular basis to determine important ratios and proportions used in the estimation of capital formation and savings.
Issues Identified and Reforms Suggested
V.14 The problem of obtaining the required data on a regular basis is severe in the case of the household sector. Given its coverage, the estimates for the household sector are worked out on the basis of the available data from various censuses, sample surveys, research studies and assumed relationships, and as such, the estimates, therefore, would have errors. Estimation with regard to household sector is based on the residual approach and not independently made. Thus, the errors in the estimation of aggregate investment in the economy and that occurring at the stage of estimation for the organised segment would be reflected in the estimates of the household sector.
V.15 Select reforms suggested were the following: (i) For estimating the currency component of the household sector savings, the Group recommended the use of flow of funds data for estimation household savings in the form of currency and also suggested for taking an average (moving) ratio for the past three years for the years for which flow of funds data are not available; (ii) the Group recommended for showing separately the consumer credit by banks and non-banking financial companies in the NAS Statement: ‘Financial assets and liabilities of the households sector’; (iii) In the light of no feasible alternatives to residual method, the Group suggested for exploring the feasibility of conducting independent income expenditure surveys on a periodic basis for validation of estimates generated by CSO; (iv) The Group suggested that enterprise surveys on the lines of All India Debt and Investment Survey (AIDIS) to have the estimates of the complete household sector and also indicated the need for having to conduct such surveys preferably every five years; and (v) The Group suggested for taking into account in the estimation of savings all new financial instruments as and when the relevant data become available.
National Statistical Commission, 2001
V.16 The National Statistical Commission in 2001 under the Chairmanship of Dr C. Rangarajan stated that the estimates of savings suffer from a number of limitations, mainly from deficiency of data. On a review, the Commission listed the following observations which appeared in the Chelliah Committee Report and are still valid and need attention of the concerned agencies for implementation:
1.A reasonably expeditious system needs to be evolved to reduce the time lag in making available the flow of funds accounts.
2.The flow of funds data should be used for estimating household savings in the form of currency. For the years for which flow of funds data are not available, the average ratio for the past three years should be applied.
3.Consumer credit extended by banks and non-banking financial companies should be shown separately in the National Accounts Statistics.
4.
Feasibility of conducting independent income expenditure surveys on a periodic basis should be explored for validation of the estimates generated by Central Statistical Organisation through residual method for the household savings in the form of physical assets.
5.Present All-India Debt and Investment Surveys (AIDIS) cover only households. Entire household sector includes unincorporated enterprises and non-profit institutions as well. To obtain the estimates of complete household sector, Enterprise Surveys on the lines of AIDIS may be designed and conducted periodically preferably every five years.
6.
In the case of deep discount bonds and zero coupon bonds, interest accruing needs to be spread out.
7.
All new financial instruments such as warrants which are traded apart from the underlying securities to which they are linked should be taken into account in the estimation of savings as and when complete relevant data become available.
‘Discrepancies’ and ‘Errors and Omissions’ in National Accounts Statistics and an Alternative Estimate of Savings from Flow Accounts assuming PFCE to be Firmer Estimate
Discrepancies
V.17 The discrepancies presented in the national accounts statistics refer to the differences between the GDP estimated by economic activity marked up by net indirect taxes (indirect taxes less subsidies) to arrive at GDP at market prices; and the GDP estimated from the expenditure side. These discrepancies are the sum total of (i) the statistical discrepancy in the National Disposable Income and its Appropriation Account,
Table 5.1: Discrepancies in Various Aggregates, NAS 2008, at Current Prices |
Discrepancies in |
1999-00 |
2000-01 |
2001-02 |
2002-03 |
2003-04 |
2004-05 |
2005-06 |
2006-07 |
1 |
2 |
3 |
4 |
5 |
6 |
7 |
8 |
9 |
PFCE |
-907 |
34,996 |
48,381 |
26,787 |
10,379 |
40,126 |
6,982 |
61,585 |
GFCF |
-3,274 |
3,778 |
-30,385 |
-6 |
38,175 |
17,819 |
35,152 |
-4,528 |
Exports |
3,192 |
4,281 |
4,327 |
4,942 |
3,400 |
6,445 |
9,330 |
7,349 |
Imports |
24,876 |
33,716 |
23,100 |
14,570 |
8,994 |
32,485 |
35,003 |
24,898 |
Total |
-25,865 |
9,339 |
-777 |
17,153 |
42,960 |
31,905 |
16,461 |
39,508 |
GDP |
19,52,035 |
21,02,313 |
22,78,952 |
24,54,561 |
27,54,620 |
31,49,412 |
35,80,344 |
41,45,810 |
Table 5.2: Discrepancies in Various Aggregates, NAS 2008, at Current Prices |
(As percentage of GDP at market prices) |
| |
1999-00 |
2000-01 |
2001-02 |
2002-03 |
2003-04 |
2004-05 |
2005-06 |
2006-07 |
1 |
2 |
3 |
4 |
5 |
6 |
7 |
8 |
9 |
PFCE |
0.0 |
1.7 |
2.1 |
1.1 |
0.4 |
1.3 |
0.2 |
1.5 |
GFCF |
-0.2 |
0.2 |
-1.3 |
0.0 |
1.4 |
0.6 |
1.0 |
-0.1 |
Exports |
0.2 |
0.2 |
0.2 |
0.2 |
0.1 |
0.2 |
0.3 |
0.2 |
Imports |
1.3 |
1.6 |
1.0 |
0.6 |
0.3 |
1.0 |
1.0 |
0.6 |
Total |
-1.3 |
0.4 |
0.0 |
0.7 |
1.6 |
1.0 |
0.5 |
1.0 |
(ii) errors and omissions in the Capital Finance Account (in the estimation of gross capital formation), (iii) adjustment of merchandise exports to the change of ownership basis in the External Transactions Account, and (iv) adjustment of merchandise imports to the change of ownership basis, also in the External Transactions Account. The component-wise break-up of the discrepancies is available at the time of releasing the Quick Estimates of National Income, Consumption Expenditure, Saving and Capital Formation on 31st January, when all the above accounts are compiled based on detailed data given in the balance of payments statistics. The estimates of Saving and Gross Capital Formation (which is estimated using the funds-flow approach as sum of saving and net capital inflow from abroad) and their rates in terms of GDP at market prices are also released at the same time, as these are compiled using the detailed data available from central and State Government accounts and on the private corporate sector from the Reserve Bank of India.
Errors and Omissions
V.18 The gross capital formation in the NAS is arrived at as sum of Savings and Net capital inflow from abroad (current account balance). This indicates that the finances are available for gross capital formation. A second estimate of gross capital formation, arrived at from the commodity flow approach, gives the availability of capital goods for investment in the country. The link between the two estimates, however, is the household sector capital formation (also taken as savings of households in physical assets), which is arrived at as residual from the commodity flow approach capital formation estimates, after accounting for public and private corporate sector’s investment, data on which is directly available. The difference between the two estimates is termed as ‘errors and omissions’.
Alternative Estimate of Savings from Flow Accounts
V.19 If one were to estimate overall savings as excess of consumption expenditure (private final consumption expenditure and Government final consumption expenditure) from the disposable income of the nation, the discrepancy with the present estimates of savings as shown in National Accounts Statistics will be of the order of 1.6 per cent in 2006-07. This discrepancy is presently adjusted against PFCE while compiling the input-output tables for the Indian economy, since the input-output tables do not have any provision for discrepancies.
V.20 The above table can further be disaggregated by the institutional sectors, Government and households as well as for the total economy in the following tables:
Table 5.3: Disposable Income, Consumption Expenditure and Savings |
(Rs. in crore) |
Aggregate |
1999-00 |
2000-01 |
2001-02 |
2002-03 |
2003-04 |
2004-05 |
2005-06 |
2006-07 |
1 |
2 |
3 |
4 |
5 |
6 |
7 |
8 |
9 |
Net national disposable Income |
18,08,314 |
19,36,574 |
21,03,949 |
22,66,623 |
25,61,207 |
28,90,085 |
32,83,989 |
38,07,652 |
Private final consumption expenditure |
12,53,643 |
13,39,274 |
14,67,195 |
15,51,365 |
16,99,486 |
18,40,406 |
20,55,387 |
23,12,105 |
Government final consumption expenditure |
2,52,744 |
2,65,088 |
2,81,786 |
2,90,978 |
3,10,297 |
3,38,052 |
3,73,076 |
4,27,007 |
Net Domestic Saving (as in NAS-present method) |
3,02,834 |
2,97,216 |
3,06,587 |
3,97,493 |
5,41,045 |
6,71,501 |
8,48,544 |
10,06,955 |
Statistical discrepancy |
-907 |
34,996 |
48,381 |
26,787 |
10,379 |
40,126 |
6,982 |
61,585 |
Statistical discrepancy as percentage of net national disposable income |
-0.1 |
1.8 |
2.3 |
1.2 |
0.4 |
1.4 |
0.2 |
1.6 |
Table 5.4: Use of Disposable Income Account – Government |
(Rs. in crore) |
Codes |
Item Description |
1999-00 |
2000-01 |
2001-02 |
2002-03 |
2003-04 |
2004-05 |
2005-06 |
1 |
2 |
3 |
4 |
5 |
6 |
7 |
8 |
9 |
| |
RESOURCES |
|
|
|
|
|
|
|
B.6 |
Net Disposable Income |
1,28,230 |
1,19,288 |
1,04,705 |
1,19,220 |
1,61,904 |
2,03,795 |
2,47,088 |
| |
USES |
|
|
|
|
|
|
|
P. 3 |
Final consumption expenditure* |
2,38,565 |
2,50,202 |
2,65,296 |
2,72,458 |
2,88,622 |
3,15,088 |
3,48,348 |
P.31 |
Individual consumption expenditure |
|
|
|
|
|
|
|
P.32 |
Collective consumption expenditure |
2,38,565 |
2,50,202 |
2,65,296 |
2,72,458 |
2,88,622 |
3,15,088 |
3,48,348 |
D.8 |
Adjustment for the change in net equity of households on pension funds |
|
|
|
|
|
|
|
B.8 |
SAVING, NET |
-1,10,335 |
-1,30,914 |
-1,60,591 |
-1,53,238 |
-1,26,718 |
-1,11,293 |
-1,01,260 |
* excludes final consumption expenditure of autonomous Government institutions |
Table 5.5: Use of Disposable Income Account - Households |
(Rs. in crore) |
Codes |
Item Description |
1999-00 |
2000-01 |
2001-02 |
2002-03 |
2003-04 |
2004-05 |
2005-06 |
1 |
2 |
3 |
4 |
5 |
6 |
7 |
8 |
9 |
| |
RESOURCES |
|
|
|
|
|
|
|
B.6 |
NET DISPOSABLE INCOME |
16,03,729 |
17,59,045 |
19,38,365 |
20,55,173 |
22,74,846 |
24,77,847 |
27,81,105 |
| |
NET DISPOSABLE INCOME (from Accounts) |
16,03,728 |
17,59,045 |
19,40,594 |
20,55,232 |
22,74,846 |
24,77,728 |
27,79,081 |
| |
USES |
|
|
|
|
|
|
|
P. 3 |
Final consumption expenditure |
12,53,643 |
13,39,274 |
14,67,195 |
15,51,365 |
16,99,486 |
18,40,406 |
20,55,387 |
P.31 |
Individual consumption expenditure |
12,53,643 |
13,39,274 |
14,67,195 |
15,51,365 |
16,99,486 |
18,40,406 |
20,55,387 |
P.32 |
Collective consumption expenditure |
|
|
|
|
|
|
|
D.8 |
Adjustment for the change in net equity of households on pension funds |
|
|
|
|
|
|
|
| |
Discrepancy |
-908 |
34,998 |
48,380 |
26,787 |
10,378 |
40,126 |
6,982 |
B.8 |
SAVING, NET |
3,50,994 |
3,84,773 |
4,22,790 |
4,77,021 |
5,64,982 |
5,97,315 |
7,18,736 |
* differs from personal disposable income to the extent of saving of quasi Government bodies and current transfers to the rest of the world. |
Select Other Major Issues in the Estimation of Savings and Investment
•
Due reflection of financial deepening in financial savings estimates: During the 1990s, the process of financial deepening has strengthened in India as judged from a host of indicators. A sharp increase in the preference for financial assets as against physical assets in the 1990s implied that this preference is essentially a reflection of financial widening in the sense of availability of a larger menu of financial assets, and of a sharp reduction in financial controls. The growing flexibility that investors enjoyed in terms of choice of assets in the increasing financial portfolios and in terms of optimisation of rates of return with risk minimisation has been furthered by financial sector reforms. Chelliah committee, 1996 noted that as the reforms are intensified, financial savings are bound to play a more crucial role in economic development than hitherto. There are doubts as to whether this deepening has fully reflected in financial savings of the household sector contrary to the a priori expectation that financial development should spur economic growth and savings.
•
Validity of rates, ratios and norms: Presently, a number of ratios and norms are used in the preparation of estimates of capital formation for the economy as a whole and in respect of the household sector. Some of these ratios are based on five-yearly input-output transactions tables (IOTTs) of the CSO. If these ratios are updated more frequently, the estimation of capital formation would considerably improve in qualitative terms and the relative size of errors and omissions would probably come down.
•Capturing data on various constituents of the household sector: The problem of obtaining the data on a regular basis is severe in the case of the household sector. This sector comprises not only farm households engaged in agricultural production, but also individual households and unincorporated enterprises engaged in industry, trade, transport, finance, private trusts etc. The estimates for the household sector are worked out on the basis of the available data from various censuses, sample surveys, and research studies and assumed relationships. The estimates, therefore, would have errors.
• Periodical surveys and type studies be conducted to collect income and expenditure data on NPISHs: The residual and indirect approach for the household sector has been adopted due to the absence of income-expenditure surveys for pure households (consumer households) and Non-Profit Institutions Serving Households (NPISHs) estimates. The National Statistical Commission has recommended that periodical surveys and type studies be conducted to collect income and expenditure data on NPISHs, since estimation through direct surveys for pure household sector is not enough for national accounting purposes.
• Timely compilation of flow of funds data as basis for savings estimates: The flow of funds data should be used for estimating household savings in the form of instruments of financial savings, namely currency. For the years for which flow of funds data are not available, the average ratio for the past three years should be applied. A reasonably expeditious system needs to be evolved to reduce the time lag in making available the flow of funds accounts.
•
Estimation of ‘currency’ component: At present household share is taken as 93 per cent of total currency with public. This proportion is being used for a long time and needs a revision. It has been seen that some companies club their cash holdings with bank balance. Therefore, bank balance should be excluded while estimating currency holdings. Further, a more serious question is whether the total amount of currency should be treated as savings or a part of it. Cash with household may be used for consumption, for expenditure to be incurred in the near future and speculation. Expenditure on consumption cannot be part of savings. • Estimation of deposits component: Household savings in the form of deposits consists of deposits with banks, non-banking companies, co-operative societies, electricity boards and trade debt (net). Deposits with non banking companies are based on RBI survey on growth of deposits with non-banking companies 1995-96. There is a time lag of 10 years. Similarly, there is a time lag of four to five years in respect of cooperatives societies’ data. Furthermore, deposits with electricity boards, housing boards, MTNL etc., are not available separately.
•
Estimation of shares, debentures and bonds: The estimates are based on total paid up capital and the RBI Survey of ownership of capital of joint stock companies. From this survey, ratio of household share is derived and applied to the total paid up capital. The survey has been discontinued after 1995. Thus, the ratio that is being applied for current year estimates relate to 1995.
•
Estimation of net claims on Government: Net claims on Government include household investment in Government securities, small savings, bearer bonds, capital investment bonds, etc. The household share in investment in Government securities is derived on the basis of RBI survey on ownership of Central and State Government securities, 1992. The survey needs to be updated. Others such as the provident fund, etc., invested in Government securities and small savings should be seen whether the same is adequately covered in the survey otherwise there are chances of duplication.
•
Netting of liabilities in individual financial instruments: In practice, the household savings in individual instruments is presented in net terms by deducting the liabilities incurred by the sector. In this respect, Raj Committee opined that this way the method tends to under-estimate the size of financial savings. Further, there may be a distinction between the classes of financial savers and debtors within the household sector. The Committee, therefore, suggests furnishing a disaggregated as well as total savings in financial instrument so that for each instrument three sets of data may be generated viz. (a) savings in financial assets in gross terms; (b) increase in financial liabilities; and (c) net savings in financial assets. •
Issue of impact of high current transfers: In the context of household savings estimation, an issue that has been noted by Dr. S.L. Shetty of the EPW Research Foundation is as to what is the implication of high ‘current transfers’ from abroad on household savings, particularly financial savings? He argues that the current practice includes capital transfers also as a part of the financial savings thereby overestimating the same. It was clarified that private transfers shown in the balance of payments statistics are taken into account for the estimation of disposable income of the nation. Therefore, these resources should have corresponding entries on the financial savings of the household sector.
• Capital inflow and rise in savings: Given the necessarily complex way in which savings and investment are estimated in an economy like India with a large household sector, including unincorporated enterprises, the question arises as to whether the sudden increase in the estimated savings is more statistical than actual. In fact, since the current savings surge coincides with a massive increase in the inflow of portfolio FII investment in India’s stock and debt markets, it had been argued (see S.L. Shetty in Economic and Political Weekly, February 12, 2005,) that some of this capital may have been lodged with the banks and got erroneously recorded as constituting household savings invested in financial assets. It was clarified that in the present method of compilation of household financial savings, there is no scope for such erroneous recording.
•
The major weak areas in the estimation of public sector savings are, (i) coverage of local bodies, (ii) coverage of quasi-Government (QG) bodies, (iii) the emerging entities, the public-private-partnerships and the Special Purpose Vehicles (PPP/SPVs). Besides these, there are conceptual issues relating to (a) treatment of defence capital expenditures and (b) treatment of capital transfers to quasi-Government bodies and private non-Governmental organisations.
• The major limitations in estimating capital formation are common to those in respect of Savings, namely, (i) coverage of local bodies and quasi Government bodies in the public sector, (ii) coverage of new companies, the companies executing projects through public private partnerships (PPPs) and the cooperatives in the corporate sector, and (iii) lack of direct data on savings and capital formation in respect of household sector. Besides these, the other limitations are: (i) non availability of current and reliable data on output of capital goods in respect of unregistered manufacturing sector, which is essential in the estimation of capital formation for the entire economy through the commodity-flow approach; (ii) lack of annual enterprise surveys and reliable data from benchmark enterprise surveys in respect of expenditures made by various industries on acquiring capital goods, as also on inventories, which is essential for industry-wise and State-wise estimates of capital formation; and (iii) while estimating the Fixed Capital Formation by the Commodity Flow Method, number of rates and ratios are being used in absence of direct data. Some of these rates and ratios are based on old surveys or studies, while some of them are updated using the data available from Input Output Tables at the time of revising the base year of national accounts series.
•
The private corporate sector savings estimation is also beset with data gaps and limitations. The selection of companies in the RBI studies is largely governed by the availability of balance sheets and is not drawn using any statistical sampling technique. While other parameters like sales, total net assets, etc., may have high correlation with various financial parameters, use of paid-up capital (PUC) as the characteristic for blow up procedure is chosen mainly on consideration of the data availability at population level and partly on account of its relative robustness. Another limitation of using PUC comes from the fact that while the selection of companies for the studies exclude non-operating, defunct, and under-construction companies, the population PUC includes data on such companies. It may be stated that in the absence of the population PUC numbers at a time of estimating saving, these figures are estimated based on certain assumptions, such as average growth of population PUC in last 3 to 5 years. However, on availability of the population PUC subsequently, the population estimates of saving and capital formation undergo revision on account of change in the multiplier used for arriving at the population estimates.
V.21 To sum up, notwithstanding the conceptual strength of India’s savings estimation practice, a critical review of the present method shows limitations mainly emanating from source data quality, data gaps and estimation problems. Various authors have identified different areas for closer examination and proposed reforms like methodology to be adopted for estimation of savings, various parameters that go into the estimation of savings, data sources, data gaps etc, for close scrutiny. What comes out of the literature is that there is near unanimity in their thinking and writings that we need to take a relook at the entire procedure and data related issues pertaining to the estimation of savings at regular intervals as there is scope for further improvement in the procedures and method followed for savings estimation. This is the background against which, the High Level Committee on Savings and Investment (Chairman: Dr.C.Rangarajan) has been constituted by the Government.
Chapter VI : Estimation of the Household Financial Savings
VI.1 Household sector occupies a pivotal position in the generation of savings in the economy. The approach adopted by the HLC in reviewing the methodology of estimation of household sector’s savings and suggesting the reforms is ‘consultative’ keeping in view the fact that the data required for estimating the household savings has to be collected from several divergent sources including the apex institutions. The HLC focused on addressing the following relevant ToRs, while dealing with the household sector’s savings estimation.
i. To examine the feasibility of directly estimating household savings through integrated income and expenditure surveys;
ii. In the light of the higher growth path of the economy, to undertake a critical review of the available estimates of household savings and investment in the economy, with respect to data base, methods of estimation, reliability and interpretational significance;
iii. To examine if rapid financial deepening in the economy is getting duly reflected in the estimates of financial savings and suggest improvements, if needed;
iv. To examine the feasibility of arriving at separate estimates for pure households, household enterprises and unincorporated bodies through a suitable method;
v. To examine the empirical methods and procedures used in the estimates based on flow-of-funds method and suggest improvements thereon; and
vi. To suggest new data bases, if any, to be devised/built-up for improving the reliability or checking validity of the estimates.
VI.2 This Chapter examines the feasibility of directly estimating household savings through integrated income and expenditure surveys. It also undertakes a critical review of the available estimates of household savings in the economy, with respect to data base and methods of estimation, and provides recommendations in these regards.
Approach adopted by the HLC
VI.3 The approach adopted by this HLC is comprehensive and different as compared to the earlier committees. Keeping in view the entire gamut of issues germane to estimation of household savings, as overviewed in the preceding Chapter, the approach to be adopted by the HLC to address them was conceived along the lines as indicated below:
(i) At the outset, the HLC has examined the feasibility of introducing a direct estimation of savings. From that perspective, the HLC examined if preparation of household savings estimates can be based on an integrated income-expenditure survey as the alternative methodology and data base. As explained subsequently in this Section, it came out from the HLC’s interaction with NSSO that this cannot be done immediately but possible in due course. The HLC recognised that even when this comes into operation and stabilises in future, this method has to complement the present method of estimation of household savings as is the practice in several other countries. It was, thus, considered appropriate that the present flow of funds based indirect method needs to be strengthened as it will have to be used in conjunction with the direct estimation method, which will be eventually available for use.
(ii) The second component of the approach was to strengthen the present data base and methodology and for this purpose, the worksheet approach was followed wherein each and every item in the work sheet was examined with respect to data base, quality and methodology as also deviation from the accepted methodology. The focus of this exercise has been to improve the data quality.
(iii) In the context of the worksheet framework, the third component of the HLC’s approach was to examine, if an alternative and more accurate data base can be created, keeping especially in view the dated rates and ratios underlying the present estimation procedure, and the need for improvement of data coverage and evolution of an alternative data base. Towards this pursuit, it was felt that the different financial instruments can be sourced from the apex financial bodies under whose regulatory purview, the instruments are covered. The HLC’s interaction with the apex financial bodies, namely, NABARD, SEBI, NHB and IRDA helped in sensitizing them about their role in putting in place a statistical system which will enable regular flow of data to RBI and CSO for preparation of household savings and flow of funds with updated and accurate data. The outcome of the effort undertaken by the HLC in this regard is encouraging and due mention has been made in the Report at appropriate places under different instruments in the Section pertaining to the Recommendations (Box 6.1).
(v) Finally, in order to pave way for eventual introduction of periodical comprehensive survey, the HLC interacted with the NSSO to examine the possibility of introducing such a survey. The outcome of this interaction has turned out to be favourable in the sense that the NSSO has agreed to undertake such a survey for households with a pilot survey to begin with, in the year 2010-11. The survey will provide an alternative data base for direct estimation of household savings for cross-validation of the present estimates.
The Issue of Direct Estimation of Savings through an Integrated Comprehensive Income and Expenditure Survey VI.4 One of the ToRs specifies that the HLC needs to examine the feasibility of directly estimating household savings through integrated income and expenditure surveys. The current practice of residual method of estimation of household savings is in vogue since Box 6.1: HLC’s Interaction with Apex Financial Bodies to Streamline Data Flow One of the major objectives of the HLC on Estimation of Savings and Investment in Indian Economy is to examine how the savings estimates for different constituent sectors, namely the public, corporate and the household sectors can be improved upon. Another related ToR of the HLC is to examine the alternative data base to be formed which could cross-validate the present estimates of savings. Towards these pursuits, the HLC examined the present data collection procedure adopted for estimating household financial savings and arrived at a consensus that in the existing scheme of things, although some apex bodies (namely, the NABARD and the NHB) are already involved, there is a possibility of consulting with other apex bodies such as the IRDA and the SEBI for the purpose of building up an alternative and more accurate database in respect of financial instruments under their regulatory purview and flow-of-funds accounts. The view of the HLC on the household sector savings was, thus, to engage with the major apex financial bodies namely, SEBI, NABARD, IRDA and NHB in an attempt to improve the data in respect of financial savings instruments coming under the purview of their regulatory operation and also flow of funds for the institutions under their purview on a consolidated basis. This forms a major shift in the approach of the HLC, vis-à-vis earlier such Committees, which will go a long way in putting in place, a data system for strengthening of the present estimates of savings and flow of funds for India.
No doubt, all the apex bodies in the financial sector have a significant role to ensure that the quality of data emanating from them is reliable which finally get incorporated in the household financial savings through the underlying Flow of Funds method. The underlying logic is: the household financial savings is estimated instrument-wise and among them, different instruments are presently estimated from the data received from individual institutions, thus, giving a scope for further development in association with the apex bodies.
Towards this pursuit, SEBI ’s involvement was envisaged in respect of household investment in shares, debentures, mutual funds and commercial bonds, IRDA’s in respect of ‘life funds’ of insurance companies, NABARD’s in respect of deposit, credit and investment data pertaining to co-operative banks, credit and non-credit societies and NHB’s in respect of household deposits with the housing finance companies. The HLC recommends creation of a regular data supply mechanism from the apex bodies to RBI. Going forward, it is also envisioned that all the apex bodies are engaged in the ongoing review of the data on household financial savings from the following standpoints:
(i) Identification of the database used;
(ii) Methodology prescribed and in practice used;
(iii) Validating the data as well as results; and
(iv) Comment on changes required in the procedure.
Annex 6.5 provides the details with regard to the institutions and the information base in respect of the items that need to be built upon:
(i) SEBI - Data on the household financial savings in respect of ‘shares, debentures and commercial bonds’ as per Annexed Format A6.5.1.
(ii) SEBI - Data on the flow-of-funds for registrars and broker houses as per Annexed Format A6.5.2.
(iii) NABARD - Data on the household financial savings in respect of cooperatives – banks and credit as well as non-credit societies in respect of deposits, loans as well as investment in shares and debentures as per Annexed Format A6.5.3.
(iv) NABARD - Data/projections for years for which flow-of-funds data are not available for cooperative credit as well as non-credit societies as per Annexed Format A6.5.4.
(v) IRDA – Data on insurance sector – both public and private – on household financial savings in respect of ‘life funds’ as per Annexed Format A6.5.5.
(vi) IRDA – Data on insurance sector – both public and private – on flow-of funds data for consolidated insurance sector as per Annexed Format A6.5.6.
The above information, when made available and incorporated in the estimation, would give a reliable estimate of financial savings of the household sector, as well as enable timely compilation of flow-of-funds accounts of the Indian economy. the inception of estimation of savings in India, and the recourse to this method continues, for want of a better and acceptable practical method. Further, earlier Committees like Raj Committee and Chelliah Committee as also reputed economists and statisticians have endorsed India’s present practice as conceptually sound. It may be noted that Chelliah Committee (1996) recognised that as large scale income-expenditure surveys have so far not been successful in India, there seems to be no possibility of obtaining a direct estimate of savings of the household sector from an alternative method.
VI.5 The HLC considered this issue by reviewing certain analytical issues as they emerge from an examination of select country experiences (US in particular, which disseminates savings data based not only on income expenditure survey, but also FoF) in this regard and relevant for consideration in the context of a switch-over to the direct method of estimation of household savings from the indirect method that is currently in vogue in India. The HLC’s interaction with NSSO in this regard is documented later in this chapter.
VI.6 The countries like the US and the UK have established the mechanism to directly estimate the savings of their respective household sector through income-expenditure surveys, while India follows a unique way of estimating the household savings indirectly by a method, which is a mix of ‘flow-of-funds’ and ‘commodity flow’ approaches, where household sector’s share is extracted as residual. In the latter, the data on domestic investment, savings and their disposition into household, corporate and Government components are not based on direct observation but arrived through indirect estimation.
VI.7 Savings of an economic unit can be estimated either from the income account as earned surplus, being the difference between current income and current consumption and taxes (as followed in the US for households) or from the balance sheet as earned net worth, being the difference between changes in financial assets and liabilities (as followed in India for households’ financial savings). In the US and the UK, both the estimates are available, which help in cross-validating the income-expenditure survey based direct estimates of savings. But in India, only flow of funds based estimation is available for household financial savings and commodity flow based estimation is available for household physical savings. In the absence of income-expenditure survey, there is no direct estimation of household savings.
VI.8 Many eminent economists have been pointing to various lacunae in the present practice. Some of them, in particular, Professor T. N. Srinivasan, Yale University strongly feel that India should devise a system of direct estimation of household savings based on integrated household surveys based on data relating to income and expenditure of the households. We understand that once such attempt was made by the NSSO but the data, thus, obtained were not reliable. So the idea was abandoned. But with the changed time and with better design of an integrated household survey schedule, it is felt that the income and expenditure survey might be worth giving one more fair trial. Against this background, the need is to examine the feasibility of adopting an income-expenditure survey based estimation of household savings.
VI.9 The proposal for such an integrated survey has been in the air now for quite some time. As stated earlier, T. N. Srinivasan (1994) examined this issue at length, using the observations of Angus Deaton (1989) which described the extraordinarily complex problems found in estimating income in developing countries through a survey. Deaton (1989) had brought out how even in developed countries the measurement of self-employment incomes was notoriously inaccurate. Apart from the growing size of self-employment in India, Srinivasan (1994) argued that the upper income groups do not respond to surveys or are likely to understate their incomes. Srinivasan (2003) revisited the subject while reviewing the National Statistical Commission (NSC 2001) (Chairman: Dr. C. Rangarajan) recommendations and contended that “in the Indian context, it is virtually impossible to collect reliable data on incomes and receipts from household surveys” (p.306). The Chelliah Committee also addressed this issue and suggested that feasibility of conducting independent income and expenditure surveys on a periodic basis should be explored, “only for validation of the estimates generated by the CSO”. Also, as the all-India debt and investment survey (AIDIS) covers only pure households, the Chelliah Committee suggested that the enterprise surveys on the lines of AIDIS may also be designed and conducted. US Practice VI.10 Table 6.1 provides the difference between the US personal savings estimates made by the National Income and Product Accounts (NIPA) and Flow-of-funds Accounts (FFA). The sharp decline in the personal savings rate, as measured by NIPA, has kindled renewed interest in alternative measures of savings and their relative merits. In particular, savings as measured in the capital accounts prepared by the flow of funds of the Board of Governors of the Federal Reserve System has often been cited as an alternative to the income-expenditure system based on NIPA measure. As per the relevant data, the difference between the US personal savings estimates made by NIPA and FFA vary.
Table 6.1 : Comparison of Personal Savings in the NIPAs with Personal Savings in the FFAs |
(In billions of US Dollars) |
Item |
1980 |
1990 |
2000 |
2005 |
1 |
2 |
3 |
4 |
5 |
Derivation of personal savings from the NIPAs: |
|
|
|
|
1. |
Personal income |
2307.9 |
4878.6 |
8429.7 |
10239.2 |
2. |
Less: Personal current taxes |
298.9 |
592.8 |
1235.7 |
1203.1 |
3. |
Equals: Disposable personal income (DPI) |
2009 |
4285.8 |
7194 |
9036.1 |
4. |
Less: Personal outlays |
1807.5 |
3986.4 |
7025.6 |
9070.9 |
5. |
Equals: Personal savings |
201.4 |
299.4 |
168.5 |
-34.8 |
Derivation of personal savings from the FFAs: |
|
|
|
|
6. |
Net acquisition of financial assets |
311.9 |
518.3 |
367.3 |
963.1 |
7. |
Plus: Net investment in tangible assets |
114 |
249.2 |
546.3 |
722.3 |
8. |
Less: Net increase in liabilities |
199.3 |
233.4 |
916.4 |
1611.7 |
9. |
Mortgage debt on non-farm homes |
92.5 |
206 |
399.3 |
1139 |
10. |
All other liabilities |
106.8 |
27.4 |
517.1 |
472.7 |
11. |
Less: Net capital transfers, NIPAs |
-8.8 |
-15.2 |
-36.5 |
-16.2 |
12. |
Less: Net investment in consumer durable goods |
17.2 |
76 |
205.9 |
219.2 |
13. |
Equals: Personal savings, without consumer durables |
218.1 |
473.3 |
-172.3 |
-129.4 |
14. |
Difference in personal savings, NIPAs minus FFAs |
-16.6 |
-173.9 |
340.8 |
87.2 |
Source : US Bureau of Economic Analysis (BEA) Website. |
VI.11 The main difference between these savings ratios is that one is derived by treating expenditure on consumer durables as investment, while the other ones are compiled by considering them as final consumption expenditure. It has been argued that the fact that US uses different official savings ratios, which highlight the usefulness of this approach, and it takes into account the actual behavior of the households (ECB, 2007).
Measurement Issues
VI.12 Certain measurement issues identified in the cross-country literature on issues of estimation of savings are being discussed from the standpoint of reassessing the trends of observed fall in savings rates in the context of countries like US and UK (Chamberlin Graeme and Sumit Dey-Chowdhury, 2008). Some of these arguments and their relevance for India have been identified in Rath (2007) as below:
-
Treatment of employers’ contributions to pension and insurance funds: Employers’ contributions to pension and insurance funds, excluding the benefits of these funds also form part of personal income of households. Conceptually, while this makes sense as an accounting entity and fits in well with the rest of the NIPA methodology, it fails to reflect the actual cash flow to households in any given period. To an extent, the recent decline in the savings rate in the US may reflect that not only people retire earlier and but they also live longer on their benefits.
-
Treatment of consumer durable goods: Savings is roughly equal to post-tax income less consumption, so the measurement of savings depends critically on whether certain expenditures are classified as consumption or investment. A defining feature of net investment – or increments to wealth net of capital gains and depreciation – is that it increases the future consumption possibilities of households whereas current consumption expenditures does not. However, the NIPA treats net purchases of consumer durable goods, which also provide a stream of services over a period of years, as consumption rather than as investment. Therefore, acquisition of a durable good increases future consumption possibilities in much the same way that the acquisition of a financial asset or housing does, and for this reason many have argued that spending on durable goods should be treated as investment rather than consumption. Some recent research findings on the issue of the impact of capitalizing consumer durables on household savings are worth-commenting here. ECB (2007) estimates the impact of capitalising consumer durables on the Euro area household savings ratios and disposable income for the first time. It finds that the effect of capitalising consumer durables on savings ratios is moderate and is estimated between 1.0 and 1.8 per cent. This is lower than in the US, where the effect has been estimated to vary from 1.0 to 3.0 per cent. This shows that treating expenditure on consumer durables as investment increases the savings ratio in the EA. However, these issues find little relevance in the context of national accounts, as these accounts have a clear distinction of producers and consumers and include only those fixed assets which are used in repeated production of goods and services in the hands of producers. If one were to include the consumer durables as fixed assets, then the output resulting from these assets (such as cooking meals in the house, personal transportation, etc.) should also get included in the GDP of the country, and the persons associated with this production will be treated as ‘employees’, resulting in no unemployment in the country.
-
Effect of inflation on measured personal savings rates: Another issue that arises is whether the savings should be stated in real or in nominal terms. The personal savings rate in the NIPA is calculated from nominal values of income and consumption. To the extent that inflation simply scales up the value of income and consumption, it will have little effect on the savings rate. Inflation tends, however, to raise interest income and outlays by more than the change in the general price level. As a result, savings rates vary with the rate of inflation.
-
Treatment of capital gains and capital gains taxes: In the NIPA, personal income excludes capital gains (and losses) because they do not derive from current production. As a result, large capital gains realised during the stock market boom of the 1990s failed to boost personal savings. Indeed, they effectively reduced measured personal savings over that period because taxes paid on those gains are included in personal tax payments, which are deducted from personal income in calculating disposable personal income. Some have argued that the NIPA treatment of capital gains is inconsistent with its treatment of capital gains taxes. If capital gains are not part of income, then taxes on those gains should not be counted against income as personal tax payments. However, it was clarified that although the capital gains are not included in the NIPA, the disposable income includes dividends received in the form of property incomes; hence, there is no inconsistency as far as payment of capital gains taxes are concerned. Similarly on the production side, the change in the value of inventories during the year is taken into account in the measurement of current year’s output. The inventories are measured through perpetual inventory method, in which the items of goods are valued at the time when they enter inventories and again valued at the prices prevailing at the time when they are removed from inventories. The capital gains which are not recorded in the flow accounts refer to the capital gains on assets, which get recorded only in the other changes in assets account.
-
Treatment of human capital: According to Roy H. Webb (1993) (Personal Savings Behavior and Real Economic Activity, Federal Reserve Bank of Richmond Economic Quarterly, 1993), another definitional problem is dividing private spending between consumption and investment. NIPA investment is defined as the purchase of physical assets. If a person acquires productive capabilities through additional schooling, any payments for tuition, textbooks, and related items are defined as consumption. Many economists, however, see a strong analogy between physical capital, the tangible assets that can be used for future production, and human capital, the skills and abilities that people can use for future production. Since future production can be boosted by either physical or human capital formation, and since the purchase of either human or physical capital involves a trade-off of consumption today for future productive capacity, it is somewhat arbitrary to label spending for one as investment while labeling spending for the other as consumption. Again, it was informed that the System of National Accounts provides a comprehensive accounting framework within which economic data can be compiled and presented in a format that is designed for purposes of economic analysis, decision-taking and policy-making. The issues of treatment of human capital, etc., therefore, do not find place in the asset boundary or the production boundary of the SNA.
India’s Migration from Indirect to Direct Method – Practical Issues
-
An important issue in the process of migration from indirect to direct method would be the conduct of an integrated income-expenditure survey, as far as pure households are concerned. The major issues confronted by the US while adopting and estimating savings through direct method have already been explained in the previous paragraphs. Needless to mention, issues of similar nature are likely to be encountered in India also.
-
The estimates under the flow method vis-a-vis the present method: Table 6.2 compares the estimates of India’s household savings that would emerge from an application of two methods – the existing method and an alternative method where household savings refers to the difference between personal disposable income and private final consumption expenditure. This estimate roughly corresponds to the direct method. The difference between the two estimates is in the range of (–) 0.6 to 2.7 per cent of GDP during the period 1999-2000. This discrepancy is adjusted by the CSO in PFCE in the IOTT.
-
Sampling and Non-sampling Errors: The literature has widely commented on the limitations of the survey findings on household savings. According to the Bureau of Labour Statistics, the US Consumer Expenditure Survey is subject to two types of errors, non-sampling and sampling. Non-sampling errors can be attributed to many sources, such as differences in the interpretation of questions, inability or unwillingness of the respondent to provide correct information, mistakes in recording or coding the data obtained, and other errors of collection, response, processing, coverage, and estimation for missing data. The full extent of non-sampling error is unknown. Sampling errors occur when the survey data are collected from a sample and not from the entire population.
Table 6.2: Estimates of Households’ Savings in India |
(Amount in Rs. crore) |
Year |
Present Method (A) |
Alternative Method (B) |
Difference (A-B) |
Financial savings |
Net physical savings |
Household savings (2+3) |
Personal disposable income |
Household consumption expenditure |
Household savings (5-6) |
Absolute |
Percentage of GDP at market prices |
1 |
2 |
3 |
4 |
5 |
6 |
7 |
8 |
9 |
1999-00 |
206,602 |
144,392 |
350,994 |
1,620,064 |
1,257,541 |
362,523 |
-11,529 |
-0.6 |
2000-01 |
215,219 |
169,554 |
384,773 |
1,773,251 |
1,345,583 |
427,668 |
-42,895 |
-2.0 |
2001-02 |
247,476 |
175,314 |
422,790 |
1,954,838 |
1,470,301 |
484,537 |
-61,747 |
-2.7 |
2002-03 |
253,255 |
223,766 |
477,021 |
2,069,144 |
1,552,618 |
516,526 |
-39,505 |
-1.6 |
2003-04 |
313,260 |
251,722 |
564,982 |
2,296,323 |
1,703,547 |
592,776 |
-27,794 |
-1.0 |
2004-05 |
318,264 |
279,051 |
597,315 |
2,500,193 |
1,848,490 |
651,703 |
-54,388 |
-1.7 |
2005-06 |
420,841 |
297,895 |
718,736 |
2,805,199 |
2,062,222 |
742,977 |
-24,241 |
-0.7 |
2006-07 |
467,985 |
348,902 |
816,887 |
3,217,237 |
2,324,109 |
893,128 |
-76,241 |
-1.8 |
Discussion at the NAS Advisory Committee (ACNA) Meeting in September 2007
VI.13 A proposal by RBI to the National Statistical Commission was circulated among the Members of the ACNA to give their views on the proposed income-expenditure survey to estimate savings. While responding on the issue of direct estimation of savings, there was a near unanimity among members on the RBI’s proposal on the desirability for an independent income-expenditure survey as is the practice in many countries – developed and developing. Among others, it was stated that such surveys would provide insight on the distribution of consumption, savings and income, while providing cross-check for the present household savings estimates. However, the Committee noted a range of problems that need to be deliberated upon and resolved before such a Survey could yield direct estimates of savings and Capital formation for the Household sector and/or provide a credible cross-check for the current estimates. First, the household sector in the national accounts comprises besides households viewed as a pure consumption unit (this forms the universe for the current NSSO Consumer expenditure Surveys), all un-incorporated enterprises and, Non-Profit Institutions (NPIs) and, without a full and unduplicated coverage of all three components, residual approach as at present might have to be adopted. In respect of NPISHs, there was no full and complete listing of such institutions which could serve as the frame for a survey of their income and expenditure. In respect of the un-incorporated enterprises, survey of all economic activities in the same year was needed – which is not attempted currently for a number of valid reasons. Further, as is well-known, a very large proportion of such enterprises do not maintain proper accounts so that the estimates of value added and capital formation derived from the NSSO Enterprise Surveys have not been found adequate for direct use in the National Accounts. These difficulties are directly carried forward in respect of all the self-employed households which derive their income from one or more such enterprises-including those in partnership with other households. Even if all the above issues are disregarded, it needs to be recognised that currently, canvassing the standard Consumer Expenditure schedule in the NSSO Consumer Expenditure Surveys takes close to or more than three hours per household. And, combining an Income Survey with NSS Consumer Expenditure Survey by adding one or more blocks to the already heavy consumer expenditure schedule carries with it sizeable risks of adverse consequences for the quality of response in respect of both income and expenditure. This is over and above the question of the ability of self employed households in reporting their incomes from own-account enterprises for which no accounts are maintained.
VI.14 In view of the past experience in the efforts of the NSSO with regard to household surveys, it was thought essential to conduct further pilot surveys to arrive at a satisfactory methodology. Brief profiles of the past such efforts from the NSSO are now in order. There were earlier efforts made by the NSSO, in the form of pilot studies ‘with the specific objective of evolving an operationally feasible and technically sound methodology for the household income surveys’ to facilitate the direct estimation of household savings. Earlier experience suggests that while the survey results threw considerable light on the problems of conducting household income surveys in India, the reported data were not found to be of high quality. Overall, the experience was disappointing as many problems associated with the direct estimation of income, consumption and savings could not be resolved.
VI.15 Another pilot survey on income, consumption and savings was originally proposed to be conducted during January-December 1992, ‘but this scheme could not be implemented owing to financial constraints’ (NSSO, 1995). Earlier Attempts by the NSSO in Conducting Household Income-Expenditure Survey VI.16 The need for conducting large-scale, nation-wide, comprehensive and integrated surveys on household income, consumption and savings in India had been acutely felt in official circles right since the early 1950s. It is reported that in the 9th (1953-54) and 14th (1959-60) rounds of NSS survey, attempts were made to collect information on household incomes along with consumer expenditure data on experimental basis, but the results were not satisfactory as no proper methodology for systematic data collection on household incomes had yet been evolved. Information on household receipts and disbursement were collected in the 19th (1964-65) and 24th (1969-70) rounds through an integrated household schedule. Significantly, during these rounds NSS estimates of consumer expenditure were found to be substantially lower than in other rounds. It was inferred that this was due to prolonged interaction effect. The long questionnaire integrating data collection on income, expenditure and savings involved protracted hours of interrogation, which may have led to respondents’ fatigue thereby adversely affecting the quality of response on data; could have also led to under-reporting.
VI.17 With a view to obviating the difficulties experienced in the above integrated household surveys, NSSO conducted a Pilot enquiry in 1983-84 with the specific objective of evolving an operationally feasible and technically sound methodology for the household income surveys. It adopted two different approaches for the measurement of household income. First, there was a household income schedule to collect directly income from different sources of earning; and second, there was a schedule on household consumption and savings drawn up aiming at obtaining household income as the sum of household consumption and savings. One-third of the households surveyed were subjected to enquiries on both the schedules to enable the study of prolonged interaction effects and response fatigue, any. This survey focusing on methodology was carried out on a limited scale covering only five States and four metropolitan cities (NSSO, 1993 and 1995). Limitations of the Pilot Study Results VI.18 The results presented in the NSSO Reports (August 1993 and September 1995) threw considerable light on the problems of conducting household income surveys in India. The experience is, however, somewhat disappointing, for the results show that many problems remain to be resolved. One needs to conduct further full-scale pilot surveys for finally arriving at a satisfactory methodology for household income surveys. The reasons may be stated as follows:
VI.19 Reported data were not of high quality. This was realised at the stage of data processing. Income and savings are sensitive subjects of enquiry and the long interviews made data collection really difficult. The weaknesses of primary data stood in the way of reaching firm conclusions in many respects.
VI.20 The sample size proved to be inadequate for highly variable items like savings and its components. The study of savings was not, however, the major objective of the pilot survey.
VI.21 The most important limitation of the study was that the schedules of enquiry did not seem to have been very well designed. Insufficient care was taken to collect data on non-monetised components of income and consumption. This is the most likely explanation of the large difference C+S minus Y in the rural sector, especially for non-wage/salaried households.
VI.22 The NSSO Report (September 1995) States that, “It should be clear from the overview of results presented above that the Pilot Survey on Income, Consumption and Savings did not settle all issues connected with the methodology to be followed for household income surveys in India. It is, therefore, essential to conduct further pilot surveys for resolving these issues with a view to arriving at a satisfactory methodology”. The NSSO Report (September 1995) further confides that the Governing Council of the NSSO had approved the Scheme of the Second Pilot Survey on Income, Consumption and Savings, which was originally proposed to be conducted during January-December 1992, “but this scheme could not be implemented owing to financial constraints (ibid: 40).
The HLC’s Interaction with the NSSO
VI.23 Against the above mentioned prior understanding of the HLC on related survey issues in respect of NSSO, the Members of the HLC interacted with the NSSO on May 26, 2008 in Kolkata to elicit from them their earlier experiences in designing and conducting comprehensive integrated income and expenditure survey. The purpose of this interaction with the NSSO was to explore the possible constraints and obstacles that one may face in conducting such surveys. Besides, it was also discussed as to what should be the parameters on which surveys may be designed so that it can truly be an integrated and comprehensive survey encompassing a wide variety of parameters related to income, consumption, savings and capital formation and other related aspects. The NSSO’s Feedback on the Direct Estimation of Household Savings
VI.24 The NSSO in its presentation to the HLC mentioned that they have endeavoured to estimate the indicators of financial flows in the household sector. It has generally avoided collection of data on household income in view of the inherent difficulties of the task. Instead, it has been more emphatic on measuring household consumer expenditure. NSSO data on consumer expenditure have been widely used for studies on economic inequality. In conjunction with savings data, they have been used to estimate the size distribution of income.
VI.25 The NSSO has been conducting different surveys, the last being 61st Round (2004-05) quinquennial survey: So far as the household surveys are concerned, 19th to 25th rounds of NSSO (1964-1971) surveys cover the data on receipts and disbursements of the household and the data were collected in an Integrated Household Survey schedule. Since 27th rounds of NSSO (1972-73) Consumer Expenditure Survey has been broadly stabilized and has become the integral part of the quinquennial surveys’ Rounds viz, 27th, 32nd, 38th, 43rd, 50th, 55th and 61st .
VI.26 The NSSO in their presentation enumerated the design and problem faced in Income and Expenditure Survey, canvassed in Rounds 9-14. In the process , the NSSO discussed the details of the 10th round, wherein framework of Receipts & Disbursements blocks were used with 78 items on both the sides. Due to too detailed survey schedule, the results so obtained were not reliable as it might have resulted in correspondent’s fatigue.
Later Endeavour: 19th to 25th Rounds of NSSO (1964-1971)
VI.27 The later exercise was done for 19th to 25th round of NSS (1964-1971). In these rounds the receipts and disbursements blocks were much more condensed, with only 16 items on each.
-
The experienced gained from this round reveals that the integrated approach to data collection on income, expenditure and savings from the same household necessarily led to a long questionnaire, causing informant fatigue.
-
Lower estimates for consumer expenditure were obtained during the 19th to 24th rounds (in which the Integrated Household Survey schedule was canvassed) as the reporting of consumption expenditure could be affected by collection of data on income and savings from the same household.
-
Therefore, the results so obtained did not stand to the statistical scrutiny and, hence, were not reliable.
Pilot Survey on ‘Income, Consumption and Savings’, 1983-84
VI.28 As comprehensive results were not satisfactory, another Pilot Survey on Income, Consumption and Savings, 1983-84 was conducted with the objective of development of an appropriate methodology for conducting comprehensive surveys of household income, which could overcome the difficulties faced in the earlier survey.
-
For this pilot survey, strategy was to draw up two schedules of Income, Consumption, and Savings and to divide sample households into 3 sets of income, consumption and savings and both.
-
Each sample household was visited twice. This enabled information on income and savings to be collected separately for two halves of a year. Information on consumption was collected in each visit with a reference period of 30 days, each sample household was visited twice.
-
This enabled information on income and savings to be collected separately for two halves of a year.
-
The pilot survey was conducted in 5 States, namely, Haryana, Maharashtra (including Bombay), Tamil Nadu (including Madras), Orissa and UP – and the cities of Delhi and Calcutta .With the Sample size of 100 villages and 80 urban blocks (Total).
-
A sample of 24 households (three matched sets of 8 households each) was selected for survey from each sample village/block.
-
All estimates were generated for three sectors of population: rural (R), urban non-metropolitan (U), and metropolitan (M).
-
The objective of this pilot survey was to ensure reliability and validity of income data collected through direct enquiry on household income (Y) vis-à-vis income estimated as the sum C+S and reliability and validity of data on household savings (S).
Overall Assessment of the Pilot Survey
-
The report of the pilot survey described the results as disappointing.
-
This may be attributed to the fact that: (i) income and savings are sensitive subjects of enquiry and the long interviews made data collection really difficult. The weaknesses of primary data stood in the way of reaching firm conclusions, (ii) the sample size proved to be inadequate for highly variable items like savings and its components and (iii) it also revealed the problems of respondent resistance, which have accentuated over time.
-
The Pilot survey of 1983-84 revealed some possibilities for improvement (e.g., in schedule design and sample size) and further full-scale pilot surveys were needed for arriving at a satisfactory methodology for household income surveys.
-
However, no further surveys on income have been conducted since 1983-84.
Issues and Problems to be addressed in undertaking the Income and Expenditure Survey Enquiries on Household Income
-
As the pattern of income financial flow in the household is more complex than the consumption financial flow it requires the respondent to make much more computational efforts, than consumer expenditure survey.
-
It arouses suspicion and meets with evasive / hostile response from the respondents.
Combined Income-Expenditure Enquiry
-
A combined income-expenditure enquiry is expected to have the problems of a consumer expenditure enquiry in addition to those faced by an income survey.
-
The reporting of consumption expenditure could be affected by collection of data on
income and savings from the samehousehold.
Attempts to Collect Savings Data
-
In case of collection of savings data it requires a substantial recall effort from the informants, especially in the reporting of stocks of products of agricultural activity.
-
Like income enquiries, savings enquires arouse suspicion and hostility (e.g., in collection of information on bullion, ornaments, etc.,).
-
It generally meets with evasive responses thereby resulting in unavoidable underreporting. However, the savings data is less complex than income data.
Problems with Sampling
-
In the pilot survey of 1983-84, the sample size was inadequate for highly variable items like savings and its components.
-
Normally, the estimate of sampling error indicates how much the sample size needs to be increased to obtain estimates with tolerable variability.
-
But if non-sampling errors like non-response predominate, they affect the estimate of sampling error and no statistical results exist regarding the effect of increasing sample size.
Resistance from Respondents
-
Of all surveys of the NSS, the consumer expenditure survey is the one that meets with the most resistance from respondents.
-
The detailed information sought (the schedule has over 340 items: not collected in terms of codes).
-
The difficulty of informants in reporting quantities and values since normal people do not have these details on their fingertips.
-
Nevertheless, there is a consistent time series of indicators derived from the consumer expenditure surveys based on established survey instruments.
Insights from Some Existing Surveys and their Results
VI.29 As against the experience of the NSSO in conducting income and expenditure survey, the NCAER has been doing similar surveys, the latest for which was for the year 2004-05 (Table 6.3).
(i) NCAER and Max New York Life for 2004-05
VI.30 One of the surveys conducted jointly by NCAER and Max New York Life on ‘How India Earns, Spends and Saves’ was for 2004-05. The Survey covered 342 towns and almost 2,000 villages across 250 districts and 2,255 wards. The sample size includes 63,016 households living in rural and urban areas. Its salient findings are:
-
There were 205.9 million households in the country in 2004-05, of which 30 per cent (61.4 million) lived in urban areas and the rest (144.5 million) in rural areas. An average household in India has annual income of Rs. 65,041 and expenditure of Rs. 48,902, leaving it with a surplus of Rs.16,139 to save and invest.
-
This survey shows that the households saved roughly 25.2 per cent of their income as in 2004-05, as against the present NAS estimate of household savings at 29.0 per cent for household sector in 2004-05 (based on personal disposable income). The difference could partly be due to the fact that the NCAER survey is a ‘pure household’ survey as compared to the combined household sector which includes unincorporated bodies, etc.
(ii) Invest India Income and Savings Survey, 2007
VI.31 The 2007 edition of Indian Retail Finance Markets is coproduced by Invest India Market Solution (IIMS) Data works and CNBC TV18. The Report is drawn from the findings of the Invest India Incomes and Savings Survey 2007 that was completed in June 2007. This is based on in-depth interviews with of 100,000 respondents aged 18 to 59 years with cash incomes and supported by a household listing sample of one million.
Table 6.3 : Share of Expenditure and Surplus Income in Average Income, 2004-05 |
Region |
Average expenditure |
Surplus income |
Average income |
1 |
2 |
3 |
4 |
Rural |
77.6 |
22.4 |
100 |
Urban |
71.0 |
27.9 |
100 |
All India |
76.4 |
25.2 |
100 |
Source: NCAER Survey, 2004-05 |
VI.32 The report provides a profile of India’s 321 million working age population with cash incomes. This includes commentaries and analysis for 141 million retail bank customers, 105 million life insurance customers, 77 million retail credit customers, 5.3 million mutual fund investors, 3.5 million stock market investors and 16 million residential property investors. Commentaries and analysis are provided also on 18 million gold investors and 30 million members of the informal savings sector, which are of interest in the Indian context.
VI.33 The latest survey conducted by IIMS provides the data of savings by various instruments across the States for 2006-07. The survey suggested that the State-level profile of savings instruments indicates the preference of savings instrument varies across the States quite significantly.
VI.34 However, the HLC notes that there is no evidence of such privately-run surveys contributing to an improvement in the estimation procedure for savings and capital formation.
HLC’s Perceptions
VI.35 The subject of direct measurement of household savings along with the various issues involved generally in improving the savings estimation in India, has been extensively studied in a collaborative publication christened Household Savings and Investment Behaviour in India (September 2003) jointly brought out by the EPW Research Foundation (EPWRF) and the National Council of Applied Economic Research (NCAER) in 2003. Some perceptions that come out from this analysis are as below.
VI.36 The need for undertaking household surveys on income, consumption and savings is self-evident but to assume that such surveys will necessarily provide firm direct estimates of household savings is not correct. The American and other experiences have shown that using flow-of-funds accounts are not necessarily inferior to using the field survey results in so far as financial savings are concerned. Both sets of estimations have to be undertaken so that they serve as cross-checks on each other. Therefore, it is noted that both the methods are complimentary to each other but not substitutes.
VI.37 There are a series of imponderables in expecting that the household survey results can give firm estimates of savings in India on annual basis. Even when a firm basis is established for conducting the surveys, they may provide bench-mark results on a decennial or at best on a quinquennial basis. There will have to be separate surveys for unincorporated enterprises as well as trusts and non-profit organisations which constitute a part of the household sector except for some designated as quasi-corporations. Above all, income, consumption and savings sample surveys are invariably known to be finding difficulties in providing appropriate representation to the extreme sections of households – the very poor and the very rich. Likewise, there is the respondents’ fatigue cited earlier due to long questionnaire and prolonged interaction effect. But, these cannot be intractable problems for the sampling theorists and survey practitioners, whose expertise is considered as unique in India.
VI.38 Despite the plethora of problems associated with household income surveys, there is a strong case for venturing into initiating such surveys on a quinquennial basis. Direct methods of household savings estimation for the benchmark year (the survey year) may be considered as only one of the objectives of such regular survey. More important objectives would be to get insights into income and savings distributions of households in rural and urban areas by size groups as well as by socio-economic categories and, thus, help build a more meaningful social accounting matrix (SAM) framework for India.
VI.39 A possible roadmap would be as follows: At the outset, the NSSO may initiate a pilot survey on household income, consumption and savings and be prepared for launching regular quinquennial surveys on the subject soon thereafter. This may be a workable option than to firm up the whole arrangement to put in place a system of regular income, consumption and savings studies for the country. From the point of view of a full coverage of the household sector, Enterprise Surveys have to be so designed as to cover the savings and investment activities of unincorporated enterprises which will remain covered in pure household surveys including the AIDIS.
VI.40 The problems that the proposed survey designers are expected to face is the difficulty in capturing the incomes and savings of richer households in urban areas. To obviate that problem, one method would be to segregate income-tax paying assesses in urban areas above a cut-off limit of say, Rs.5 crore and study their income-tax returns to arrive at estimates of their incomes and savings separately. The results may have to be supplemented with separate sample studies on such households. It would be useful to have the income tax revenue statistics published.
VI.41 While there are no two views about the desirability of such a survey in India, the feasibility of conducting an income-expenditure survey needs to be examined as certain difficulties could creep in designing and conducting such a survey in India. Keeping in view the fact that such an experiment in the past did not yield meaningful results, both direct and indirect methods have their own merits and shortcomings. In view of the issues in the context of a migration to direct estimation of household savings in India, the need is to have a better design of an integrated household survey schedule and examine the feasibility of adopting an income-expenditure survey based estimation of household savings, given the desirability of such a survey in India.
VI.42 During the HLC ’s discussion with the NSSO, it emerged that the NSSO is in favour of conducting the survey, but the question is how to address various practical issues. Some of them were: (i) enquiries on household income requires the respondent to make computational efforts, much more than consumer expenditure survey, while it arouses suspicion and meets with evasive / hostile response from the respondents, (ii) Attempts to collect savings data involves a substantial recall effort from informants, especially in the reporting of stocks of products of agricultural activity, while it generally meets with evasive responses and resulting in unavoidable under-reporting. However, the savings data may be less complex than income data, (iii) Problems with sampling especially with regard to the presence of sampling and non-sampling error, and (iv) Resistance from respondents, etc.
VI.43 The NSSO pointed out that the 66th Round of survey is slated for 2009-10 (employment, wage and consumption expenditure survey), making modification in the survey schedule to accommodate integrated income expenditure survey will not be feasible at this point of time. The NSSO can undertake a pilot survey on integrated income and expenditure of household in the year 2010-11.
Recommendation
VI.a As mentioned earlier, in order to pave way for eventual introduction of periodical comprehensive survey, the HLC interacted with the NSSO to examine the possibility of introducing such a survey. The outcome of this interaction has turned out to be favourable in the sense that the NSSO has agreed to undertake such a survey for households with a pilot survey to begin with, in the year 2010-11. The survey will provide an alternative data base for direct estimation of household savings for cross-validation of the present estimates. The HLC recommends that the NSSO should initiate at the earliest, the task of launching a comprehensive income-expenditure survey for household sector. While initiating such a survey, the NSSO may give a careful thought to the design issues through consultation with all appropriate institutions, like the CSO and the RBI. The NSSO should come out with a concrete action plan in this regard. To be able to find out the estimates of savings for all components of the household sector (as per national accounts statistics framework), and also generate reliable estimates of savings, consumption, investment and income at the State level in India, appropriate sampling design needs to be done. It is imperative that the survey of income and expenditure of ‘pure households’ needs to be taken up concurrently with the Enterprise Survey. Review of the Existing Methodology
VI.44 As stated already, India follows a unique way of estimating the household savings indirectly by a method, which is a mix of flow-of-funds and commodity flow approaches, where household sector ’s share is extracted as residual. The estimates of financial savings in respect of households including non-profit institutions and unincorporated private business are estimated by changes in the net financial assets held by them such as: currency, deposits with financial institutions, shares and debentures, claims on Government, net equity in the life funds, provident and pension funds net of changes in financial liabilities. The estimates in respect of various financial instruments are arrived at as a residual after duly accounting for such instruments held by public and private corporate sectors. In estimating the financial savings of the households, increments in their holdings of financial assets are calculated net of increments in their financial liabilities. These annual flows are compiled instrument-wise. As the household sector is an unorganised sector and its balance sheets are not available, its financial flows are either estimated on the basis of firm information obtained from the accounts of counterpart institutions engaged in transactions with the households or as a residual after deducting the accounted financial information for the other sectors from the financial totals or are based on the information collected on sectoral distribution either directly or on the basis of surveys.
VI.45 The HLC felt that no alternative is possible to the present method of estimation of savings for the time being. At the same time, it is recognised that the present method needs to be strengthened through updation of rates and ratios and development of alternative data base for constant cross-validation of the estimates. Secondly, the envisaged system of conducting a regular and comprehensive income and expenditure survey of the household sector, once completed and stabilized, will complement the present procedure and provide a cross-validation for the savings estimates. Thereafter, both the methods would be used in the estimation and would complement each other.
VI.46 As of the current methodology, it is admitted that there is considerable scope for improving it. Accordingly, a thorough review of the existing procedure has been undertaken by the HLC in this context through a careful scrutiny of the worksheet and its components.
Recommendation
VI.b The HLC is of the opinion that no alternative is possible to the present method of estimation of savings but it is recognised that the present method needs to be strengthened through regular updation of rates and ratios and development of alternative data bases for constant cross-validation of the estimates. The envisaged system of conducting a regular and comprehensive income and expenditure survey of the household sector once in five years, when stabilise, will complement the present procedure and provide a cross-validation for the household savings estimates. Thereafter, both the methods would be used in the estimation and would complement each other. A Review of the Worksheet pertaining to the Household Sector Savings and the Estimation Procedure Thereof
VI.47 In view of the above recommendation, the HLC undertook a detailed examination and discussion of each of the savings instruments in terms of conceptual and methodological issues pertaining to each of the instruments. Accordingly, the HLC has taken up a very close scrutiny of the worksheet employed to estimate the financial savings at present. Such comprehensive re-look at every step of the estimation procedure has brought out clues to the current inadequacies in data coverage. Especially, the usage of primitive surveys related various parameters that go into the estimation of financial savings, the antiquated rates and ratios that are used in the absence of latest surveys and the consequent under and over estimation at various stages of the estimation procedure would throw light on the current limitations and provide guidance to undertake a proposal for a comprehensive overhaul of the current system.
VI.48 While suggesting that the existing methodology may continue, the HLC is fully aware of the current problems in estimating various components of the household sector savings due to a variety of reasons and constraints, which result in over (under) estimation of various components of household savings in turn leading to inflating (deflating) the estimates of aggregate savings. Therefore, the HLC felt the need for a ‘worksheet approach’ to analyse the issues involved in each of the instruments of household financial savings. This has enabled the HLC to examine in detail various concepts and methodology associated with the estimation of household savings in India, keeping in view the existing data sources, data flows at regular interval, data gaps that persist and the consequent need to use rates/ ratios computed on the basis of certain periodical surveys.
VI.49 The details of the presently used underlying ‘rates and ratios’ are given as an Annex at A6.1 at the end of this Report for illustration purposes. Basic worksheet form employed is given at Annex A6.3.
Approach adopted by the HLC to examine the Worksheet Pertaining to Estimation of Household Financial Savings
The approach followed by the HLC to examine the worksheet comprised the following stages:
VI.50 The worksheet approach, wherein each and every constituent items are examined with respect to (a) sources of data and the underlying conceptual issues (focusing mainly on Raj Committee, Chelliah Committee, National Statistical Commission Reports wherever applicable), (b) methodology adopted for each of the parameter along with the limitations and problems, (c) prescribed procedure for estimation, (d) procedure followed in practice, (e) deviations and constraints in practice, and (f) lacunae identified in data and methodology.
I. The present practice is that either the data on various household financial savings instruments is collected from individual institutions or is estimated. The HLC recognised that the effort should be to keep the actual methodological practice in alignment with the description in National Accounts Statistics – Sources and Methods, 2007. Towards this pursuit, all the apex bodies in the financial sector have a significant role in ensuring the regularity, reliability and quality of data emanating from them. As such, all the apex bodies were requested to examine the data on the household financial savings instrument from the following standpoints:
i. Identification of the database used;
ii. Methodology prescribed and in practice used;
iii. Validating the data as well as results; and
iv. Comment on changes required in the procedure.
II. Discussions in the meetings on the lacunae; and
III. Recommendations. Conceptual and Methodological Issues
Currency held by Households
VI.51 Currency is held by different economic agents and significantly by households. At present, a fixed ratio of 93.0 per cent of the ‘currency with public’ is used as the household savings in the instrument of currency. The members were of the opinion that the fixed ratio of 93 per cent used in the estimation hitherto needs periodical re-examination. There is a need to look into the validity of the ratio at periodic intervals.
Raj Committee
VI.52 Raj Committee has made the following recommendations regarding measurement of currency held by the households.
“From the total currency with public, currency held by private corporate business, cooperative institutions, Government undertakings and Government treasuries and local authorities (including port trusts) are taken out to estimate the currency held by the households. In the case of private corporate business, the estimate of currency held by the sample companies studied by the RBI is blown up on the basis of the ratio of paid-up capital of the sample companies to all companies. As the companies selected by the RBI are generally of big size, at least in the case of currency, the blown-up estimate may turn out to be smaller than the actual if worked out on the basis of the analysis of all the companies. It is likely to be so because in the case of smaller companies, the ratio of currency to paid-up capital would be relatively larger. With the rapid growth of smaller companies in recent years, errors between the estimate and the actual would be growing. This is likely to give an upward bias in the estimates of currency held by the households. As the number of companies expands, the ratios based on paid up capital may give an unrealistic picture. In this context the Working Group’s recommendation to have census studies of the corporate sector at least once in five years on a regular basis assumes significance. This is equally true of Government companies, particularly at the States’ level.
In the case of currency holdings of the cooperative sector, as separate figures of currency and bank balances for the primary and central land development banks are not available, the proportion of currency holding to total of cash and bank balances obtained for the central cooperative banks is applied to the total of cash and bank balances of the primary and central land development banks. Here again, the ratios obtained for the higher bodies are applied to the small bodies. In respect of bigger societies, the ratio of currency to total of cash and bank balances must be smaller than in the case of smaller cooperative societies. Thus, there is a built-in bias in favour of small cash holding of the primary credit societies which are scattered throughout and command the largest number. This situation is likely to give an upward bias in the estimation of household savings in the form of currency. ”
Chelliah Committee
The Chelliah Committee made the following recommendation.
“On the basis of the past sectoral pattern of currency holdings as revealed by the FoF data, the currency held by the household sector is presently estimated at 93 per cent of ‘currency with public’. The currency with the public is obtained from the monetary data for the last day of the financial year. While agreeing to the present proportion (i.e., 93 per cent), the Group recommends that for the years for which the FoF data are not available, an average (moving) ratio for the past three years should be applied in order to reduce somewhat the possible errors of a fixed ratio.”
VI.53 It may be noted that the National Statistical Commission has generally recommended the updation of various ratios and rates on the basis of surveys and studies with wide geographical spread, which is applicable to currency ratio as well.
Identification of Data Source
VI.54 The data on total currency with the public is obtained from DEAP, RBI. This data is used for estimation of currency with households.
Methodology Prescribed
VI.55 Household savings in the form of currency is estimated as a residual by deducting the amount of currency held by the private corporate sector and public sector enterprises from the total currency with the public. The data on total currency with the public (i.e., notes in circulation plus circulation of Rupee Coins and Small Coins minus cash in hand with banks) for each year are available in the RBI Bulletin. The institutions/sectors other than households in respect of which the amount of currency holdings deducted are: (i) private corporate business, comprising non-Government financial and non-financial companies registered under the Companies Act, (ii) co-operative institutions (other than co-operative banks), (iii) Government companies and statutory corporations (both financial and non-financial) and (iv) Railways and Central and State Government treasuries.
Methodology Used
VI.56 On the question of cash in hand, the Advisory Committee on National Accounts in its meeting held in June 1987 had suggested that the present procedure of estimating the currency with the households by deducting from the total currency, the currency held by various institutional sectors may be examined. It had further suggested that a simple procedure of possibly taking a proportion of the total currency in circulation might serve the purpose. Accordingly the RBI, on the basis of past trends of currency holding of the household and non-household sector estimated this proportion to be 0.93, which has been used for estimating the currency holding of the households from 1985-86 onwards.
Deviations from Prescribed Procedures
VI.57 The currency ratio of 93.0 per cent was adopted by RBI on the recommendation of Advisory Committee on National Accounts, whose meeting was held in June, 1987. RBI decided on this ratio on the basis of past trends observed from 1985-86 onwards. The ratio, however, was not subjected to a detailed check from time to time because of unavailability of data.
Discussion in the HLC Meetings
VI.58 The discussion in the HLC centred around two issues, namely, the appropriateness of (i) including currency as part of household savings and (ii) the presently used proportion of 93.0 per cent of ‘currency with public’ used as household currency holding.
VI.59 On the first issue, a view has been expressed to the effect that cash holdings of households may be used for consumption or may be intended for similar expenditure to be incurred in the near future or may be for speculative purposes; such cash holdings, therefore, cannot be part of household savings.
VI.60 Such a perception is conceptually incorrect. All additions to currency with the public, whether they are intended for acquiring consumption goods or for speculation or whether they are held as idle cash, constitute the counterpart of the expansion in net central bank credit to the Government (the so-called deficit spending by the State) or to the commercial sector directly, or through the commercial and cooperative banks; they could also be the counterpart of the net flow of foreign currency assets from abroad on account of merchandise, invisibles and capital transactions. The resources thus released to the public and private sectors represent the active use of private savings - that part of savings which the modern monetary medium of exchange obliges the public to hold in the form of additional currency. Such increases in currency may be akin to increases in inventories of goods forming part of physical capital formation (or savings). In a wider sense, all assets of the monetary system in the form of investments in Government securities and bank credit to the public and private sectors represent the active use of savings affected through additions to monetary assets – through additional currency holdings as much as through additional bank deposits. There can be constant switching as between assets, from currency to bank deposits or to other financial assets. The switch could also be in favour of consumption, but all incremental financial assets held as such retain the character of savings until they are used up in some form of current consumption.
VI.61 On the second issue, the currency ratio of household savings in currency as proportion of ‘currency with public’ used at present is 93 per cent and the ratio was determined in the year 1985-86. This is dated and needs to be revised to take care of the structural changes in the economy and capturing the quantum of currency holdings with households. The members were of the opinion that the fixed ratio used in the estimation needs re-examination. The HLC noted that financial innovations are lowering the use of cash in the transactions made by the households in recent years. Therefore, it may be expected that the ratio should be lower in the recent years. Further, there is an urgent need to look into the validity of this ratio at frequent and regular intervals.
VI.62 The HLC noted that as per the earlier Committees, like Raj Committee, it was recommended that in order to find out the household currency holding residually from the currency with public, census studies of the corporate sector at least once in five years on a regular basis need to be conducted. The underlying reasoning for this recommendation was that the blown-up estimate of sample companies may turn out to be smaller than the actual if worked out on the basis of the analysis of all the companies. It is likely to be so because in the case of smaller companies, the ratio of currency to paid-up capital would be relatively larger. With the rapid growth of smaller companies in recent years, errors between the estimate and the actual would be growing. This is likely to give an upward bias in the estimates of currency held by the households. As the number of companies expands, the ratios based on paid up capital may give an unrealistic picture. This is equally true of Government companies, particularly at the States’ level.
VI.63 Similarly in respect of bigger co-operatives, societies, the ratio of currency to total of cash and bank balances must be smaller than in the case of smaller cooperative societies. Thus, there is a built-in-bias in favour of smaller cash holding of the primary credit societies which are scattered throughout and command the largest number. This situation is likely to give an upward bias in the estimation of household savings in the form of currency.
VI.64 It was indicated by the HLC members that the sample studies of the corporate sector finances published by the RBI shows a substantial rise in the cash holdings of corporate bodies. The same is true for the Government companies. This means that there should be a corresponding decline in the cash holdings of the households. Moreover, there have been structural changes in the economy during the recent years. Therefore, a ratio determined in 1985-86 needs to be revised to take care of the structural changes. The use of credit and debit cards and ATMs are lowering the use of cash in the transactions made by the households. Therefore, it is expected that the ratio should have become lower in the recent years.
VI.65 On the issue of implication of adoption of electronic alternatives on cash usage, it may be of interest to take into account the perception emerging from international experience. A stylised fact borne out from research on this area in advanced countries is that despite the strong growth in the adoption of electronic payment instruments, the stock of currency in circulation has not declined as fast (Amromin, Gene and Sujit Chakravorti, 2007). “On the basis of examination of data from 13 OECD countries for the period 1988-2003, it has been concluded that despite growth in adoption of electronic payments instruments, particularly debit cards, cash usage remains significant in most OECD countries suggesting that electronic alternatives have not succeeded in mimicking all the benefits of cash. It is also shown that electronic alternatives to cash reduce the demand for cash of certain denominations. While debit card usage has reduced the demand for low denomination notes and coins, demand for high denomination notes is generally less affected suggesting that these denominations are also used for non-transactional purposes”.
VI.66 Another point that comes out from international practice of reporting the flow of funds data in respect of different sectors (including households) is that ‘currency and deposits’ are usually reported together and not separately (Source: Points on International Comparison of the Flow of Funds Accounts, Research and Statistics Department, Bank of Japan, December 28, 2000). Important examples are UK, US, Germany, France etc. In cases where they are reported separately, usually a fixed proportion is adopted, example being Japan [where 90 per cent of currency holding is allocated to household sector and remaining 10 per cent to the private non-financial corporations sector (Hagino, Satoru, 2007)].
VI.67 What emerges, thus, from a comparative perspective of Indian approach to flow of funds and household financial savings vis-à-vis select country practices is that our practice of using a fixed proportion and reporting ‘currency’ and ‘deposits’ separately stands on a better footing, in so far as it confirms to detailed flow of funds accounting. Secondly, this practice can be further strengthened by periodic revalidation of the sectoral currency holding patterns, which has been attempted by the HLC subsequently here.
VI.68 However, there was no unanimous opinion about the method of ascertaining the accurate ratio. While some members were of the opinion that to re-examine the ratio there needs to be a comprehensive survey of cash holdings, other members of the HLC felt that since conducting such a survey is costly in terms of time and manpower the latest available flow of funds data might be used in this regard. However, flow of funds data suffers from the problems mentioned by Raj Committee. Moreover, the latest flow of funds data available up to 2000-01 exhibits an average 93.0 per cent ratio for households’ cash holdings.
VI.69 It was decided to work out the household share after deducting from the total currency with public, the shares of organised sectors (like, Government, corporate sector and others) on the basis of RBI data on currency with public as on end-march and the data that CSO provided in respect of ‘currency holding with the Government sector’ and DSIM/ RBI provided in respect of ‘currency holding with the corporate sector’.
VI.70 The revalidation exercise was conducted for 2003-04, 2004-05 and 2005-06 for finding out the percentage of currency that is held by households (Table 6.4). It comes out that the average household currency holding during these three years works out to an average of around 95 per cent of the currency with public.
Table 6.4: Households’ Holding of Currency - An Exercise |
(Rs. crore) |
Item |
2003-04 |
2004-05 |
2005-06 |
1 |
2 |
3 |
4 |
1. |
Currency with public |
|
|
|
| |
Estimated Currency with Institutions: |
314971 |
355863 |
413119 |
2. |
Private Corporate Business |
9270 |
10751 |
14356 |
| |
a) |
Public Limited Companies |
8021 |
9307 |
12553 |
| |
b) |
Private Limited Companies |
1248 |
1444 |
1803 |
3. |
Government |
1466 |
2098 |
1336 |
| |
a) |
Central Govt. & State Govt. & Local Bodies |
-160 |
179 |
-196 |
| |
b) |
Non- Departmental Commercial Undertakings |
1626 |
1919 |
1532 |
4. |
Other Financial Institutions |
2841 |
3047 |
4941 |
| |
a) |
Financial Corporations and Companies |
905 |
1322 |
2823 |
| |
b) |
Insurance Companies |
1936 |
1725 |
2118 |
5. |
Co-operative Societies |
1434 |
1463 |
1493 |
6. |
Household (1-2-3-4-5) |
299960 |
338504 |
390993 |
7. |
Percentage of (6) to (1) |
95.2 |
95.1 |
94.6 |
Note : The sources of data are as follows: currency with public has been taken from DMB, DEAP, RBI. The data relating to private corporate business have been provided by DSIM, RBI. The data for Government have been provided by CSO. The data on other financial institutions have been estimated at RBI from the balance sheets of respective organisations. The data for co-operative societies have been projected from the past trends as the data are available till 2001-02 in NABARD publications. |
VI.71 The simulated results in respect of the impact that different assumptions of household currency holding as proportion to currency with public (assumed at 85.0, 88.0, 90.0, 93.0, 95.0 and 98.0 per cent, respectively under the scenarios I to VI) would have on household financial savings and gross domestic savings are given in Annex A6.2. It can be seen that the impact is marginal with the difference between household savings in currency to GDP ratio vis-à-vis the present estimates (household currency holding assumed at 93.0 per cent of currency with public) ranging -0.1 to 0.1 per cent during the years 1995-96 to 2006-07. The impact is even more marginal when the present currency ratio (at 93.0 per cent of currency with public) is compared with the scenario with the currency proportion at 95.0 per cent.
Recommendations
VI.c Rather than using a fixed ratio like 93.0 per cent, which is a rough approximation, the HLC recommends that the currency held by households as per the latest available flow-of-funds data be considered for the purpose of estimating the currency component for the household sector ’s financial savings estimation. As the latest flow-of-funds data is available up to 2000-01 and significant shift in behavioural ratios (such as currency holdings with the public) might have happened since then with structural changes in the economy, the HLC recommends compilation of flow-of-funds data in a more timely manner to consider different ratios including the ratio of households’ cash holding on a more realistic basis. Therefore, the HLC recommends that the flow-of-funds accounts of the Indian economy need to be compiled regularly and in a more up-to-date manner. There is a need to closely examine the current data gaps and constraints coming in the way of compiling the flow-of-funds accounts regularly.
VI.d Till the flow-of-funds accounts compilation is updated on a regular basis, alternatively, the HLC recommends periodic review of the assumed proportion of the household share of ‘currency with public’. While estimating the household financial savings for a particular year, it may be appropriate to deduct the sectoral currency holdings (to the extent they are available for the organised sectors) from the ‘currency with public’. In case the former is not available, estimates for the year may be approximated by using the latest 2 to 3 years average holdings. This practice may enable to move away from the assumed proportion of the household share of ‘currency with public’ in a phased manner. Therefore, in future, household currency holding can be estimated residually following the method as stated in Table 6.4 for the purpose of estimation of the household financial savings. For this purpose, data on currency held by the corporate sector can be sourced from DSIM, RBI and currency holding by the Government sector can be sourced from the CSO.
Bank Deposits
VI.72 In a typically bank-dominated financial system as India is, bank deposits constitute a prominent instrument of financial savings for households. The relevant instruments here are deposits from (i) commercial banks, (ii) cooperative banks and credit societies and (iii) cooperative non-credit societies.
(i) Deposits with Commercial Banks
Raj Committee
VI.73 The recommendation of the Committee in this regard was as follows.
“The current estimates of the increase in bank deposit holdings of unincorporated enterprises and individuals are based on their ratio to total bank deposits as revealed by the surveys of ownership of deposits (BSR-4) undertaken by the RBI now on a biennial basis. Apart from expediting the survey results, the RBI needs to attempt a classification of the ‘ownership of deposits’ in a manner that would enable us to get a fairly disaggregated picture of the sub-categories owning deposits under the category of ‘individuals’. The data show that the sub-category called “others (including unclassified)” owned as much as 40.7 per cent and 32.1 per cent of commercial bank deposits, in March 1976 and March 1978, respectively. A meaningful classification of such deposits is necessary, particularly in the context of this Working Group’s recommendations on the need to provide a more detailed classification of the household sector into farm households, unincorporated enterprises and households proper in the non-farm sector.”
Chelliah Committee
VI.74 The Chelliah Committee has made the following observation.
“For estimating household savings in commercial bank deposits, aggregate deposits with scheduled and non-scheduled commercial banks are added. Data on aggregate scheduled commercial bank deposits as on the last day of March are specially collected by RBI from these banks. Non-scheduled commercial bank deposits are also obtained as on the last Friday of March. The aggregate commercial banks deposits so obtained are disaggregated into current, savings and fixed deposits by applying the ratios obtained from Form X Statement (which is submitted by all scheduled commercial banks to RBI). Thereafter, non-resident deposits, inclusive of interest thereon, are deducted to obtain domestic deposits, since non-resident deposits constitute foreign savings inflows.
The ratios of holdings of the household sector in current, savings and fixed deposits, excluding the deposits of the banking sector and non-resident deposits, are calculated on the basis of ownership pattern obtained from the Basic Statistical Return (BSR 4) which is concerned with the “Ownership of Bank Deposits by Type and Economic Sector”. The household ownership ratios are applied separately for current, savings and fixed deposits. The household deposits so obtained are then aggregated.”
Regarding the status of BSR 4 surveys, the Chelliah Committee has made the following observations:
“The survey on ownership of deposits with commercial banks which was biennial has been made annual with the latest survey pertaining to March 1993. Similarly the survey results relating to growth of deposits with non-banking companies are available up to March 1992.”
Identification of Data Source
-
Data on total deposits with scheduled commercial banks are obtained from Division of Money and Banking, DEAP, RBI.
-
Form X data are obtained from Division of Money and Banking, DEAP, RBI.
-
Information about deposits under foreign currency, non-residents deposits are obtained from Division of International Finance, DEAP, RBI.
-
BSR survey on “Composition and Ownership Pattern of Scheduled Commercial Bank Deposits” from DSIM, RBI.
Methodology Prescribed
VI.75 Data on commercial banks ’ deposits for each year are available as on last reporting Friday of the respective financial year. Deposits under foreign currency and/or non-resident deposits are excluded from bank deposits. These bank deposits are then bifurcated into current, savings and fixed deposits on the basis of relationship of these categories of deposits observed in Form X, which contains data on liabilities and assets of scheduled commercial banks in India. The share of household deposits in current, savings and fixed deposits is estimated on the basis of RBI annual survey on “Composition and Ownership Pattern of Scheduled Commercial Bank Deposits”. This survey is undertaken every year. From this survey, the table on ownership of bank deposits by type and economic sectors is used for working out household deposits. The household deposits consists of (i) Individuals (including Hindu Undivided Families), (ii) Trusts, associations, clubs etc., (iii) Proprietary and partnership concerns, (iv) Educational Institutions, (v) Religious Institutions and (vi) Others (not elsewhere classified).
Methodology Used
VI.76 The methodology used is generally the same as prescribed.
Validating the Data as well as Result
VI.77 No fixed ratio is used for estimation under this item. The necessary ratios are calculated every year.
Deviations from Prescribed Procedures
VI.78 Since the ownership of deposits by sectors is not available for the year for which estimation of financial savings is done and there is usually a year’s lag, the ratio for the year of the estimation is projected and to that extent there is deviation from the usual practice.
Discussion in the HLC Meetings
VI.79 The HLC noted that the data on deposits with scheduled commercial banks (SCBs) are based on the Survey of Composition and Ownership of Deposits, conducted as a part of BSR system (BSR 4). A stratified sampling design is used for selection of branches of banks for the survey. All the branches of the SCBs in the country are first stratified into basic strata based on State/Union Territory, population group of the centre where bank branch is located, and bank group. The population groups are (i) rural, (ii) semi-urban, (iii) urban, and (iv) metropolitan. Five bank groups, viz., (i) State Bank of India and its Associates, (ii) Nationalised Banks (including IDBI Ltd.), (iii) Regional Rural Banks, (iv) Other Indian Scheduled Commercial Banks or Indian Private Sector Banks and (v) Foreign Banks, are considered for the purpose. Thereafter, each stratum is sub-stratified into 3 size classes of deposits (currently the size classes are ‘up to Rs. 25 crore’, ‘Rs.25 crore and above and up to Rs.100 crore’ and ‘Rs.100 crore and above’) to form the ultimate strata. All branches having deposits of Rs.100 crore and above are included in the sample with certainty. From the other deposit classes, sample is drawn using the simple random sampling (SRS) technique.
VI.80 For example, following the above procedure, sample for March 2006 survey consisted of 10,531 branches of SCBs, out of 68,681 reporting offices as per quarterly BSR-7 return as on March 31, 2006. 2,759 branches, each with deposits above Rs.100 crore were selected with certainty and these branches accounted for 44.8 per cent of deposits as at end-March 2006. 7,772 branches were selected randomly as per the sampling design and these branches accounted for 7.8 per cent of total deposits. Thus, the 10,531 selected branches covered 52.6 per cent of total deposits.
VI.81 The State-wise coverage of sample (both in terms of number of branches and amount of outstanding deposits) is found to be adequate when compared to population level shares (Annex A6.6). The HLC was informed that differences in shares (between population and sample) in certain States are reflection of structure (in terms of size of deposits) of the branches in those States. For example, in the case of Delhi and Maharashtra, where many large branches (with deposits of Rs.100 crore or above) are present, the share of deposits in sample is higher than that in population. This is because all such branches are included in the sample with certainty. Similarly, in smaller States (with fewer branches or with branches with low deposits), the coverage in the sample is higher than in population, to ensure adequate representation of such States in the sample.
VI.82 It is a considered opinion of the HLC that representative nature of the sample study on ownership of deposits with scheduled commercial banks may be given a re-look in view of the predominance of the branches having deposits of Rs.100 crore and above in the sample. Details of the estimation procedure for each spectrum may be clearly stated. The HLC while acknowledging the survey to be a well-designed one considers it necessary that the possible margin of error needs to be provided. It was suggested that there is a need to re-look at the estimation procedure.
VI.83 DSIM, RBI was advised by the HLC to look into the formula and sampling issue. DSIM, in response, assured the HLC that the estimation procedure for future rounds of the survey will be modified so as to generate estimates at the ultimate stratum level (i.e., strata formed by classifying at State/UT X Population Group X Bank Group X Size Class). It also assured that the standard error of estimates will be computed for future rounds of the survey.
VI.84 It was suggested that farmers and non-Government organisations (NGO) should be included as separate categories. Further, it was also suggested by the members that bifurcation of NRE deposits between savings and fixed deposits is available with the Monetary Policy Department, RBI. There is no need to apply a historical ratio to bifurcate this. FCNR deposit can be entirely taken as fixed deposit.
Recommendations
VI.e RBI’s annual survey on ‘Composition and Ownership Pattern of Scheduled Commercial Bank Deposits’ needs to be looked at for further refinement in terms of :
VI.f In view of the emerging importance of farmers and institutions like NonGovernment Organisations (NGOs) and self-help groups (SHGs) in the financial system and also from the perspective of policy issues, the HLC recommends that such unincorporated non-profit institutions be treated as separate categories under households. Accordingly, there is need to capture these entities in the returns for deposits provided by banks to the RBI.
VI.g Since the ownership of deposits by sectors is not available for the latest year for which estimation of financial savings is undertaken and there is usually a year’s lag, the ratio for the year of the estimation needs to be projected. In this pursuit, an appropriate statistical basis for arriving at the ratios of household ownership in deposits (like using the average for the latest 2 to 3 years) needs to be arrived at through a consultative approach among various institutions such as the CSO, RBI, etc.
VI.h Presently, as per the existing method in the compilation of household financial savings, use is made of Section 42 data (as of the last reporting Friday of the year) for data on commercial banks’ deposits for each year while Form X data on liabilities and assets of scheduled commercial banks in India for the bifurcation of deposits into current, savings and fixed deposits, the latter being on end-March basis, and the Ownership Pattern of Scheduled Commercial Bank Deposits on an end-March basis. There is, thus, a need to standardise the database for the estimation of household deposits by using consistently the March 31 figure in place of the last reporting Friday of March. This is available for every year with a lag of three to four months.
(ii) Deposits with Co-operative Banks and Credit Societies
Raj Committee
VI.85 There is no specific suggestion by the Raj Committee for this particular instrument.
Chelliah Committee
VI.86 The Chelliah Committee has made the following suggestions.
“Data on assets and liabilities of all the co-operative societies are published in ‘Statistical Statements Relating to Co-operative Movement in India – Part I – Credit Societies, Part II – Non-Credit Societies’ by the National Bank for Agriculture and Rural Development (NABARD). Deposits with primary societies are taken as household deposits, while in the case of co-operative banks and other credit societies the household deposits are estimated using the information available on ownership pattern which gives details of such deposits. Individual deposits are treated as household deposits. Similar treatment is given to deposits with non-credit societies. As NABARD publications referred to above become available generally with a long time lag, the total deposits of the co-operative banks and credit societies are estimated for recent years using the deposit figures of co-operative banks, as available in NABARD’s summary publications, viz., ‘Important Items of Data, Credit and Non-credit Co-operative Societies’. The deposits are derived on the basis of the household’s share in total deposits as obtained through additional returns received by RBI from co-operative banks and credit societies. The flow of such deposits during a year represents household savings in such deposits. As regards non-credit societies, the estimation of household deposits is worked out on the basis of available data.”
Identification of Data Source
VI.87 The source of data for this item is the publication ‘Statistical Statements Relating to the Co-operative Movement in India’ (NABARD).
Methodology Prescribed
VI.88 Data on deposits of the households in co-operative societies and banks available annually from the publication ‘Statistical Statements Relating to the Co-operative Movement in India’ (NABARD) is made use of. The data is directly available in the above publication for different tiers of co-operative banks.
Methodology Used
VI.89 The data is estimated on the basis of past trends in growth rate or some other judgmental basis because of non-availability of those publications on time. Generally, there is a lag of six to seven years in the publication.
Validating the Data as well as Result
VI.90 Because of the unavailability of the NABARD publications in time, the item needs to be estimated on the basis of past trends in growth.
Deviations from Prescribed Procedures
VI.91 Because of the unavailability of the NABARD publications on time, there is deviation from the prescribed methodology. Till NABARD publications are made available on time, there is a little scope to improve on this account.
Discussion in the HLC Meetings
VI.92 The HLC felt that the data provided by NABARD to RBI as per the sectoral break-up indicated in the “Statistical Statements Relating to the Co-operative Movement in India” is appropriate from the point of view of computation of household financial savings. The timeline is an issue, which was discussed with the NABARD representative in the HLC’s meeting with Apex Bodies on March 14, 2008.
VI.93 According to NABARD, the data for the “Statistical Statements Relating to the Cooperative Movement in India” is compiled on the basis of audited data submitted by the State level and District level agencies. The data pertaining to the State Cooperative Banks (SCBs), District Central Cooperative Banks (DCCBs), State Cooperative Agriculture and Rural Development Banks (SCARDBs) and ICBs are compiled and forwarded by the respective agencies and the State level and national level consolidation for each of the agencies is done by NABARD. In the case of all other primary credit societies and all non-credit societies, the data is consolidated at the State level by the Registrar of Cooperative Societies (RCS)/ Functional Registrars/Concerned Directorates of individual States, and the national level consolidation is done by NABARD for each category of society.
VI.94 Collection of data is through a set of structured tables (51 input tables) from the SCBs/DCBs/ICBs/SCARDBs/RCS. These 51 formats used for collection of data have been adopted on the basis of the recommendations of the Review Committee on Co-operative Statistics, Department of Agriculture and Co-operation, Government of India and have been distributed to all the reporting agencies along with the guidelines for filling up the formats. Validation of data is done through a variety of approaches which include rechecking the data in the Annual Reports and Balance Sheets of the respective agencies and comparing the previous year’s tables. In case of discrepancies, clarification is sought from the concerned agencies.
VI.95 NABARD held the view that although data is submitted by the RCS to NABARD in a standard format, no standard system has been evolved for collection of data from primary society level for further consolidation at different levels. Effective and timely collection and compilation of co-operative statistics would be possible if all the co-operative organisations are required to submit the data in a prescribed format, annually. As various other agencies viz. National Federation of State Co-operative Banks (NAFSCOB), National Cooperative Union of India (NCUI) are publishing some basic data on credit and non-credit societies, Government of India may be requested to consider modification of the formats and make them uniform with those used by other agencies, so that the reporting agencies could submit the data in the same format to all the compiling agencies.
VI.96 The HLC has learnt that the delay with respect to co-operative data is on account of consolidation of data at the district, State and national level. Furthermore, the delayed submission of data is due to delay in the audit of the societies. It is felt by the HLC that provisional data may be published without much delay with subsequent correction after audit of the data.
VI.97 In this regard, a conclave with the RCS was organised by NABARD and held at Bankers’ Institute of Rural Development (BIRD), Lucknow on May 9, 2008 for sensitizing the Registrars of Cooperative Societies RCS about the issue of data from the cooperative sector where they play a major role. In this meeting, the Chairman, NABARD highlighted that the statistical database of the cooperative sector is extremely important not only for NABARD, but also RBI and Government, and drew the attention of RCS to reduce the time lag and that the lag should not be more than a maximum of one-year in publication of ‘Important statistics relating to cooperative movement in India’, the latest available being for the year 2001-02.
VI.98 It was clarified by Dr. Shetty, who was representing the HLC, that presently the weak areas of data base are being examined by the HLC, which has identified cooperative sector as one such weak area and for which NABARD as the apex body is expected to play a major role in making the data available to the agencies. A clear-cut action point emerged in the conclave that RCS will ensure posting of suitable staff for posting of data and their timely submission so that auditing can also be taken up early.
VI.99 An issue that there is heterogeneity in the pattern of receipt of audited Statements from States, such that while some States submit in time, some States delay in submission resulting in a situation where NABARD at any point will have in their possession some information. In such a situation, under the most ideal situation, the lag of one year in the NABARD publication may be difficult to achieve. Hence, the HLC feels that NABARD may supply the provisional estimates/projections based on the latest receipt position of cooperative data from RCS every year to RBI for household financial savings (for instruments like, deposits, credit and investment in shares and debentures all for households) and flow of funds and to CSO for national income accounting, as these estimates are to be prepared year after year in a time-bound manner.
VI.100 As a follow-up measure, Chairman of NABARD (vide his letter DO. No. NB.IDD/824/ CSD-32/2008-09 dated July 1, 2008) has informed the HLC that NABARD has advised all RCS to sensitize the officials at the grass root level through a capacity building (training) module to ensure that the quality data on cooperatives are made available to NABARD at least with a lag of one year. NABARD’s regional offices/training establishments are being instructed to get in touch with RCS as well as their district-level functionaries to ensure their participation in capacity building programme organised by NABARD, which in turn will help in bridging the data gaps in content, coverage and timeliness in respect of cooperative societies.
Recommendations
VI.101 While the HLC recognised the reasons for delay in the NABARD publications, it was pleased to have favourable response from NABARD in their effort to streamline the data issues. Accordingly, the HLC recommends the following:
VI.i In the light of genuine difficulties expressed by NABARD in regularly compiling the comprehensive data, NABARD may endeavour undertaking “projections”, which could be revised when firm data become available. The data issues need to engage the attention of the highest level in NABARD. In this context, the HLC recommends that NABARD should be involved in providing a projection of household deposits in co-operative banks and credit societies to get around the problem of considerable time-lag in the publication such as ‘Statistical Statements Relating to the Co-operative Movement in India (Credit and Non-credit societies)’.
VI.j All efforts should be undertaken to improve the time gap in the publication ‘Statistical Statements Relating to the Co-operative Movement in India (Credit and Non-credit societies)’, a process that is said to be underway at the NABARD.
(Action: NABARD)
VI.k NABARD should continue in its role as the nodal agency for the co-operative sector and provide data for the compilation of national accounts, savings estimates and FoF accounts in so far as the cooperative sector is concerned (Annexes A6.5.3 and A6.5.4). In this regard, NABARD may collaborate with National Federation of State Co-operative Banks (NAFSCOB), National Cooperative Union of India (NCUI) as these agencies are publishing some basic data on credit and non-credit societies.
(Action: NABARD, NAFSCOB and NCUI)
(iii) Deposits with Co-operative Non-credit Societies
Methodology Prescribed
VI.102 Data on deposits of the households in co-operative societies and banks available annually from the publication ‘Statistical Statements Relating to the Co-operative Movement in India’ (NABARD) is made use of. The data is directly available in the above publication for different tiers of co-operative banks.
Methodology Used
VI.103 The data is estimated on the basis of past trends in growth rate or some other judgmental basis because of non-availability of those publications in time. Generally there is a lag of six to seven years in publication.
Validating the Data as well as Result
VI.104 Because of the unavailability of the NABARD publications in time, the item needs to be estimated on the basis of past trends in growth.
Deviations from Prescribed Procedures
VI.105 In view of the non-availability of the NABARD publications in time, there is deviation from the prescribed methodology. Till NABARD publications are made available in time, there is a little scope to improve on this account.
Discussions in the HLC Meetings
VI.106 Discussions in the HLC meetings were on the lines as described above in the case of deposits with co-operative banks and credit societies.
Recommendations
VI.1 Considering the similarity in the nature of issues, the HLC’s recommendations pertaining to cooperative credit societies may be applied to the cooperative non-credit societies as well.
(Action: NABARD)
Non-Banking Deposits
VI.107 Non-banking companies consist of financial and non-financial Government and non-Government companies and electricity boards.
Raj Committee
VI.108 The observations/recommendations made by the Raj Committee with respect to non-banking deposits are as under.
“Estimates of household deposits with non-banking companies are made by the CSO on the basis of the RBI surveys on ‘Growth of Deposits with Non-banking Companies’. Serious doubts have been expressed regarding the adequacy of the coverage of non-banking companies, particularly in the non-financial category, which accept deposits from the public. Studies in the RBI have shown that in respect of the non-financial companies, the total public deposits even for the sample companies turned out to be higher than the total deposits for all companies revealed in the above surveys. This is an important area of household savings, particularly in the context of assessing household preferences for financial assets with higher yield. Therefore, it is imperative that steps are taken in the RBI to ensure adequate coverage of the non-banking companies in the survey of their deposits. Also, recently the fully Government-owned public sector undertakings began accepting deposits from the public. Arrangements may be made in the RBI to cover them also in the above surveys. Security deposits kept by households with various improvement trusts, housing boards and electricity boards should be treated as household savings in the form of deposits and should be accounted for as such in the estimation.”
Chelliah Committee
“Chelliah Committee held the view that information regarding deposits of households with Housing Boards and Telephone companies (similar to the treatment given to electricity boards) need to be collected and included as part of financial savings.”
Instruments
VI.109 The instruments are deposits from financial and non-financial companies, both for Government and non-Government companies.
Identification of Data Source
-
Public deposits data, in respect of financial companies, are obtained from the Department of Non Banking Supervision (DNBS), RBI.
-
Housing financial companies from National Housing Bank.
-
Studies on Finances of Public Limited Companies and Finances of Private Limited Companies, DSIM, RBI.
-
Returns from State electricity boards.
Methodology Prescribed
VI.110 The non-banking financial companies are broadly classified into (i) registered and regulated by RBI (ii) not registered with RBI but RBI issues direction relating to deposits acceptance activity and (iii) exempted from RBI regulations including requirement of registration. Under category (i) loan companies, investment companies, equipment leasing companies, hire purchase finance companies and residuary non-banking finance companies are included. Mutual benefit finance companies (notified Nidhis), Mutual benefit companies (potential Nidhis) and miscellaneous non banking companies (chit fund companies) are included under second category. Category (iii) includes insurance companies, stock exchange, stock brokers, merchant banking, housing and micro finance companies.
VI.111 The data source for estimation of household sectors’ deposits with non-banking companies, excepting SEBs, was used to be the RBI surveys on ‘Growth of Deposits with Non-banking Companies’ and studies on company finances published in the RBI Bulletin from time to time. As the survey has been discontinued after 1995-96, public deposits data, in respect of financial companies, are obtained from the Department of Non-Banking Supervision (DNBS) of RBI and for housing finance companies from National Housing Banks. The breakup of such deposits into Government and non-Government is obtained based on 1995-96 survey. In respect of non-Government non-financial companies, public deposits data available in the RBI studies on Finances of Public Limited Companies and Finances of Private Limited Companies is used. For non-financial Government companies, estimates are made based on the ratio as per the survey on Growth of Deposits with Non-banking Companies. That is, on the basis of DNBS survey, the ratio of Government to non-Government non-financial companies is calculated and this ratio is applied to non-Government non-financial companies’ data. The total security deposits of consumers for supply of power available from the annual reports of SEBs do not provide separate details of deposits by the households. The share of household deposits in the total security deposits is worked out by allocating it on the basis of the household share in total consumption of electricity.
Methodology Used
VI.112 The methodology for the non-banking financial companies is same as per the prescription. However, Studies on Finances of Public Limited Companies and Finances of Private Limited Companies, by DSIM, RBI are not available on time. More serious problem is that the blow-up factor for arriving at the global figures from the sample has not been available with DSIM for recent years. Therefore, the deposits of non-banking non-financial companies are estimated on the basis of last three years growth. The data on State electricity boards are obtained with a lag. Therefore, this item is also estimated on the basis of past trends in growth.
Validating the Data as well as Result
VI.113 The estimation of non-banking deposits of financial companies are based on actual data. In the absence of a blow up factor it is not possible to validate the data on non-banking non-financial companies. The State electricity boards’ data are validated at the time of compilation of flow of funds.
Deviations from Prescribed Procedures and Reasons thereof
VI.114 As noted above, there is no deviation for non-banking deposits of financial companies. However, estimation on the basis of past trend is worked out for non-banking non-financial companies and State electricity boards. Moreover, the break-up for Government and non-Government sectors are worked out through historical ratio obtained from the Survey of 1995-96.
Discussion in the HLC Meetings
VI.115 The HLC noted that the data source for estimation of household sectors’ deposits with non-banking companies, excepting SEBs, was used to be the RBI surveys on ‘Growth of Deposits with Non-banking Companies’ and studies on company finances published in the RBI Bulletin from time to time. As the survey has been discontinued after 1995-96, public deposits data, in respect of financial companies, are obtained from the DNBS of RBI and for housing financial companies from National Housing Bank. There is a need that RBI survey on ‘Growth of Deposits with Non-banking Companies’ is redesigned, keeping in view the fact that the unregistered companies are not covered in the data reported to the Department of Non-banking Supervision.
VI.116 The HLC observed that data gaps exist for a part of non-banking financial companies, which are partially covered at present. Non-banking financial companies can be grouped into three categories, viz., (i) companies registered with the RBI, (ii) those applied for Certificate of Registration but rejected by the RBI, and (iii) companies registered with Department of Company Affairs but exempted for registration with the RBI. According to the Department of Company Affairs, Government of India, there were 65,382 NBFCs as on March 31, 1999. The comprehensive regulatory framework for NBFCs was introduced by the RBI in January 1997 and it made it compulsory for all financial companies to register with the RBI. As many as 37,274 companies, which were conducting financial business, applied for Certificate of Registration (CoR) with the RBI as on June 30, 2000. Of these, 679 companies were approved for registration with permission to accept public deposits, 8451 were approved for registration without authorisation to accept public deposits, and 14,986 were rejected for issue of Certificate of Registration. Applications of 13,158 companies were at various stages of consideration (RBI, 1999-2000). Thus, as per the available data, only 57 per cent of the companies have applied for CoR and all those, which have applied have not been given the certificates as they have not met the prescriptions set by the RBI for registration.
VI.117 Amendment to the Reserve Bank of India Act, 1934 in 1997 gave comprehensive powers to the Reserve Bank to regulate the NBFCs. The amended Act, inter alia, provided for compulsory registration of all NBFCs. NBFCs can be classified into two broad categories, viz., (i) NBFCs accepting public deposit & (ii) NBFCs not accepting/holding public deposit. Total number of NBFCs registered with the RBI, consisting of NBFCs-D (Deposit taking NBFCs), RNBCs, mutual benefit companies (MBCs), miscellaneous non-banking companies (MNBCs) and Nidhi companies, declined from 13,014 at end-June 2006 to 12,968 at end-June 2007. The number of NBFCs-D declined from 428 as at end-June 2006 to 401 as at end-June 2007. Of the 401 deposit taking NBFCs, 362 NBFCs filed annual return for the year ended March 2007 by the cut-off date of September 30, 2007 (RBI, 2006-07).
VI.118 According to the Department of Non-Banking Supervision (DNBS), RBI, all NBFCs, which are registered with the Department of Company Affairs, need to apply to RBI for CoR for undertaking the banking/finance activity. Therefore, an NBFC cannot exist or function as a financial company without the CoR from RBI. This, however, is the technical or legal position. In reality, there are small size companies carrying on financial activities without explicit authorisation; they even accept deposits from the public (Report of the Committee on Informal Financial Sector Statistics, RBI, March 2001). There also exists a set of companies, which are rejected by RBI for issue of CoR on grounds of not complying with the extant prescription within a stipulated period, including the extension period and have to close down their business activity. These companies are also supposed to submit annual Statements on liabilities and assets in the prescribed Form. But, the response from the rejected companies is very less as only about 25 per cent of the companies submit the return.
VI.119 All NBFCs incorporated under the Companies Act are supposed to be registered with the Department of Company Affairs (DCA), Government of India. There is, however, a big chunk of financial companies at present, which are not registered with the RBI. For instance, of the 65,382 companies, only 37,274 companies applied for CoR as on June 30, 2000, implying that 28,108 companies exist without applying for registration with the RBI and conducting financial activities. Further, a set of companies have been exempted from registration with the RBI, which are (i) engaged in micro-financing activity, (ii) licensed under 25 of the Companies Act, 1956, (iii) not accepting public deposits; and (iv) mutual benefit companies in existence as on January 9, 1997 and having net owned funds of Rs.10 lakhs.
VI.120 The HLC is of the view that in respect of companies which have either not applied / been rejected for issue of CoR or are exempted from registration, there is a need to firm up the database. As observed by the Committee on Informal Financial Sector Statistics, RBI, March 2001, these companies are carrying on financial activity including accepting of public deposits. There is a need to ascertain an estimate of the quantum of household savings channelising into these entities.
VI.121 It was deliberated at length in the HLC meetings that estimation related to the deposits with non-banking companies is an important area of concern. It was conceded that there exists a large data gap in the estimation of household savings in the form of deposits with non-banking companies. This data gap is because of non-inclusion of a wide array of unregistered companies, which do not report to the Department of Non-Banking Supervision. Another issue discussed in the HLC was with regard to household deposits with Mahanagar Telephone Nigam Limited (MTNL) and Housing Boards, which according to the Chelliah Committee were to be incorporated in household financial savings. The HLC discussed the appropriateness of such a methodological change and took the view that these do not fall under the category of savings; they are rather advances against future consumption of the respective services in certain cases.
VI.122 Presently, data on deposits from the public are in the form of FD, RDs, etc., and deposits received by a public company from its shareholders (shown under ‘regulated deposits’) and money received from employees of the company by way of security deposits or advance from purchasing, selling or other agents in the course of company’s business (shown under ‘exempted borrowings’) of housing financial companies. These data are provided by NHB regularly, which is used in the household savings estimates. The HLC discussed with NHB the feasibility of NHB providing the information on household deposits with housing boards. It was clarified that housing boards are under the control of the State Governments and there exists no consolidated database of household deposits with housing boards as such. The HLC was also told that although the housing boards have been authorised to collect household savings under the I.T. Act, it was gathered from a few of the leading housing boards (e.g. Tamil Nadu, Karnataka, Andhra Pradesh, Rajasthan and Himachal Pradesh) that no public deposits have been accepted by them till date. Though NHB has no direct regulatory powers to collect such information from the housing boards, NHB may request all the housing boards in the country to get the information even in the case of ‘Nil’ information for the benefit of the Committee. The NHB agreed to make an attempt on a ‘best effort’ basis.
Recommendations
VI.m As the discontinuation of the survey on “Growth of Deposits with Non-banking Companies” since 1995-96 puts constraints on a reliable estimation of household deposits with non-banking companies, the HLC recognises that there exists a large data gap in the estimation of household savings in the form of deposits with non-banking companies, because of non-inclusion of a wide array of unregistered companies. Hence, the HLC recommends that a census should be conducted on a regular basis, say once in five years, covering all companies incorporated with the Department of Company Affairs. The census should collect data on assets, liabilities, income and expenditure of NBFCs including the unregistered/exempted category of NBFCs. The census should be conducted by DSIM, RBI in collaboration with the Department of Company Affairs, Government of India, if necessary by outsourcing the same. It may be noted that this is in consonance with the recommendations made earlier by the Committee on Informal Financial Sector Statistics, 2001 (Chairman: P. Venkataramaiah).
(Action: RBI)
VI.n The HLC recommends that the data emerging from the census on the assets/ liabilities position of the NBFCs should be appropriately incorporated in the flow-of-funds accounts also.
(Action: RBI)
VI.o In respect of companies registered with the RBI, the RBI should provide the necessary details of deposits of public. Data for registered companies have to be firmed up with appropriate consolidation of data and follow up if response is weak. For the unregistered companies, sample studies will have to be undertaken and their results will have to be used after establishing proper blow-up factors.
(Action: RBI)
Life Insurance Funds
VI.123 It is recognised that contractual savings are a prominent instrument preferred for deploying savings by households. Life insurance is essentially contractual in nature. Household savings through insurance schemes is measured as changes in the life fund. In case of the Life Insurance Corporation, such savings strictly arising out of its life insurance business in India (net of transfer to Government), attributable to the policyholders is estimated. The life insurance business is primarily considered as a conduit of savings of the household sector and as such the savings of the LIC arising strictly out of its life insurance business (net of the transfer to Government) is regarded as accruing to the policy holder and, therefore, included in the estimates of savings of the household sector.
Instruments
VI.124 The instruments are life fund of LIC, life fund of private insurance companies, postal insurance and life annuity funds, central and State Government insurance fund.
Identification of Data Source
• Annual report of LIC,
• Special returns obtained from private insurance companies,
• Relevant data from CSO.
Methodology Prescribed
VI.125 Households ’ savings in the case of LIC is estimated as net accruing liability or an increase in the life funds of the LIC and bonus to policy holders excluding Government share in profit, capital gains and old claims. Similarly households’ savings in the case of private life insurance companies is estimated as an increase in the life funds. Savings in the form of postal life insurance, State Government’s life insurance and Central Government employees’ group insurance scheme is estimated as the excess of receipt over payments. Receipts include subscription realised, interest accrued, etc., while payments comprise payment of loans to policy holders, payment of insurance amounts after maturity or death and payment for other miscellaneous charges. The data on postal life insurance, central Government employees’ group insurance scheme and State insurance are available from the annual reports of the Department of Post and Telegraph and the budget documents of the Central/State Governments, respectively. However, the final figures for these items are made available by the CSO.
Methodology Used
The methodology used is same as that has been prescribed.
Validating the Data as well as Result
The data are on the basis of actual figures taken directly from the flow.
Deviations from Prescribed Procedures
There has been no deviation from the prescribed procedure.
Discussion in the HLC Meetings
VI.126 The household financial savings in life-funds of different schemes floated by insurance companies – both in the public and private sector – are emerging as an important instrument for household savings. It was felt that IRDA should be engaged in providing data relating to life funds operated both in the public and private sector.
VI.127 Presently, the information on life funds is collected from individual institutions. The HLC felt that the requirement of data is of very diverse kind for an accurate estimation and there is also a need to cross-validate the information for individual institution with information from apex bodies. In this regard, the following issues were discussed:
VI.128 Life fund is a contractual savings wherein a policyholder makes regular premium payments towards a policy that will mature when he or she reaches a certain age, or, alternatively, in the event of the policyholder’s death before maturity of the scheme. Such payments are also typically made over a long period of time, and also give rise to an accumulated fund that can be invested to generate further returns for the policyholder.
(i) As per the Chelliah Committee, in the case of LIC, this covers increase in the life fund and bonus to policy holders excluding Government share in profit, capital gains and old claims. Presently, these data are collected from individual institutions. The HLC felt that this estimate should be cross-validated with the estimate of the apexbody, i.e., IRDA, and accordingly there was discussion with IRDA on the format for collection of such data from Insurance companies containing three sub-heads, like (a) Life Funds; (b) Bonus to Policyholders and (c) Loans and Advances from the insurance sector.
(ii) According to the IRDA representative, given the nature of the non-life industry, it automatically was outside the purview of the analysis. Over recent years, there has been a shift in the manner in which insurance has been underwritten in the country and there has been a perceptible shift towards unit linked insurance products. Thus, households’ savings through these avenues too needs to be captured. As the manner of capturing the data is stock position, the funds under management (AUM) under both the traditional products and the ULIPs would need to be captured.
(iii) On the issue of the drawals through loans, it was indicated by the IRDA that the Policyholders ’ loans are captured as a separate line item. The net position of savings through the AUM less the policyholders’ loans (borrowings from the insurance companies) would, thus, reflect the net savings by the household sector in a given year. In such a scenario, the bonus component also gets built into the information on AUM. In addition, what is required is to get the data on the insurance institutions’ ‘loans to their staff.’
Recommendations
VI.p The HLC recommends that the IRDA should be involved in the household financial savings estimation by way of providing regular information on ‘life funds’ consolidated for all insurance institutions – both in the public and private sector in the format prescribed in this Report (A6.5.5).
(Action: IRDA)
VI.q To net out the household liabilities against assets in respect of the insurance sector, the IRDA may arrange to get the required data on the insurance institutions’ ‘loans to their staff’ in addition to the policy-holders.
(Action: IRDA)
VI.r The RBI may approach the IRDA to provide combined balance sheet for all insurance institutions – public and private - as per the flow-of-funds format. This will go a long way in the IRDA providing an alternative database not only for ‘life fund’ but also for flow-of-funds compilation at the RBI from time to time (A6.5.6).
(Action: IRDA)
Provident and Pension Funds
VI.129 Provident and Pension funds belong to the contractual category of instruments of financial savings often preferred by households for deployment of their savings.
Raj Committee
VI.130 The relevant observations/recommendations of the Raj Committee with respect to household savings in provident fund are given below.
“In the estimation of savings of the household sector in net financial assets, the loans and advances taken by the employees of the non-Government educational institutions are not taken into account; only their contribution to the provident funds is estimated. This tends to inflate savings in this medium. To obviate this and to arrive at net accretions to provident funds, it is necessary that the ratio of the deposits to loans and advances to the employees applicable for the Government institutions, should be applied to the provident funds of the educational institutions of the private sector.
In the case of some private institutions, the provident funds of the employees are deposited with the Post Offices in the form of small savings. Care should be taken to avoid any duplication in this regard.”
Instruments
VI.131 The instruments are: (i) Central Government Provident Fund, (ii) Public Provident Fund, (iii) State Government Provident Fund, (iv) Non-Government Provident Fund, and (v) Pension Funds and New Pension Scheme.
Identification of Data Source
-
Data from CSO,
-
Special returns and annual reports from non-Government provident funds like port trusts, dock labour boards etc,
-
Special return from Department of Government and Budget Accounts (DGBA), and
-
Special returns from Ministry of Finance for new pension scheme.
Methodology Prescribed
VI.132 Employees ’ savings in the form of provident fund (PF) is through PF schemes which are either contributory or non-contributory in nature. In the former scheme the employers and the employees both contribute to the PF. The total contributions minus withdrawals plus interest credited to PF account constitute the savings of the employees. Information on PF contributions relating to Central and State Governments and Public PF Scheme is culled out from the budget documents and also available on request from CSO. For want of requisite data on PF of employees of local authorities, the same is estimated as 6 per cent of wages and salaries paid to the employees of these authorities. Non-financial statutory corporations include Air India, Indian Airlines and other statutory corporations. Figures of PF relating to Air India and Indian Airlines are collected from these institutions. For other statutory corporations information is culled out from their respective annual reports. The PF contribution by the employers as available in the annual reports is doubled to include the employees’ contributions. For want of requisite data no adjustments are made for withdrawals, interest accrued and the employees’ contributions made in excess of the minimum prescribed limit. Information on PF of RBI and Commercial Banks is obtained from the RBI while for others the same is obtained from respective institutions or their annual reports. No data are available on PF contributions of the employees of various nonGovernment educational institutions. This has been estimated up to 1981-82 on the basis of wages and salaries to the employees in all recognised non-Government educational institutions. Employees’ contribution to the PF is estimated assuming that it forms 6.25 per cent of the wages and salaries. Since 1982-83, the PF of this category is included under Employees PF Scheme, 1952 and as such no separate estimates are prepared.
VI.133 Data relating to the PF contributed by the employers and the employees of various establishments covered under the Employees’ Provident Fund Act, 1952 are made available by the Central Provident Fund Commissioner (CPFC) through CSO. Data on PF contributions by the employees of Dock Labour Boards and Port Trusts are also collected from each Board/ Trust. The data on New Pension Scheme is obtained through a special return from MoF. This item has been included from 2004-05.
Methodology Used
VI.134 The methodology used is the same as has been prescribed except for two items, viz., non-Government provident fund and pension fund. These two items are estimated on the basis of past trends in growth.
Validating the Data as well as Result
VI.135 Most of the data items are obtained from actual data. For the remaining two items the data are reconciled at the time of preparation of flow of funds accounts.
Deviations from Prescribed Procedures
VI.136 The prescribed methodology is partially followed for this item, due to nonavailability of data for two items, viz., non-Government provident fund and pension fund.
Discussions in the HLC Meetings
VI.137 The HLC on discussion with the CSO felt that the existing system may be continued.
Recommendations
VI.s As the present system of estimation of household savings in provident and pension funds is reasonably satisfactory, the HLC recommends that the existing system may continue.
(Action: CSO)
VI.t Since there is a need to capture household savings in the form of pension funds, the relevant apex body, namely, the Provident Fund Regulatory and Development Authority (PFRDA) should collect and disseminate such information on a regular basis.
(Action: PFRDA)
Vi.u The share of 6.0 per cent of wages and salaries paid to the employees of local authorities as their savings in PF is based on an old exercise conducted by the CSO. Therefore, the HLC recommends that the CSO should conduct a fresh study to update this ratio and keep it updated from time to time.
(Action: CSO)
Claims on Government
VI.138 Certain categories of ‘Claims on Government ’, namely ‘small savings’, are a major financial instrument for household savings in India.
Instruments
VI.139 The instruments are: (i) Small Savings, (ii) Investment in Government Securities, (iii) National Rural Development Bonds, (iv) National Deposit Scheme, (v) Capital Investment Bonds, (vi) Deposit scheme for retiring Government employees, (vii) relief bonds and savings bonds, (viii) compulsory deposits, and (ix) special bearer bonds.
Identification of Data Source
Identification of Data Source
-
Budget documents and Division of Central Finance and Division of State and Local Finance of DEAP, RBI,
-
Department of Government and Budget Accounts (DGBA), RBI, and
-
Information from CSO.
Methodology Prescribed
VI.140 It includes investment in Government securities, small savings, bearer bonds, capital investment bonds, national rural development bonds, national deposit scheme, compulsory deposits and other such schemes brought out by the Government from time to time, less household ’s net borrowing from the Government. The household investment in Government securities is estimated on the basis of data on sale of total securities available in the budget document of the Central and State Governments using the proportion of securities purchased by the households to total securities obtained from the RBI survey on ‘Ownership of Central and State Government Securities’. In the absence of data, no corresponding estimates relating to local authorities can be prepared. The small savings comprise national savings certificates, national plan savings certificates, post office savings bank deposits, post office cash certificates and defence certificates, cumulative time deposits, national defence certificates, treasury savings deposit certificates and annuity deposits, Indira Vikas Patras and Rahat Patras etc. The bearer bonds, capital investment bonds, national rural development bonds, national deposit schemes and compulsory savings are taken from the budget documents of the Central Government. The households’ share is derived by adjusting the investment made in small savings out of provident fund contributions and deposit linked insurance funds. The investment in small savings out of provident fund contributions by the employees is worked out on the basis of information obtained from provident fund institutions on the pattern of investment of provident fund contributions. Information on capital investment bonds, national rural development bonds, national deposit schemes, etc., is obtained from the Department of Government and Budget Accounts (DGBA), RBI.
Methodology Used
VI.141 The RBI survey on ownership of Government securities has been discontinued since 1992. Therefore, historical ratios of 0.13 and 0.06 are taken as household shares in Government securities.
Validating the Data as well as Result
VI.142 In the absence of survey on ownership pattern of Government securities, there is no scope to validate the data on households’ investment on Government securities. The data on other items are validated by CSO’s estimates.
Deviations from Prescribed Procedures and Reasons Thereof
VI.143 Apart from the investment in Government securities, there is no deviation from the prescribed procedure. The reason for deviation in the former case is the absence of the survey of ownership pattern of Government securities. Therefore, the estimate for this item is being carried out with historical ratios.
Discussion in the HLC Meetings
VI.144 It was discussed in the HLC meetings that estimate of household investment in Government securities (both Centre and States) needs to be firmed up. Presently, the share of households in the total sale of Government securities is obtained from the RBI survey on ownership of Central and State Government Securities published in the December 1994 issue of the RBI Bulletin. In this connection, the HLC noted that the work on the last survey on ownership of Central and State Government Securities was initiated in 1991 and it was published as ‘Ownership of Government Rupee Securities: Outstanding as on March 31, 1990 and Preliminary Trends in 1991 and 1992’ in December 1994 issue of RBI Bulletin. Subsequently, the survey was discontinued and in its place a Table titled ‘Ownership Pattern of Central and State Government Securities’ has been published in the Handbook of Statistics on Indian Economy since 1999-2000. This table, however, covers only a part of the household sector such as ‘employees provident fund scheme’ and ‘coal mines provident fund scheme’. Therefore, the HLC felt that a revised format on the ownership pattern of Government securities comprising six categories, viz., 1) Government, 2) Banks, 3) Financial Sector Other than Banks, 4) Non-Service Sector (Corporates, Firms and Societies), 5) External Sector and 6) Household Sector, may be prepared and sent to IDMD, RBI to provide the data based on the revised format as at end-March of every year.
VI.145 It may be mentioned that at the instance of the HLC, IDMD, RBI has put in place a data generating mechanism to provide information along the above lines for estimation of household savings under Government securities.
Recommendation
VI.v The HLC recommends that an appropriate format as prescribed in this Report on the ownership pattern of Government securities (consolidated for all levels of Government), comprising six categories, viz., 1) Government, 2) Banks, 3) Financial Sector other than Banks, 4) Non-Service Sector (Corporates, Firms and Societies), 5) External Sector and 6) Household Sector, may be prepared by the RBI to provide the data based on the revised format (Annex A6.4) as at end-March every year, so that the residual status can be accorded to household (as defined in national accounts and FoF framework) in this instrument. The concerned Department within the RBI should ensure the providing of such information for estimation of household financial savings estimates.
(Action: RBI)
Shares, Debentures, Mutual Funds and Commercial Bonds
VI.146 Households route part of their financial surplus in the private corporate and the Government sectors, through the capital market by investing in shares and debentures of non-Government companies, cooperative institutions, Government companies, including banks and financial institutions such as UTIMF and other mutual funds.
Instruments
VI.147 The instruments are household investment in: (i) Banks, (ii) UTI mutual fund schemes (iii) mutual funds other than UTIMF, (iv) Private corporate business, and (v) Public sector bonds.
Raj Committee
VI.148 The relevant observations/recommendations of the Raj Committee with respect of household savings in the form of shares, debentures and bonds are as follows.
“In the estimation of household savings in the form of shares, care should be taken to ensure that the estimates in regard to bonus shares are not duplicated at any stage.”
Identification of Data Source
-
NABARD’s publication ‘Statistical Statements Relating to Co-operative Movement in India’,
-
Special return from Unit Trust of India Mutual Fund (UTIMF),
-
Special returns from private mutual funds,
-
RBI studies on joint stock companies,
-
Paid-up capital figures from Ministry of Company Affairs,
-
Information from Ministry of Finance,
-
Information from Capital Market Division (CMD), DEAP, RBI, and
-
SEBI data on Ownership distribution of mutual funds.
Methodology Prescribed
VI.149 The household investment in shares and debentures includes investment in shares and debentures issued by non-Government non-financial and financial companies and co operative banks and societies, bonds issued by public sector enterprises, units of UTI, other mutual funds and shares and debentures issued by financial corporations other than UTI. Information on household investment in shares and debentures of non-Government (financial and non-financial) companies is not available separately. This is derived as a residual by subtracting the investment of the public sector and the private corporate sector from the total investment in this instrument. First, a global estimates of shares and debentures is arrived at by blowing up the sample estimates of shares and debentures of public and private limited companies, based on the ratio of global paid up capital (PUC) available from the Ministry of Company Affairs (MCA) to sample PUC of public and private limited companies as obtained from the RBI studies on Finances of Public Limited Companies and Finances of Private Limited Companies. The estimates so arrived at are cross-checked with the primary market data obtained from the Capital Market Division (CMD) of RBI. For estimating household share in investment in shares and debentures, the results of the survey of Ownership of Capital Of Joint Stock Companies are made use of. This survey has been discontinued after 1995. However, the ratios from this survey are being used. Details of ownership of share capital for each type of co-operative institutions are available in the NABARD’s publication ‘Statistical Statements Relating to Co-operative Movement in India’. The share capital contributed by individuals and others is assumed as household investment in the cooperative share capital. The household investments in the bonds issued by Public Sector Undertakings are either obtained from the Ministry of Finance or from respective institutions. Similarly, the households’ investment in the units of UTIMF is estimated on the basis of information obtained from the UTIMF. Household investment in this case consists of adults / individuals, minors, Hindu Undivided families (HUF), trusts and dividend accrued to households on account of investment in the units of UTIMF. In the new series with base 1999-2000, income accrued to household but not paid on account of investment to the units of UTIMF has also been included in the estimates of households’ savings in the form of shares and debentures. Household investment in mutual funds other than UTIMF is estimated on the basis of information collected directly from various mutual funds. The data on household investment in shares and debentures of financial corporations are available from their balance sheets.
Methodology Used
VI.150 The total mobilisation in the primary market in the form of ‘shares and debentures and bonds’ by non- Government public limited companies are available from Capital Market Division (CMD), DEAP, RBI. The share of public non-financial companies is estimated as 83.09 per cent of the total shares. The share of private non-financial companies is estimated as 35.84 per cent of public non-financial companies. Of the total debentures figures 82.87 per cent is taken as debentures issued by non-financial public limited companies. The debentures of non-financial private limited companies are estimated at 1.14 per cent of public non-financial limited companies. For netting out sectoral contribution, 23.0 per cent for shares and 28.0 per cent for debentures are taken as households’ investment. These historical ratios are taken from Survey of Ownership of Capital of Joint Stock Companies as on end march 1995. This survey has been discontinued since then. The financial and investment companies’ data are estimated on the basis of the past trends in growth. The same applies for the public sector bonds. The investment in shares and debentures of commercial banks is estimated on the basis of past trends in growth. For investment in UTIMF units the figures are taken from UTIMF directly through special correspondence. For mutual funds (other than UTIMF) the total mobilisation data is available from SEBI. The information about household’s share is obtained from SEBI.
Validating the Data as well as Result
VI.151 Since the global paid-up capital figures are not available from MCA, there is no scope to validate the data on investment in non-financial companies and financial and investment companies. In the absence of NABARD publications, the data on co-operative sector cannot be validated.
Deviations from Prescribed Procedures
VI.152 In the absence of global paid-up capital figures from Ministry of Corporate Affairs, RBI has been using the IPO data maintained by it in its Capital Markets Division (CMD). This is a major deviation from the prescribed procedure. For the mutual funds (other than UTIMF), use is made of SEBI’s information. In the absence of NABARD publication, the data for co-operative sector is estimated.
Discussion in the HLC Meetings
VI.153 It is well recognised that household financial savings is increasingly invested in the form of shares, debentures, mutual funds and bonds. Presently, these instruments are worked out as per the results of the survey of ownership of capital of joint stock companies as at end-March 1995. In view of the fact that the estimation is based on results from a back-dated survey and that significant change has taken place in India’s capital market over the years, the HLC considered it appropriate to have an ownership survey so that the data on subscription for the recent years on each of the items namely, new issues of shares, debentures, mutual funds and commercial bonds can be obtained for the relevant ownership categories. It may be noted that apart from shares and debentures, mutual funds and commercial bonds have now become a fast emerging avenue of investment for retail investors in the recent years.
VI.154 In the absence of an up-to-date survey, the HLC thought it appropriate to have the involvement of SEBI in providing the information on a regular basis to the RBI for household financial savings estimation. The SEBI representative agreed that providing information on household ownership of shares, debentures, mutual funds and commercial bonds (each separately) would be feasible given the information base available with the top two registrars to issue, who among themselves have a market share of approximately 70 per cent to 80 per cent of public issues. The application form for the public issue of shares, debentures and bonds, contains the data fields for the following type of investors viz. (i) Individuals, (ii) Hindu Undivided Families, (iii) Bodies Corporate, (iv) Banks and Financial Institutions, (v) Mutual Funds, (vi) Non-Resident Indians, (vii) Insurance, Companies (viii) Venture Capital Funds (ix) Foreign Institutional Investor (x) Foreign Venture Capital Investor, (xi) Multilateral Agencies, (xii) Bilateral Development Financial Institution. It is learnt that the contents relating to the aforesaid data fields are captured by the registrars to the issue and they would be in a position to furnish the same.
VI.155 Among the above mentioned investor categories, category (i) and (ii) fall under the household sector. Category (iii) is the private corporate sector. Categories (iv) (v), (vii), (viii) are covered under banks and other financial institutions. Categories (vi), (ix), (x), (xi) and (xii) fall under the rest of world sector.
VI.156 It may be mentioned that the HLC’s interaction with the SEBI in this regard has been encouraging. SEBI has agreed to initiate the process of collecting the above information on a regular basis.
VI.157 Significant data lag with respect to household investment in shares and debentures from the co-operative banks and credit as well as non-credit societies persists due to considerable delay in the NABARD publication on ‘Statistical Statements relating to the Cooperative Movements in India’. It is felt that involvement of the NABARD is essential to provide projection of household sector’s holding in the above mentioned instruments, for the period for which actual data are not available.
Recommendations
VI.w The HLC recommends the involvement of the SEBI in providing information on a regular basis to the RBI on areas like annual subscription to public issues of shares, debentures, mutual funds and commercial bonds (each separately and consolidated for all depositories) as per the ownership categories (categories of subscribers are Qualified Institutional Investors, FIIs, NRIs, corporate, trusts and other categories) from which the RBI will extract household investment in shares, debentures, mutual funds and commercial bonds for household financial savings estimation (Annex A6.5.1). Registrars/Depositories/ AMFI need to be involved for regular data support. Henceforth, the SEBI would arrange to collect the required data from these entities, which are the primary sources of those data, by sensitising them and explaining the requirement of their data for estimation of household financial savings.
(Action: SEBI and RBI)
VI.x The SEBI may collect the consolidated balance sheet position for all registrars and broker houses and provide the data to the RBI as per the flow-of-funds format (Annex A6.5.2) to be forwarded by the RBI, so that the same can be incorporated in the FoF accounts.
(Action: SEBI)
VI.y The HLC recommends that the consolidated statements of assets/liabilities of all capital market institutions (namely, merchant bankers and registered brokers) should be compiled by the SEBI or have them compiled and forwarded to RBI for compilation of flow-of-funds account of the Indian economy.
(Action: SEBI and RBI)
VI.z The NABARD should be involved in providing projections of household investment in shares and debentures of co-operative banks and credit as well as non-credit societies to get around the problem of considerable time lag in the publication such as “Statistical Statements Relating to the Co-operative Movement in India”
.(Action: NABARD)
VI.aa. In view of the back dated Survey of Ownership of Capital of Joint Stock Companies as on end-March 1995, there is a need to update this at least once in five years. The SEBI may look into the modalities of conducting such a survey.
(Action: SEBI)
VI.bb Till a reliable flow of data from the SEBI on various parameters is available on a regular basis, the need for a blow-up factor for computing household investment in the shares, debentures, mutual funds and bonds of all companies is there. Accordingly, global paid-up capital series needs to be provided to the RBI by the Ministry of Corporate Affairs.
(Action: MCA, Government of India and RBI)
VI.cc The CSO should forward requisite formats to SEBI for estimation of savings, capital formation and GDP for the bodies under the regulatory purview of SEBI.
(Action: CSO and SEBI)
Trade Debt
Instruments
VI.158 The instruments are household’s trade debt (net) in (i) non-financial companies and (ii) financial and investment companies.
Identification of Data Source
VI.159 The sample studies on company finances by Company Finance Division, DSIM.
Methodology Prescribed
VI.160 The trade debt (net) has been estimated as change in trade dues in respect of sundry creditors minus change in loans and advances to sundry debtors. This information is available from the RBI studies on company finances published in RBI Bulletin from time to time. The sample results are blown up on the basis of coverage of sample PUC to total PUC of all companies.
Methodology Used
VI.161 Since the global paid-up capital figure is not available, it is not possible to apply the prescribed method. The past trend in growth rate is applied.
Validating the Data as well as Result
VI.162 Without the global paid-up capital figures from companies, it is not possible to validate the figures.
Deviations from Prescribed Procedures
VI.163 Due to non-availability of company finance studies for the year of compilation of savings, the past trends in growth rate is applied.
Discussion in the HLC Meetings
VI.164 The desirability of improvement in the statistics of household’s trade debt (net) in (i) non-financial companies and (ii) financial and investment companies was discussed at length in the HLC meetings. It was generally agreed that such improvement hinges on overall firming up of corporate sector statistics based on company finance studies of DSIM, RBI.
Recommendation
VI.dd Till the MCA 21 data is available and can be used for the purpose of financial savings estimation under trade debt, the existing methodology of computing trade debt may be continued. For estimating trade debt figure for all companies from the sample studies of the RBI, there is a need to have an appropriate blow-up factor. As recommended earlier, global paid-up capital series needs to be provided to the RBI by the Ministry of Corporate Affairs.
(Action: MCA, Government of India and RBI)
Loans and Advances by Households
VI.165 Household financial liabilities are a major subtraction item in the savings estimation, since it is used for acquiring a financial asset and/or physical asset. The household sector’s financial savings is estimated as the change in the sector’s financial assets net of their financial liabilities. The household sector receives loans from the banking sector, Government sector, financial corporations, and non-banking companies and insurance companies, electricity boards, and cooperative societies.
Raj Committee
VI.166 The relevant observations/recommendations of the Raj Committee with respect to the financial liabilities of the household sector are as under.
“In the present estimation of net claims on Government, the loans taken by the households from the local authorities are not taken into account due to non availability of data. However, with the acceptance of the recommendation of the working group suggesting that the State Statistical Bureaux should consolidate statistics of local bodies on a complete enumeration basis, it should be possible to obtain the data on loans also.
There is considerable time lag in the consolidation of data on loans and advances to households extended by the primary credit and non-credit co-operative societies. The RBI may be requested to expedite such consolidation so that appropriate data for the latest years are included in the CSO’s quick estimates.”
Chelliah Committee
The Chelliah Committee has made the following observations/recommendations concerning financial liabilities of the households.
“As the data on loans and advances of non-financial non-Government companies to its employees are not collected, arrangements may be made to collect such information ad include it in the financial liabilities while working out household sector’s savings in the form of financial assets.”
Instruments
VI.167 The instruments are households ’ loans and advances from (i) banks, consisting in turn of RBI, commercial banks and cooperative banks and credit societies, (ii) other financial institutions (consisting of financial corporations, insurance companies and financial and investment companies), (iii) cooperative non-credit societies, and (iv) Government (both central and State and SEBs).
Identification of Data Source
-
Information from Department of Government and Budget Accounts (DGBA), RBI,
-
Information of aggregate credit of commercial banks available from Division of Money and Banking (DMB), DEAP, RBI,
-
BSR survey on credit by DSIM, RBI,
-
‘Statistical Statements Relating to the Co-operative Movement in India’ (NABARD), and
-
Information through special returns and annual reports of various institutions.
Methodology Prescribed
(a) Loans and Advances from Banks
VI.168 The bank credit to households comprises (i) bills purchased and discounted and (ii) loans/advances, cash credit and over-drafts to institutions like partnerships, proprietary concerns, joint families etc., and individuals. Loans and advances by the RBI to its staff are also included separately on the basis of information obtained from the Department of Government and Budget Accounts (DGBA), RBI. Data on the bank credit of the scheduled commercial banks including the Regional Rural Banks (excluding inter-bank advances), are obtained from statutory returns filed under 42(2) of the RBI Act, 1934. Data on total scheduled commercial banks credit are published in the RBI Bulletin. But institution-wise details are not available. In order to estimate the proportion of credit given to the households by commercial banks, the information collected by the RBI through their survey on ‘Organisation-wise Classification of Outstanding Credit of Scheduled Commercial Banks according to Occupation’ is utilised. The household proportion is estimated after excluding the food credit, which is assumed to be extended to the Government sector. The proportion is then applied to total bank credit (excluding food credit) to arrive at the estimates of bank credit to household.
(b) Loans and Advances from other financial institutions (OFI)
VI.169 The information on loans extended to the households, as available from the following sources, has been made use of:
(i) Loans extended by State Financial Corporations (SFCs) and State Industrial Development Corporations (SIDCs), etc. to staff members as well as to proprietor and partnership concerns, Hindu Undivided Families and Trusts;
(ii) Loans and advances granted by other Government financial corporations, namely, Industrial Financial Corporation of India (IFCI), Rural Electrification Corporation (REC), to their staff members and loans by HDFC, EXIM Bank, SIDBI and Housing and Urban Development Corporation (HUDCO) to individuals; and
(iii) Information on loans and advances by the chit fund and mutual savings fund companies is specially obtained from the RBI and loans and advances given by SEBs to their employees is obtained from their annual report. However, the figures for OFI are available from National Accounts Statistics, CSO.
(c) Loans and Advances from Co-operative Societies
VI.170 Data on loans and advances given to the households by co-operative societies (credit and non-credit) and banks available annually from the publication ‘Statistical Statements Relating to the Co-operative Movement in India’ (NABARD) is made use of.
(d) Loans and Advances from Government
VI.171 The figures for loans and advances from Central Government are available from CSO. The figures for the State Governments are available from Division of State and Local Finances (DSLF), DEAP, RBI.
Methodology Used
VI.172 The data on loans and advances from banks are estimated on the basis of prescribed methodology. The loans and advances from OFI and Government are obtained from the CSO and DSLF, DEAP. The data for co-operative sector are estimated on the basis of the past trends in growth.
Validating the Data as well as Result
VI.173 The data are generally validated at the time of compilation of flow of funds.
Deviations from Prescribed Procedures
VI.174 Due to non-availability of Survey on Credit from DSIM for the year in question the latest available survey was used. Due to availability of data in respect of other instruments with a lag of one year, these are estimated.
Discussions in the HLC Meetings
VI.175 The HLC discussed at length the need for firming up the database on financial liabilities of the household sector to get a clear picture of household financial savings in any given year. The HLC reaffirmed that the detailed information on bank credit according to organisation and occupation (industrial activity) as available in BSR survey on outstanding credit of scheduled commercial banks may be used for this purpose. It may be mentioned that the occupational groups classified for the purpose are: (i) agriculture, (ii) medium and large industry, (iii) SSIs, (iv) wholesale trade – food procurement and other purposes, (v) other priority sectors, and (vi) all other sectors (including personal loans). Under these occupational groups, the household sector covers institutions like partnership, propriety concerns, joint families and individuals. Besides, the amount shown under credit limits up to Rs.2 lakh is shown as loans to the household sector.
VI.176 It was thought desirable to take the help of apex financial bodies namely, IRDA and NABARD in the estimation of loans and advances to household sector emanating from the insurance and co-operative sectors, respectively. The involvement of apex financial bodies is thought to be an urgent need in view of the requirement of dealing with a very diverse kind of database for estimating household financial savings.
VI.177 The issue of the present practice of subtraction of household financial liabilities from the gross financial assets to arrive at the household net financial savings was discussed in the HLC meetings on April 18, 2008 and November 20, 2008. It was agreed that while such a practice is conceptually appropriate, the problem with this practice, however, is that the household financial liabilities may have been incurred for the purpose of acquisition of not only the financial assets but also physical assets. In the context of the deployment of savings, the concept of ‘transferable savings’ is more relevant and it is, thus, useful to look at ‘gross financial savings’ and not ‘net financial savings’. Hence, it may be more appropriate to present the total household savings as:
[Gross Financial Assets + Physical Assets – Financial Liabilities]
Instead of the present practice of reporting as:[Net financial savings (i.e., Gross Financial Assets – Financial Liabilities + Physical Assets].
Recommendations
VI.ee The HLC recommends that as BSR data on bank credit is available with a lag of one year, proportion of the previous year may be applied wherever necessary. Care should be taken to ensure that the database on loans and advances by sectors/institutions/categories are comparable.
(Action: RBI)
VI.ff The HLC recommends incorporation of an estimate of loans to households and employees from the non-financial companies. This will entail requisite modifications/ inclusion in the questionnaire forwarded to companies by the RBI for conducting the Company Finance Studies.
(Action: RBI)
VI.gg The NABARD should provide a projection of loans and advances to the household sector from the co-operative credit and non-credit societies to get around the problem of considerable time lag in the publication such as ‘Statistical Statements Relating to the Cooperative Movement in India’.
(Action: NABARD)
VI.hh The IRDA should provide an estimate of loans and advances to households from the insurance companies – both public and private – by way of providing regular information to the RBI.
(Action: IRDA)
VI.ii While the present practice of subtraction of household financial liabilities from the gross financial assets to arrive at the household net financial savings is conceptually appropriate, the problem with this practice, however, is that the household financial liabilities may have been incurred for the purpose of acquisition of not only the financial assets but also physical assets. In the context of deployment of savings, what is important is the concept of ‘transferrable savings’. Hence, the CSO should present the total household savings as:
[Gross Financial Assets + Physical Assets – Financial Liabilities]
Instead of the present practice of reporting as:
[Net financial savings (i.e., Gross Financial Assets – Financial Liabilities + Physical Assets].
It would be appropriate for the CSO to present household financial savings by instruments in gross terms and not net of respective liabilities as is the present practice. In addition, for presenting household savings in form of financial assets, the estimate would consist of gross financial assets less financial liabilities.
(Action: RBI and CSO)
New Data Bases
VI.178 With reference to the ToR to suggest new data bases, if any, to be devised/built up for improving the reliability or checking validity of the estimates, it was agreed by the HLC that presently all the financial instruments available for deployment of household savings are taken into account while estimating the household financial savings. However, there is a need to continuously monitor the emergence of new instruments for incorporating them for in the savings estimates. Accordingly, new data base for such instruments need to be developed.
Recommendations
VI.jj On examination of the instruments of financial savings for households, it was agreed by the HLC that presently all the financial instruments available for deployment of household savings are taken into account while estimating the household financial savings. However, there is need to continuously monitor the emergence of new instruments for incorporating them in the savings estimates. Accordingly, new data base for such instruments need to be developed.
(Action: RBI)
VI.kk New databases should be devised/built-up for improving the reliability or checking validity of the estimates of household savings. The HLC examined the present data collection procedure adopted for estimating household financial savings and arrived at a consensus that in the existing scheme of things, although some apex bodies (namely, NABARD and NHB) are already involved, there is a possibility of involving the other apex bodies such as IRDA and SEBI for the purpose of building up an alternative database in respect of financial instruments under their regulatory purview and in respect of assets and liabilities of capital market institutions for the purpose of compiling the flow-of-funds accounts. Towards this pursuit, SEBI’s involvement was envisaged in respect of household investment in shares, debentures, mutual funds and commercial bonds, IRDA’s in respect of ‘life funds’ of insurance companies, NABARD’s in respect of deposit, credit and investment data pertaining to co-operative banks, credit and non-credit societies and NHB’s in respect of household deposits with the housing finance companies. The HLC recommends creation of a regular data supply mechanism from the apex bodies to the RBI for which specific forms will be supplied. Going forward, it is also envisioned that all the apex bodies are engaged in the ongoing review of the data on household financial savings from the following standpoints:
i. Identification of the database used;
ii. Methodology prescribed and in practice used;
iii. Validating the data as well as results; and
iv. Comment on changes required in the procedure.
(Action: NABARD, NHB, IRDA and SEBI)
VI.ll The HLC agreed that there is a need for field studies by different institutions like CSO and NSSO for developing new databases. The appropriate case studies and type studies to be undertaken may be funded by CSO and RBI.
(Action: CSO and NSSO) Institutional Support for Statistics
VI.mm The issue of institutional support for generating reliable statistics as public good was discussed. The HLC was convinced that constraints by way of inadequate staffing of the desks involved with timely compilation of massive statistical exercises have led to difficulties in completion of such exercises in time. The HLC recommends that the National Statistical Commission (NSC) should identify such units in NSSO, CSO and the Research Departments in the RBI for strengthening them through appropriate staffing so that in future statistical exercises like income-expenditure survey, Company Finance Studies, BSR, FoF and similar exercises can be completed expeditiously at these organisations.
(Action: RBI, NSSO, CSO and NSC)
Chapter VII : Estimation of the Savings of the Private Corporate Sector
VII.1 The private corporate sector is classified into two segments, one comprising joint stock companies and the other comprising co-operative banks & societies and non-profit corporate institutions (in the previous Committees’ Reports, these were referred to as quasi-corporate bodies). Joint stock companies are further classified into non-Government non- financial companies and non-Government financial companies. While nonGovernment non-financial enterprises comprise public and private limited companies that also includes foreign direct investment companies, non-Government financial companies consist of all private sector commercial banks (scheduled and non-scheduled), other financial and investment companies engaged in hire-purchase, share transactions, investments in securities, housing finance, insurance, etc. Cooperative institutions include both cooperative banks (excluding State cooperative banks) and societies (credit and non-credit).
VII.2 Within private corporate sector, major share of savings is generated by the joint stock companies (Table 7.1). These contributed 91-96 per cent of private corporate sector’s savings during 2001-07. The lion’s share of about 90 per cent or more of the savings of joint stock companies, in turn, emanates from non-Government non-financial companies (NGNFCs). The non-Government non-financial corporate sector is dominated by public limited companies in terms of paid up capital (82 to 85 per cent) and by private limited companies in terms of number of companies (88 to 90 per cent). Therefore, the financial performance of private corporate sector can reasonably be gauged by focusing on large public limited companies.
VII.3 A main feature in case of private limited corporate sector is the existence of large number of small sized PUC companies and as such unlike in the case of public limited companies, it becomes difficult to secure a good coverage in terms of PUC by studying a limited number of companies. Non-banking financial companies also exhibit a similar limitation with the substantial growth in non-banking financial companies in recent years.
VII.4 It may be noted that the size of the private corporate sector in terms of its contribution to gross domestic savings of the country is rising in recent years (Table 7.2). The percentage share of this sector in gross domestic savings was 18 per cent in 1999-00 which declined to 14.4 per cent in 2001-02 and since then it followed an increasing trend to reach 22.4 per cent level in 2006-07.
VII.5 The improved productivity, lowering of the tax and interest rates as part of conducive policy environment, more efficient entrepreneurial activity and financial restructuring leading to low debt- equity ratio have collectively resulted in improving financial performance in the private corporate sector in recent years. Improved profitability as reflected in the progressive increase in retained profits resulted in more than doubling of the private corporate sector saving rates.
VII.6 The Annual Report of Ministry of Corporate Affairs (MCA) 2006-07 states that there are as many as 7,32,169 companies, limited by shares, which were at work in the country as on March 31, 2006. These comprised 7,30,817 non-Government companies and 1,352 Government companies. Out of 7,32,169 companies limited by shares at work, 80,141 companies were public limited and 6,52,028 were private limited companies. Besides, there were 3,605 companies with limited liability by guarantee and associations not for profit and 498 companies with unlimited liability as on March 31, 2006. As per the MCA, its MCA21 repository at present has reasonably good quality annual accounts data of around 1,80,000 companies.
Table 7.1: Components of Private Corporate Savings |
(Rs. crore) |
| |
2001-02 |
2002-03 |
2003-04 |
2004-05 |
2005-06 |
2006-07 |
1 |
2 |
3 |
4 |
5 |
6 |
7 |
1. |
Joint Stock Companies |
69952 |
86845 |
111807 |
195910 |
256148 |
309222 |
| |
|
(91.0) |
(91.6) |
(92.6) |
(94.9) |
(95.5) |
(96.0) |
1.1 |
Non-Government Non-financial |
74082 |
91298 |
113925 |
192855 |
245151 |
310428 |
| |
|
(96.3) |
(96.3) |
(94.4) |
(93.5) |
(91.4) |
(96.3) |
1.2 |
Non-Government Financial |
3711 |
4413 |
6153 |
11610 |
23217 |
21823 |
| |
|
(4.8) |
(4.7) |
(5.1) |
(5.6) |
(8.7) |
(6.8) |
1.3 |
less: Reinvested Earnings of Foreign Companies |
7841 |
8866 |
8271 |
8555 |
12220 |
23029 |
| |
|
(10.2) |
(9.4) |
(6.9) |
(4.2) |
(4.6) |
(7.2) |
2. |
Co-operative banks/Societies and Non-profit |
6954 |
7927 |
8923 |
10453 |
12181 |
13020 |
| |
Corporate Institutions |
(9.0) |
(8.4) |
(7.4) |
(5.1) |
(4.5) |
(4.0) |
2.1 |
Co-operative banks & Societies |
5384 |
6040 |
6621 |
7835 |
9242 |
9687 |
| |
|
(7.0) |
(6.4) |
(5.5) |
(3.8) |
(3.4) |
(3.0) |
2.2 |
Non-profit Corporate Institutions |
1570 |
1887 |
2302 |
2618 |
2939 |
3333 |
| |
|
(2.0) |
(2.0) |
(1.9) |
(1.3) |
(1.1) |
(1.0) |
Private Corporate Saving (1+2) |
76906 |
94772 |
120730 |
206363 |
268329 |
322242 |
| |
(100) |
(100) |
(100) |
(100) |
(100) |
(100) |
Note : Figures in brackets indicate corresponding share in private corporate savings.
Source : RBI and CSO. |
Table 7.2: Components of Gross Domestic Savings |
(Rs. crore) |
| |
1999-00 |
2000-01 |
2001-02 |
2002-03 |
2003-04 |
2004-05 |
2005-06 |
2006-07 |
1 |
2 |
3 |
4 |
5 |
6 |
7 |
8 |
9 |
Household Sector |
412516 |
454853 |
504165 |
569134 |
670776 |
725110 |
866756 |
985822 |
| |
(85.2) |
(91.2) |
(94.3) |
(87.8) |
(81.7) |
(72.5) |
(70.6) |
(68.4) |
Private Corporate Sector |
87234 |
81062 |
76906 |
94772 |
120730 |
206363 |
268329 |
322242 |
| |
(18.0) |
(16.2) |
(14.4) |
(14.6) |
(14.7) |
(20.6) |
(21.9) |
(22.4) |
Public Sector |
-15494 |
-36882 |
-46186 |
-15936 |
29521 |
68951 |
92263 |
133359 |
| |
(-3.2) |
(-7.4) |
(-8.6) |
(-2.5) |
(3.6) |
(6.9) |
(7.5) |
(9.3) |
Gross Domestic Savings |
484256 |
499033 |
534885 |
647970 |
821026 |
1000424 |
1227348 |
1441423 |
| |
(100) |
(100) |
(100) |
(100) |
(100) |
(100) |
(100) |
(100) |
Note : Figures in brackets indicate the share of corresponding sector’s savings to gross domestic savings. Source: CSO |
System in Place for Estimating Corporate Savings
VII.7 Under an arrangement between the Reserve Bank (RBI) and the Central Statistical Organisation (CSO), RBI prepares the estimates of savings for the non-Government non-financial, financial and investment companies (excluding commercial banks) in India. Such estimates are compiled at all-industries level and also for specific industry-groups. These estimates are based on the results of the analysis of balance sheets and profit and loss accounts of select companies. The population estimates are obtained by blowing up the sample results on the basis of PUC of the sample companies to the PUC of all companies. Ministry of Corporate Affairs (MCA) supplies the information on PUC of all companies. These estimates are forwarded to CSO. The CSO estimates savings of other segments of the sector, viz., private commercial banks, insurance companies, co-operative institutions and non-profit corporate institutions.
VII.8 The estimates of savings of life insurance companies in private sector are prepared by analysing their annual reports. For non-life insurance companies, the profit and loss account as published in annual report of the Insurance Regulatory & Development Authority (IRDA) is used. There are at present 17 general insurance companies which have been granted registration for doing non-life insurance business in the country. Of these, 6 are in public sector and the rest in private sector. Of the 11 private sector companies, two have been granted license during 2007-08. The analysis presented in the IRDA report pertain to the private insurance companies like Bajaj Allianz, Tata AIG, Reliance, IFFCO TOKIO, ICICI Lombard, Cholamandalam, HDFC CHUBB and Royal Sundaram.
VII.9 In case of private commercial banks, data published in the RBI’s ‘Statistical Tables Relating to Banks in India’ are used.
VII.10 As regards co-operative institutions, the publication entitled ‘Statistical Statements Relating to Cooperative Movements in India’ published by NABARD is used.
VII.11 Few annual accounts are analysed for estimating savings of non-profit corporate institutions.
VII.12 As per recommendation of Advisory Committee on National Accounts, reinvested earnings of FDI companies are excluded from the savings of non-Government corporate enterprises and are included instead in the net factor income and net capital inflow from abroad. The CSO is making this adjustment in the corporate savings estimates since 1999-2000 onwards. No such adjustment to corporate savings estimate is made for earlier years due to non-availability of data on reinvested earnings of FDI companies. The addition of this adjusted figure with those estimated by the CSO and the RBI for other segments gives the corporate savings estimate for the private corporate sector.
Present Methodology of Estimating Corporate Savings
Estimation for Non-Government Companies
VII.13 Data: RBI is conducting regular annual studies on finances of joint stock companies in the private sector since 1950-51 which form the primary source for analysing the financial performance of the private corporate sector. These studies cover selected companies classified according to size of PUC and also of different industry groups. The studies provide comprehensive financial statistics on income and expenditure, assets and liabilities, sources and uses of funds, etc and relate to the financial year ended in March. The annual accounts for the financial year become available only after September. The estimates of savings and capital formation of the private corporate business sector are based on a larger set of companies compared to the number of companies covered in the published studies. At present, the RBI publishes the studies on the financial performance of the corporate sector in respect of (i) non-Government non-financial public limited companies, (ii) nonGovernment non-financial private limited companies, and (iii) non-Government financial and investment companies based on the audited annual accounts of the selected companies.
VII.14 The data items required for estimating savings from the studies include profits retained, non-operating surplus (+)/deficit (-) and depreciation provision from the income and expenditure Statement. The other data used in the estimation of savings and capital formation are the type-wise population PUC of all non-Government companies received from the MCA every year. Data on sample PUC are collected from balance sheets of selected companies to obtain the coverage of the studies in the population.
VII.15 Time frame: A company under Section 210 (3) (b) of the Companies Act 1956, is required to present within six months of the date of the closing of accounts, its balance sheet and profit and loss account at an annual general body meeting and simultaneously file copies of these with the concerned Registrar of Companies. Thus, the accounts of companies generally become available six months after the account closing date and as such the company finance studies of RBI would be available after some lag.
VII.16 Industrial Classification: The company finance studies in RBI adopt the National Industrial Classification of All Economic Activities. With the available information on sales of different products, a company is classified into an industry group based on the sales of that product which account for more than one half of its total sales or from which the company derives more than half of its main income. This classification is revised every year in the RBI studies. MCA, on the other hand, classifies a company on the basis of the main activity of the company indicated in its memorandum of association filed at the time of its registration, and as such changes that subsequently occur in the product diversification of the companies do not seem to have always been taken into account for all companies.
VII.17 Methodology: In order to estimate savings, the relevant data items of the sample companies are blown-up or inflated to cover entire population based on ratio of population paid-up capital to that of sample companies. The blow-up factors are obtained separately for three types of companies mentioned above. Depending upon the availability of global PUC data and the number of select companies, RBI estimates obtained for the latest financial year are generally ‘tentative’, the estimates for the preceding financial year are ‘revised’ and the estimates for the second-last preceding financial year are made ‘firm or final’. The tentative estimates are based on a small sample of 1,700 – 1,800 companies. The final estimates are, however, prepared with sufficiently larger sample of about 6,000 companies. The estimates are prepared separately for the ‘non-financial’ and the ‘financial’ sector.
VII.18 Data Gaps / Limitations: The selection of companies in the RBI studies is largely governed by the availability of balance sheets and is not drawn using any statistical sampling technique. While other parameters like sales, total net assets, etc., may have high correlation with various financial parameters, use of PUC as the characteristic for blow up procedure is chosen mainly on consideration of the data availability at population level and partly on account of its relative robustness. Another limitation is due to the fact that while the selection of companies for the studies excludes non-operating, defunct, and under-construction companies, the population PUC includes data on such companies. Thirdly, in the absence of the population PUC figures at the time of preparing tentative estimates, it is estimated based on average growth of population PUC in last 3 to 5 years. Whenever the population PUC figures are made available subsequently by MCA, the population estimates of savings and capital formation undergo revision because of change in the multiplier used for arriving at the population estimates.
Estimation for Private Commercial Banks
VII.19 The savings of private commercial banks is estimated as addition to their reserve funds. The transfers to reserve funds include net amount carried to reserves, depreciation provision, amount allocated for other special purposes and amount carried forward to next year’s account net of surplus/deficit of the previous year. Details of appropriation of profit of private scheduled commercial banks as transfer to (a) statutory reserve, (b) capital reserve, (c) investment reserve, proposed dividend, dividend tax and balance carried forward to balance sheet are available from the “Appropriation of Profit of Scheduled Commercial Banks” published in the RBI’s ‘Statistical Tables Relating to Banks in India’.
Estimation for Insurance Companies
VII.20 The savings in respect of life insurance companies in private sector represents change in life fund. This savings, however, is attributed to the household sector, since it is the households that make investment in the life funds of private insurance companies. The relevant information in this regard is collected from the annual reports of such companies. For non-life insurance companies, estimates are worked out by the CSO from the profit and loss accounts of private sector non-life insurers published in the IRDA Annual Report. Net Savings is estimated as sum of net transfer to reserves and net transfers to balance sheet.
Estimation for Co-operatives
VII.21 In case of co-operative societies, data on statutory reserves/funds, bad debt reserves and other reserves are available in the ‘Statistical Statements Relating to Co-operative Movement in India’, published by NABARD. The gross savings is taken as the increase in statutory funds and other reserves/funds. In the absence of data on time, the estimates of savings have been prepared on the basis of trends observed in the value added of banks and trade sector.
Estimation for Non-profit Corporate Institutions
VII.22 For estimating the gross savings of Non-profit Corporate Institutions, a few annual reports are analysed and their savings is estimated as the excess of current receipts over current expenditure. Also compiled for the base year were the GDP estimates for these institutions. A ratio of savings to GDP for these institutions was then compiled. Applying this ratio on the overall GDP of the Non-profit Corporate Institutions (which in turn is estimated by multiplying the total workforce in Non-profit Corporate Institutions and the average value added per worker in these institutions), the annual estimates of savings of Non-profit Corporate Institutions are compiled. Currently, the coverage under this segment relates to non-profit organisations serving to private corporate sector.
Some Issues, Recommendations of Past Committees and Present Status
VII.23 Concepts and present methodology used for estimating savings and capital formation of private corporate sector are largely based on the recommendations of the Raj Committee (1982) and subsequently by Chelliah Committee (1996) and National Statistical Commission (2001). Most of the methodological issues discussed in these reports are fairly common, as there has not been any substantive improvement in coverage of non-financial/financial companies in corporate savings estimate during last three decades. Some of the major issues are listed below:
VII.24 Statistical sampling scheme is not used for preparing population estimates -Population frame consisting of all companies is not available. Every year a large number of companies register with the Registrar of Companies (ROC) and get liquidated before they file their first annual report. As a corrective step, Chelliah Committee (1996) recommended that top 1500 companies in terms of net fixed assets or sales must be included in the sample. Estimates could then be made on the basis of the information of the top companies and for the remaining companies, estimates may be built up on a sample basis. DCA (now MCA) should make available this information. In case the information does not flow or takes time to come, it would be necessary to apply on the companies the legal provisions for timely supply of information. Registrars of various States are expected to send a copy of annual reports to RBI. Due to non-availability of sufficient and reliable information from MCA on top companies, this recommendation could not be implemented. However, efforts are made to include all large BSE listed companies in the RBI annual studies.
VII.25 Blow-up factor - DCA (now MCA) should be part of the system in rendering help in the estimation of savings and capital formation of the private corporate sector. It is necessary to strengthen the Statistical and Research Unit of MCA to enable estimation of population PUC. MCA has recently started MCA21 data reporting system.
VII.26 Substitution of PUC by other characteristics such as Gross Formation of Assets (GFA) or sales – It was not possible to implement this suggestion due to non-availability of information on these variables at a population level.
VII.27 Coverage: Undertaking census studies on all segments of private corporate sector on a quinquennial frequency - RBI should continue its company finance studies with greater regularity placing the studies on better footing through regular censuses covering companies of all sizes. The census studies have not been found possible by the RBI due to resource constraints.
VII.28 Resumption of the studies on the finances of foreign controlled rupee companies and branches of foreign companies – As stated earlier, following the recommendation of Advisory Committee to National Account Statistics, CSO has started excluding reinvestment earnings of FDI companies in India from the savings estimates for non-Government financial/non-financial companies made by RBI from the years 1999-2000 onwards.
VII.29 Data gaps in respect to Cooperative institutions – Noting the inordinate time lag in the publication of NABARD’s annual studies on Statistical Statements Relating to the Cooperative Movement in India, earlier committees emphasised the importance of speeding up the publications. However, the lags in these publications have increased to four to five years which have adversely affected the estimation.
VII.30 The issue of data gap and inordinate delay in publication of NABARD’s publications was discussed by the present HLC. It was felt that gaps in these data could not be filled without the direct involvement of NABARD. It was thought that apart from the speeding up of publications, it was imperative to involve NABARD in making provisional estimates of relevant data for the years for which the full-fledged publications were not available. In such cases, NABARD could gather information on major institutions and undertake ‘guess estimates’ for the rest.
Corporate savings – Existing and Suggested Definition
VII.31 Savings of a company is defined as the excess of current income over current expenditure. The non-current income that pertains to previous years, and the profit/ loss not related to the current business of companies (such as sale of assets/investments during the year) is not included in the savings. However, for computation of savings, net savings (NS) concept is generally used which is defined as retained profits of private corporate business sector adjusted for non-operating surplus/deficit (NOP). Retained profits are that proportion of total net profits that are ploughed back into business (either transferred to reserves or carried forward to balance sheet) after making commitments to financial institutions (in the form of interest payments), Government (tax provisions), share-holders (dividend, etc.) and after making depreciation provision for various fixed assets. It is clear from the definition that retained earnings could be worked out either from balance sheet or from profit loss account. NOP comprises (a) profit/ loss on account of sale of fixed assets, investments, etc., (b) provisions no longer required written back, (c) insurance claims realised and (d) income or expenditure relating to the previous years and (e) other items of non-current nature. Depreciation provision (DEPR) at book value as provided in the profit/ loss account is added to the net savings to obtain the gross savings (GS).
Proposed Measurement of Corporate Sector Savings
VII.32 The HLC made a review on inclusion/exclusion of various items in the gross and net savings. Table 7.3 presents various items in the existing vis-à-vis suggested definition of corporate savings. The suggested definition for net savings involves retained profits adjusted for (i) capital gains or losses, (ii) income or expenditure relating to previous years and (iii) deferred tax liability or asset.
VII.33 In turn, capital gains or losses comprise of (a) profit or loss on sale of fixed assets, (b) profit or loss on sale of investments (excluding for the companies trading in shares) and (c) loss due to fire, flood, theft, etc. Income or expenditure relating to previous years comprise of (a) provisions no longer required written back (bad debts, taxation, etc.), (b) liabilities written back, (c) assets or investments written off and (d) any other income or expenditure relating to previous years. Deferred tax adjustment comprises of (a) deferred tax liability and (b) deferred tax asset.
Table 7.3: Existing vis-à-vis Suggested Definition of Savings |
Existing |
Suggested |
Retained Profits |
Retained Profits |
(-) Net of Non-operating income, which comprises: |
(-) Net of Capital Gains, which comprises: |
(a) |
Profit/loss on sale of fixed assets |
(a) |
Profit/loss on sale of fixed assets |
(b) |
Profit/loss on sale of investments |
(b) |
Profit/loss on sale of investments |
(c) |
Loss due to fire, flood, theft, etc. |
(c) |
Loss due to fire, flood, theft, etc. |
(d) |
Provisions no longer required written back (bad debts, taxation, etc.) |
(-) Net Income related to previous years, which comprises: |
(e) |
Liabilities written back |
(d) |
Provisions no longer required written back (bad debts, taxation, etc.) |
(f) |
Assets or investments written off |
|
|
(g) |
Any other income or expenditure relating to previous years |
(e) |
Liabilities written back |
|
|
(f) |
Assets or investments written off |
(h) |
(-) Net Deferred tax liability |
(g) |
Any other income or expenditure relating to previous years |
(i) |
Claims realised including insurance claims |
|
|
(j) |
Sales tax refund |
(+) Net Deferred tax liability |
(k) |
Interest waived |
|
(=) Net Savings |
(=) Net Savings |
(+) Depreciation |
(+) Depreciation |
(=) Gross Savings |
(=) Gross Savings |
VII.34 The items (a) sales tax refund, (b) interest waived and (c) insurance claims realised which were not forming part of savings in the existing definition, are now taken as part of savings in the HLC’s suggested definition. The reasons for inclusion of these items are discussed in the following paragraphs.
VII.35 Sales tax refund: The difference of provision made by a company and the amount it actually pays is presented in the next year account as income item under the sales tax refund head. Although the company showed it as an expense during the current year under the head sales tax provision, the excess provision made remains with the company. In the Government accounts on the other hand, they will show only the amount they received. So the excess provision made was neither showed in Government accounts nor in company accounts as a savings. Therefore, this item may be treated as savings of a company.
VII.36 Interest waived: Companies pay interest on loans and advances taken. If that interest is waived, it will be an income item to the company. The interest waived will not appear in the Government accounts but it appears as income item in the company accounts. As the Government does not show this item in its accounts, it should form part of savings of the corporate sector.
VII.37 Insurance claims realised: When the corporate pays the insurance premium, it is treated as expenditure to the company and is an income to the insurance company. When the claims are realised, it is an income to the corporate but an expense to the insurance company. In the accounts of the insurance company, profits are shown as premiums received less claims paid and, therefore, claims paid by the insurance company does not form part of the savings of the insurance company. As insurance claims realised is indirectly coming from the companies by way of premiums paid to the insurance company, it may be considered as savings of a corporate.
An Alternative Corporate Database
VII.38 At present savings and capital formation of NGNFCs are estimated based on the information available in sample companies and subsequently blown-up on the basis of global PUC. Though this method falls in the popular ratio estimation domain of sample survey in statistics, it is criticized mainly for three important reasons. Firstly, population frame available with MCA until recently was inadequate and indefinite in nature, thus, making it difficult to implement a scientific sampling design which is the basic requirement for preparing and implementing any good statistical sampling scheme. Secondly, in order to achieve better coverage in terms of PUC, RBI selects sample companies purposively, making ratio estimation less reliable. Finally, there may not be any apparent association between savings (and capital formation) with PUC.
VII.39 As indicated earlier, by definition, savings and capital formation of NGNFCs is fairly simple concept. However, their estimation historically remained a grey area mostly due to coverage problems. Looking at the growing importance of this sector, earlier committees too recommended using alternatives and the use of similar data compiled by private agencies.
VII.40 About MCA 21 Database - During last decade or so, the availability of information, however, has greatly increased due to advancement in information technology and computer applications. Several agencies, including Government Departments, have gone for large scale computerisation and made substantial investments towards it. MCA is the nodal enforcement agency regulating registration of companies and is in a position to present a global view of corporate activities in India. Keeping in tune with the e-Governance initiatives the world over, the MCA in 2006 initiated an e-Governance project called MCA21 to enable an easy and secure access to MCA services in a manner that best suits the corporate entities and professional besides the public4. It is intended to achieve all the objectives of a versatile e-Governance project.
VII.41 MCA21 is designed to fully automate all processes related to the proactive enforcement and compliance of the legal requirements under the Companies Act, 1956. Each Indian company is provided with a unique corporate identification number (CIN) and foreign company a unique foreign company registration number (FCRN). Using these numbers, companies are filing detailed financial and other information using e-forms available online (http://www.mca.gov.in/). In order to maintain data integrity, important fields are made mandatory and extensive help menu is made available subject-wise. Once the e-form is filed online using MCA portal, it gets automatically saved into central repository. Most importantly, annual balance sheet and P/L account are also filed online. For special importance, these data are filed using a special utility portal called ‘annual data filing corner’. Data security is built in the system through advanced technology like digital signature and the data is retrievable into computable format easily. Given appropriate rights and authorisation, relevant MCA21 data could be accessed from RBI too.
VII.42 It is also observed that the 21-digit unique CIN allocated to each company in MCA21 captures a few basic information of the company. These are: (a) A digit indicating whether the company is Listed (L) /Unlisted (U) in stock market; (b) 5-digit industry code based on NIC 2004; (c) 2 digits indicating State where the registered office of the company is located; (d) 4 digits indicating year of corporation; (e) 3 digits for indicating classification of company as public (PUB) or private (PTC) and (f) 6 digits ROC wise registration number.
VII.43 Therefore, as an alternative source of information on corporate activities, MCA21 is a real possibility today.
4 This is named as MCA21 as it aims at repositioning MCA as an organisation capable of fulfilling the aspirations of its stakeholders in the 21st century.
Coverage in MCA21 vis-à-vis RBI Data Base
VII.44 The PUC coverage of NGNFCs in RBI studies has improved in recent times. In general, the studies cover more than 30 per cent of PUC of public limited companies on a regular basis (Table 7.4). However, the coverage of private limited companies for most of the years has been less than 10 per cent. It is evident that the coverage of the corporate sector needs to be further improved. It is felt that the data reporting under corporate sector should be comprehensive covering all units in near future in the short to medium term. The basic framework for this HLC is attuned to this objective.
VII.45 The HLC examined coverage and item-wise details of balance sheet and profit loss account data reported in MCA21. In its terms, balance sheet needs to be reported under Form 23AC and P/L account is filed under Form 23ACA. Form 23AC and Form 23ACA are submitted together. Submission is easy. Once the company enters balance sheet date at 5(a) (Form 23AC), end of current financial year gets fixed to that date. For end of previous financial year company has a choice to enter the date. The system has inbuilt validation and consistency checks. Besides entering specified fields, filing of annual account in PDF format as attachment is mandatory for all companies.
VII.46 As an exercise, the HLC procured annual accounts data of around 9000 companies, comprising both public and private, having PUC above Rs.5 crore for two years namely 2005-06 and 2006-07 from MCA21. Data characteristics included appropriate classifications of companies as ‘public’ vs. ‘private’, ‘Government’ vs. ‘non-Government’, ‘financial’ vs. ‘non-financial’, etc. On examination of a balanced panel of companies, it is observed that
Table 7.4: PUC Coverage of RBI Studies on Corporate Performance |
Item |
2004-05 Firm |
2005-06 Revised |
2006-07 Tentative |
1 |
2 |
3 |
4 |
(1) |
Non-financial Public Limited Companies |
|
|
|
| |
No. of companies |
3877 |
3160 |
1641 |
| |
Sample PUC (Rs. crore) |
84875 |
78398 |
52215 |
| |
Population PUC (Rs. crore) |
229875 |
259638 |
276666 |
| |
PUC Coverage (%) |
36.9 |
30.2 |
18.9 |
(2) |
Non-financial Private Limited Companies |
|
|
|
| |
No. of companies |
1804 |
1257 |
— |
| |
Sample PUC (Rs. crore) |
7801 |
5904 |
— |
| |
Population PUC (Rs. crore) |
89366 |
113256 |
130664 |
| |
PUC Coverage (%) |
8.7 |
5.2 |
— |
(3) |
Financial Companies |
|
|
|
| |
No. of companies |
1479 |
1237 |
457 |
| |
Sample PUC (Rs. crore) |
14571 |
13487 |
6326 |
| |
Population PUC (Rs. crore) |
54842 |
58524 |
62940 |
| |
PUC Coverage (%) |
26.6 |
23.0 |
10.1 |
Source: RBI and MCA. |
4,810 public limited companies account for around 66 per cent and 2,762 private limited companies contribute more than 60 per cent of global PUC (Table 7.5). If instead of a balanced panel, all the data procured from MCA are used, coverage in global PUC improves further and for 2006 it is more than 80 per cent. That means with appropriate reporting of all these 9,000 companies itself, the coverage problem could be solved to a large extent. It may be noted that data used for this exercise was confined to companies which have PUC Rs.5 crore and above. The HLC also examined the validity of using PUC as blow up factor for estimating savings of NGNFCs across various size classes. The correlation coefficient between retained profits and PUC was, however, found to be very weak (Annex 7.1).
VII.47 With progressive implementation of MCA21 and improvement in data reporting, certainly the coverage is expected to improve further. Once data quality and reporting issues are resolved, it is suggested to do away with the present methodology and implement direct aggregation method on MCA21 data, particularly in the medium term, say by the year 2010-11.
VII.48 The huge coverage of MCA21 database makes a case for examining whether this new database could help improve the estimation of overall savings and other performance parameters. To this extent, the HLC examined the MCA21 database with respect to estimation of other related variables viz., (a) corporate investment; (b) household savings, and (c) some other indicators of private corporate sector, such as, borrowing from banks.
Data Quality – MCA21 vis-à-vis RBI Data Base
VII.49 The data reporting, item definitions and reliability issues between MCA21 and RBI were examined in detail by the HLC. The quality of the databases was examined with respect to select items, such as, PUC, dividend, depreciation, sales for select companies. While verifying the data in the submitted forms under MCA21 with the annual account for few companies, it was found that the data was exactly matching. The data were further verified for different types of companies (like manufacturing, trading, services etc.). It is found that manufacturing companies showed their income under sales (either domestic or export), trading companies showed under trade, service companies (including financial companies) showed under services, thus, ensuring consistency in data filing for non-financial companies vis-à-vis financial companies. Besides, the MCA is also ensuring that companies feed correct data as company director is digitally signing on the documents and if data are wrongly fed, they are punishable as per the Companies Act. Therefore, it is less likely that data discrepancies occur due to wrong data or data entry-level problem. The reasons for some data discrepancies are purely technical/definitional.
Table 7.5: Coverage of MCA Sample Data (Balanced Panel) |
Item |
2005-06 |
2006-07 |
1 |
2 |
3 |
(1) |
Non-financial Public Limited Companies |
|
|
| |
No. of companies |
4810 |
4810 |
| |
MCA Sample PUC (Rs. Crore) |
158960 |
182825 |
| |
Population PUC (Rs. Crore) |
259638 |
276666 |
| |
PUC Coverage (%) |
61.2 |
66.1 |
(2) |
Non-financial Private Limited Companies |
|
|
| |
No. of companies |
2762 |
2762 |
| |
MCA Sample PUC (Rs.Crore) |
71210 |
79094 |
| |
Population PUC (Rs. Crore) |
113256 |
130664 |
| |
PUC Coverage (%) |
62.9 |
60.5 |
Source: MCA. |
VII.50 The results pertaining to three items, viz., PUC, dividend and depreciation for the year 2006-07 are shown in Annex 7.2. The observed difference was found to presumably coming from the incongruence data definitions followed by these institutions. In this context, the HLC suggested that data definitions must be unique, and the practice and definitions followed in RBI company finance studies should be implemented in MCA21 data so that these two datasets are consistent and comparable. In addition, these metadata issues and sources of discrepancy should be sorted out mutually between MCA and RBI.
VII.51 After examining the data availability, reporting and data quality issues with MCA, the HLC strongly suggests using MCA21 data for estimation of savings (and also capital formation) of all private companies, including financial companies. In order to capture the data at RBI-end, the HLC felt that MCA must provide appropriate access rights to the MCA21 database so that dataflow is ensured. Finally, the HLC emphasised the need for an ongoing consultative approach and strengthening of the statistical system of both the organisations. As regards the institutional support for generating and improving the statistical system, inadequate staffing problems should be addressed soon so that massive statistical data collection systems in MCA and RBI are reinforced.
Items Presently Covered Under MCA21 Database
VII.52 The HLC studied the item-wise details of data reporting in 23AC and 23ACA and examined the sufficiency of items necessary for estimating corporate savings. The HLC also considered MCA21 data for supplementing relevant information for estimating household savings, corporate investment, and some other relevant variables.
VII.53 It was observed that the present standard of data reporting in these forms provide majority of the items. However, a few critical inputs mostly relating to capital gains and income/expenditure from previous years are not reported under MCA21 though this information is available with companies’ accounts. The magnitude and dimension of these items are volatile, irregular, unpredictable and varies in the range of 6 per cent to 10 per cent of savings of NGNFCs. In view of their importance in savings, it is suggested to include them appropriately in MCA21 data reporting system itself
New Items in MCA21 Database
VII.54 The issue of incorporating new data items in 23AC and 23ACA was taken up with MCA in consultation with the CSO.
VII.55 Suggestions to include New Items for Corporate Savings Estimation: It is rightly acknowledged that the change in reserves and surplus from balance sheet (already available in Form 23AC) is useful in estimating corporate savings. However, it is not possible to estimate savings only with the reserves and surplus data. It has to be adjusted for bond redemption reserves, revaluation reserves, etc., for which inclusion of new data fields was warranted. Therefore, the HLC suggests to include, in Form 23ACA, additional data fields on (a) net amount transferred to reserves5, (b) net amount transferred to Balance sheet6, (c) capital gains (+)/losses(-)7 and (d) income(+)/expenditure(-) related to previous years8. In addition, it was decided that deferred tax liability could be taken from balance sheet as a difference in current year and previous year figure, which already is being captured in Form 23AC.
VII.56 Suggestion to include New Items for Estimating Corporate Investment: Regarding corporate investment, the procedure of estimating inventory formation by both RBI and CSO is similar. However, there exist differences between the estimation methodology followed by RBI and CSO. The RBI is estimating it as the change in fixed assets excluding intangible assets adjusted for revaluation, whereas, the CSO is estimating it as additions to the gross block minus deductions to the gross block adjusted for depreciation and deductions during the year. In addition, it is felt that the change in producible intangible assets should also be considered as asset formation. However, getting information from the companies on producible and non-producible intangible assets may not be possible. Based on practical consideration, the HLC indicated inclusion of two additional data fields, viz., non-producible intangible assets and revaluation of fixed assets in Form 23AC.
VII.57 Suggestion to include New Items for Household Savings: The HLC also considered MCA21 data for supplementing relevant information required for estimating household financial savings. It is observed that with some minor adjustment in the MCA21 data reporting of balance sheet, related instruments of household financial savings could also be obtained. These include (a) currency with the corporate sector, (b) households’ public deposits with non-bank non-financial companies, (c) loans availed by households from non-bank non-financial companies, (d) households’ acquisition of trade debt (net) giving details for the unincorporated business units, trusts, associations, etc. In order to incorporate these elements, the HLC suggests inclusion of the following items in the balance sheet structure as (a) sundry creditors, (b) loans and advances to public (including Directors and employees), (c) investment in Govt. securities, (d) cash at hand and (e) bank balances.
5Net amount transferred to reserves may be calculated as amount transferred to any kind of reserves – amount
transferred from any kind of reserves.
6Net amount transferred to balance sheet may be calculated as amount transferred to balance sheet – amount
transferred from balance sheet.
7Capital gains/losses may be calculated as sum of (i) profit(+)/loss(-) on sale of fixed assets, (ii) profit(+)/loss(-) on
sale of investments (excluding for the companies trading in shares), (iii) loss due to fire, flood, theft, etc and any such
other profit(+)/ loss(-) of capital nature.
8Income(+)/expenditure(-) related to previous years may be calculated as sum of (i) provisions no longer required
written back (bad debts, taxation, etc.), (ii) liabilities written back, (iii) assets or investments written off and (iv) any
other income(+)/expenditure(-) relating to previous years.
VII.58 Suggestion to include Few Select Items on Corporate Activity: The HLC found few other indicators relating to corporate sector which were found to be critically important to Banking Sector and National Economy. Inclusion of those items in 23AC would facilitate better understanding between corporate performance and bank lending. In this context, the HLC suggests inclusion of (a) borrowing from banks (under ‘Secured Loans’) and (b) borrowing from banks (under ‘Un-secured Loans’). It is also worthwhile to include reporting of installed capacity (under ‘turnover details of three principal products’), in Form 23ACA to build up a ‘capacity utilisation index’ at national level. In addition, MCA may explore collection of information on different types of employment from companies.
VII.59 The revisions suggested on Form 23AC and Form 23ACA are presented in Annex 7.3 and Annex 7.4, respectively.
Need for Data Standards - XBRL
VII.60 The inadequacies in traditional business reporting systems are well known and they necessitate development and adoption of standard definitions and innovative procedures. Two recent developments enable such innovative systems in business reporting. The foremost among them is the Internet. It provides cheap yet very effective infrastructure for connectivity not only within one organisation but also with other outside organisations. Another important development is the emergence of electronic data interchange (EDI) standards. These standards help in sharing the data between two organisations in an agreed format.
VII.61 The combination of internet and EDI standards has created an opportunity for reengineering the entire business reporting process. It is in this context that the eXtensible Business Reporting Language (XBRL), developed as a standard for business reporting assumes significance.
VII.62 The XBRL takes advantage of this feature of XML. But unlike XML, XBRL is not just a language, but also a standard. Its vocabulary is established by standard vocabulary. Using this standard vocabulary, business transactions and operations can be referred and reported in a standard way. XBRL is a standard designed to eliminate the constraints of incompatible formats and vocabularies. A voluntary global consortium, XBRL International, is actively involved in development of XBRL standards. The membership of the consortium includes regulators, service companies, software vendors, professional services providers and accounting and trade organisations.
VII.63 XBRL specifies data-formatting conventions and vocabularies for marking up and describing business-reporting data. It enables the structuring and processing of business reporting fragments and documents, thus, making possible the speedy creation, assembly, exchange, search, extraction, analysis and publication of business information, such as financial statements and statutory returns. Tags (descriptive names) are attached to items of data as per the agreed upon vocabulary.
VII.64 XBRL is free of any hardware platform, software operating system and programming language. It can, thus, help companies to efficiently manage, move and exchange data across the organisations. XBRL achieves this through its four major components – (i) taxonomies, (ii) business facts, (iii) instance documents, and (iv) business reports.
VII.65 Several sets of taxonomies are used to define XBRL documents presenting financial reports. While one set of taxonomies defines the XBRL representations of general information needed in the financial report, another set represents the disclosures that accounting standards (like GAAP or IFRS) require. Another set of taxonomies represents the financial statements themselves. Put together these sets of taxonomies specify the accounting concepts that are generally applicable to all industries. Interestingly, XBRL provides for defining new taxonomies and new terms in taxonomies so that an organisation can use its own set of taxonomies relevant to it.
VII.66 Realising the potential of XBRL, Government agencies and financial organisations globally have already started initiatives to adopt XBRL standards for business reporting. The Australian Prudential Regulation Authority (APRA) has been one of the early Government agency to have adopted XBRL for collecting regulatory data. Several deposit-taking organisations and credit unions submit their returns to APRA in XBRL. Similarly, the U.K Inland Revenue office has established an electronic submission of returns that gives companies an option of using XBRL form to submit their corporate tax returns. Many of the European central banks receive data from companies in XBRL format (FINREP) and from banks on Basel II reporting (COREP). National Tax Agency of Japan and the Federal Deposit Insurance Corporation are receiving data submission through XBRL standards. Besides Government agencies, several financial organisations are also working towards adoption of XBRL standards. Tokyo Stock Exchange, Bank of America and Moody’s Risk Management Services have taken initiatives in this direction.
VII.67 In India, in order to streamline the reporting from banks to the central bank, the Reserve Bank of India has implemented the new Basel II reporting by banks using XBRL. It is in the process of bringing more returns to XBRL format in phases and the first phase of the project is expected to be completed by March 2009. The Institute of Charted Accountants of India (ICAI) has taken the initiative to form XBRL-India and to become part of XBRL-International. They work closely with SEBI, Stock Exchanges, RBI, IRDA and Accounting Standards Groups for introduction of XBRL-based reporting by companies to various regulatory authorities. The standards are expected to be put in place very soon. SEBI and stock exchanges are awaiting the standards for implementation of financial reporting by companies.
The MCA 21 Data Base and XBRL Platform
VII.68 The HLC, upon in-depth deliberation, notes the innovative features of XBRL and feels that XBRL platform may be helpful in assuring consistency and accuracy of reporting system in the context of corporate database in the country. In particular, the HLC suggests the MCA to explore the likely benefits from adopting XBRL platform for its’ MCA 21 database. The HLC is in the view that XBRL platform for MCA 21 database would very likely strengthen the data reporting standards and, hence, would improve the data quality and coverage. Further, noting the role played by ICAI as a nodal institute to the XBRL-India, the HLC recommends that the ICAI would initiate discussion with MCA towards possible inclusion of MCA 21 database under the XBRL platform.
Corporate Savings Estimates on ‘Mark to Market Basis’
VII.69 The ToR assigned to the HLC deals with a proposal that the corporate sector savings estimates should be on the basis of mark to market valuations. Marking to market is an important risk management procedure, where small price movements can result in large exposures to loss. There continues to be a debate about whether historical book values are the correct measures for balance sheet presentation. The suggested mark to market revalues an asset, liability or the financial instrument to the current market price, as distinct from historical cost. The feasibility of such an accounting depends on the availability of cash market prices of the assets and change in the financial accounting rules. This is a technical problem and in the absence of liquid market for various types of assets, the problem of current market value as a measurement base will persist. Secondly, though, it is believed that mark- to- market is a more appropriate measurement for short-term flows, however, it may lead to wide fluctuations in assets and liabilities from one reporting period to the next even when the underlying fundamentals do not change. In such a case, mark to market estimation may not be appropriate either.
Recommendations
VII.a With progressive implementation of MCA21 and improvement in data reporting, the coverage is expected to improve further. Therefore, the HLC strongly suggests using MCA21 data for estimating savings and capital formation of non-Government non-financial companies and non-banking financial companies. Once data quality and reporting issues are resolved, it is suggested to do away with the present methodology and implement direct aggregation method based on MCA21 data.
VII.b In addition to estimating the corporate savings and capital formation for the nonGovernment non-financial companies and non-banking financial companies using the present blow up factor methodology, estimates may be made using MCA21 global data from the year 2008-09. The two sets of estimates may be compared for improving coverage and quality of MCA21 data base. It is expected that MCA21 data base would stabilise by 2010-11 and accordingly, the HLC recommends that savings and investment estimates from the year 2010-11 may be made using MCA21 data for all companies, dispensing with the blow up factor method.
VII.c The HLC suggests including the following additional data fields in Form 23ACA submitted under MCA21: (a) net amount transferred to reserves, (b) net amount transferred to balance sheet, (c) capital gains (+)/losses(-), and (d) income(+)/expenditure(-) related to previous years. In addition, it was decided that net deferred tax liability could be taken from balance sheet as a difference in current year and previous year figure, which is already being captured in Form 23AC. The HLC also indicated including two additional data fields, viz., non-producible intangible assets and revaluation of fixed assets in Form 23AC.
VII.d The HLC also considered MCA21 data for supplementing relevant information required for estimating household financial savings. In order to incorporate the elements for use in estimating household financial savings, the HLC suggests including the following items in the balance sheet structure in Form 23AC: (a) public deposits, (b) trade debt, (c) loans and advances to public (including directors and employees), (d) investment in Government securities, (e) cash at hand and (f) bank balances.
VII.e There are few other indicators relating to private corporate sector activity which are envisaged to be critically important to banking sector and national economy. Inclusion of those items in 23AC would facilitate better understanding between corporate performance and bank lending. In this context, the HLC suggests including (a) borrowing from banks (under ‘Secured Loans’) and (b) borrowing from banks (under ‘Un-secured Loans’). In addition, it is worthwhile to include reporting of installed capacity (under ‘turnover details of three principal products’, Form 23ACA) to build up a ‘capacity utilisation index’ at national level (Suggested formats for Form 23AC and Form 23ACA are presented at the end of this Report). Further, the HLC suggests MCA to explore collection of information on different types of employment from companies.
VII.f As regards the data quality issues between two databases that are maintained by the MCA and RBI, the HLC suggests that data definitions must be unique, and the practice and definitions followed in RBI company finance studies should be implemented in MCA21 data so that these two datasets are consistent and comparable. In addition, the metadata issues and sources of discrepancy should be sorted out mutually between MCA and RBI.
VII.g The HLC, upon in-depth deliberation, notes the innovative features of XBRL and feels that XBRL platform may be helpful in assuring consistency and accuracy of reporting system in the context of corporate data reporting in the country. In particular, the HLC recommends MCA to explore the likely benefits from adopting XBRL platform for its’ MCA 21 database.
VII.h Further, noting the role played by the ICAI as a nodal institute for the XBRL-India, the HLC recommends that the ICAI works with the MCA towards inclusion of MCA 21 database under the XBRL platform
VII.i In order to capture the data at the RBI-end, the MCA needs to provide appropriate access rights, specifically computable format electronically, to the MCA21 database so that dataflow is ensured.
VII.j In respect of cooperative institutions, there is an urgent need to fill up the data gaps. The NABARD should speed up bringing out their annual publications on Statistical Statements Relating to Cooperative Movements in India (credit and non-credit societies) within a period of one year instead of the current delay of say, four years. The HLC is aware of the arduous task ahead, but nevertheless wishes to emphasise the need to correct this long standing data gap once and for all. It will go a long way in improving the data base on the estimation of savings and capital formation which are derived from the cooperative sector.
VII.k The HLC also recommends that for the years for which the required data are not available as detailed in the NABARD’s above-mentioned publication, the NABARD should put in place a regular system of generating the required estimates based on information available for major institutions or otherwise and making them available to the RBI and CSO from time to time. This should cover all aspects of data requirements for household savings, and savings and investment of cooperative credit and non-credit institutions as well as related area of flow of funds accounts. For this purpose, the CSO should provide the NABARD with appropriate formats in which the data have to be furnished.
(Action: CSO and NABARD)
VII.l Presently, the CSO is estimating the savings of private insurance based on the data available from the Annual Reports of IRDA. This is considered adequate
VII.m There is need to improve the coverage of non-profit corporate institutions serving the private corporate sector. The HLC suggests identifying the frame of such companies. The CSO may undertake sample surveys and also identify appropriate blowing up factor by analysing accounts of sample companies.
(Action: CSO)
VII.n The HLC emphasises the need for an ongoing consultative approach and strengthening of the statistical system at concerned organisations namely, CSO, NABARD, MCA and RBI
(Action: CSO, NABARD, MCA and RBI)
VII.o The HLC strongly suggests the setting up of a full-fledged unit/cell at the MCA to improve coverage, quality and timeliness of MCA21 database.
VII.p The HLC recommends augmenting the staffing position at the RBI to enable handling and analysis of huge corporate database, expected to flow from MCA21 to the RBI.
(Action: RBI)
VII.q The HLC also recommends strengthening statistical units both at the CSO, NSSO and NABARD.
(Action: CSO, NSSO and NABARD)
VII.r The HLC feels that basing savings estimates on ‘mark to market basis’ may not be apt as it may lead to wide fluctuations from one reporting period to the next even when the underlying fundamentals do not change. Moreover, absence of liquid market for various types of assets also makes such estimation inappropriate.
(Action: RBI)
Chapter VIII : Estimation of the Public Sector Savings
VIII.1 The estimates of savings, capital formation as also the estimates of GDP for the public sector are prepared separately for (i) administrative departments of the Government including the departmental commercial undertakings (DCUs), and (ii) non-departmental commercial undertakings (NDCUs). For estimating the savings and capital formation and other macro-aggregates for the administrative departments and the DCUs, the CSO reclassifies each transaction in the budget documents and regroups them into meaningful economic categories e.g., wages & salaries, purchase of goods and services, current transfers and subsidies, etc., For estimating the savings and capital formation and other macro-aggregates in respect of NDCUs, their annual accounts are analysed by the CSO.
Administrative Departments and DCUs
VIII.2 Producers of Government services i.e., administrative departments comprise Government departments, offices and other bodies of central, State/union territories and local authorities. The public services of Quasi-Government bodies/autonomous bodies such as All India Institute of Medical Sciences, Kendriya Vidyalayas, Indian Council of Agricultural Research, etc., and the activities of social security funds viz., Employees Provident Fund Organisations (EPFOs) are also considered under the category of Administrative Departments.
VIII.3 Parts of the activities of the Government, which are commercial in nature, such as railways, communication, posts, electricity, are classified as Departmental Commercial Undertakings (DCUs). These are unincorporated enterprises owned, controlled and run directly by public authorities. These enterprises normally do not hold or manage financial assets and liabilities apart from their working balances and business accounts payables and receivables. Unlike administrative departments, DCUs charge for the goods and services they provide on commercial basis.
VIII.4 For various transactions of the producers of Government services and DCUs, the budget documents consisting of annual financial statements and demands for grants of all the ministries/ departments of Central, State Governments as well as local authorities form the major source of data. However, the budget documents of all local authorities whether urban or rural are not available.
VIII.5 The annual financial statement and the demands for grants in a Government budget are drawn up in accordance with the provisions laid down in the constitution and regulations for their legislative control. The expenditure in the Government budget is generally classified department-wise in order to secure legislative control, administrative accountability, booking and auditing of any act of spending. Though the budget is divided into revenue and capital accounts, many items of consumption expenditure are included in the capital account and vice versa. Moreover, the expenditure relating to different kinds of transactions are scattered over many sub/minor heads of budgetary classification not necessarily keeping in view their economic characteristics. For these reasons, from the details as furnished in the budget documents, it is not readily possible to get a clear idea of expenditure incurred on capital formation, savings and Government’s contribution to the generation of national/State income. Each transaction in the budget documents is, therefore, reclassified and regrouped into meaningful economic categories e.g. wages & salaries, purchase of goods and services, current transfers and subsidies, etc.
Savings
VIII.6 The savings of Government’s Administrative Departments is obtained by deducting the current expenditures from the current receipts. The items of current expenditure include i) final consumption expenditure ii) interest on public debt iii) subsidies and iv) current transfers, while the items of receipts are i) income from entrepreneurship and property ii) direct taxes; iii) indirect taxes and iv) miscellaneous receipts.
Sources of Data for Local Bodies
VIII.7 For the preparation of estimates of GDP, savings and capital formation in respect of local bodies, the base year data for local bodies and the data directly collected and analysed by some of the State DESs along with the data on current and capital grants to local bodies available in the Central and State Government budgets are made use of. For other States and UTs, data on both current and capital grants to the local authorities by the respective Governments as available from the budget documents are utilised.
Sources of Data for Autonomous Bodies
VIII.8 The estimates relating to Quasi-Government bodies are prepared using the workforce estimates and the estimated value added per worker obtained from the annual reports of the research and scientific institutions. In the case of EPFO, annual accounts form the source. Fixed ratios based on benchmark year’s analysis of accounts of some of the Quasi-Government bodies, are used to derive the estimates of savings and capital formation for these bodies.
Public Private Partnerships
VIII.9 Public-Private-Partnerships or PPPs have been providing infrastructure services in India for quite some time now. The PPPs basically help in meeting the gaps in the provision of basic services which are normally required to be provided by the Government. The PPP entities which provide the infrastructure facilities or the services are generally the private sector or public sector enterprises.
VIII.10 One of the Planning Commission’s documents on PPPs in social sector provides the following differences between public-private-partnership and ‘privatisation’:
• Responsibility: Under privatization the responsibility for delivery and funding a particular service rests with the private sector. PPP, on the other hand, involves full retention of responsibility by the Government for providing the service.
•
Ownership: While ownership rights under privatization are sold to the private sector along with associated benefits and costs, PPP may continue to retain the legal ownership of assets by the public sector.
• Nature of Service: While nature and scope of service under privatisation is determined by the private provider, under PPP the nature and scope of service is contractually determined between the two parties.
•
Risk & Reward: Under privatization all the risks inherent in the business rest with the private sector. Under PPP, risks and rewards are shared between the Government (public) and the private sector.
Some of the potential benefits expected from PPP are listed below:
•
Cost-effectiveness - since selection of the developer/ service provider depends on competition or some bench marking, the project is generally more cost effective than before.
• Higher Productivity - by linking payments to performance, productivity gains may be expected within the programme/project.
• Accelerated Delivery - since the contracts generally have incentive and penalty clauses vis-a-vis implementation of capital projects/programmes this leads to accelerated delivery of projects.
• Clear Customer Focus - the shift in focus from service inputs to outputs create the scope for innovation in service delivery and enhances customer satisfaction.
•
Enhanced Social Service- social services to the mentally ill, disabled children and delinquents etc., require a great deal of commitment than sheer professionalism. In such cases it is Community/Voluntary Organisations (VOs) with dedicated volunteers who alone can provide the requisite relief.
•
Recovery of User Charges- Innovative decisions can be taken with greater flexibility on account of decentralization. Wherever possibilities of recovering user charges exist, these can be imposed in harmony with local conditions.
VIII.11 As understood from the above, the PPPs are either the private sector or public sector units, which incur the requisite expenditures and provide services as per the agreement with the Government (centre or state). In such case, the contribution of PPPs to GDP, savings and capital formation is required to be compiled from their annual reports/ profit and loss accounts/balance sheets.
VIII.12 The present method of estimating these aggregates by the CSO is on the basis of analysis of the annual accounts of NDCUs and the RBI’s studies on corporate sector, in respect of these two institutional sectors. While there appears to be no problem in covering the PPPs being implemented by NDCUs, as the CSO takes into account all the NDCUs while analysing the public sector transactions, the position may not be so in the case of PPPs being implemented by the private sector units. Theoretically, the RBI studies on corporate sector would account for the PPPs in private corporate sector, but in practice, there is possibility of their not being included in the studies on account of the PPPs not submitting annual accounts before the commencement of their commercial activities. Also, there may be requirement of showing the contribution of PPPs to the macro aggregates, separately, which at present is not possible due to the manner in which the estimates are compiled for public sector and private corporate sector. A brief write-up on the accounting treatment of PPPs is included in this report and is placed at Annex A 8.1.
Non-Departmental Commercial Undertakings (NDCUs)
VIII.13 Annual Reports, profit and loss accounts and balance sheets of each unit of the NDCUs form the main sources of data for economic analysis in respect of NDCUs. In order to compile the savings estimates for NDCUs, the profit and loss accounts of them are analysed according to the nature of economic transactions and consolidated into production and income outlay accounts separately for financial and non-financial corporations.
VIII.14 In the following paragraphs, the procedures adopted for estimating savings and capital formation of Government administration, including those of local bodies has been explained.
Sources and Methods of estimating Savings from the Public Sector
VIII.15 Savings stands for the balancing item in Income and Outlay Account as per 1968 SNA and in the use of Disposable Income Account as per 1993 SNA of producing enterprises, Government administration and households. It represents the excess of current income over current expenditure. The estimates of domestic savings are prepared only at current prices.
Administrative Departments
VIII.16 Administrative Departments and Departmental Commercial Undertakings of Government, Non-Departmental Commercial Undertakings and Quasi-Government bodies constitute the Public Sector. The estimates of savings are prepared separately for (i) administration (including local bodies) and departmental enterprises, (ii) non-departmental enterprises and (iii) quasi-govt. bodies and the aggregate of these estimates represents the savings of the public sector.
VIII.17 The Administrative Departments comprise Government departments/ organisations of the centre, the states and local authorities providing non-marketed goods and services like general administration, public health, education, defence, law and justice, social security and promotion of economic welfare for the community at free of cost or at economically insignificant prices. The activities of the Issue Department of RBI and EPFO are regarded as administrative services and, therefore, they form part of the producers of Government services. The Departmental Commercial Undertakings (DCUs) are unincorporated enterprises owned, controlled and run directly by public authorities (the centre, state Governments and local authorities). These enterprises normally do not hold or manage financial assets and liabilities apart from their working balances and business accounts payables and receivables. Unlike administrative departments, DCUs charge for the goods and services they provide on commercial basis. The criteria followed to distinguish enterprise activity from administration activity are: (i) use of commercial accounting methods to determine profit and loss and (ii) control of productive capital in the form of equipment such as machines, plants and stocks.
VIII.18 In the national account statistics, the DCUs include railways, communications and other DCUs. The railways and communications have been treated as quasi corporations and their accounts are prepared separately. The other DCUs include activities of govt. irrigation, commercial plantation, forestry, generation of power, milk supply scheme, ordnance factories, Govt. printing presses, security press, mints, currency and coinage, civil aviation, road transport and water transport etc.
Methodology and Sources of Data
VIII.19 Annual financial statements, receipt budgets, demand for grants presented in Parliament and State legislatures and council of local bodies and the finance accounts published by the Comptroller & Auditor General of India are the main sources of data. The budget documents contain the details of current and capital expenditures at object level under each major account head/sub-head /minor head uniformly adopted by all central ministries/ departments and State Governments in accordance with coding pattern prescribed by the Comptroller and Auditor General (C&AG). Though the budgets show explicitly revenue (current) and capital accounts, many minor items of capital expenditure appear in the current account and also vice versa which are only of the nature of transfers between current and capital account heads within the same demand for grants. For instance, purchase of office equipment like A.Cs, computers etc., are accounted in the revenue expenditure under office expenses whereas in the budget analysis, the same expenditure will be classified as the capital expenditure by the CSO. By classifying such transfers by economic categories, care is taken to ensure that the actual expenditure of goods and services is not reduced or increased by such internal adjustments, nor is there any omissions or duplication.
VIII.20 The significant steps involved in budget analysis of either the Central/State Government budget or local bodies’ finances to prepare different accounts including income and outlay account for deriving savings component, comprise (i) classification of transactions under each major account head in the demands for grants according to (a) the economic character of the expenditure like expenditure on salaries and allowances, goods and services,maintenance, capital formation, loans, and advances, transfers etc, and (b) the purpose it serves, such as, health, education, recreation, defense, etc. (ii) Cross validation of the data classified from demands for grants with those from finance account/annual financial statement for all major accounts (iii) Distribution of pension component between administrative departments and DCUs in proportion to their total salaries (iv) Generation of the following accounts in respect of Central Government, State Governments and State local bodies, (v) Consolidation of accounts of the Central Government, State Governments and local authorities.
• Borrowing account
•
Income and outlay account of administrative departments
• Capital finance account of public authorities
•
Net product from public administration and defence
•
Domestic product of DCUs by industry of origin and factor incomes
•
Capital formation (administration)
•
Capital formation (enterprises)
•
Economic-cum purpose classification
VIII.21 For generation of the above accounts (except first and last) in respect of local bodies, the financial Statements/reports of urban local bodies as well as rural local bodies need to be analysed in the same lines of State budget analysis.
VIII.22 The consolidated estimates of administrative departments and DCUs are compiled from the consolidation of the above accounts from analysis of budgets of central departments/ministries and State Governments and the estimates of local bodies. The local body estimates are compiled on the basis of the full set of accounts of local bodies received from a few States and the grants received by local bodies as current/capital transfers from either Centre/State Government or by other agencies. Once the consolidated accounts are prepared, the same are used for deriving NDP/GDP, capital formation and savings for the respective institutional units.
VIII.23 Savings is derived as the excess of current receipts over current expenditures in the income and outlay account of administrative departments and other departmental enterprises. In the income and outlay account, the current expenditure (uses) includes (a) final consumption expenditure containing compensation of employees and net purchase of goods and services and consumption of fixed capital (CFC) (b) interest on public debt (c) subsidies (inclusive of imputed subsidies) and (d) current transfers and inter-Government accounting adjustment while the receipts (resources) comprise (a) income from entrepreneurship and property (b) direct taxes containing corporation taxes, land revenue and other direct taxes (c) indirect taxes having the components customs, excise – central and State, sales tax and registration and other taxes and duties and (d) miscellaneous receipts and transfers from public authorities. There is no exclusive provision for depreciation in the budget documents for administrative departments and assumed to be equivalent to the CFC estimates worked out by perpetual inventory method (PIM). Therefore, CFC for administrative departments forms part of final consumption expenditure of those departments. The layout of this account is given below in Table 8.1.
VIII.24 In the case of DCUs other than Railways and Communication, the source material is the same budget documents used for administrative departments. Savings is regarded as the profits generated in the industries. If DCU shows losses as a consequence of Government policies (thus, selling goods and services not at economically significant prices), the operating losses of the DCU are treated as imputed subsidy and as such no profit arises in that DCU. This was the case in the irrigation industry upto the old series of NAS. The treatment of operating losses as imputed subsidies has been extended to other industries of DCUs in the new series of NAS (base year 1999-00).
Railways
VIII.25 Demand for Grants for Expenditure of the Central Government on Railways, Budget of Railway Revenue and Expenditure of the Central Government , Explanatory Memorandum on the Railway Budget, Works, Machinery and Rolling Stock Programme of Railways – Part-1 (Summary) Detailed Appropriation Accounts part-II and Annual Report and Accounts of the Indian Railways are the main sources of data for compiling various economic aggregates of the Railways.
Table 8.1: Income & Outlay Account of Administrative Departments including DCUs |
Expenditure |
Receipts |
1. |
Final consumption expenditure |
7. |
Income from entrepreneurship & property |
2. |
Interest on public debt |
|
7.1 |
Profits |
3. |
Subsidies (including imputed subsidies) |
|
7.2 |
Income from property |
| |
|
|
|
7.2.1 Interest receipts |
| |
|
|
|
7.2.2 Other property receipts |
4. |
Current transfers |
8. |
Direct taxes |
| |
4.1 |
To the rest of the world |
|
8.1 |
Corporation taxes |
| |
4.2 |
To other sectors |
|
8.2 |
Land revenue |
| |
|
|
8.3 |
Other taxes |
5. |
Net Savings |
9. |
Indirect taxes |
| |
|
|
9.1 |
Customs |
| |
|
|
9.2 |
Excise |
| |
|
|
9.3 |
Sales tax |
| |
|
|
9.4 |
Stamps |
| |
|
|
9.5 |
Other taxes and duties |
| |
|
10 |
Miscellaneous receipts |
6. |
Disbursements |
11 |
Receipts |
VIII.26 Analysis of the data from the above first two sources provides the current income and current expenditure for preparing the income and outlay account of the Railways as an enterprise (including all activities of the Railways viz., transport, manufacturing and construction). Savings is obtained as the balancing item from this income and outlay account.
Ministry of Communications
VIII.27 Demand for Grants for expenditure of the Central Government on Ministry of Communication including Department of Telecommunication and Demands for Grants of Posts are the main sources of data for compiling various economic aggregates of the Communications. The savings is estimated for the Communication enterprise from income and outlay account of Communications.
Non-Departmental Enterprises
VIII.28 The Non-Departmental Commercial Undertakings (NDCUs) comprise mainly (i) Government companies in which not less than 51% of the paid up capital is held by the Central Government or State Government or partly by central and partly by one or more State Governments and subsidiaries of Government companies like HAL, BHEL etc., and (ii) statutory corporations set up under special enactments of Parliament or State Legislatures, like FCI, State Road Transport Corporations, State Electricity Boards, Nationalized Banks, State Financial Corporations, Banking department of RBI, LIC etc., and port trusts (such as Oil and Natural Gas Commission, Damodar Valley Corporation, FCI, IAAI, Road Transport Corporations, Warehousing Corporations, Electricity Boards, Nationalised Banks, LIC, etc). The NDCUs differ from the DCUs in that they hold and manage the financial assets and liabilities as well as the tangible assets involved in their business. These enterprises have separate Boards of Directors and present profit and loss accounts and balance sheets as in the case of private corporate sector.
VIII.29 The NDCUs are divided into two categories viz., (i) financial enterprises and (ii) non-financial enterprises. The financial enterprises comprise (a) the nationalised banks and the banking department of RBI, (b) financial corporations, and (c) LIC, GIC and its subsidiaries and Employees State Insurance Corporation (ESIC). The non-financial enterprises consist of all other undertakings/ enterprises of central, state, union territory Governments and local authorities under the industry groups agriculture, forestry and logging, fishing, mining, manufacturing, electricity and gas, road air and water transport including port trusts, storage and warehousing, trade, hotels & restaurants and other services.
VIII.30 In the case of non-departmental enterprises the annual reports giving the profit and loss accounts and balance sheets obtained from the individual undertakings form the basis of analysis. The coverage of these undertakings is more or less complete. More than 1100 central and state NDCUs engaged in different economic activities are covered, details of which are given below in Table 8.2:
Table 8.2: NDCUs by Industries |
Sector |
Industry |
No. of NDCUs |
1 |
2 |
3 |
I. Financial |
Banking & Insurance |
255@ |
II. Non-Financial |
|
|
Centre |
Agriculture (01) |
1 |
| |
Forestry (02) |
1 |
| |
Other Mining (04) |
13 |
| |
Coal Mining (04) |
9 |
| |
Manufacturing (05) |
100 |
| |
Construction (09) |
12 |
| |
Trade (10) |
19 |
| |
Hotel & Rst.(11) |
6 |
| |
Communication (17) |
4 |
| |
Other Services (19) |
22 |
| |
Total |
186 |
State |
|
|
| |
Electricity & Gas |
76*# |
| |
Trade |
131 |
| |
H &R |
24 |
| |
Manufacturing |
188 |
| |
Other Mining |
22 |
| |
Agriculture |
43 |
| |
Fisheries |
9 |
| |
Forestry |
28 |
| |
Construction |
76 |
| |
Other Services |
56 |
| |
Transport, Ware Housing & Port Trust |
88# |
@ : including 105 schemes of UTI, * : Excluding 44 Private Companies, # : including Central NDCUs. |
VIII.31 All the non-departmental public enterprises of centre as well as State Governments present to their shareholders annual reports which give description of major activities of enterprises in addition to annual profit & loss account and balance sheet at the end of each of their accounting year. The estimates of value added, savings and capital formation as well as the accounts in respect of NDCUs are prepared in CSO by analysing the data contained in profit and loss accounts and balance sheets of the enterprise.
VIII.32 As stated, annual reports, profit and loss accounts and balance sheets of each unit of the NDCUs form the main sources of data for economic analysis in respect of NDCUs. In order to compile the savings estimates for NDCUs, the profit and loss accounts of them are analysed according to the nature of economic transactions and consolidated into production and income outlay accounts separately for financial and non-financial corporations. The former account is meant for the production activities of the enterprise during the year whereas the latter presents the current receipts as sources and current expenditure as uses. The sources include operating surplus, property income (receipts) and current transfers received. Current expenditure (uses) comprises property income (payments), direct tax provisions and current transfers paid. The savings of an enterprise is estimated as the balancing item from income and outlay account. The estimates of savings can also be obtained as an aggregate of net transfer to balance sheet and net transfer to reserves adjusted for expenditure and income relating to previous years. Capital gains and losses are excluded and do not form part of the sources or uses in the income and outlay account. Capital gains/losses in respect of non-financial enterprises generally occur due to profit on sale of second hand physical assets. As capital gain/losses are not treated as part of current income, the increase/decrease in surplus as shown in the books of account does not compare with that arrived at after analysis of data. To set off the imbalance in the capital finance account, the value of deductions due to sale of physical assets is increased / decreased by the amount of capital gains/losses which is equivalent to the price paid by the purchaser.
Non-Financial Corporations
VIII.33 Non-financial corporations are corporations whose principal activity is the production of market goods or non-financial services.
Analysis of Reports of Non-Financial Enterprises
VIII.34 Data available from the sources mentioned above are analysed for each NDCU in an analysis sheet specially designed for the purpose so as to prepare a set of economic accounts to depict various transactions of the NDCUs. The contents of analysis sheet are discussed in a section below. The economic analysis of data is based on generally accepted concepts, definitions and classifications developed in the field of national accounting for evaluating the potentiality and contribution of various sectors of the economy and their inter-relationships as recommended in the SNA. The national accounts framework presents an inter-locking system of accounts for the transactions of the whole economy and public sector accounts including that of NDCUs appear as one element of the whole system. The accounts are designed to obtain the kind of information on public sector transactions, which are required for determining aggregates of national income and expenditure and for tracing their inter-relationship with other major sectors of the economy. For the preparation of economic accounts of NDCUs at current prices the data contained in the annual reports of the NDCUs are analysed in detail as discussed in the following paras. The NDCUs are classified into various industrial categories according to the nature of their economic activities. Estimates of the components of domestic product, capital formation and savings at current prices are prepared from the analysed data on various transactions tabulated in the economic accounts of the respective institutional/industrial categories.
VIII.35 The annual accounts containing the profit and loss account and the balance sheet obtained from the individual enterprises are analysed for preparation of the economic accounts in respect of the non-departmental enterprises in various industry groups. The production, income & outlay and capital finance accounts of financial and non-financial sub-sectors of non-departmental enterprises are prepared by consolidating the accounts of individual enterprises within different industry groups. The data contained in the profit and loss accounts which give details of income and expenditure incurred by the enterprises during the accounting year are appropriately classified under the two accounts, viz., production account and income and outlay account. The production account is strictly concerned with items of income and expenditure relating to the production activity of the enterprises during the year. Remaining items of income and expenditure in the profit and loss account are accounted for in the income and outlay account. The estimates of savings, which is defined as the excess of income over expenditure, are obtained from the income and outlay account. The capital finance account is prepared from the data available in the balance sheet including the schedule of fixed assets. The transactions during the year are derived as the difference between the closing and the opening figures shown under various heads.
VIII.36 Some of the big enterprises present in the initial stages an account entitled ‘expenditure during construction account’. This account gives details of expenditure on payment of salaries and wages, provident fund, purchase of materials etc., and allowances for depreciation during the period of setting up of the enterprise. The expenditures under this head are subsequently transferred to balance sheet and successively written off in the profit and loss account over a number of years and partly recorded as additions to fixed assets. On examination of the accounts of a number of such enterprises, it has been observed that in most cases the whole of the expenditure is added to fixed assets although there is a time lag between the incurring of such expenditure and its being changed as fixed assets in the accounts of the enterprises. Such expenditures are therefore assigned to fixed assets in the year in which incurred and this account is merged with production account of the enterprises. The various expenditures are included in inputs and the value of ‘own account capital formation’ is taken as the output.
VIII.37 Profit & loss account and balance sheet: The profit and loss account of producing unit gives an account of its operating income from sales and other sources along with its expenditure of current nature incurred during the year. A balance sheet on the other hand is designed to show the economic position of the unit at a point of time. It gives value of assets owned by the unit and its liabilities on a particular date. Profit & loss account presents information about the activities of an enterprise during a particular year whereas balance sheet gives its position at a point of time i.e. since its inception.
Analysis Sheet
An analysis sheet has five components as shown below:
(a)
Production account: This account is used to prepare the estimates of gross value added.
(b)
Income outlay account: Estimates of savings are prepared with this data. Income and outlay account portrays disbursements on one side and receipts on the other relating to transactions of net income produced and the property incomes.
The receipt or income side contains the entries’ operating surplus brought forward from the production account, property incomes such as interest, rent, dividend, current transfers not elsewhere classified such as insurance claims, refund of income tax, gifts donations, forfeited amounts.
The disbursement or outlay side comprises property payments i.e. rent, royalty, interest dividend, income tax, current transfers not elsewhere classified including provision for bad and doubtful debts donations, etc.
(c)
Liabilities: Liability side contains the entries share and other equity, reserve & surplus, capital transfer, loans and other current liabilities and provisions. All these items are self-explanatory.
(d)
Fixed assets: In the annual report/ accounts of the enterprise there is a schedule of fixed assets and data is culled out from this schedule and estimates of capital formation are prepared.
(e)
Assets: The asset side of the balance sheet presents net fixed assets, investments in securities and shares, current assets such as inventories, sundry debtors, loan & advances and cash & bank balance.
VIII.38 Transactions during a year presented in the profit & loss accounts has a bearing on the liabilities and assets appearing in the balance sheet of the enterprise as at the end of accounting year. All kinds of provisions made or surplus/loss transferred from profit and loss account or the withdrawal from the funds shown in the balance sheet for meeting certain current expenses appear in both the places simultaneously.
Financial Corporations
VIII.39 Financial corporations consist of all resident corporations or quasi-corporations principally engaged in financial intermediation or in auxiliary financial activities which are closely related to financial intermediation. The enterprises which are mainly engaged in banking and financial activities such as banking, share trading and investment holding, loan financing, hire purchase finance, leasing and as well as insurance activity etc., are covered in financial services sector.
1.The Financial sector in India is broadly divided into the following sub-sectors:
(i) Commercial Banks,
(ii) Banking Department of RBI,
(iii) Public non-banking financial corporations (Centre& State) (UTI Mutual Fund, NABARD, EXIM Bank, SIDBI ), DFC, HPFC, Assam FC and Government companies (REC, HUDCO, PFC, IRFC), APIDC, KSIIDC, T.N. Transport Finance Corporation and other State-level financial corporations,
(iv) Life and non-life insurance corporations
VIII.40 The gross output of banks and similar financial institutions is estimated in two components viz., actual service charges and the imputed service charges.
VIII.41 The banking enterprises render services to their customers in the form of maintaining their accounts and providing them banking services. In return for these services, customers are charged a nominal amount, which is substantially smaller than the expenses of the banking enterprises. On the other hand, the banks provide loans and advances and the returns on such transactions are much higher than the payments made to depositors. This net return accruing to banks is large enough to meet their expenses and to earn a profit. If the financial enterprises are treated like any other productive enterprise, their income in the production account would only be limited to the charges made on customers which would mean that the banks would have a negative operating surplus and most likely negative value added. To circumvent this difficulty, an imputed income equivalent to interest and dividend receipts of banking and financial enterprises net of interest paid to depositors is defined as Financial Intermediation Services Indirectly Measured - FISIM (Income earned in return for services rendered) and is entered as a receipt item in the output of the financial enterprises, thus, includes interest received which was paid by the producing industries. As the interest paid by the industries is already accounted for in the GDP of the respective industries, its inclusion in the GDP of banking industry amounts to duplication. To avoid this duplication FISIM is allocated to the user industries as intermediate input. The FISIM, which forms component of financial sector output, are partly treated as intermediate consumption of industries and partly as the final consumption of Government and the households. For determining these proportions, the basic data on loans and deposits relating to enterprise are used. These are taken from the same source material from which value added is estimated. The proportions of imputed service charges so worked out for different economic activities are treated as a separate input item in the respective sectors. In case of households and Government such charges are considered as an item of private and Government final consumption expenditure. The industries to which FISIM is allocated are agriculture, livestock, forestry, fishing, mining and quarrying, manufacturing (registered and unregistered), electricity and gas transport, construction, storage, trade, hotels and restaurants, business services and other services.
VIII.42 A similar argument can be extended in the case of insurance enterprises where the premium for insurance constitutes the main source of income and receives income from investment as well. The value of output of the insurance activity is estimated taking into account (a) the actual premium earned (b) income from investment of insurance reserve (equivalent to premium supplements) (c) less claims which become due for payment during the accounting period (d) less change in actuarial reserves and reserves for profits insurance. In the case of general insurance, imputed service charges are measured as the receipts on account of premium plus interest and dividends earned less expenditure on account of claims paid.
Source of Data
VIII.43 Sources of data for various sub-sectors for preparing the estimates of financial corporations are given in the table 8.3 below:
Table 8.3: Sources of Data for Financial Corporations |
Sl No. |
Sub Sector |
Data Source |
1 |
Commercial Banks |
Annual Accounts of banks and Statistical Tables Relating to Banks in India (RBI) |
2 |
Banking Department of RBI |
Annual Report of RBI and data obtained directly from RBI on expenditure of the issue and banking departments |
3 |
Non-departmental Financial Companies and Corporations |
Annual reports/annual accounts |
4 |
Life Insurance and Non-Life |
Annual reports/ accounts of LIC, GIC and its subsidiaries |
VIII.44 The savings of NDCU financial enterprise is compiled separately for nationalised banks, RBI, insurance and other financial institutions. The estimates of savings in the case of public sector banks are based on the analysis of item wise data on earnings and expenses of banks supplied by the RBI. The savings of the banking department of the RBI is estimated as the sum of amount transferred to the Funds.
VIII.45 Savings arising from the life insurance business of LIC is duly accounted for in the household sector in the form of net accruing liability of LIC to the household sector. Savings of the general insurance sector is included wholly under public sector. This is obtained as the net transfer to balance sheet and net transfer to reserves. In the case of other financial institutions too, a similar procedure is adopted. The layout of income and outlay account in respect of financial and non-financial NDCUs is given below in Table 8.4.
Quasi-corporate bodies
VIII.46 Since the annual reports of all quasi-corporate bodies are not available for all the years, the GDP of quasi bodies is estimated as product of estimated workforce in these bodies and the average value added per worker of Government administration and the consumption of fixed capital (CFC). The NIC 1998 code for these bodies is 903. The savings and GFCF estimates for quasi corporations are derived from GDP estimates of quasi bodies by multiplying it with a fixed proportion (0.0873) and capital-output ratio, respectively.
VIII.47 The basic methodology of estimation of savings in the public sector has been in existence for a long time, although some procedural changes and improvements are carried out from time to time, particularly at the time of changing the base year. The methodology was also examined by the Raj Committee in its Report “Capital Formation and Savings in India 1950-51 to 1979-80”, brought out in February 1982. Subsequently, keeping in view the developments that have taken place and major reforms introduced in the economy with also advance of information technology resulting in radical change in the management of information, the then Department of Statistics set up an Expert Group on Savings and Capital Formation on April 10, 1995 to review the existing methodology and recommend improvements in the methods and procedures of estimation of savings and capital formation. This Committee was headed by Prof. Raja J. Chelliah. The Expert Group also broadly endorsed the methodology in position for estimating savings in the public sector, with few improvements suggested in the report. The National Statistical Commission (NSC) also examined the methodology of estimating the savings in the public sector. However, there were no specific recommendations in the report except for improvement of the coverage of local bodies.
Table 8.4: Income and Outlay Account – NDCUs |
Disbursement |
Receipts |
1. |
Property Income |
6. |
Operating Surplus |
| |
• Interest |
7. |
Property Income |
| |
• Dividends |
|
• Interest |
| |
• Rent and Royalties |
|
• Dividends |
2. |
Direct Tax Payments |
|
• Rent and Royalties |
3. |
Current Transfers not elsewhere classified |
8. |
Current transfers not elsewhere classified |
4. |
Savings |
|
|
5. |
Disbursement |
9. |
Receipts |
VIII.48 The recommendations of the Raj Committee and the Chellaiah Committee, in brief, on estimation of savings and capital formation in public sector are as follows: Raj Committee
– differences in the classification of expenditures by Ministry of Finance and the CSO
– part of the profits of RBI being attributed to issue department and thereby, accounting it under receipts of Government
– coverage of local authorities and non-departmental undertakings of the State Governments
Chelliah Committee
– The only issue identified is that regarding the inclusion of local bodies. “Public sector information in respect of local bodies should be improved. States need to make arrangements for consolidation of statistics from the annual statements of receipt and expenditure in respect of their local bodies.”
– Also, there is a reference to defence expenditures to be capitalised, “defence expenditure on capital equipments such as radar, satellite launching system and vehicles and on construction of buildings for offices, hospitals and schools etc., and on other construction works like roads, air fields, docks which are useable for civilian purposes may be considered as part of gross capital formation as per 1993 SNA”.
National Statistical Commission
– There were no specific recommendations on the public sector savings, except for
fuller coverage of local bodies.
VIII.49 All the above Expert Committees emphasised on the fuller coverage of accounts of local bodies in estimating macro-aggregates of public sector. They also entrusted the responsibility to the States for preparing consolidated accounts of the local bodies. The recommendation of Chelliah Committee on this is that, “States need to make arrangements for consolidation of statistics from the annual statements of receipts and expenditure separately for different types of local bodies. Bigger local bodies, such as those of the metropolitan cities, municipal corporations and municipalities should be covered on complete enumeration basis. In the case of smaller local bodies such as notified areas, district boards, Zila Parishads, Gram Panchayats and those created by administrative agencies, the data may be collected through suitably designed sample surveys.”
VIII.50 Data contained in various Budget Documents/Reports and Accounts of public enterprises provide the basis for reliable estimates for the public sector. However, the estimates in respect of local authorities are not based on actual annual expenditure data. The estimates relating to quasi-Government bodies are prepared using the workforce estimates and the estimated value added per worker obtained from the annual reports of the research and scientific institutions. There is a need, therefore, to improve the quality of estimates of public sector with regard to local authorities and quasi-Government bodies, as also the emerging PPPs and SPVs. Keeping in view the recommendations of the past Expert Groups and the status of current method of estimation of savings and capital formation of public sector, broadly the following areas emerge for improvements:
•
Better coverage of local bodies through analysis of sample accounts of rural local bodies and complete analysis of urban local bodies.
•
Analysis of accounts of quasi-Government bodies (the CSO will need to collect accounts of all these bodies and analyse them).
•
Treatment of defence capital expenditures in the light of 1993 SNA recommendations.
•
Availability of separate accounts of PPPs and SPVs. However, it was felt that if these entities are in public sector, they are now covered under Non Departmental Commercial Undertakings (NDCUs), but if they are in the private corporate sector, doubts were expressed whether they would get covered in RBI’s company studies, being new companies under setting up.
•Need was also felt that the savings and capital formation of NDCUs are appropriately estimated.
VIII.51 For the public sector, the most outstanding gap in data is with respect to local bodies. Detailed information on income and expenditure of local authorities needs to be collected regularly on an annual basis. Mere collection of data will not meet the requirement and economic analysis of the details would be necessary to prepare full set of accounts for local bodies. The task of analysis would require considerable resources and the problem is enhanced as the presentation of the budget is not uniform in all the States and does not provide information with adequate details. The rural local bodies generate substantial own resources besides grants received from State/Centre or other agency for final consumption or capital formation. Analysis of local body accounts would facilitate publication of economic and purpose classification of local bodies along with those of Central and State Governments and bring improvements in the presentation of national accounts statistics with local body accounts in all the tables to maintain intra-table consistencies.
VIII.52 The Finance Commissions, C&AG, Ministry of Urban, Rural Development, Ministry of Panchayati Raj, NIPFP, and the 11th and 12th Finance Commissions took many initiatives to bring improvements in the database management at PRIs (Panchayat Raj Institutions) level. In this regard, NIRD and NIPFP were assigned type studies for rural and urban local bodies, respectively. Besides this, Office of C&AG of India took efforts to streamline the maintenance of local body finances. Though all the local authorities are supposed to maintain their annual financial accounts at each Gram Panchayat/ Block/ Zilla Parishad/ Corporation/ Municipality/ Nagar Palika level, annual data on all the rural local are not available on a regular basis. However, some Directorates of Economics and Statistics of the States have brought out full set of local body accounts including income and outlay accounts of local bodies along with the State accounts. Most of the States have maintained the urban local body accounts in a systematic manner, but they could not maintain the rural local body account on a regular basis.
VIII.53 The CSO made an attempt to evolve some procedures to prepare complete set of accounts in respect of rural local bodies on the sampling basis. For that, CSO held meetings with the officials of public finance and C&AG to know the ground realities of the accounts of local bodies being maintained in the various State levels. The views of the officials of the above organisations are as under:
• The financial statistics maintained by the lower tier, namely, Grama Panchayat levels of all States are very scanty.
• Results of type study conducted by NIPFP may be helpful to estimate the own generation of funds by PRIs based on the quantum of grants received.
• Availability of database at PRIs levels is scarce and inadequate.
•
The information on functional classification and the utilization of funds would not be centrally available for PRIs.
•
Only a very few States claim that the financial accounts at PRIs are properly being maintained.
•
Analysis of all accounts of about 2.5 lakh panchayats would be a mammoth task.
•
Only through sampling techniques, one can build up ratios to know the pattern of own-resource mobilisation and pattern and utilization of revenue and capital expenditures.
•
Personal visits to six States covering zones like Karnataka/Andhra Pradesh,
Maharashtra, Rajasthan, U.P, Meghalaya, Tamil Nadu etc., would be helpful to assess
the type of economic and purpose classification of the funds used at PRIs in the
States.
VIII.54 As a follow up action, a team of officers from CSO (NAD) made field visits to two grama panchayats in Ranga Reddy district of Andhra Pradesh and two grama panchayats in Maharashtra to know ground realities regarding the maintenance of local body finances. As details of information of urban local bodies are available with the State directorates, and therefore, it would not be a problem to compile urban local body accounts, as such, more attention has been drawn to develop a schedule for collection of data from rural local bodies. Accordingly, a sample schedule has been designed and circulated to State Directorates for collection of data from some rural bodies on sample basis according to the size of population. The features observed during the field visits in the two States are summarised as under:
• Sources of local body accounts are Directorates of State Audit and Directorates of Grampanchayat.
•
DESs prepare urban local body accounts but not rural body accounts. CSO needs combined local body accounts.
•
The consolidated rural body accounts are available with a time lag of two to three years.
•
Maharasthra, Andhra Pradesh and Uttar Pradesh are some of the States submitting the full set of local bodies’ accounts.
VIII.55 Regarding Government accounting procedures adopted by States, though the overall structure of budget, as prescribed, is uniformly followed by all the States and Central Governments, yet the presentation of details under certain account heads in the budgets varies from State to State. This makes computerisation of the analysis work somewhat difficult.
VIII.56 Regarding quasi-Government bodies, such as the Kendriya Vidyalayas, All India Institute of Medical Sciences, Central Universities, these need to be treated as part of Government administration, as they provide non-market services (provide services not at economically significant prices). The budget documents of Central and State Governments only provide the grants (current and capital) given to these quasi-Government (QG) bodies. While the current grants are treated as current expenditures at the source, the capital grants are treated as capital expenditures at the source. However, the correct treatment would be to treat the capital grants as current expenditures at the source. This will reduce the savings of the source agency. Simultaneously, the accounts of the QG bodies (which also generate own resources through sale of goods and services) need to be analysed to estimate GDP, consumption expenditure, savings and capital formation and the same should be included in the Government administration, under a separate category for QG bodies. Presently in the NAS, the capital grants given to QG bodies and NGOs do not get included in the current expenditure of Central and State Governments, thus, increasing the savings of the Government administration. Also, the savings of QG bodies are separately estimated through some rates and ratios (using workforce data) and included under Government administration. Thus, there is a possibility of double counting of savings estimates in the public sector.
VIII.57 Regarding defence capital outlay, presently all expenditures under this budget head are treated as current expenditures, thus reducing the savings of the public authorities. Out of the entire expenditures of defence only the capital expenditures relating to defence establishments is presently being capitalised in the NAS, all the other expenditures being shown as current expenditures. According to 1993 SNA, defence capital expenditures which can be used for civilian purposes should be capitalised and according to SNA Rev. 1.0, even expenditures on equipment which can be repeatedly used, should be capitalised.
VIII.58 On PPPs, there is no centralised agency which collects and maintains consolidated annual accounts of these PPPs, so that their contribution to the national economy can be separately shown in the NAS. Regarding coverage, conceptually they would be covered if they are in public sector through the NDCUs annual accounts, and if they are in private corporate sector, through the RBIs company finance studies.
VIII.59 There were some changes made in the procedure/analysis of the economic transactions of the budget analysis in the current NAS series. One such major change is identification of capital expenditure incurred under object head “office expenses”. In consultation with the State Governments and central ministries, it has been given to understand that about 25 per cent of the total expenditure incurred under the head “office expenses” relates to purchase of machinery and equipment like photocopiers, ACs, furniture, computers etc. Due to this, the CSO included part of purchase of goods and services into other capital outlay, machinery outlay and software outlay, which in turn, resulted in additional gross fixed capital formation from current expenditure of goods and services. The consequent changes are that there is decrease in the final consumption expenditure and increase in savings as well as GFCF of public sector.
VIII.60 The second major change made in analysis of budgets in the new series of national accounts (base year 1999-2000) is treatment of operating losses of the Departmental Commercial Undertakings (DCUs) as imputed subsidies. The rationale behind is that the DCUs incur losses on account of administrative policies of the Government and the losses are met through the Governments’ current revenues. This treatment was only restricted to irrigation departments earlier, but in the new series it has been extended to all DCUs incurring losses.
VIII.61 Due to the differences in concepts and coverage, there are differences in the revenue deficit of Centre and States with the net savings shown in the NAS. Table 8.5 presents the comparative picture of the two sets of estimates.
Table 8.5: Comparative Picture of Public Sector Savings |
(Net Saving in Rs. crore as Shown in NAS) |
Year |
Revenue Deficit of Centre and States |
Government admn. including local bodies and excluding quasi Government bodies |
Local Bodies |
Quasi Government Bodies |
Government admn. excluding local bodies and quasi Government bodies |
DCUs |
Public authorities excluding local bodies and quasi Government bodies |
1 |
2 |
3 |
4 |
5 |
6 |
7 |
8 |
1999-00 |
121393 |
-119347 |
8107 |
780 |
-127454 |
9012 |
-118442 |
2000-01 |
138803 |
-136437 |
10169 |
824 |
-146606 |
5523 |
-141083 |
2001-02 |
159350 |
-160837 |
9493 |
907 |
-170330 |
246 |
-170084 |
2002-03 |
162990 |
-153402 |
9529 |
1039 |
-162931 |
164 |
-162767 |
2003-04 |
159408 |
-126861 |
8986 |
1236 |
-135847 |
143 |
-135704 |
2004-05 |
114761 |
-111148 |
8460 |
1309 |
-119608 |
-145 |
-119753 |
2005-06 |
99312 |
-102236 |
7923 |
1390 |
-110159 |
977 |
-109182 |
DCUs: Departmental Commercial Undertakings |
Implications of Changes in the Estimation Procedure of the Public Sector Savings
VIII.62 The impact on public sector savings if (a) the expenditures of defence capital account are capitalised, (b) the capital grants given to autonomous institutions/NGOs by the Central and State Governments are shown as current expenditures at the source (instead of the present practice of showing them as capital outlay at the source) and the savings and capital formation is estimated separately for these autonomous institutions/NGOs by analysing their accounts (on sample basis) and (c) if the local bodies’ contribution to savings and capital formation is accounted for by covering all urban local bodies (ULBs) on census basis and rural local bodies (RLBs) on sample basis was assessed through trial exercises, the results would have been as follows. The HLC also requested for a status note on the accounting treatments of PPPs, from the RBI
Capital Account of Defence
VIII.63 According to the SNA 1993, “The 1993 SNA treats gross fixed capital formation as all expenditures by the military on fixed assets of a kind that could be acquired by civilian users for purposes of production and that the military use in the same way; this would include airfields, docks, roads, hospitals and other buildings or structures. On the other hand, military weapons, and vehicles and equipment whose sole purpose is to launch or deliver such weapons, are not to be treated as gross fixed capital formation but as intermediate consumption. The 1968 SNA excluded from gross fixed capital formation almost all military expenditures except those on construction or alteration of family dwellings for personnel of the armed forces. It is also mentioned in 1993 SNA, “If it is not feasible to separate expenditures on such equipment from expenditures on weapons and their support systems, all expenditures on equipment for the military have by default to be treated as intermediate consumption.”
VIII.64 However, the 1993 SNA Rev 1.0 would have “In future, all expenditure by the military which meets the definition of being used in production over a period in excess of one year will be treated as capital formation, regardless of the nature of the expenditure or the purpose intended for it. All equipment will be treated as fixed capital formation except for consumables which will be treated as inventories. Separate items will identify weapons systems within fixed capital formation and military inventories apart from other inventories.”
VIII.65 It has been a practice in the Indian national accounts to treat the expenditures of Defence, except for the ordinance factories, as current expenditures. However, the major account head “4076” on Defence Capital Expenditure in the Government budget documents shows detailed information on expenditure made towards various capital equipments. The current NAS treatment of defence capital outlay as current expenditures, results in reduction in the net savings as well as in capital formation of Government Administrative Departments. In pursuance of the decision taken by the HLC on this issue i.e. to treat the capital outlay as capital expenditure of defence, the impact on the net savings in Administrative Departments and on gross savings of Public Sector as well as on the total gross savings of the nation has been worked out and shown in Table 8.6 below:
VIII.66 As a part of defence capital expenditure is treated as capital expenditure, consequently the current expenditure got reduced to the same extent. This, in turn, has resulted in an increase in the savings and capital formation by an equivalent amount. The increase in the gross savings of Administrative Departments, Public Sector savings and national gross savings has been shown in Table 8.6. It is clear from the Table that the dis-savings of Administrative Departments got reduced in all the years and consequently, the overall savings of the economy has increased by about 0.4 to 0.6 percentage points of GDP.
Table 8.6: Estimates of Gross Savings if Part of Defence Capital Outlay is treated as Capital Expenditure |
(Rs. in crore) |
| |
Administrative Depts.* |
Public Sector |
Total Economy |
Year |
Present ests. |
New ests. |
% diff |
Present ests. |
New ests. |
% diff |
Present ests. |
New ests. |
Increase in rate of savings |
1 |
2 |
3 |
4 |
5 |
6 |
7 |
8 |
9 |
10 |
1999-00 |
-99507 |
-91640 |
-7.9 |
-15494 |
-7627.3 |
-50.8 |
484256 |
492123 |
0.4 |
2000-01 |
-115398 |
-107230 |
-7.1 |
-36882 |
-28714 |
-22.1 |
499033 |
507201 |
0.4 |
2001-02 |
-137798 |
-128339 |
-6.9 |
-46186 |
-36727 |
-20.5 |
534885 |
544344 |
0.4 |
2002-03 |
-128509 |
-118176 |
-8.0 |
-15936 |
-5603 |
-64.8 |
647970 |
658303 |
0.4 |
2003-04 |
-99950 |
-88252 |
-11.7 |
29521 |
41219 |
39.6 |
821026 |
832724 |
0.4 |
2004-05 |
-80810 |
-58543 |
-27.6 |
68951 |
91218 |
32.3 |
1000424 |
1022691 |
0.7 |
2005-06 |
-68610 |
-46329 |
-32.5 |
92263 |
114544 |
24.1 |
1227348 |
1249629 |
0.6 |
2006-07 |
-55811 |
-31986 |
-42.7 |
133359 |
157184 |
17.9 |
1441423 |
1465248 |
0.6 |
* including quasi-Government bodies. |
Autonomous Institutions
VIII.67 Grants are provided by the Central and State Governments to autonomous Government institutions or quasi-Government (QG) bodies (such as Kendriya Vidyalayas, AIIMS, central universities, Doordarshan, AIR, etc) and Non-Governmental Organisations (NGOs) in the form of current grants and/or capital grants with the intention to spend the same by these quasi Bodies for final consumption and/or for capital formation, respectively. In the hands of the source agencies, these current and capital grants should be treated as current expenditure. Simultaneously, the grantees’ accounts should be analysed and the actual expenditures of these grantees’ should be segregated between current and capital expenditures on the basis of their economic character. This procedure is just the same as transfers between Centre and States or between Centre/States to local bodies as treated in national accounts.
VIII.68 Presently, in the NAS, capital transfers to these QGs are not treated as current expenditure at the source, and, thus, forms part of the savings of administrative departments. On the grantees’ (which are QG bodies and/or households) side too, savings is estimated through some adhoc rates and ratios based on workforce data and included in the savings of public sector. Thus, there is a possibility of double counting of savings estimates (as also capital formation) in the NAS.
VIII.69 The accounts of QG bodies are not readily available for analysis purpose. Also, due to acute shortage of manpower, it has not been possible in the CSO to collect all the accounts of these bodies and analyse them to estimate GDP, consumption expenditure, savings and capital formation of these bodies. What is presently being done in the CSO in respect of these QG bodies’ is to analyse few of these bodies’ accounts in the base year and built up ratios between GDP and savings and capital formation. For years other than the base year, the estimates of savings and capital formation are based on the GDP estimates of QG bodies. The GDP estimates of these bodies (both for base year and other years) are based on workforce data from the employment and unemployment surveys of NSSO (together with inter-survey growth in workforce in these bodies, for years other than base year) and the value added per worker of Government administration.
VIII.70 As mentioned earlier, part of the capital transfers also go to NGOs, which are in the private sector. The estimates of savings and capital formation for these NGOs are estimated separately, if the NGOs are in private corporate sector – through the RBI sample studies on company finances and if the NGOs are in household sector – through the residual method.
VIII.71 Thus, from the above argument, what is needed to be done in the NAS is (i) to treat the capital transfers of administrative departments as current expenditure as against the present practice of not treating it as current expenditure (this will reduce savings of administrative departments); (ii) estimate independently the GDP, consumption expenditure, savings and capital formation of QG bodies by analysing their annual accounts and include the same as part of general Government ; and (iii) remove the estimates of macro-aggregates presently being shown in the NAS against quasi bodies.
VIII.72 The HLC suggested that the CSO should do the exercises as mentioned in the above para, and see the implications on the savings estimates of public administration, as well as on overall economy. The following exercises have been carried out in compliance with the suggestions of the HLC:
•
capital transfers of administrative departments have been treated as current expenditure in the administrative departments, which will reduce the savings (increase the dis-savings of these departments);
•
estimate independently the GDP, consumption expenditure, savings and capital formation of QG bodies by analysing their annual accounts (on sample basis) and include the same as part of general Government ; and remove the estimates of macro-aggregates presently being shown in NAS against quasi bodies;
VIII.73 The following tables (Table 8.7 to 8.9) present the changes in the savings estimates if the above is implemented.
VIII.74 Both in quantitative and percentage terms, the impact of treating capital grants as current expenditure on savings of Administrative Departments, Public Sector and also on the total economy, are shown for a period from 1999-00 to 2006-07 in the Tables mentioned above. This has resulted in lowering the estimates of savings of all these institutions. The impact of treating capital grants as current expenditure of the Government and simultaneously adding the estimated savings of QG bodies compiled through sample analysis of accounts of these bodies, resulted in an overall reduction of about 1 percentage points in the rate of savings of the total economy.
VIII.75 Conversion of capital grants as current grants to quasi bodies results in increase in the final consumption expenditure of these quasi bodies, and also overall Government final consumption expenditure. There are also some conceptual differences between revenue deficit of Centre and States and the savings estimates released in national accounts, as detailed below in Table 8.10.
Table 8.7: Capital Transfers to QG Bodies and NGOs and estimated Savings of QG Bodies |
(Rs. crore) |
| |
Capital transfers |
Estimates of savings of QG bodies |
Year |
TOTAL |
QG bodies |
others |
presently shown in NAS |
New Estimates |
1 |
2 |
3 |
4 |
5 |
6 |
1999-00 |
12784 |
5170 |
7614 |
2714 |
5442 |
2000-01 |
20701 |
9955 |
10746 |
2933 |
6776 |
2001-02 |
18777 |
9194 |
9583 |
3235 |
7198 |
2002-03 |
22609 |
11885 |
10724 |
3572 |
7251 |
2003-04 |
21839 |
7776 |
14063 |
4026 |
8204 |
2004-05 |
18900 |
7260 |
11640 |
4442 |
8303 |
2005-06 |
29473 |
11575 |
17898 |
4903 |
10004 |
Table 8.8: Gross Savings if Capital Transfers are treated as Current Expenditure |
(Rs. crore) |
Year |
Administrative Depts.* |
Public Sector |
Total Economy |
Present ests. |
New ests. |
% diff |
Present ests. |
New ests. |
% diff |
Present ests. |
New ests. |
Increase in rate of savings |
1 |
2 |
3 |
4 |
5 |
6 |
7 |
8 |
9 |
10 |
1999-00 |
-99507 |
-112291 |
12.8 |
-15494 |
-28278 |
82.5 |
484256 |
471472 |
-0.7 |
2000-01 |
-115398 |
-136099 |
17.9 |
-36882 |
-57583 |
56.1 |
499033 |
478332 |
-1.0 |
2001-02 |
-137798 |
-156575 |
13.6 |
-46186 |
-64963 |
40.7 |
534885 |
516108 |
-0.8 |
2002-03 |
-128509 |
-151118 |
17.6 |
-15936 |
-38545 |
141.9 |
647970 |
625361 |
-0.9 |
2003-04 |
-99950 |
-121789 |
21.8 |
29521 |
7682 |
-74.0 |
821026 |
799187 |
-0.8 |
2004-05 |
-80810 |
-99710 |
23.4 |
68951 |
50051 |
-27.4 |
1000424 |
981524 |
-0.6 |
2005-06 |
-68610 |
-98083 |
43.0 |
92263 |
62790 |
-31.9 |
1227348 |
1197875 |
-0.8 |
* Including quasi-Government bodies. |
Table 8.9: Gross Savings if Capital Transfers are treated as Current Expenditure and excluding QG Bodies’ Savings Presently shown in NAS but including the Savings Estimates of QG Bodies based on Sample Analysis |
(Rs. crore) |
Year |
Administrative Depts.* |
Public Sector |
Total Economy |
Present ests. |
New ests. |
% diff |
Present ests. |
New ests. |
% diff |
Present ests. |
New ests. |
Increase in rate of savings |
1 |
2 |
3 |
4 |
5 |
6 |
7 |
8 |
9 |
10 |
1999-00 |
-99507 |
-109563 |
10.1 |
-15494 |
-25550 |
64.9 |
484256 |
474200 |
-0.5 |
2000-01 |
-115398 |
-132256 |
14.6 |
-36882 |
-53740 |
45.7 |
499033 |
482175 |
-0.8 |
2001-02 |
-137798 |
-152612 |
10.8 |
-46186 |
-61000 |
32.1 |
534885 |
520071 |
-0.7 |
2002-03 |
-128509 |
-147439 |
14.7 |
-15936 |
-34866 |
118.8 |
647970 |
629040 |
-0.8 |
2003-04 |
-99950 |
-117611 |
17.7 |
29521 |
11860 |
-59.8 |
821026 |
803365 |
-0.6 |
2004-05 |
-80810 |
-95849 |
18.6 |
68951 |
53912 |
-21.8 |
1000424 |
985385 |
-0.5 |
2005-06 |
-68610 |
-92982 |
35.5 |
92263 |
67891 |
-26.4 |
1227348 |
1202976 |
-0.7 |
* Including quasi-Government bodies |
Table 8.10: Revenue Deficit of Centre and States and Savings of Administrative Departments including Departmental Commercial Undertakings |
(Rs. crore) |
Year |
Revenue Deficit of Centre and States |
Savings of Public Authorities including Local Bodies |
Difference |
Diff (%) |
1 |
2 |
3 |
4 |
5 |
1999-2000 |
121393 |
-110335 |
11058 |
9.1 |
2000-01 |
138803 |
-130914 |
7889 |
5.7 |
2001-02 |
159350 |
-160591 |
-1241 |
-0.8 |
2002-03 |
162990 |
-153238 |
9752 |
6.0 |
2003-04 |
159408 |
-126718 |
32690 |
20.5 |
2004-05 |
114761 |
-111293 |
3468 |
3.0 |
2005-06 |
99312 |
-101259 |
-1947 |
-2.0 |
There are differences in Government accounting and national accounts. In national accounts, each expenditure, irrespective of whether it is revenue or capital in the budget documents, it is reclassified on the basis of actual expenditure as current or capital expenditure. Further, the data given in national accounts includes local bodies. For Government administration, part of office expenditures is treated as capital expenditures. In respect of DCUs, the operating losses are treated as imputed subsidies. |
Local Bodies
VIII.76 The third issue relates to working out the impact of local bodies (LBs) on savings estimates compiled by considering the accounts of all urban local bodies (ULBs) on census basis and using the accounts of rural local bodies (RLBs) on sample basis. An attempt was made to compile the savings estimates of local bodies based on (i) the available sample data of 5 Gram Panchayats for each of 14 States for 3 years, (ii) complete data (combined data on urban and rural local bodies) from 4 States and (iii) total grants given to all the local bodies in the country. The tables below (Table 8.11 and 8.12) shows the difference between the revised and existing estimates of savings of local bodies. It has been observed that in recent times, the local bodies have started raising substantial income from their own resources besides the grants received from State and Central Governments. This, therefore, has resulted in an increase in their savings. As a result, the dis-savings of the administrative departments gets reduced to that extent. The impact on Public Sector savings as well as on gross savings at national level has also been shown in the Tables 8.11 and 8.12 below:
Table 8.11: Estimated Savings of Local Bodies |
(Rs. crore) |
| |
Estimate of Savings of Local Bodies |
|
Year |
New-total |
New-Rural |
New-Urban |
Present - NAS |
Difference |
1 |
2 |
3 |
4 |
5 |
6 |
2001-02 |
10150 |
7755 |
2395 |
9493 |
657 |
2002-03 |
11408 |
9461 |
1947 |
9529 |
1879 |
2003-04 |
11947 |
13044 |
-1097 |
8986 |
2961 |
2004-05 |
13074 |
11337 |
1737 |
8460 |
4614 |
2005-06 |
14023 |
12980 |
1042 |
7923 |
6100 |
Table 8.12: Gross Savings by Analysing Local Bodies Accounts on Sample Basis |
(Rs. crore) |
Year |
Administrative Depts.* |
Public Sector |
Total Economy |
Present ests. |
New ests. |
% diff |
Present ests. |
New ests. |
% diff |
Present ests. |
New ests. |
Increase in rate of savings |
1 |
2 |
3 |
4 |
5 |
6 |
7 |
8 |
9 |
10 |
2001-02 |
-137798 |
-137141 |
-0.5 |
-46186 |
-45529 |
-1.4 |
534885 |
535542 |
0.0 |
2002-03 |
-128509 |
-126630 |
-1.5 |
-15936 |
-14057 |
-11.8 |
647970 |
649849 |
0.1 |
2003-04 |
-99950 |
-96989 |
-3.0 |
29521 |
32482 |
10.0 |
821026 |
823987 |
0.1 |
2004-05 |
-80810 |
-76196 |
-5.7 |
68951 |
73565 |
6.7 |
1000424 |
1005038 |
0.1 |
2005-06 |
-68610 |
-62510 |
-8.9 |
92263 |
98363 |
6.6 |
1227348 |
1233448 |
0.2 |
* including quasi-Government bodies |
VIII.77 The revised estimates of savings from local bodies have increased the savings of administrative departments and Public sector, but it has marginal impact on the domestic savings at the national level.
VIII.78 The sum total of the three changes suggested by the HLC on both the public sector savings and the savings of the total economy is marginal.
Limitations in Estimation of Public Sector Savings
VIII.79 As already brought out, the major weak areas in the estimation of public sector savings are, (i) coverage of local bodies, (ii) coverage of quasi-Government (QG) bodies, (iii) the emerging entities, the public-private-partnerships and the Special Purpose Vehicles (PPP/SPVs). Besides these, there are conceptual issues relating to (a) treatment of defence capital expenditures and (b) treatment of capital transfers to quasi-Government bodies and private non-Governmental organisations.
VIII.80 While the issues relating to coverage of local bodies and QG bodies need changes in the institutional arrangements of obtaining the consolidated accounts of these bodies or entrusting the responsibilities to State Governments, those of PPP/SPVs are conceptual in nature. It is felt that if these PPP/SPVs are in public sector, then they are part of the NDCUs and the present system of estimating savings of NDCUs by the CSO takes care of these PPP/SPVs contribution to the savings and capital formation. However, if these are in private sector, there is a possibility of omission of their contribution of savings and capital formation in the RBI’s sample studies on companies as they would mostly be in the process of setting up. A detailed note by the RBI on PPPs together with international practices on accounting of these PPP/SPVs is placed at Annex A8.2.
VIII.81 Regarding the procedural and conceptual issues relating to defence capital expenditures and capital transfers to QG bodies and NGOs, it was felt that these should be treated in the manner recommended by 1993 SNA.
VIII.82 The discussions of the HLC broadly centred around the issues relating to estimation of savings and capital formation in respect of local bodies, quasi Government bodies, PPP/ SPVs, treatment of capital outlays of defence and the capital transfers made to quasi Government bodies and NGOs. Members emphasised the need for addressing the estimation of savings and capital formation in quasi government bodies which has not been raised by earlier Committees. There were also suggestions to create a separate category for this because of the fast changing scenario and keeping futuristic environment in mind. Regarding capital grants made by the Central and State Governments to the autonomous Government institutions, it was recommended that the grants might be treated as revenue expenditure in the donor’s accounts (which will reduce their savings), and included in the total receipts of the donee’s (which will show corresponding increase in the savings), if the capital grants are utilised for acquisition of fixed assets.
VIII.83 Members suggested that this committee may take a firm view on the accounting practices of Special Purpose Vehicles (SPVs) and Public Private Partnership (PPP) entities. It was observed that PPPs undertaken by Public Sector entities are now being covered by the CSO under public sector transactions. However, PPPs undertaken by the private corporate sector might not be covered in the RBI’s studies on company finances. Regarding PPPs engaged in social sector, Members, while observing that the savings by these entities might not be significant, proposed that the investments made by them might be covered through the CSO’s proposed surveys on non-profit institutions (NPIs). Keeping in view the deliberations, it was recommended that either the CSO or the Planning Commission or the nodal agencies for the PPPs, should obtain the annual accounts of the PPPs in the private sector and analyse them for the purpose of estimating the savings and capital formation made by them.
VIII.84 On the issue of estimation of GDP, GFCF and savings for local bodies, it was suggested that the information on grants-in-aid to local bodies was available in the 12th Finance Commission’s Report and could be used for this purpose. It was also agreed that estimates of local bodies could best be prepared based on census of urban local bodies and on sample basis in the case of rural local bodies. There were suggestions that local bodies’ accounts compilation work be entrusted to the States by recommending grant of financial assistance to States to undertake the studies on local bodies.
VIII.85 There was also discussion on the treatment of CFC in analysing the savings of Administrative Departments. However, the members of the committee agreed to carry forward the discussion on the issue.
VIII.86 The members suggested that instead of analysing profit and loss accounts of all the UTI schemes separately, the feasibility of using consolidated data of all mutual funds which is available with the Association of Mutual Funds could be explored as the treatment of UTI scheme is applicable to all mutual funds.
Recommendations
VIII.a The HLC recommends creation of a separate category for quasi Government bodies in the CSO’s estimates of GDP, consumption expenditure, savings and capital formation. Regarding capital grants made by the central and State Governments to the autonomous Government institutions, the HLC recommends that these grants should be treated as revenue expenditure in the donor’s accounts (which will reduce their savings), and included in the total receipts of the donee’s (which will show corresponding increase in the savings, if the capital grants are utilised for acquisition of fixed assets).
VIII.b The CSO should make separate estimates of GDP, consumption expenditure, savings and capital formation for the local bodies. These could best be prepared based on census of urban local bodies and on sample basis in the case of rural local bodies. For this purpose, States may be provided financial assistance to undertake analysis of local bodies’ accounts.
(Action: CSO)
VIII.c The CSO, instead of analysing profit and loss accounts of all the UTI schemes separately, should explore the feasibility of using consolidated data of all mutual funds which is available with the Association of Mutual Fund, as the treatment of UTI scheme is applicable to all mutual funds.
(Action: CSO)
VIII.d The CSO or the Planning Commission or the nodal agencies for the PPPs, should obtain the annual accounts of the PPPs in the private sector and analyse them for the purpose of estimating savings and capital formation made by them
(Action: CSO and Nodal Ministries)
VIII.e The HLC recommends that the CSO should include the capital expenditures of Defence on construction, ordinance factories and defence establishments as capital formation.
(Action: CSO)
Chapter IX : Estimation of Capital Formation
IX.1 The gross capital formation (GCF) is presently estimated by three approaches i.e., (a) from the financing side as sum of savings and net capital inflow from abroad (which is the current account balance in the balance of payments statistics; (b) by the commodity flow approach as sum of gross fixed capital formation, change in stocks and valuables; also by assets and institutions; and (c) by the expenditure approach as net acquisition of fixed assets and change in stocks by industries. For the purpose of compiling various rates of capital formation, the aggregate arrived at as the sum of savings and net capital inflow is taken as the GCF estimate. The difference between this estimate and the estimate of capital formation arrived at by using the commodity flow method, by assets is shown as ‘errors and omissions’. Table 9.1 shows the extent of difference between the three estimates of capital formation, for the year 2006-07.
Coverage
IX.2 Gross capital formation (GCF) refers to the aggregate of gross additions to fixed assets (i.e., fixed capital formation) increase in stocks of inventories, referred in the NAS to as change in stocks during a period of account and net acquisition of valuables. Broadly two types of fixed assets namely construction and machinery and equipment (including transport equipment, software and breeding stock, draught animals, dairy cattle and the like) are covered.
IX.3 Construction activity covers all new constructions and major alterations and repairs of buildings, highways, streets, bridges, culverts, railroad beds, railroads, subways, airports, parking areas, dams, drainages, wells and other irrigation sources, water and power projects, communication systems such as telephone and telegraph lines, land reclamations, bunding and other land improvements, planting and cultivating new orchards (tea, coffee, rubber, mango, cashew nut, areca nut, coconut, citrus, grapes and Sapota plantations), afforestation projects, installation of wind energy systems etc.
IX.4 Machinery and equipment comprises all types of machinery like agricultural machinery, power generating machinery, manufacturing, transport equipment, furniture and furnishings. Also included are increments in livestock in respect of breeding stock, drought animals, dairy cattle and other animals raised for wool clippings. Additions to livestock other than the said fixed assets are accounted for in change-in-stock estimates.
Table 9.1: Estimates of Capital Formation for the Year 2006-07 |
(Rs. crore) |
Approach followed to estimate GCF |
Total |
Public Sector |
Private Sector |
1 |
2 |
3 |
4 |
1. |
Capital formation as sum of savings and net capital inflow |
14,87,786 |
3,21,753 |
11,66,033 |
2. |
Capital formation by type of assets and by institutions |
14,92,313 |
3,21,753 |
11,70,560 |
3. |
Capital formation by industry of use, unadjusted |
11,53,013 |
3,21,753 |
8,31,260 |
IX.5 Inventories consist of materials and supplies, work-in-progress and finished products and goods in the possession of producers and dealers. Stocks of strategic materials, grains and other commodities of special importance to the nation in the possession of Government are also included in the estimates of change in stocks.
IX.6 The estimates of GCF for the economy as a whole, include all relevant items of new capital goods, which are produced domestically (exclusive of exports) and new and second-hand imported goods. The estimation, therefore, follows the domestic concept, whereby, only additions made to stocks of fixed assets and inventories within the geographical boundary of the country have been taken into account. Accordingly, the GCF refers to gross domestic capital formation (GDCF). The estimates of GFCF for the country are prepared both by type of assets viz., construction, machinery and equipment, software and by industry of use.
Estimation of GDCF by Type of Assets
IX.7 The estimates of GCF by type of assets are prepared separately for the gross fixed capital formation (GFCF) in respect of fixed assets, namely, construction, machinery and equipment, change in stocks and valuables. The last item, although not used for productive purposes, is included in the GCF, according to the 1993 System of National Accounts.
IX.8 Construction: The estimates of domestic capital formation in construction are compiled separately for pucca construction and kutcha construction. The total expenditure on construction is the aggregate of the values of both material inputs and factor payments, in respect of new construction including major repairs and replacements and current repairs and maintenance. To obtain the estimates of gross fixed capital formation, only new construction is considered. IX.9 The value of output of pucca construction is worked out at the aggregate level through the Commodity Flow Approach (CFA) on the basis of output of major items like cement, steel, bricks used in construction. On the other hand, the estimated value of output of kutcha construction is estimated separately for each of the institutional sectors, i.e. public sector, private corporate sector and households, using various data sources such as the budget documents, RBI’s company finance studies and the results of AIDIS.
IX.10 Machinery & equipment: The GFCF from machinery and equipment includes the ex-factory value of capital goods produced in the registered and unregistered manufacturing sectors, the excise duties paid on them, net imports of capital goods, Import duties and TTMs, software production, fixed assets in livestock and installation charges of wind energy systems. The estimates of capital goods (at current prices) in machinery and equipment are prepared by the commodity flow approach, based on the data available from the ASI and enterprise surveys.
IX.11 Various items of machinery and equipment domestically produced and net of imports, are classified into (i) capital goods; (ii) parts of capital goods; (iii) partly capital goods; and (iv) parts of partly capital goods. The total value of the items classified under (i) is taken on 100% basis for capital formation. In the case item (ii) of parts of capital goods, 50 per cent of the value is taken as capital formation and the rest treated as intermediate consumption. The proportions of partly capital goods attributable to capital formation vary from item to item. Similarly, half of the proportions applicable to partly capital goods is taken as the value of parts of partly capital goods for estimating fixed capital formation.
IX.12 To the ex-factory value of capital goods produced domestically, the amount of excise duties, imports and import duties are added. From the total thus obtained, the value of re-exports is deducted to obtain the availability of capital goods. The value of capital goods so obtained is then marked up for trade, transport and other charges to obtain the value at purchasers’ prices. Trade, transport and other installation charges have been estimated for the year 1999-00 on the basis of information obtained from the Input Output Transactions Table (IOTT) 1998-99. From the total value at purchasers’ prices thus obtained, the value of exports is deducted to obtain the value of capital formation at site.
IX.13 For estimating the value of additions to livestock taken to form part of fixed assets, all livestock (excepting bulls and bullocks over three years not in use for breeding or work, cows over three years not in use for work or breeding purposes, young male & female stock, goats under one year, female goats of one year and above and not in milk, pigs and poultry) are taken into account.
IX.14 Valuables: In accordance with the 1993 SNA, the data on expenditures made on net acquisition of valuables on precious items like gold, gems, ornaments and precious stones, etc., has been included under GCF as a separate category under “produced fixed assets” (separately from the GFCF and Change in Stocks). The same does not contribute to the production process and are acquired as a store of value, since they are not consumed in the production process as intermediate consumption.
IX.15 In the new series, the coverage of valuables has been restricted to include the precious articles with HS codes 7102 (diamonds), 7103 (other gems and stones), 7106 (silver), 7108 (gold), 7110 (platinum), 7113 and 7114 (gold and silver ornaments), keeping in view the data availability. The monetary gold is not regarded as ‘Valuables’. The total production of valuables and net imports has been taken into account for compiling the estimates of valuables. Since these valuables also have industrial use, norms of 95 per cent and 10 per cent, respectively for gold and silver, have been used to arrive at the estimates on acquisition of these items as a store of value. Suitable adjustments have been made on the export data on valuables to account for value addition done in the country (GVA and change in stock), so that imports and exports of the valuables are on comparative quantity terms.
Estimation of GCF by Institutions
IX.16 The estimates of gross capital formation for the public sector & private corporate sector are also prepared by expenditure approach on the basis of analysis of budget documents and annual reports of enterprises. These estimates of public sector plus private corporate sector including co-operatives by type of assets (construction and M&E) are subtracted from the corresponding overall estimates compiled through the commodity flow method to arrive at the estimates for household sector as a residual.
Estimation of GCF by Industry of Use
IX.17 An independent set of estimates of gross fixed capital formation (GFCF) and Change in Stock (CIS) for each of the industrial categories is prepared primarily following the expenditure approach. Initially, the estimates are prepared for the three institutional sectors separately and the estimates are then aggregated at the industry level to arrive at the estimates of GCF by industry of use. The detailed procedure is given below:
Gross Fixed Capital Formation
IX.18 Public Sector: Under public sector, all the three institutional sub-sectors, namely Government Administration, Departmental Commercial Undertakings (DCUs) and Non Departmental Commercial Undertakings (NDCUs) are covered for compiling the GFCF estimates. Using the information collected on the actual expenditures incurred on the new construction of Roads, Buildings, and Other Construction, and new expenditures made on acquisition of the machinery, transport vehicles and equipment, software and other capital outlays on livestock, the estimates of the GFCF at current prices for the current year are prepared for Administrative departments of Government and the DCUs. Here, net purchase of second hand assets is also included. In case of the NDCUs, the information obtained from the books of accounts is used. The expenditure incurred on usual/ routine repair and maintenance is not covered for compilation of capital formation.
IX.19 Private Corporate Sector: In respect of joint stock companies, the estimates of GFCF and CIS for each industrial category are made available directly by the RBI on the basis of their sample studies of joint stock companies. The results of the sample studies are published in their publication titled ‘Finances of Public and Private Limited Companies’. Generally, the RBI gives data every year on GFCF and CIS for a set of three years based on the analysis of sample of companies for the Indian Economy. Moreover, once in 3 years, they also give industry-wise distribution of the GFCF estimates of the joint stock companies for the first year in the set of three years. Using this distribution and yearly total of GFCF estimate at current price for the entire economy, the industry- wise annual GFCF estimates are derived. Whenever the next set of estimates is received, the industry wise GFCF estimates are revised. The estimates of GFCF of private commercial banks and private insurance companies are estimated separately.
IX.20 Cooperatives: Mostly, the cooperative societies are involved in the activities of Registered Manufacturing, Trade (non-credit societies), Banking (credit societies). For compilation of GFCF estimates, all three activity groups are covered. In cooperative sector, the data obtained from the NABARD in the form of various tables are used. However, there is significant time-lag in the availability of data on cooperative sector from the NABARD.
IX.21 Household Sector: For most of the industries, the GFCF estimates of household sector for the current year at current prices are derived from the benchmark surveys (AIDIS, Enterprise Surveys of NSSO) using appropriate indicators / ratios/ norms, etc., or by capital-output ratio. WPI for the appropriate industry group is used to convert the current prices estimates to constant prices estimates, and vice versa, in a specific industry. Wherever an appropriate WPI is not available, WPI for all commodities is used. The industry-wise household sector GFCF estimates so obtained are adjusted on pro-rata basis with the estimates of household sector coming from the estimates of GFCF by institutions. This is being done keeping in view the quality of AIDIS and Enterprise Surveys’ data on GFCF, and the large divergence that is increasing every year between the two sets of estimates for the household sector.
Change in Stock
IX.22 The estimates of Change in Stock (CIS) at Current Price (CP) and Constant Price (KP) and estimates of inventory at CP and KP are compiled for all three institutional sectors (Public sector, Private corporate sector and Household sector) and for each industry category. These are estimated through the expenditure method. They are compiled first for each of the three institutional sectors or sub sectors wherever data is adequately available separately and thereafter the industry level estimates are obtained by combining them.
IX.23 The book value of the change in stock for the current year at CP is added to the previous year’s inventory at CP to derive the current year’s inventory at CP. Appropriate WPI is used to obtain the inventory of the current year at KP. Difference between two successive years’ inventory estimates at KP is taken as CIS estimate of the current year at KP. Using the same WPI, the CIS estimates at CP are obtained.
IX.24 Public Sector: In the public sector, all its three institutional sub-sectors, namely Government Administration, Departmental Commercial Undertakings (DCUs) and Non Departmental Commercial Undertakings (NDCUs) are covered for compiling the CIS estimates. Using the (i) book value/ historic estimates of inventory or CIS estimates for the current year at current prices (ii) the concerned inventory estimate of the previous year at current prices and (iii) relevant WPI estimates, the inventory estimates and CIS estimates for the current year are prepared both at KP and CP. In the case of Administrative Departments and DCU’s of the Public Sector, the data on CIS / book value of the Inventory for the current year are obtained from budget documents. In the case of NDCUs, the data on book value of CIS in each industry activity is culled out from books of accounts (the income statement and balance sheets and cash flow statements). The book value of the CIS for the current year at CP is added to the previous year’s inventory at CP to derive the current year’s inventory at CP. Appropriate WPI is used to obtain the inventory of the current year at KP. Difference between two successive years’ inventory estimates at KP is taken as CIS estimate of the current year at K.P. Using the same WPI, the CIS estimate at CP is obtained.
IX.25 Under Administrative Departments, the industry activities covered are Construction, Electricity, Gas and Water Supply, Real Estate, Ownership of Dwellings and Business Services, Public Administration and Defense and Other Services. In the DCUs, the Industry activities covered are Agriculture, Forestry & Logging, Registered Manufacturing, Electricity, Gas & Water & Supply, Transport (Railways), Transport by other means, Communication, Community, Social and Personal Services (other services). The industry activities covered under NDCUs are Agriculture, Forestry & Logging, Fishing, Mining and Quarrying, Registered Manufacturing, Electricity, Gas and Water Supply, Construction, Trade, Hotels & Restaurants, Railways, Transport by other means, Storage, Communication, Banking and Insurance and Other Services
IX.26 Private Corporate Sector (Joint Stock Companies): Private corporate sector includes the joint stock companies and cooperative sector. In respect of the joint stock companies, the estimates of CIS for each industry activity are made available directly by the RBI on the basis of their studies of sample joint stock companies. The results of the sample studies are given in their publication titled ‘Finances of Public and Private Limited Companies’. Generally, the RBI gives data for the Indian Economy as a whole, every year, on CIS for a set of three years based on the analysis of sample of companies. Once in three years, the RBI gives industry activity-wise distribution of the GFCF estimates also. Using this distribution and yearly CIS estimate at current prices of the economy, the industry wise CIS estimates are obtained every year. Whenever the next set of estimates is received, the industry wise CIS estimates of the economy are revised. The industries covered are Agriculture, Mining & Quarrying, Registered Manufacturing, Electricity Gas & Water Supply, Construction, Trade, Hotels & Restaurants, Transport by other means, Banking & Insurance, and Other Services. As stated above, for Joint stock companies, the CIS estimate for the current year at CP is obtained from the RBI’s sample study results. Appropriate WPI is used to obtain the CIS estimate at KP. Current year’s inventory estimate at KP is obtained as the sum of the current CIS estimate at KP and previous year’s inventory estimate at KP. Using the same WPI, the inventory estimate at CP is obtained.
IX.27 Private Corporate Sector (Cooperatives): Cooperatives are involved in the industry activities mostly of Registered Manufacturing, Trade (non-credit societies), Banking and Insurance (credit societies). For compilation of CIS estimates, only two activity groups namely, registered manufacturing and trade are covered. In cooperative sector, the data published in various tables by the NABARD are used. Estimate of the book / historic value of the inventory at CP for the current year is obtained. The estimate of inventory and CIS at current prices is then prepared using the methodology as stated for Public sector. Using appropriate WPIs, estimates of inventory and of CIS at KP/ CP are determined.
IX.28 It may be noted that from NABARD, the latest available estimates are for the year 2001-02. Hence, appropriate indicators are used to get the relevant estimates for recent years. For Manufacturing and Trade, the indicators applied are Gross Value of Output (GVO) for unregistered manufacturing at current prices and GDP at current price for Trade, respectively. Applying appropriate index number on the estimate of inventory at current price, the estimate of inventory at constant prices is arrived at. Taking the difference between successive years’ estimate of inventory at constant price, the estimate of CIS at constant price is computed. Again applying appropriate index number on the estimate of CIS at constant price, the estimate of CIS at current price is worked out.
IX.29 Household Sector: Methodology differs from one industry activity to the other and between different items within the industry, due to serious data gaps with reference to the household sector. Detailed industry-wise and item-wise methodology followed in the household sector is given below.
Agriculture
IX.30 In this industry for the household sector, only livestock is considered. As the annual incremental data on specie-wise livestock are not available, these are estimated by projection method at the All India / State level using geometric growth rate determined from the latest available quantitative data from Indian Live Stock Censuses. The incremental value of livestock thus obtained has been evaluated at the corresponding average wholesale prices of livestock categories obtained from the State Governments. The constant price estimates are obtained by using the base year prices. The additions to livestock other than those coming under the fixed assets are accounted for in the change in stocks. The categories of animals which form part of increase in livestock are bulls and bullocks over three years not in use for breeding or work, cows over three years not in use for breeding, young male and female stock, goats, sheep, camel and horses, ponies, donkey, mules, yak, mithun under one year, and goats, sheep, camel and other animals of one year and above and not in milk, or not reared for wool clipping or not used as draught animals etc. In fact, a fixed percentage of the incremental value of livestock in each category is taken as change in stock. In case of the pigs and poultry, the entire incremental livestock is taken into compilation of change in stock estimate. The estimate of CIS at constant price for the year t is added to the estimate of inventory at constant price for the year (t-1) to get the estimate of inventory at constant price for the year t. Then applying the implicit price index number on the estimate of inventory at constant prices, the estimate of inventory at current price is obtained. Thereafter, CIS at KP and CP are obtained using the general formulae.
Forestry and Logging
IX.31 Forests come mostly under the public sector (DCUs and NDCUs). The CIS estimate is prepared based on the budget documents and the annual accounts of NDCUs. In the absence of any adequate information for the private sector, no estimate for this sector is prepared.
Fishing
IX.32 No estimate is prepared for private sector due to lack of adequate data.
Mining and Quarrying
IX.33 In the household sector, CIS estimate for the item - minor minerals is compiled. For this purpose, 32.9 per cent of value of output in minor minerals (based on enterprise survey) is taken as current inventory level at current prices for the current year. The value of inventory at KP is obtained using the WPI index for minor minerals. The difference between two successive years of inventory at KP is taken as CIS at KP. The estimates of change in stock at KP and thereafter at CP are derived.
Registered Manufacturing
IX.34 The estimates of inventory for the current year at CP are prepared by moving the total invested capital from the results of ASI for the year 1999-00 (difference of the total capital and the fixed capital for the current year) with the growth rate noticed in GVA (current year’s estimate to base year). From the estimate of inventory at CP, the estimate of inventory at KP is obtained using appropriate WPI. Thereafter, CIS at KP and CP are obtained using the general formulae.
Unregistered Manufacturing
IX.35 The estimates of change in stocks in unregistered manufacturing are estimated using the proportion of inventory to GVA (20.07 per cent) obtained from the survey results of NSSO and DCSSI. The GVA estimate of unregistered manufacturing for the current year at CP is multiplied by the proportion to obtain the inventory at CP. The CIS at KP and CP are derived using the formulae and previous years inventory at CP.
Construction
IX.36 There is no CIS estimate compiled for household sector.
Electricity, Gas and Water Supply
IX.37 No CIS estimate for household sector is prepared for Electricity, Gas & Water Supply.
Transport by Other Means and Storage
IX.38 In the household sector, the Gross Fixed Capital Stock of machinery and equipment and software used for mechanised Road transport at current prices in the private sector is obtained first. A proportion of the GFCS used in the activity (2.31 per cent based on a previous study) for the current year is taken as the estimate of inventory at CP. Using the standard formulae, and the value of inventory at KP for the previous year at KP, the estimates of CIS at KP and CP for all years are derived.
Storage & Warehousing
IX.39 For the year 1992-93, the estimate of inventory at current price for private sector Storage and Warehousing is available from the enterprise survey 1992-93 results. The 1992-93 estimate is used for the following years using the growth rate observed in the GDP unadjusted for FISIM for Storage at current price. Using the standard formulae, and the value of inventory at KP for the previous year at KP, the estimates of CIS at KP and CP for all years are derived.
Hotel & Restaurants
IX.40 For the year 1993-94, the estimate of inventory at current price is available from enterprise survey report on hotels and restaurants. For household sector, from the information available in the sample surveys, the estimated number of enterprises (restaurants and hotels) is presumed to be growing at 1.04 per cent over the previous year. Applying this growth rate and also the per cent growth in the WPI number (all commodities with 1993-94 base) on the estimate of inventory at current price for the year 1993-94, the estimate of inventory at current price for the next years are obtained. Using the standard formulae and the estimates of the inventory at constant prices, CIS estimates at KP and CP are obtained.
Banking and Insurance
IX.41 No CIS estimate is prepared for the household sector due to lack of adequate data.
Trade
IX.42 Trade (Food Grain): The base year estimate of inventory at current price is moved forward using the growth in the Food Credit in the Commercial Bank Credit, which is available in the RBI publications. By using the standard formulae on the inventory at current prices so obtained, CIS estimates at KP and CP are obtained.
IX.43 Trade (Other Commodities): Benchmark estimate is moved using growth in the advances to household trade (with all credit limits) by Scheduled Commercial Banks as obtained from RBI (Basic Statistical Returns, Table 5.2). The benchmark estimates of trading activity in the household sector is based on DTE Survey 1990-91, and NSS report No. 403-Small Trading Units in India 1990-91.
Errors and Omissions
IX.44 The estimates of Gross Capital Formation (GCF) by the industry of use are obtained by aggregating the corresponding estimates of fixed capital formation (adjusted as said earlier) and change in stocks prepared industry wise through expenditure method. A separate independent estimate of GFCF by type of assets (construction and machinery & equipment) is also obtained by commodity flow method. The estimates of gross domestic savings added with the net capital inflow from abroad (current account deficit) give rise to another estimate of total domestic capital formation, (by funds flow method). These independent estimates of gross capital formation thus obtained differ and do not tally. The difference between the GCF estimated through the funds flow method and the GCF estimated through the commodity flow method by type of assets is treated as ‘errors and omissions’. For measuring the rate of capital formation, total domestic capital formation by funds flow method is used.
The Commodity Flow Method
IX.45 The commodity-flow method is used in the estimation of gross fixed capital formation (GFCF) by assets (broadly classified under (a) construction and (b) machinery & equipment). The GFCF compiled through this method is used to estimate GFCF in the household sector as a residual, after accounting for the GFCF in public and private corporate sectors, which are estimated using direct data sources of budget documents of Government administrative departments, departmental commercial undertakings, annual accounts of public enterprises, public and private limited companies and cooperatives. This residual estimate of GFCF along with change in stock in the household sector is also taken as the savings of the household sector in physical assets. Hence, the quality of the GFCF estimate based on commodity-flow method reflects in the quality of savings estimates of the country as well.
IX.46 The method of estimation of GFCF in construction and machinery & equipment, following the commodity-flow procedure, is given in the following paragraphs.
Empirical Methods and Procedures used in the Estimates based on Commodity Flow Method
A. Construction
IX.47 ‘Construction’ broadly comprises two components, namely, (i) Accounted Construction (Pucca Construction) and (ii) Un-accounted construction (Kutcha Construction). In each category, both the new construction and repair & maintenance are covered. The new construction part is the GFCF in construction.
IX.48 The value of accounted construction undertaken using the construction materials such as cement, steel, bricks, timber, fixtures etc., is determined by commodity flow method. The estimates of labour intensive unaccounted construction undertaken mostly with the help of freely available or traditional, locally procured materials like leaves, reeds, mud, etc., on the other hand, are prepared by expenditure approach using data from sample surveys and benchmark estimates.
IX.49 The commodity-flow approach followed for estimating the output of construction in the pucca construction envisages estimation of production of commodities used in construction after adjusting for inputs in other industries, changes in stocks, imports and exports, so as to obtain the net availability of commodities for construction purposes. The commodities available for construction are valued at prices paid by the builders at the site of construction. Information on retail prices, transport costs, dealers’ margins and indirect taxes collected from various sources is used to estimate the prices of inputs at site. The approach covers the cost of basic materials, other construction materials and factor payments such as labour cost, rent interest etc. The basic construction materials considered in this context include (i) Cement and Cement products, (ii) Iron and Steel, (iii) Bricks and Tiles, (iv) Timber and Round Wood and (v) Fixtures & Fittings.
IX.50 The five basic material groups account for 72.5 per cent of the total construction materials and the remaining 27.5 per cent constitute other construction materials. Data on basic construction materials is collected every year. The contribution of factor payments to the construction activity is assumed to be 53.4 per cent of the total cost of all construction materials (both basic and other). These norms are derived from the previous surveys and the results based on cost of construction indices compiled by various States. Principal source for these norms for the NAS 1999-2000 series are the Survey on Housing Conditions, 2002-03 (58th Round), NSSO, and the studies done by few States on cost of construction.
IX.51 Cement and Cement Products: Cement is produced in the organised sector and the data on year-wise cement consumption in States/Union Territories are available in the annual publication “Cement Statistics” brought out by Cement Manufacturers’ Association, New Delhi”. From the data on total quantity of cement consumed, the net quantity of cement available for construction is determined by excluding the estimated quantity of cement used for intermediate consumption in other industries and adjusting for net imports. The estimated quantity is then evaluated using data on all India average price of cement from 23 centres available from the Handbook of Housing Statistics brought out by the National Buildings Organisation (NBO). The total value of cement used in construction as obtained above is marked up by 2 per cent to take account of the transportation costs from the point of purchase to the site of construction. The value of cement products like asbestos sheets, hume pipes etc., as available from ASI is added to the value of cement. The data in respect of excise duties paid on cement products are collected from the Ministry of Finance. The estimates of Trade Transport Margins on cement products are obtained from the CSO’s Input-Output Transactions Table (IOTT), 1998-99. Detailed estimation procedure of the value of cement used in construction is presented in the Table 9.2.
Table 9.2: Value of Cement and Cement Products used in Construction |
(Rs. Lakhs) |
Item |
1999-00 |
1 |
|
2 |
1. |
Total Consumption of Cement including Net Imports ‘000 Tonnes * |
92050 |
2. |
Cement used as input in other industries 10.87% ** |
10006 |
3. |
Cement available for Construction ‘000 Tonnes (1-3) |
82044 |
4. |
Prices of Cement (Rs. Per Tonnes) @ |
2909 |
5. |
Value of Cement (3*4) (Rs. Lakhs) |
2386665 |
6. |
Transport Margin 2% of item 5 *** |
47733 |
7. |
Value of Cement used in Construction (5+6) |
2434398 |
8. |
Value of Cement Products(From ASI) Rs. Lakhs # |
409787 |
9. |
Excise duty on Cement Products Rs. Lakhs |
40979 |
10 |
Value of Cement Products ASI inclusive of Excise duty (8+9) |
450766 |
11 |
T.T.Margin 25% of item 10 ** |
112691 |
12 |
Value of Cement Products at site (10+11) |
563457 |
13 |
Total Value of Cement incld. Cement products used in Construction (7+12) |
2997855 |
Sources:
* : Cement Statistics (Publication of Cement Manufacturer’s Association).
** : IOTT Norm , *** : Study based on Cement Dealers.
@ : NBO, # New basket of items used in construction culled out from ASI. |
IX.52 Iron and Steel: The composition of items, along with their percentage share, consumed in construction from the “Iron and Steel” group for both organised manufacturing sector and unorganised manufacturing sector is determined through discussions with the officials of Central Public Works Department, National Buildings Organisation, Building Materials and Technology Promotion Council (BMTPC), Builders’ Association, and others. For the new series, the detailed results of ASI 1999-2000 have been used for estimating the value of iron & steel items like heavy structures, light structure, heavy rails, fish plates, corrugated sheets, bars and rods, sleepers, railway track material and iron and steel structures comprising bridge work, fabricated structures for buildings or transmission towers, sluice gates fabricated out of rolled section, gates and grills, shutters including rolling shutters, etc., used for construction purposes. The value of the products and byproducts for these iron and steel commodities has been taken from the ASI detailed results based on NIC 1998 at 5 digit level and multiplied with the corresponding percentage determined, in order to estimate the value of products used for construction purposes. For subsequent years, the estimates are carried forward with the help of changes in the production of finished steel as available from the results of ASI.
IX.53 The estimates of iron and steel goods produced in the unregistered manufacturing sector, used as inputs in construction, are based on the latest detailed results of the NSSO (56th Round report of the unorganised manufacturing sector) and Census of the SSI units. For subsequent years, the estimates are moved in relation with those in the organised sector.
IX.54 The aggregate value of domestic supply of iron and steel products available for construction thus estimated is exclusive of indirect taxes & other duties and Trade & Transport Margins (TTMs). To arrive at the value at site, adjustment is made on these accounts. The share of import duties attributable to imports of iron and steel products used in construction is worked out on the basis of the proportion of iron and steel goods used in construction to the total iron and steel imported. Trade, transport and other charges are worked out on the basis of information obtained from the 1998-99 IOTT. The adjustment factor is estimated to be 20.9 per cent of the total value. The detailed steps in the estimation of the value of iron and steel used in construction are presented in the Table 9.3 below:
IX.55 Timber and Round Wood: Direct data on the production of timber and round wood are not separately available. Instead, information is available on production of industrial wood comprising mainly timber and round wood (received from the respective State Governments). From the total quantity of industrial wood, the value of timber and round wood is estimated using specified norms. From the estimates of timber, timber used as railway sleepers is deducted to obtain the quantity of timber available for other uses. The quantity of timber utilised for making railway sleepers is obtained from the Railway Board. However, it is almost negligible from the year 2000-01 onwards as Railway wooden sleepers have since been replaced with RCC/iron blocks. Of the residual quantity of timber, a fixed proportion (48.5 per cent) is taken as having been used in construction. To this, the value of imported timber (different varieties) as well as the corresponding import duties is added. The total value thus obtained is adjusted for exports of timber and round wood and TTMs to obtain the value of this basic material at the site of construction. Data on imports and exports of different varieties of wood used in construction are obtained from the Directorate General of Foreign Trade, Ministry of Commerce and Industry. Data on trade, transport and other charges are estimated on the basis of information obtained from the 1998-99 IOTT. One-third of the value of “Veneer, plywood and their products” with new varieties as available from ASI has now been included in the value of timber and round wood used in construction. This has been done on the basis of discussions held with the dealers engaged in the trading of veneers & plywood etc. The detailed procedure of estimation of value of timber and round wood used in construction is presented in the Table 9.4 below:
Table 9.3: Value of Iron and Steel used in Construction |
(Rs. Lakh) |
Item |
1999-00 |
1 |
|
2 |
1. |
Value from ASI # |
3880258 |
2. |
Excise Duty ## |
388026 |
3. |
Net Imports * |
-26760 |
4. |
Import duties * |
8167 |
5. |
Value from Small Scale @ |
914725 |
6. |
Total Value (1 to 5) |
5164415 |
7. |
TTM at 20.9% of item 5 ** |
1079363 |
8. |
Value at Site (6+7) |
6243778 |
Sources:
# : New basket of items used in construction culled out from ASI, * : DGCIS.
** :IOTT @ NSS 56th Round and SSI Results, ## : Ministry of Finance. |
Table 9.4: Value of Timber and Roundwood used in Construction |
(Rs. Lakhs) |
Item |
1999-00 |
1 |
|
2 |
1. |
Production of industrial wood (000' cu. mt.) * |
4898 |
| |
1.1 Timber (91.86% of item 1 ) |
4500 |
| |
1.2 Round wood (7.95% of item 1) |
389 |
2. |
Timber used in Rly. Sleepers (000’cu.mt.) ** |
3.053 |
3. |
Timber other than Rly. Sleepers(1.1-2) |
4497 |
4. |
Timber used in construction 48.5% of item 3 |
2181 |
5. |
Price of Timber (Rs. per cu. mt.) @ |
31361 |
6. |
Value of Timber (4*5) in Rs. Lakhs. |
683934 |
7. |
Import of Timber & round wood(HS code 4403+4407) |
90782 |
8. |
Import duty of Timber & round wood (Rs. Lakhs) (HS code 4403+4407) |
1924 |
9. |
Total Value of Timber produced inclusive of import(6+7+8) |
776640 |
10. |
Export of Timber & round wood(HS code 4403+4407) |
245 |
11. |
Trade and Transport Margin(TTM) 17.2% of item 9 |
133582 |
12. |
Value of Timber at site (9+11-10) in Rs. Lakhs. |
909977 |
13. |
Round wood used in construction 38.3% of item 1.2 |
149 |
14. |
Price of round wood (Rs. Per Cubic Mtr.) |
5286 |
15. |
Value of round wood (13*14) |
7884 |
16. |
TTM (22.3% of item 15) |
1758 |
17. |
Value of round wood at site (15+16) in Rs. Lakhs |
9642 |
18. |
Price of Railway Sleepers **(per cu. mtr.) |
19359 |
19. |
Value of Rly. Sleepers (Rs. Lakhs) |
591 |
20. |
TTM 5% of item 19 |
30 |
21. |
Value of Rely. Sleepers at site(19+20) (Rs. Lakhs) |
621 |
22. |
Ex-factory val. of veneer & plywood & their product (From ASI #) |
97458 |
23. |
Exise duty on veneer & plywood @@ |
8600 |
24. |
Value of plywood (22+23) |
106058 |
25. |
Val. of plywood &veneer used in const.(1/3 of24) |
35353 |
26. |
Import veneer and plywood(HS code 4408+4410+4411+4412) |
3551 |
27. |
Import duty of veneer and plywood (HS code 4408+4410+4411+4412) |
1161 |
28. |
Value of veneer, plywood etc. at site(25+26+27) Rs. Lakhs |
40064 |
29. |
Export of veneer and plywood(HS code 4408+4410+4411+4412) |
2358 |
30. |
TTM 25% of item 28 |
10016 |
31. |
Value of Veneer and plywood at site (28+30-29) |
47723 |
32. |
Total value of Timber & round wood etc (12+17+21+31) |
967962 |
* : Supplied by DES, ** : Collected from Railway Board.
@ : NBO Average Price of 23 Centres from the publication HANDBOOK ON STATISTICS -2003
# : New basket of items used in construction culled out from ASI
@@ : Ministry of Finance. |
IX.56 Bricks and Tiles: Estimates of the quantity of bricks and tiles are prepared in an indirect way, on the basis of information on dispatches of coal used for brick burning. Information on dispatches of coal for brick burning is collected from the Office of the Coal Controller. On the basis of the information collected from NBO, CPWD and various kiln owners, average quantity of coal needed for producing one lakh of bricks and tiles has been estimated. This proportion is used to determine the total quantity of bricks and tiles produced in the small scale sector. The output of bricks in the sector is evaluated at all-India average retail prices regularly collected and published by NBO along with the prices of timber etc. The discussions held with the brick kiln owners revealed that hardly any coal was being used in the manufacture of bricks & tiles in the registered manufacturing (ASI) and the coal dispatches were mainly used for burning bricks in the unorganised sector. As such the value of production available from ASI has been taken into account explicitly and treated as organised. Besides the small scale industries, a large number of rural households produce bricks for own use. In the absence of adequate data, their contribution has been taken equal to 10 per cent of the value of production of bricks & tiles produced in the small scale sector, on the basis of data on work force engaged in the manufacturing of structural clay products as per 2001 population census. The value obtained from ASI is marked up by 27.8 per cent for TTMs on the basis of information obtained from IOTT 1998-99. Steps involved in estimating bricks and tiles used in construction are described in the Table 9.5 below:
IX.57 Fixtures and Fittings: In the construction activities, ‘fixtures and fittings’ make a significant contribution as the basic materials of construction. Data on value of production of a large number of fixtures and fittings of permanent nature, such as lifts, generators, fire-extinguishers, pipelines of Liquefied Natural Gas, fans and blowers, insulators, electric cables and wires, water meters, house service meters, sanitary fittings, etc., used in construction are collected from the reports of detailed results of ASI 1999-2000. For the years for which ASI data are not available, IIP data are used. For each 5 digit level NIC 1998 compilation category of fixtures & fittings, a specified proportion of total production is treated as being used in construction. These proportions are decided after discussions with CPWD & NBO. TTMs are estimated to be 35 per cent, which is added to the value of output to arrive at the value at site. Details of estimation are given in the Table 9.6 below:
Table 9.5: Value of Bricks and Tiles used in Construction |
(Rs. Lakhs) |
Item |
1999-00 |
1 |
|
2 |
1. |
Allocation of Coal for brick burning 000' tonnes * |
6361 |
2. |
total bricks produced (in crores) @ |
3976 |
3. |
Price of bricks Rs. Per thousand of bricks @@ |
1800 |
4. |
Value of bricks in un-organised sector(Rs. Lakhs) |
787174 |
| |
4.1 Small enterprises (2*3) |
715613 |
| |
4.2 Others (10% of 4.1) |
71561 |
5. |
Value of bricks &Tiles in organised sector (Rs. Lakhs) ASI # |
277917 |
Excise Duty |
27792 |
6. |
Trade and Transport Charges 27.8% of item 5 $ |
77261 |
Total Value of bricks at site (Rs. Lakhs) (4+5+6) |
1170143 |
*: data supplied by Office of the Coal Controller
@ : 16 Tonnes of coal is required for burning of one lakh of bricks
@@ : Average price of NBO.
# : New basket of items used in construction culled out from ASI; $ With the help of IOTT |
Table 9.6: Value of Fixtures and Fittings Used in Construction |
Sl. No. |
NIC 98 Code at 5-digit |
Description of Items |
1999-00 (Rs. lakh) |
Proportion Utilised |
1 |
2 |
3 |
4 |
5 |
1 |
25203 |
Manufacture of bathing tubs, wash-basins, lavatory pans and covers, flushing cisterns and similar sanitary-ware of plastics |
683 |
100% |
2 |
26109 |
Manufacture of other glassware/glass products: articles of glass used in construction such as glass blocks |
51859 |
50% |
3 |
26914 |
Manufacture of ceramic sanitary wares: sinks, baths, water-closet pans, flushing cistern etc. |
3455 |
100% |
4 |
26915 |
Manufacture of ceramic insulators and insulating fittings for electrical machines, appliances and equipment |
4461 |
100% |
5 |
26944 |
Manufacture of quicklime, slaked lime and hydraulic lime (excl. chewing lime) |
36097 |
100% |
6 |
26945 |
Manufacture of plasters consisting of calcined gypsum or calcium sulphate |
944 |
100% |
7 |
26960 |
Cutting, shaping and finishing of stone[ includes cutting, shaping and finishing stone for use in construction, in cemeteries, on roads, as roofing and in other applications] |
127019 |
50% |
8 |
27203 |
Manufacturing of Aluminum (includes basic processing, smelting, refining for production of base metal; its further rolling, drawing and extruding; and production of powders or flakes, foil, plates, sheets or strip, bars, rods, profiles, wires, tubes, pipes and tube or pipe fittings) |
129596 |
50% |
9 |
28122 |
Manufacture of tanks, reservoirs and similar containers |
30773 |
100% |
10 |
28993 |
Manufacture of reinforced safes, vaults, strong room doors and gates and the like |
100% |
|
11 |
28994 |
Manufacture of metal sanitary ware, including baths, sinks, wash basins, and other metal sanitary and toilet articles, whether or not enameled |
30703 |
100% |
12 |
31300 |
Manufacture of insulated wire and cable [insulated (including enameled or anodized) wire, cable (including coaxial cable) and other insulated conductors; insulated strip as is used in large capacity machines or control equipment; and optical fibre cables] |
377182 |
50% |
| |
|
Grand Total |
792771 |
|
| |
|
TTM 35% |
277470 |
|
| |
|
Total Value of Fixtures & Fittings |
1070241 |
|
IX.58 Other construction materials: Further, in the case of other construction materials like lime, glass and glass products, paints and varnishes, bitumen, sand, coal tar, chips, etc., adequate annual data do not exist for independent estimation. As such, value of these materials is estimated as a proportion of value of all material inputs (27.5 per cent of the total value of all material inputs). This proportion for the benchmark year 1999-2000 is based on the results of surveys done by the State Governments on construction costs and the NSS 58th round.
IX.59 Factor Inputs: Similarly, in the case of inputs of factor payments going into construction, the information available from CPWD, NBO, cost of construction indices and NSS survey results is utilised for working out the value of construction due to the factor input component, which is 53.4 per cent of the value of all material inputs.
B. Machinery and Equipment
IX.60 The GFCF from machinery and equipment includes the ex-factory value of capital goods produced in the registered and unregistered manufacturing sectors, the excise duties paid on them, net imports of capital goods, Import duties and TTMs, software production, fixed assets in livestock and installation charges of wind energy systems. The estimates of capital goods (at current prices) in machinery and equipment are prepared by the commodity flow approach. Latest available ASI detailed results are used for determining the item basket of capital goods in the base year. For the current NAS series, a revised capital goods item basket using the detailed results of ASI 1999-2000 based on NIC 1998 classification has been prepared. The results of NSS 56th Round (2000-01) on unregistered manufacturing enterprises have been taken into account to compile the estimates in machinery and equipment at current prices for unorganised sector for the current NAS series.
IX.61 As stated earlier in this Chapter, various items of machinery and equipment domestically produced and net of imports, are classified into (i) capital goods; (ii) parts of capital goods; (iii) partly capital goods and (iv) parts of partly capital goods. The total value of the items classified under (i) is taken on 100 per cent basis for capital formation. In the case of item (ii) parts of capital goods, 50 per cent of the value is taken as capital formation and the rest is treated as intermediate consumption or for other final uses. The proportions of partly capital goods attributable to capital formation are given in the Table 9.7 below. Similarly, half of the proportions applicable to partly capital goods is taken as the value of parts of partly capital goods for estimating fixed capital formation.
IX.62 For the registered manufacturing sector, the estimated value of capital goods at four/ three/ two digit level was prepared considering the nature of capital goods - fully capital goods (FCG), parts of fully capital goods (PCG), partly capital goods (Ply CG) and parts of partly capital goods (PPly CG) for the year 1999-2000. At 2-digit NIC 1998 level, the value of capital goods have been regrouped into the four categories, namely, (i) nonelectrical, (NIC 1998 codes 29 and 30), (ii) electrical (NIC 1998 codes 31 and 32), (iii) transport and other transport equipment (NIC 1998 codes 34 and 35), and (iv) others (NIC 1998 codes 20, 21, 22, 25, 27, 28, 33, 36, 37). For the succeeding years, the ratio observed between the value of capital goods and the value of products and by-products (GVO) at disaggregated level in the base year, is applied on these years’ value of output of products and by-products to compile the value of capital goods.
Table 9.7: Proportion of ‘Partly Capital Goods’ treated as Capital Goods |
Sl. No. |
Item Code |
Name of the item |
Percentage |
1 |
2 |
3 |
4 |
1 |
550 |
Bedstead (Wooden) |
73 |
2 |
551 |
Almirah, dressing table (Wooden) |
73 |
3 |
552 |
Chair, stool, bench, table |
73 |
4 |
553 |
Suitcase, trunk, box handbag and other travel goods |
24 |
5 |
554 |
Foam, rubber cushion (dunlop pillow type) |
24 |
6 |
555 |
Carpet, daree & other floor matting |
24 |
7 |
556 |
Paintings, drawings, engravings etc. |
69 |
8 |
557 |
Other furniture & fixtures (couch sofa etc) |
73 |
9 |
560 |
Gramophone & record player |
5 |
10 |
561 |
Radio |
5 |
11 |
562 |
Television |
5 |
12 |
563 |
VCR/VCP/DVD & other goods for recreation |
26 |
13 |
564 |
Camera & photographic equip (Digital camera/ hand movie camera) |
26 |
14 |
565 |
Tape recorder, CD Player |
34 |
15 |
566 |
Gramophone & record, audio video cassette |
34 |
16 |
567 |
Musical instruments |
85 |
17 |
580 |
Stainless steel utensils |
27 |
18 |
581 |
other metal utensils |
27 |
19 |
582 |
Casseroles, thermo, thermo ware |
27 |
20 |
590 |
Electric fan |
74 |
21 |
591 |
Air conditioner, air cooler, |
74 |
22 |
593 |
Sewing machine |
69 |
23 |
594 |
Washing machine |
59 |
24 |
595 |
Gas Stove |
27 |
25 |
596 |
Pressure cooker/pressure pan, other cooking /household appliances |
27 |
26 |
597 |
Refrigerator |
59 |
27 |
598 |
Electric iron, heater, toaster, oven & other electric heating appliances |
74 |
28 |
610 |
Bicycle |
69 |
29 |
611 |
Motor cycle, scooter |
69 |
30 |
612 |
Motor car, jeep and other transport equipment |
69 |
31 |
613 |
Tyre & Tubes |
69 |
32 |
620 |
Glass eyes, hearing aids & orthopedic equip. & other medical equip |
34 |
33 |
630 |
Clock, watch |
34 |
34 |
631 |
Other machines for household work |
34 |
35 |
640 |
Bathroom and sanitary equipment |
34 |
36 |
641 |
Plugs, switches &other electric fittings |
74 |
37 |
|
Type writers |
69 |
38 |
|
PCs |
69 |
IX.63 For the unregistered manufacturing sector, the source of data is the NSS results on unorganised manufacturing surveys. For the current NAS series, results of NSS 56th Round survey (2000-01) on unorganised manufacturing enterprises (GVO estimates at three and four digit level) have been used in compiling the estimates of value of capital goods from unorganised sector. Using the GVO estimates at the relevant 3/4-digit level from this survey and the ratio of value of capital goods to the GVO as available from the ASI 1999-2000 detailed results, the estimates of value of capital goods at 3/4-digit levels have been compiled for the unorganised sector.
IX.64 To the ex-factory value of capital goods produced domestically, the amount of excise duties, imports and import duties are added. From the total thus obtained, the value of re-exports is deducted to obtain the availability of capital goods. The value of capital goods thus calculated is then marked up for trade, transport and other charges to obtain the value at purchasers’ prices. Trade, transport and other installation charges have been estimated for the year 1999-00 on the basis of information available from the IOTT 1998-99. From the total value at purchasers’ prices thus obtained, the value of exports is deducted to work out the value of capital formation at site.
IX.65 For estimating the value of additions to livestock taken to form part of fixed assets, all livestock (excepting bulls and bullocks over three years not in use for breeding or work, cows over three years not in use for work or breeding purposes, young male & female stock, goats under one year, female goats of one year and above and not in milk, pigs and poultry) are taken into account. As the annual data on livestock population are not available, these are estimated by extrapolation using geometric rate of growth determined from the data on 17th Indian Livestock Census (ILC) 2003 and 16th ILC 1997. For working out the estimates of capital formation, the number of livestock thus obtained have been evaluated at the average wholesale prices obtained for various categories, from the State Governments.
Rates and Ratios used in the Estimation of Capital Formation
IX.66 There are a number of rates and ratios that are used in the estimation of capital formation through the commodity flow approach. These are normally updated using the norms available from the 5-yearly Input-Output Transactions Tables (IOTT) compiled by the CSO. Although, this updation is not considered quality updation as they are not based on any fresh studies or surveys, these rates and ratios are consistent in the overall national accounting framework.
IX.67 Some of the rates and ratios used in the commodity flow method are given in Tables 9.8 and 9.9.
Table 9.8: Ratios used for classifying expenditures of major schemes and programmes of Government |
Sl. No. |
Scheme /Programme |
Classification to be used |
1 |
2 |
3 |
1. |
Jawahar Rojgar Yojna |
Capital outlay of local bodies |
2. |
Indira Awas Yojna |
Buildings Outlay (100%) |
3. |
Million Well Scheme |
Other Capital Outlay (100%) |
4. |
Integrated Waste Land Dev. Programme |
-Do- |
5. |
Barron Land Development Programme |
-Do- |
6. |
Desert Land Development Programme |
-Do- |
7. |
Drought Prone Areas Dev. Programme |
-Do- |
8. |
Minimum Needs Programme |
Buildings Outlay (20%) Roads outlay (40%) Other Capital Outlay (40%) |
9. |
Food for Work Programme |
-Do- |
10. |
Assured Village Employment Programme |
-Do- |
11. |
National Malaria Eradication Programme |
purchase of goods and services (95%) and salaries (5%) |
12. |
National Dengue Control Programme |
-Do- |
13. |
National Leprosy Control Programme |
-Do- |
14. |
Sarva Shiksha Abhiyan |
salaries (95%) and G(5%) |
15. |
Operation Black Board Scheme |
-Do- |
16. |
Education Guarantee Scheme |
-Do- |
17. |
Integrated Rural Energy Programme |
Machinery outlay (80%) and Other Capital Outlay (20%) |
18. |
Sampuran Gramin Rojgar Yojna |
Capital transfers to non-Government (80%) and transfers to individuals (20%) |
19. |
Employment Assurance Scheme |
-Do- |
20. |
Swarnajayanti Gram Swarojgar Yojna |
-Do- |
21. |
Modernisation |
Machinery outlay (70%), salaries (10%), purchase of goods and services (5%), Buildings Outlay / Other Capital Outlay (15%) |
22. |
Strengthening of Systems |
salaries (70%) and purchase of goods and services (30%) |
23. |
DRDA grant |
Buildings Outlay (20%), Roads outlay (40%), Other Capital Outlay (40%) |
24. |
Grant to Panchayat etc (A/c head 3604) |
Transfers to local bodies (100%) |
25. |
Current expenditure on establishment charges in accountable heads of the public department |
90% Salaries & wages, 10% purchase of goods and services |
26. |
MPLAD Scheme |
50% State, 50% Local Bodies
In State/LB Buildings Outlay (20%), Ro (40%), Other
Capital Outlay (40%) |
Note: The classification and ratios for the above-mentioned schemes / programmes are indicative and may vary from State to State depending on the nature of expenditure incurred. |
Table 9.9: Rates and Ratios Used in Commodity Flow Approach A. GFCF - Construction |
Sl.No. |
Item |
Rates / Ratios |
Sources |
1 |
Cement |
Cement used as input in other industries 10.87% |
IOTT 1998-99 |
2 |
-do- |
Transport Margin (2%) for cement from point of purchase to site of construction |
IOTT 1998-99 |
3 |
-do- |
Trade, transport and other charges (25%) for cement products covered through ASI |
Based on the information obtained from dealers and sales tax data obtained from State authorities |
4 |
-do- |
Cement Products such as hume pipes, asbestos sheet, jalis etc. used in construction |
ASI Detailed Results 1999-00 |
5 |
-do- |
Prices of Cement |
NBO |
6 |
Iron & Steel |
Trade, transport and other charges for iron & steel 20.9% of the total value of iron & steel used in construction |
IOTT 1998-99 |
7 |
-do- |
Ratio of Iron & Steel used in construction 38.67% for NIC’98 Ind Gr. 27 and 5.88% for Ind Gr.28 of ASI detailed results 1999-00 were used for small scale I&S |
Detailed results of ASI 1999-00 at 5-digit level |
8 |
-do- |
Ratio of Output to GVA 4.99% for NIC’98 Ind Gr27 and 2.8% for Ind Gr.28 |
Results of the NSS 56th round and All India census of small scale industries 2001-02 survey results |
9 |
-do- |
Net Imports used in construction |
DGCIS publication Monthly Statistics of Foreign Trade Import & Export |
10 |
-do- |
Import duty used in construction (proportion of net imports used in construction to total import of Iron and Steel) |
Union Govt. Budget/ actual data |
11 |
-do- |
Value of ASI |
ASI detailed Results 1999-00 at 5-digit level |
12 |
-do- |
Production/Dispatches of finished steel |
Joint Plant Committee |
13 |
Bricks & Tiles |
Allocation of coal for brick burning 16 tonnes of coal is needed to produce one lakh of bricks |
Based on the information collected from Coal Controller, NBO, CPWD and various kiln owners |
14 |
-do- |
Value of bricks & tiles produced by rural households for own use. |
In the unregistered manufacturing sector on the basis of data on work |
Table 9.9: Rates and Ratios Used in Commodity Flow Approach A. GFCF - Construction |
Sl.No. |
Item |
Rates / Ratios |
Sources |
| |
|
Presently it is 10% of the value of output of bricks & tiles produced |
force engaged in the manufacturing of structural clay products as per 2001 Census |
15 |
-do- |
Percentages of Value of products and by-products used in construction activity |
ASI detailed Results 1999-00 at 5-digit level |
16 |
-do- |
Prices of Bricks |
NBO |
17 |
-do- |
Trade & Transport Charges 27.8 % of value of bricks in organised sector |
IOTT 1998-99 |
18 |
Timber & Round Wood |
Proportion of Timber to the production of Industrial Wood (91.86%) |
For the benchmark year, quantity of Timber & Round wood obtained is moved every year |
19 |
-do- |
48.5% of Timber and 38% of Roundwood are being taken which is actually used in construction |
On the basis of information contained in the “Timber Trend Study for the Far East, country report for India “ |
20 |
-do- |
TTM used in for Timber, Roundwood and for ASI sector respectively as 17.2%,22.3% and 33.33% |
Information obtained from IOTT 1998-99. |
21 |
-do- |
Prices of Timber & Roundwood |
For Timber NBO and for Roundwood based on a past study |
22 |
Fixture and Fittings |
TTM being used is 35% of total value of products and by-products (sanitary wares, fittings, glass, stone, aluminum etc.) covered through ASI |
ASI detailed results 1999-00 at 5-digit level locating items of fixtures and fittings which is meant for construction purposes |
23 |
Total of all Basic Materials as cited above |
72.5 % of value of all input materials |
Based on the information from NBO CPWD and CBRI and survey results. |
24 |
Factor Inputs |
53.4 % of the total available supply of materials |
Based on the information from NBO, CPWD and CBRI and survey results at the time of revision of base year 1999-2000 series. |
25 |
Other Materials |
27.5 % of value of all input materials |
Based on the information from NBO CPWD and CBRI and survey results. |
26 |
Pucca Construction in Household sector |
Derived as a residual through the commodity flow approach |
Overall estimates of GFCF compiled through commodity-flow approach |
27 |
Kutcha construction in household sector |
residential and non-residential building - 79 % of the total expenditure in the case of rural and 3% in the case of urban |
AIDIS, 2002-03 |
Table 9.9: Rates and Ratios Used in Commodity Flow Approach B. GFCF-Machinery & Equipment |
Sl.No. |
Item |
Rates / Ratios |
Sources |
1 |
Proportion of partly capital goods treated as Capital Goods for nonelectrical, electrical, transport equipment and others group |
Different ratios for different items of capital goods nature |
Based on ASI detailed results 1999-00 and NSS 56th round survey results. |
2 |
Small Scale sector |
capital - output ratios of ASI |
Unorganised Mfg. NSS 56th Round |
3 |
Additions to stock of finished and semi finished goods covered through ASI |
Ratio of capital goods to products and byproducts of ASI |
ASI Detailed Results 1999-2000 |
4 |
Trade and Transport Margin on Domestic Availability of NIC 98 Ind. Gr. of non-electrical, electrical, transport equipment and Others |
For non-electrical - 17.7% For electrical - 24.1 % For transport equipment - 21.5% For Others 31.0% |
IOTT 1998-99 and correspondences with manufacturers of capital goods |
5 |
Import Export Re-Export, Import duty, Excise duty |
Direct data |
DGCI&S publication |
6 |
Fixed Assets in Livestock |
Direct data |
M/Agriculture |
7 |
GFCF in Software |
Direct data |
NASSCOM |
Summary
IX.68 The estimates of GFCF for the household sector are taken as a residual from the overall estimates of GFCF compiled through the commodity-flow approach, in the absence of direct data on capital expenditures made by the household sector. The GFCF for the household sector includes (a) construction in the case of pure households (consumers) and (b) construction and machinery & equipment in the case of unincorporated enterprises (those which are not included in the public or private corporate sectors). The only sources of data for this sector for making direct estimates are (a) All India Debt and Investment Surveys (carried out once in 10 years), and (b) NSS enterprise surveys (generally an economic activity gets covered once in 5 years). However, these surveys do not cover the entire ‘household sector’, as many activities do not get covered in the NSS enterprise surveys (for example, trade, mining, construction, water supply, etc.)
IX.69 These two sources of data can at best provide only the benchmark estimates of GFCF for the household sector, subject to the limitations mentioned in the previous para. However, experience shows that the data on GFCF available from the NSS enterprise surveys or the AIDIS is inconsistent, as it is based on verbal response and is not drawn from the books of accounts. The inter-survey growth rates in capital expenditures derived from the AIDIS/NSS enterprise surveys, are very low, and may not reflect the ground level realities or data available from the supply side. The NSSO also admits that the data collected in the asset block in enterprise surveys is likely to be of relatively lower quality since the focus of the enterprise surveys is on collecting income and expenditure details.
IX.70 Therefore, in the absence of any direct data on household sector’s GFCF, the best possible method is to derive the estimates as a residual from the overall estimates of GFCF compiled through the commodity flow approach, notwithstanding the limitations of this approach.
IX.71 Looking at the weak areas in this method, the major one is the various rates and ratios used in estimating the total GFCF of the country from the data on production of basic materials of construction and capital goods. Although, these rates and ratios are updated at the time of revising the base year of national accounts, there is a need for focused and in-depth type studies to update these ratios.
IX.72 A better alternative to improve the quality of present estimates of GFCF in the household sector is to institute annual enterprise surveys covering all economic activities and capturing GFCF data regularly from the books of accounts in respect of the larger enterprises.
A Critical Review of the Available Estimates of Investment
IX.73 The current method of estimation of capital formation is based on the methodology suggested by the Raj Committee in its Report “Capital Formation and Savings in India 1950-51 to 1979-80”, brought out in February 1982. Subsequently, keeping in view the developments that took place and major reforms introduced in the economy in the backdrop of advance of information technology resulting in radical change in the management of information, the then Department of statistics set up an Expert Group on Savings and Capital Formation on April 10, 1995 to review the existing methodology and recommend improvements in the methods and procedures of estimation of savings and capital formation. This Committee was headed by Prof. Raja J. Chelliah. The Expert Group also broadly endorsed the methodology in position for estimating savings and capital formation, particularly on the residual estimation for the household sector.
IX.74 One of the aspects of the estimates of savings and investment in India is the discrepancy in the estimates of GDS and gross domestic capital formation (GDCF). Both the Committees had specific views on the ‘errors and omissions’, which is the gap between the savings side estimate of GDCF and capital formation estimated through the commodity flow approach. While the Raj Committee categorically mentioned that no adjustments be made to the estimates of capital formation on account of the ‘errors and omissions’, the Chelliah Group believed that GDCF estimates are subject to errors in several respects, and methodologies need to be, therefore, improved. The savings in the form of physical assets of the household sector being a part of the estimate of capital formation of the economy would reflect the errors which creep in the estimates of total capital formation in the economy. As physical assets of the household sector are common and critical to both the aggregates, the Committee thought it desirable to have this component independently estimated.
IX.75 Coming to the component-wise details, the estimates of savings and capital formation are prepared in respect of public and private corporate sectors at current prices using published data from Government and company accounts.
IX.76 Data contained in various Budget documents/reports and accounts provide basis for fairly reliable estimates for the public sector. However, the estimates in respect of local authorities are not based on actual annual expenditure data. The estimates relating to Quasi-Government bodies are prepared using the workforce estimates and the estimated value added per worker obtained from the annual reports of the research and scientific institutions. There is a need, therefore, to improve the quality of estimates of public sector with regard to local authorities and quasi-Government bodies, as also the emerging PPPs and SPVs.
IX.77 For the private corporate sector, the annual reports of the companies are the main source of estimation. However, the accounts of the companies are analysed only on sample basis. Also, there is under-coverage of the private corporate sector in the analysis in respect of new companies in the process of setting up, besides the large time-lag in the availability of detailed results from the NABARD on cooperative sector. The under-coverage of capital formation in the public and private corporate sectors gets reflected in the household sector, as they are derived as residual from the overall estimates of capital formation, which are compiled through the commodity flow approach. Also, in recent years due to the establishment of special purpose vehicles (SPVs) and the public private partnerships (PPPs), their contribution to the economy in terms of savings and capital formation may not be directly reflected, although the commodity-flow methods are assumed to exhaustively measure the overall national level estimates. If they are not correctly reflected in the public or private corporate sector’s capital formation estimates, they will get included in the household estimates of both savings and capital formation, which would be quite incorrect.
IX.78 The problem of obtaining the data on a regular basis is severe in the case of the household sector, particularly for the industry-wise and State-wise estimates of capital formation. This sector comprises not only farm households engaged in agricultural production, but also individual households and unincorporated enterprises engaged in industry, trade, transport, finance, private trusts etc. The estimates for the household sector by industry are worked out on the basis of the available data from various censuses, sample surveys, research studies and assumed relationships. The estimates, therefore, would have large errors, which is the reason for the large discrepancy between the industry-wise estimates of capital formation and the commodity-flow estimates of capital formation.
IX.79 As is known, number of ratios and norms are used in the preparation of estimates of capital formation for the economy as a whole. Some of these ratios are based on very old norms and may not be appropriate in the current economic scenario, although most of them are updated at the time of revising the base year of national accounts series, through the norms derived from the IOTTs. If these old ratios are updated, the estimation of capital formation would considerably improve in qualitative terms and the relative size of errors and omissions would probably come down.
Limitations in the Estimation Procedure of Investment
IX.80 The major limitations in estimating capital formation are common to those in respect of savings, namely, (i) coverage of local bodies and quasi Government bodies in the public sector, (ii) coverage of new companies, the companies executing projects through public private partnerships (PPPs) and the cooperatives in the corporate sector, and (iii) lack of direct data on savings and capital formation in respect of household sector. Besides these, the other limitations are:
• Non availability of current and reliable data on output of capital goods in respect of unregistered manufacturing sector, which is essential in the estimation of capital formation for the entire economy through the commodity-flow approach.
• Lack of annual enterprise surveys and reliable data from benchmark enterprise surveys in respect of expenditures made by various industries on acquiring capital goods, as also on inventories, which is essential for industry-wise and State-wise estimates of capital formation.
• While estimating the Fixed Capital Formation by the Commodity Flow Method, number of rates and ratios are being used in absence of direct data. Some of these rates and ratios are based on old surveys or studies, while some of them are updated using the data available from Input Output Tables at the time of revising the base year of national accounts series.
IX.81 As mentioned in the previous Chapter, the Raj Committee and the Chelliah Committee critically examined the procedures of estimation of savings and capital formation in the country and made a number of recommendations for improving the quality of these estimates. Some of the major recommendations made by these two Committees, as also those given by the National Statistical Commission (NSC) relate to the following areas:
Raj Committee
– Commodity flow method for estimating capital formation
– Inventory accumulation in the household sector
– estimation of capital formation in unorganised manufacturing and household sector trading activities
– treatment of errors and omissions
Chelliah Committee
– Commodity flow method for estimating capital formation
– Updation of rates/ratios used in commodity flow method
– Updation of trade and transport margins from IO Tables
– Review of item basket of fixtures and fittings
– Periodic review of life of assets used in estimation of CFC
– States should at least produce GCF for public sector and CSO should provide guidance to States in the preparation of GCF
– Recommendation of 1993 SNA on software, intangible produced assets, defence equipment, etc.
National Statistical Commission
– ….indirect residual estimation of savings in the form of physical assets undertaken by household enterprises and own account un-incorporated enterprises for which decennial all India debt and investment surveys provide benchmark estimates. It is, therefore, recommended to (a) examine the feasibility of reintroducing the receipts and disbursement block with last 365 days as a reference period as was the case with the National Sample Survey integrated household schedule from 1964-65 (19th round) to 1970-71 (25th round) in the current annual surveys of household consumer expenditure; and (b) experiment with the survey methodology for improving the estimation of capital formation from the enterprise surveys.”
IX.82 The status of implementation of the recommendations given by Raj Committee and Chelliah Committee are given in Annex-9.1 and Annex- 9.2 of this Report. Regarding the recommendation of the NSC, there is no improvement in the situation as far as estimation of capital formation by industry is concerned from the NSS enterprise surveys.
New Databases to be created for Improving the Reliability of the Estimates
IX.83 Looking at the weaknesses in the estimation of capital formation and the existing source data constraints, broadly following data bases need to be established for improving the quality of estimates of capital formation:
Public Sector
• Database on urban and rural local bodies
• Database on autonomous Government institutions (quasi Government bodies), which mainly function with the funds provided by the Government
• Database on expenditures made by public-private partnerships (PPPs) and special
purpose vehicles (SPVs)
Private Corporate Sector
•Database on private corporate sector with fuller coverage of companies, both in respect of financial companies and non-financial companies and also public and private limited companies
•
Database on the capital expenditures of new companies which are in the process of setting up and before commencement of commercial production (under construction companies). These expenditures are in the nature of capital formation.
• As in the case of public sector, there is a strong need for establishing database on the expenditures made by the PPPs and the SPVs in the private sector.
Household Sector
•Need to launch annual enterprise surveys, covering non-public establishments, which can provide reliable estimates of savings and capital formation; with focus on larger establishments which maintain accounts.
•
This may require establishing a business register for the country (to begin with all those establishments employing over 10 or 20 workers).
•
This will not only provide industry-wise and State-wise estimates of GCF for the household sector, but will also help in having direct estimates of GCF for the household sector.
The HLC’s Views
IX.84 There was considerable discussion by the HLC on the treatment of ‘errors and omissions’ and its inclusion in the adjusted gross capital formation estimates, particularly with reference to the recommendation on this issue made by the Raj Committee. The HLC observed that the spirit of that recommendation was that the estimates of capital formation were arrived through three different methods, and these independent estimates were recommended to be shown separately and without any adjustments. It was further observed that since the estimates of savings in household physical assets were arrived at as a residual from the commodity flow approach of estimation of capital formation, the estimates of capital formation arrived from the savings side could not be treated as firmer estimates. The estimates of capital formation compiled from the expenditure side by economic activity, which was the third independent estimate of capital formation, was also to be presented without any adjustment for errors and omissions.
IX.85 Based on the discussions the HLC had regarding the treatment of ‘errors and omissions’, it was decided that the following treatment may be accorded. The gross capital formation in the NAS is arrived at as sum of savings and net capital inflow from abroad (current account balance). This indicates the finances available for gross capital formation. A second estimate of gross capital formation, arrived at from the commodity flow approach gives the availability of capital goods for investment in the country. The link between the two estimates, however, is the household sector capital formation (also taken as savings of households in physical assets), which is arrived at as residual from the commodity flow approach capital formation estimates, after accounting for public and private corporate sector’s investment, data on which is directly available. The difference between the two estimates is termed as ‘errors and omissions’. Regarding ‘errors and omissions’, the HLC recommends that different independent estimates of capital formation as obtained by the commodity flow method and estimates of capital formation as obtained from the savings estimates and estimates of capital formation as obtained by the expenditure approach, should be presented as such.
IX.86 On the issue of NSC recommendation to examine the feasibility of reintroducing the receipts and disbursement block with last 365 days as a reference period as was the case with the National Sample Survey integrated household schedule from 1964-65 (19th round) to 1970-71 (25th round), it was stated by the Members that the household schedule in those surveys had a block specifying various heads of receipts and expenditure. However, the pilot survey on income, consumption and savings conducted by the NSSO during the year 1983 revealed that not much of reliable data on income could be collected.
IX.87 With regard to the recommendations of the NSC on improvements in survey methodology for estimation of capital formation through enterprise surveys, the HLC took note of the issue of sample size and the coverage in respect of enterprises in the NSSO surveys. It was pointed out that generally the data on capital expenditures coming from the enterprise surveys is not reliable, as the focus of these surveys was on collection of data on incomes and expenditures, rather than on capital expenditures. However, the HLC noted that the latest survey (62nd Round) gives the requisite data on assets and liabilities and acquisition of fixed assets during the reference period. It was also noted that the sampling design used for the surveys were based on sound statistical procedures and the major problem, if any, was on account of non-sampling errors.
IX.88 The HLC also stressed that there was a need to put forward various issues and problems regarding NSSO surveys on income and expenditures and collection of data on capital expenditures. One such issue was the AIDIS results stating that only 51 per cent of the rural households were taking institutional credit and that this appeared to be contrary to the general perception and therefore there was a need to have a relook at these data. Also, the rates and ratios used in the estimation of various types of capital goods need to be updated, through small type studies to be conducted with the help of state Governments.
IX.89 The HLC noted that there was a substantial difference between the estimates of capital formation as obtained by the commodity flow method and as obtained from the different enterprise surveys conducted by the NSSO. The issues of time-lag in the availability of industry wise estimates of capital formation in private corporate sector and the incomplete industry coverage as per standard national accounts industry classification, from the Reserve Bank of India, were also raised.
IX.90 The HLC noted that the sectoral pictures coming from the estimates of capital formation are not consistent. Among the various available estimates of GFCF, the commodity flow method estimate of GFCF appears to be the most authentic method to estimate capital formation as it considers the input data. Further, although the estimate of capital formation of the public sector has improved quite significantly, there is a serious weakness in the methodology for estimating the capital formation in the private corporate and household sectors, as the estimates of GFCF for these two sectors appear to be linked to each other over the years.
IX.91 The HLC observed that for the Government sector, the availability of data is quite satisfactory. Regarding the private corporate sector, things would improve after the MCA-21 project starts giving the required data. But it would take another three to four years to get the system stabilized. However, for the household sector, since the estimates of capital formation are obtained as a residual, the only possible improvement that could be made right now was to improve the commodity flow method with updation of the rates and ratios used in the methodology.
IX.92 There was a detailed discussion on ‘valuables’. Some Members expressed opinion that valuables do not contribute to the production process and, therefore, should be excluded from the estimates of gross capital formation. It was also argued that (i) it is not possible to assign capital stock in the form of ‘valuables’ to any industry of use even if it is added at the aggregate level, and (ii) net acquisition of ‘valuables’ get completely ignored in the CSO’s savings estimation procedure. However, opinions were also expressed that valuables are neither consumed nor used as material inputs in the production during the year, and, therefore, should remain part of the gross capital formation, but not under the gross fixed capital formation (GFCF). No consumption of fixed capital is to be charged on valuables, therefore, it was not included in the gross fixed capital stock estimates. There is no inconsistency in this as valuables are kept outside the GFCF and change in stocks. Regarding non-inclusion of valuables on the savings side, first, there is no data on acquisition of valuables by various institutions, second, the NSS consumer expenditure survey shows very little purchases of valuables by households and third, it is part of the discrepancy between financing side and commodity-flow side estimates of capital formation. The group was also apprised that as per the System of National Accounts (SNA), valuables are part of gross capital formation, as a separate item distinct from GFCF, and change in stocks. It was also informed that purchases of jewellery by the households as revealed through the consumption expenditure surveys of NSSO is rather small, compared to the overall output of valuables.
IX.93 During the discussions, a point of view that emerged was that ‘valuables’ were not contributing to the production process at all, therefore should not be treated as capital formation. The other point of view was that valuables were not treated as either intermediation consumption or as final consumption expenditure, therefore, should be part of gross capital formation, but outside the gross fixed capital formation, as they were not used in the production process and are kept as store of value. According to 1993 SNA, the data on expenditures made on net acquisition of valuables on precious items like gold has been included under Gross Capital Formation, as a third category separate from the GFCF and Change in Stocks and the same is being followed by all countries. It was brought out that as per SNA 1993, valuables are defined as durable goods that are not used for production or consumption, but are held as stores of value. It was also argued that at present in the external transactions account (BOP account) the imports and exports include valuables like gold, gems and jewellery etc. Hence, the net capital inflow from abroad includes valuables. Therefore, as estimates of capital formation arrived at through savings route take into account valuables, showing expenditures made on net acquisition of valuables as a separate category distinct from GFCF (productive capital) and change in stocks is justified. The HLC, therefore, recommended that the present practice of showing net acquisition of valuables under Gross Capital Formation, as a separate category distinct from the GFCF and Change in Stocks, may continue.
IX.94 Regarding rates and ratios used in the Commodity Flow Method, members suggested that there was a need for a fresh study to find out whether the coverage of the construction items in the methodology was complete or not. It was informed to the HLC that during the base year revision detailed study was conducted in the NAD using the reports of the major construction companies and also the latest NSS report on housing condition. For the base year revision to the year 1999-2000, the report of NSS 58th round on housing condition was used. The 65th round of NSS would again cover the housing conditions. Members stated that efforts should be made to estimate the value of materials other than cement, iron & steel, bricks, furniture & fittings and timber so that the ratio used for blowing up other materials could be brought down. It was also suggested that ratios used for factor payments may be revised after discussions with construction companies. It was informed that those rates and ratios which could not be updated through NSS surveys on debt and investment, enterprises, housing conditions or through the type studies on cost of construction done by States, as well as the results of ASI, are updated at the time of base year revision through the IOTT norms. The HLC agreed to the present practice followed in NAD for conduct of fresh studies at the time of base year revision.
IX.95 It was also emphasised that there was a need to incorporate some adjustment for recycled bricks in the estimation procedure. Members also observed that there was a need to consider the price variation for different qualities of cement, by taking a weighted average considering the production and prices of different qualities of cement.
IX.96 The HLC observed that there was a serious need to have data on capital formation regarding the new companies. Towards this end, it was suggested that the information
would be available from the Ministry of Corporate Affairs (MCA) and MCA might be requested to have additional information on investment on fixed assets like construction, transport equipment and machinery equipment by the companies. It was also suggested that filing of returns of both public sector and private sector projects be made mandatory under provision of Indian Statistical Act.
IX.97 Regarding the estimation of capital formation by industry (expenditure approach), it was noted that in the absence of annual enterprise surveys and quality data on assets in the NSS Enterprise surveys, the estimates for the household sector by industry, are based on adhoc norms and proxy indicators. If the NSS benchmark survey data is used, the household capital formation comes to just a fraction of what is being currently reported in the NAS. The possible improvement to this is the launching of annual enterprise surveys (or annual surveys of non-manufacturing enterprises, ASNME), as recommended by the NSC.
IX.98 Although there is no scarcity of data for the public sector, the private sector estimates are seriously affected by the absence of availability of proper data. The HLC recommended that enterprise surveys should be conducted with suitable sample size for estimation of capital formation by industry and by states. Till such time alternate methods like working out capital output ratios, using ASI data at two digit level and studying its variations with all India capital output ratios and so on, may be tried.
IX.99 Regarding alternative methods and databases for estimating capital formation, the HLC was of the opinion that the AIDIS results and the results of NSS enterprise surveys, along with the pure households’ investments in construction should ideally give an independent estimate of household capital formation. However, due to poor quality of data on assets coming from these surveys (AIDIS and Enterprise Surveys), there is gross under-estimation of capital formation when compared with the supply side data on production and imports of fixed assets. Thus, the HLC felt that there was currently no alternative to the residual method of estimation of capital formation for the household sector, but improvements could be made in this method by updating various rates and ratios used in the capital formation estimated through the commodity flow approach.
Table 9.10: A Comparison between ASI and IIP |
Capital goods |
ASI |
IIP (at current prices)@ |
1 |
2 |
3 |
2004-05* |
44.4 |
20.6 |
2005-06 |
|
21.5 |
2006-07 |
|
25.1 |
2007-08 |
|
26.1 |
* : latest year for which ASI data is available.
@ : IIP growth rates at current prices estimated by superimposing growth rates of WPI-machinery and machine tools on growth rates of IIP capital goods from use base classification |
IX.100 One important issue discussed was regarding the registration of new manufacturing units that do not get into the main frame of ASI census sector and get covered (deliberately) in the ASI sample sector. Apart from distorting the results and creating apparent anomalies, it would not be desirable to ignore this in the interest of better estimates.
IX.101 Another related issue discussed by the HLC was on use of Index of Industrial Production (IIP) data in the estimation of GCF. In the commodity-flow approach used for estimation of overall gross fixed capital formation (GFCF), data on value of output of capital goods is taken from the Annual Survey of Industries (ASI). Since ASI has a time-lag of about 3 years, the CSO uses the Index of Industrial Production (IIP) growth rates of capital goods for the intervening period. However, there are problems in using the IIP data (The ASI too under-reports production data, as witnessed in the years 2000-01 and 2001-02) (Table 9.10).
IX.102 The present IIP, being released by the CSO, has fixed base having fixed commodities (selected in view of their contribution to GDP in 1993-94) and fixed units. Therefore, it captures the production of only select units and does not depict the true volumes of industrial activity in the country, as the present IIP does not take into account the production of new units or diversification of existing units in the country. This leads to possible under-estimation of growth rates of industrial production in the country.
IX.103 Having regard to the above under-coverage issues in IIP, the HLC recommended that the CSO should devise suitable procedures, including the usage of central excise databases on production, to cover total production as far as medium and large scale industrial undertakings are concerned, in respect of the commodities included in the item-basket of IIP. The HLC further recommended that the CSO may explore preparing an alternative index of sales/total income by taking into account both industry and service activities in the country based on quarterly financial results announced by the listed companies.
Recommendations
IX.a On the issue of the treatment of the estimates of capital formation arrived through three different methods to be shown separately without any adjustments, the HLC recommends that the estimates of capital formation arrived from the savings side should be treated as firmer estimates relative to estimates based on commodity flow / expenditure approach as those estimates are based on numerous rates and ratios and various adhoc sources. It was, therefore, recommended that for operational convenience, only one figure of capital formation arrived at through savings route should be used for compiling aggregate rates of capital formation as is being done at present
IX.b Keeping in view the fact that the quality of estimates of savings of households in physical assets depends indirectly on the overall estimates of GCF arrived throughcommodity-flow approach, the HLC recommends regular updation of rates and ratios used in this approach.
IX.c The rates and ratios used in the estimation of various types of capital goods should be updated through small type studies to be conducted with the help of State Governments and other research institutions, such as agro-economic research centres, etc.
IX.d The HLC recommends that efforts should be made to estimate the value of materials other than cement, iron & steel, bricks, furniture & fittings and timber so that the ratio used for blowing up other materials could be brought down. It was also recommended that ratios used for factor payments should be revised at the time of base year revision
IX.e There should be some adjustment for recycled bricks in the estimation procedure of value of output of construction
(Action: CSO)
IX.f The value of cement used in construction should be arrived at by taking into account different qualities of cement using appropriate weights.
(Action: CSO)
IX.g Regarding Valuables, the HLC recommends that the estimates of net acquisition of valuables should be shown as a separate category distinct from the GFCF and Change in Stocks in the estimates of Gross Capital Formation.
(Action: CSO)
IX.h Filing of returns of both public sector and private sector projects should be made mandatory under provision of Indian Statistical Act.
(Action: CSO)
IX.i The MCA should make available the annual accounts of companies under construction, as it was observed that accounts filed under MCA21 would includes these companies.
(Action: MCA)
IX.j Regarding the estimation of capital formation by industry (expenditure approach), the HLC felt that possible improvement to this is the launching of annual enterprise surveys (or annual surveys of non manufacturing enterprises, ASNME), as recommended by the NSC. The HLC, therefore, recommends that the Steering Committee of NSSO should be requested to immediately launch ASNME on a regular basis.
IX.k The HLC also recommends that the Steering Committee of the NSSO may be requested to launch annual survey of non-manufacturing enterprises or annual enterprise surveys focusing on larger enterprises which maintain annual accounts for collecting data on income, expenditure and capital formation.
(Action: NSSO)
IX.l Expressing concern about the deteriorating quality of ASI data, the HLC observed that adequate staff/logistic and infrastructural support are required to improve the quality of ASI data, besides taking measures to simplify the ASI schedule, electronic submission of ASI returns, increasing the coverage of census factories and releasing separate data for the census factories.
IX.m Having regard to the above under-coverage issues in IIP, the HLC recommends that the CSO should devise suitable procedures, including the usage of central excise databases on production, to cover total production as far as medium and large scale industrial undertakings are concerned, in respect of the commodities included in the item-basket of IIP.
(Action: CSO)
IX.n The HLC further recommends that the CSO may explore preparing an alternative index of sales/total income by taking into account both industry and service activities in the country based on quarterly financial results announced by the listed companies.
Chapter X : Capital Formation at Regional Level
X.1 Capital formation at State level is an important indicator useful to measure the economic development of the State. These estimates are important not only for national and regional planning, but also for setting plausible targets of growth, investments, technology change and improving Human Development Index (HDI). Besides, data on capital formation at State level is important for the States for marketing the State for FDI and attract domestic investment.
X.2 Essentially, the Gross capital formation (GCF) is a component of uses of domestic product and, therefore, refers to the aggregate of gross additions to fixed assets (i.e., fixed capital formation) and change in stocks of the producer enterprises in the State during the accounting period. Fixed assets comprise construction and machinery and equipment (including transport equipment, breeding stock, draught animals, dairy cattle, etc.). Changes in stocks include raw materials, semi-finished & finished goods. Since the GCF refers to the acquisition of fixed assets and the changes in inventories in the producer enterprises of the States, some of these items could have originated from outside the state, and thus differ from the fixed assets produced (originated) in the State, which is the concept used in the measurement of Gross State Domestic Product (unduplicated goods and services produced in the state by following the income originating method). Due to the lack of data on inter-state movement of goods and services, it has not been possible to adopt the commodity-flow approach (which is used at the national level) for estimating the capital formation in the State.
X.3 The gross capital formation is measured by the total value of a producer’s acquisition less disposal of fixed assets during the accounting period plus certain additions to the value of non-produced assets realised by the productive activity of institutional units. Thus, the capital formation at State level is that part of the State’s ‘Output’ and ‘Net Imports (from abroad as well as other states)’ which is not consumed but added to the State’s fixed tangible assets and stocks. These estimates can be compiled at either current prices or at constant prices by suitably valuing the fixed assets acquired during the year with the current or constant prices, respectively.
Approaches to Estimation
X.4 Estimates of capital formation can be prepared by following any of the three approaches
(1) Production or commodity flow approach: in this approach the estimates for entire country/states/regional economy are prepared on the basis of commodities (various types of assets of the capital formation namely construction, machinery and software) available (production and net imports minus inter-industry consumption and final consumption expenditure) for capital formation.
(2)
Saving and flow of funds approach: in this approach the estimates of saving are prepared and then the net capital inflow from outside the region/state/country is added to get the total estimates of GCF.
(3)
Expenditure approach: in this approach the expenditure incurred by various institutional units or establishments located in the State on acquiring fixed assets, namely, construction, machinery and software in the geographical boundary of the region/state/country is estimated and the estimates of gross fixed capital formation (GFCF) is arrived at. To this, change in stocks is added to obtain the estimates of capital formation.
X.5 At the national level, all the three approaches are adopted by the CSO. The Regional Accounts Committee (RAC) recommended compilation of estimates of GFCF only at state level, rather than compilation of estimates of gross capital formation (GCF), as estimation of change in inventories is not conceptually viable or feasible at the state level because of the open boundaries of the states. The problem is mainly on account of non-availability of data on goods and services transacted across the state boundaries.
Possible Approaches to Estimation of GFCF at State Level
X.6 Estimates of GFCF at state level are not presently compiled by most states because of non-availability of state-wise details on capital expenditures made by the two institutional sectors, namely, (i) private corporate sector and (ii) household sector. The only institutional sector for which GFCF estimates (and possibly GCF) are compiled by most States, is the public sector. Although data on GFCF in respect of private corporate sector at national level are available from the Studies of Company Finances conducted by the RBI, such details cannot be worked out as companies do not maintain location-wise capital expenditures (CAPEX) in their accounts. Similarly for the household sector, though data for benchmark years for households are available from the AIDIS, detailed data on GFCF for the unincorporated enterprises are not available. There are also problems with respect to AIDIS results, as the investment data from this survey shows considerable underestimates. The benchmark enterprise surveys conducted by the CSO/NSSO do not give reliable estimates of GFCF at state/regional level, at present due to variety of reasons (one such reason is the manner in which disposed assets are valued. Conceptually these should be measured at their depreciated values, but presently they are valued on historical costs, leading many times to negative figures of net acquisition of fixed assets). Besides, data collected in the Asset Block of enterprise surveys is based on verbal responses, rather than from the books of accounts, leading to considerable under-reporting of GFCF.
X.7 For compiling the GFCF estimates at state level, the possible approach could be that the whole state economy may be grouped into a specified number of industries on the same lines as done for the gross domestic product (GDP). Thereafter, the GFCF estimates for each industrial sector, separately for public and private sectors, may be attempted. The estimates can broadly be arrived at, depending on the availability of data at state level, using various approaches, such as direct estimation, capital-output ratios, etc.
X.8 Estimates of the GFCF at state level can be prepared separately for the public sector (including supra-regional sectors) and private sector and, by using various adhoc sources of data, as available now. This is a deviation from the method adopted for the national level estimates to the extent that the two institutions, namely private corporate sector and household sector are clubbed together for the state level estimates. This procedure is due to the absence of detailed data on private corporate sector at state level.
X.9 The estimates of GFCF (and also GCF) for the Public Sector can be compiled from budget documents and annual reports of public enterprises (which is being done presently by most States). The CSO makes available to the states, the GFCF data for supra regional sector namely, railways, communication and banking & insurance.
X.10 For compiling the GFCF in respect of private corporate and household sectors, the available datasets are the ASI, the 10-yearly AIDIS and the 5-yearly NSS enterprise surveys. Of these, the ASI data can be used for registered manufacturing sector. The AIDIS data could be used for agriculture sector for the benchmark estimates and for subsequent years, these data could be extrapolated with indicators (such as sales of agriculture machinery, tractors or growth rates of value of output of agriculture sector). For forestry sector, public part of GFCF could be updated by the percentage of forests in private hands (generally 5 per cent but this could be higher in the case of some states like Meghalaya). For the fisheries sector, ILC data or data available from the fisheries departments on fishing trawlers, equipment, etc. may be used.
X.11 For the rest of the industries (other than registered manufacturing and agriculture & allied sectors), the estimates of GFCF could be prepared entirely for the private sector, rather than distinguishing between private corporate sector and household sector. For this purpose, although the enterprise surveys are the ideal source, unfortunately the quality of capital formation data in these surveys is not good. In some cases, the capital formation is negative in these surveys at state level. The alternative is to use capital-output ratios of public sector or capital-output ratios of private sector at all-India level. For this purpose, the SDP and GDP data is available separately for public and private sectors and so are the estimates of GFCF at all India level. Alternatively, the CSO can allocate the national level private sector GFCF estimates to the States on the basis of indicators such as the available data on fixed assets in the enterprise surveys, or the output.
X.12 In summing up, regarding the estimation of State level Capital formation, it is considered that States can compile GFCF (and possibly GCF) for public sector without much difficulty. The state-wise data on public sector is available from the Gross Block of public enterprises survey in respect of public enterprises and from budget documents for general Government. The main problem in compiling estimates of GFCF is in respect of private sector. For this, only annual enterprise surveys covering all industries, can provide reliable estimates of capital formation at regional level. Other options could be to use capital– output ratios of all-India or public sector within the state. With increase in coverage of companies in the MCA21, it should, however, be possible in future, to get state-wise estimates of capital formation on the basis of location of companies, rather than on the basis of location of establishments (which is what is required for estimating GFCF at state level, as data on acquisition of capital goods in the states is the requirement).
X.13 Another approximate approach for GCF data at state level is by (i) estimating GSDP at market prices (which can be compiled by adding indirect taxes net of subsidies to the GSDP at factor cost) and equating this to disposable income of the state after assuming that the net transfers and factor incomes from abroad and from other states is either negligible or making suitable adjustments to GSDP from the data available at state level on bank deposits; and (ii) subtracting from this the private final consumption expenditure and Government final consumption expenditure. This procedure gives a rough estimate of savings in the State, which can further be approximated to GCF, if one assumes the net capital inflow is negligible. This is, however, a very crude and rough estimate of both savings and GCF in the State. Another problem in this procedure is the lack of availability of data on private final consumption expenditure. However, States can derive this data from the NSS Consumer Expenditure surveys by suitably adjusting to the differences between consumption expenditure data shown in NSS and NAS.
Initiatives of the States to compile Estimates of GFCF
X.14 The responsibility for compiling estimates of GFCF at the State level lies with the respective State Directorates of Economics and Statistics (State DESs). The CSO’s role in this has been to provide the requisite training and supply supra-regional sector estimates of GFCF, to the State DESs.
X.15 Following intensive and regular trainings conducted by the CSO for the benefit of State DES officials, many states now compile estimates of GFCF (and some GCF) for the public sector. These estimates are compiled by the States on the basis of analysis of budget documents being undertaken by them and the annual reports of the non-departmental commercial undertakings. The CSO makes available to the States, the estimates of GFCF of supra-regional sectors.
X.16 In view of the difficulties in getting reliable data on GFCF at state level from the RBI’s company finance studies, the AIDIS and the enterprise surveys of the NSSO, only few States are able to prepare preparing estimates of private sector (which includes both private corporate and household sectors). These estimates are being prepared on the basis of information available from enterprise surveys conducted by the CSO/NSSO. The benchmark estimates as available from enterprise surveys are moved forward with suitable indicators for other years. The estimates as prepared by the states are released by some of them through their publications “Estimates of capital formation”.
X.17 The status of compilation of GFCF estimates at State level is indicated in the statement placed at Annex A10.1.
The CSO’s Efforts to estimate GFCF at State Level through Allocation Method
The CSO recently made an effort to compile estimates of GFCF at State level by allocation of the national totals to States by industries using appropriate indicators.
Public Sector
X.18 For preparing all India estimates of GFCF of public sector, CSO analyses budget documents of central, State Governments and annual reports of Government companies and statutory corporations. Therefore, the State wise break-up of estimates of GFCF can be obtained from these analyses done by the CSO.
X.19 As indicated, estimates of GFCF for the private sector are not being prepared by many states due to non-availability of data for private corporate sector and household sector. In the past, CSO and few individuals, took the initiatives in this direction and attempted to compile the estimates of GFCF at state level particularly for private sector using various adhoc sources of data.
X.20 In the present exercise undertaken by the CSO, the attempt was to allocate the national level estimates of GFCF by public, private corporate and household sectors to the states using indictors and results of surveys. The estimates of GFCF at State level have been prepared separately for the public sector, private sector (which is the combined sector of private corporate and household sectors) and supra-regional sectors. The estimates are given in Annex A10.2. The methodology followed for preparation of GFCF estimates at state level is explained in the following paragraphs:
Public sector includes:
• Administrative departments
•Central Government
•
State Government
•
Local bodies
•
Autonomous Government bodies
• Departmental commercial undertakings
•Central Government
•
State Government
• Non- Departmental commercial undertakings
•Central Government
•
State Government
X.21 The present data sources for preparing the estimates of GSDP, namely, through analysis of central and state Government budget documents, local bodies’ accounts and annual reports of NDCUs have been used to prepare the estimates of GFCF for the public sector. The state-wise GFCF of central NDCUs have been prepared by allocating all India estimates of GFCF on the basis of state wise data on investment given in the gross block including capital work in progress, as available in the Public Enterprise Survey, 2004-05 of the Department of Public Enterprises, Government of India. For DCUs and Administrative Departments, estimates are available through the analysis of budget documents.
Private Sector
X.22 Private sector comprises all non Government joint stock companies, co-operatives societies, private banks, private insurance companies, quasi corporate bodies and household sector. The household sector includes, apart from individuals, all non-Government, noncorporate enterprises like sole proprietorships and partnerships owned and/or controlled by individuals and non-profit institutions which furnish educational, health, cultural, recreational and other social and community services to the households.
X.23 The All India estimates of GFCF by industry of use as published in National Accounts Statistics, 2008 have been allocated among the States using suitable indicators and using data sources as discussed below.
Agriculture including Livestock
X.24 For preparing the estimates of GFCF in Agriculture, results of AIDIS 2002-03 have been utilised. AIDIS provides separate information on fixed capital expenditure on different items of farm business including livestock used as fixed assets. Firstly, the GFCF estimates for household and private corporate sectors have been prepared on the basis of AIDIS results and GVA of Agriculture respectively, for the year 2002-03. Then, for arriving at the estimates for 2004-05, the sum of GFCF of household and private corporate sector moved forward on the basis of growth of GVA of agriculture industry (National level GFCF of household sector allocated on the basis of AIDIS results and GFCF of private corporate sector on the basis of GVA of plantation crops).
Forestry and Logging
X.25 Almost all forests are under public sector. However a small portion of about 5% is in private sector. The GFCF estimates have been allocated on the basis of data available in the publication “Forest Survey of India, State Forest Report, 2004-05”. This report provides information on area under forest departments, corporate bodies and private forests. The estimates of total GFCF have been allocated on the basis of change in the area under forests and then broken into public and private on the basis of ownership of forest.
Fishing
X.26 The state-wise estimates of GFCF have been obtained by allocating the national level estimates using the state-wise fish production data taken from the Department of Animal Husbandry, Dairying and Fisheries, Ministry of Agriculture, Government of India. Although, the Livestock Census provides information on number of mechanised boats, traditional boats (motorised & non-motorised) and number of fishing gears. However, the ownership pattern as well as value of these assets, is not available; as such this information could not be utilised.
Mining and Quarrying
X.27 The GFCF estimates have been allocated to States on the basis of gross value of output of Minor and Major Minerals for household sector and private corporate sector, respectively. Data on Capital Expenditure in mining industry can also be used for preparing GFCF estimates. However, the same could not be compiled.
Manufacturing
X.28 The Annual survey of Industries (ASI) provides State-wise estimates of GFCF. This data has been used to allocate the national level GFCF to the States. The national level GFCF estimate for unorganised manufacturing sector has been allocated to the States on the basis of results of survey on unorganized manufacturing sector (NSS 56th round). From the results of this survey, information available on GVA and net additions in fixed assets, has been utilised to allocate the estimates for the year 2000-01. These data have been moved forward to the year 2004-05 on the basis of growth in GVA at state level.
Electricity, Gas and Water Supply
X.29 The estimates of GFCF in gas sub sector have been allocated on the basis of number of gobar-gas plants. The capacity of wind energy has been utilised to allocate the all India estimates of GFCF in wind energy. Information available on cumulative achievement of the corresponding year from the Annual Report of Ministry of New and Renewable Energy has been used for this purpose. The GFCF estimates relating to electricity and water supply have been allocated on the basis of GSDP estimates.
Construction
X.30 The GFCF of enterprises engaged in construction activity comprises expenditures made on (a) construction and (b) plant and machinery. The construction-part estimates of all-India GFCF has been distributed among the States on the basis of data on new construction by NDCUs. For the part of investment in plant and machinery, the all-India ratio (30%) of investment between construction and plant and machinery has been used.
Trade, hotels & restaurants, Transport by other means, Storage & Communication, Real Estate, Business Services & Other Services
X.31 The NSS 55th round survey on informal sector in India provides net additions to fixed assets & gross value added of these industries during the year 1999-2000 at state level. On the basis of ratio of fixed capital to value added, GFCF for the year 1999-2000 has been estimated using GSDP estimates. Thereafter, the estimates of GFCF worked out for 1999-2000 has been moved forward for the year 2004-05 with the growth observed in GSDP. The state level estimates of GFCF so obtained have been adjusted on pro-rata basis to match with the all-India estimates of GFCF.
Ownership Dwelling
X.32 The estimates of GFCF in respect of Ownership of dwelling as published in the NAS 2008 have been allocated using information available in AIDIS 2002-03 on investment in rural and urban residential buildings.
Supra Regional Sectors:
X.33 Supra-regional sectors include railways, banking and insurance, communications and central Government administration, the estimates for these are prepared by the CSO and made available to States.
The HLC’s Views
X.34 With regard to the recommendations of the NSC on improvements in survey methodology for estimation of capital formation through enterprise surveys, the HLC raised the issue of sample size and the coverage in respect of enterprises in the NSSO surveys, particularly with reference to estimates of capital formation at state level. It was observed that generally the data on capital expenditures coming from the enterprise surveys is not reliable, as the focus of these surveys was on collection of data on incomes and expenditures, rather than on capital expenditures. However, the HLC noted that the latest survey (62nd Round) gives the requisite data on assets and liabilities and acquisition of fixed assets during the reference period. It was also explained that the sampling design used for the surveys were based on sound statistical procedures and the major problem, if any, was on account of non-sampling errors.
X.35 The HLC also noted that there was a need to put forward various issues and problems regarding NSSO enterprise surveys on income and expenditures and collection of data on capital expenditures. One such issue was the AIDIS results stating that only 51 per cent of the rural households were taking institutional credit and that this appeared to be contrary to the general perception and therefore there was a need to have a relook at these data.
X.36 Regarding the estimation of capital formation by industry (expenditure approach), the HLC observed that if the NSS benchmark survey data is used, the household capital formation comes to just a fraction of what is being currently reported in the NAS. The possible improvement to this is the launching of annual enterprise surveys (or annual surveys of non-manufacturing enterprises, ASNME), as recommended by the NSC.
X.37 Although there is no scarcity of data for the public sector, the private sector estimates are seriously affected by the absence of availability of proper data. The HLC recommended that enterprise surveys should be conducted with suitable sample size (including a usable sample from each State) for estimation of capital formation by industry and by States. Till such time alternate methods like applying capital output ratios of relevant industries, using ASI data at two digit level and studying its variations with all India capital output ratios and so on, may be tried, in the case of estimates of GFCF at regional level.
X.38 Regarding alternative methods and databases for estimating capital formation, the HLC was of the opinion that the AIDIS results and the results of NSS enterprise surveys, along with the pure households’ investments in construction should ideally give an independent estimate of household capital formation.
Recommendations
X.a The Steering Committee of the NSSO may be requested to launch annual survey of non-manufacturing enterprises or annual enterprise surveys focusing on larger enterprises which maintain annual accounts for collecting data on income, expenditure and capital formation. The surveys should be designed in such a manner that reliable estimates of capital formation are available, for each State - however small or big it is. This is particularly important for the north-east States and the newly formed States.
(Action: NSSO)
X.b The present enterprise surveys should be conducted with suitable sample size (including a usable sample from each State) for estimation of capital formation at State level and by industry.
(Action: NSSO)
X.c Regarding the estimation of State level capital formation, the HLC observed that most of the States compile GFCF for only public sector and the compilation is done by industry of use. The State wise data on public sector is available from the Gross Block of public enterprises survey. The main problem is getting the data on private investments made in the States. For this, only annual enterprise surveys can provide reliable estimates of regional capital formation. The Steering Committee of the NSSO, therefore, should be requested to launch annual enterprise surveys, which should provide reliable data on capital formation at state level and by industry. Other options to compile GFCF could be to use capital–output ratios of all-India or public sector within the State. With increase in coverage of companies in the MCA21, it should, however, be possible to get State-wise estimates of capital formation on the basis of location of companies, rather than on the basis of location of establishments, which is what is required at State level.
(Action: NSSO)
X.d Regarding GSDP at market prices, the States should attempt to release this data by adding indirect taxes net of subsidies to the GSDP at factor cost (which follows income-originating concept). The data on indirect taxes net of subsidies for the States, including those of local bodies, part is available from the analysis of budget documents of the State Governments, and for the Centre’s part of these taxes and subsidies (including indirect subsidies from the Centre in each State), which is difficult to estimate but possible, efforts should be made to estimate the same.
(Action: CSO and States)
X.e The States may also try to estimate savings by subtracting private final consumption expenditure and government final consumption expenditure from the estimated GSDP at market prices, after assuming that the net transfers and factor incomes from abroad and from other states is either negligible or making suitable adjustments from the data available at State level on bank deposits. This procedure gives a rough estimate of savings in the State, which can further be approximated to GCF, if one assumes the net capital inflow to the state is negligible. This is, however, a very crude and rough estimate of both savings and GCF in the State, but could be an indicative dataset. Another problem in this procedure is the lack of availability of data on private final consumption expenditure. States can derive this data from the NSS Consumer Expenditure surveys by suitably adjusting to the differences between consumption expenditure data shown in NSS and NAS. For estimating income accruals (if one follows this approach to estimate GSDP), the data on factor income flows across States is needed. Flows of goods and non-factor services don’t create conceptual difficulty, but they create practical difficulty for estimation. However, such flows are now available to some extent from Railways and Road Transport operators. The international trade needs to be captured.
(Action: CSO and States)
X.f The HLC recommends that enterprise surveys should be conducted with suitable sample size for estimation of capital formation by industry and by States. Till such time, alternate methods like working out capital output ratios, using ASI data at two digit level and studying its variations with all India capital output ratios may be tried for estimating capital formation at State level.
(Action: CSO and States)
Chapter XI : Financial Deepening and its Reflection in the Financial Savings Estimates
XI.1 One of the issues discussed in recent years in the context of financial sector reforms and their impact on financial savings is that while financial deepening has been taking place at a rapid pace in the Indian economy, its impact are not being adequately captured in the estimates of household financial savings. One of the ToRs expects the HLC to “examine if rapid financial deepening in the economy is getting duly reflected in the estimates of financial savings and suggest improvements, if needed”.
XI.2 It is debated that financial development that brings financial deepening to the system increases range of options available to business enterprises for financing, which help reduce their cost of borrowing and, hence, improves profitability and savings. Cross-country empirical evidence indicates that a better financial system could stimulate private consumption by providing more credit and reduces the need for maintaining high savings levels and, hence, concludes that financial deepening lowers the household savings rate. Higher demand generated in this way results in more business activity for the private corporate sector and help pushing up corporates’ investments and savings. Progressively increasing savings rate of private corporate sector in last few years is indicative of this phenomenon.
XI.3 Financial deepening may be defined as an increase in the size of the financial system and in its role and pervasiveness in the economy. From a monetary policy perspective, it can be defined as the growing diversification of firms’ and households’ portfolios. From the development perspective, it is institutional arrangements which promote funding and maintain the financial stability of the economic development process which lead to high savings rate as well. Development economists have long recognised that the financial system plays a decisive role in the process of economic development (Stiglitz, 1998). However, they remain attached to the conventional view according to which the financial system is a mere intermediary that ensures the optimal allocation of savings for investment (Chick, 1998). Post-Keynesians, especially Davidson (1986, 1996), Chick (1983, 1998) and Wray (1990, 1998), revealed that the financial system is more than an intermediary between savings and investment since it actually creates savings (through finance) as much as it allocates it (through funding).
XI.4 There is a broad consensus in the literature that financial development spurs economic growth and savings. Theoretically, financial development creates enabling conditions for growth through either a supply-leading (financial development spurs growth) or a demand-following (growth generates demand for financial products) channel. Financial deepening involves monetisation of an economy and the rise of financial institutions. With financial deepening, savings are increasingly held in financial assets rather than non- financial assets. This is likely to improve the efficiency of intermediation between savers and investors. The extent of financial deepening in an economy can be judged by tracing the evolution over time of such key financial variables as currency, M3 ratio to GDP, the best measure being the ratio between total financial assets to total real assets (Chowdhury, Anis and Iyanatul Islam, 1993). Lower financial deepening implies that growth of financial assets lagged behind the growth of non-financial assets, as a result savings are held either in non-financial assets and there has been reliance on financial institutions for intermediation between savers and investors. Wider availability of financial instruments caters to the savings needs of the economic agents promoting savings significantly in financial assets.
XI.5 One of the characteristic aspects of financial deepening is that it enhances economic growth through the expansion of access of finance to those who do not have adequate finance. In an underdeveloped financial system, growth is scuttled in view of limited number of market players, while in mature financial systems on the other, financial institutions develop suitable techniques and mechanisms to enable themselves to finance activities which are at the margin, leading to growth-enhancing productive activities through the availability of external finance to such entrepreneurs.
XI.6 During the 1990s, the process of financial deepening was believed to have strengthened in India. In the 1990s, a sharp increase in the household preference for financial assets vis-a-vis physical assets was interpreted as a reflection of financial widening, through which availability of a larger range of financial assets in a decontrolled regime afforded growing flexibility to investors while increasing rates of return with risk minimization. This process was furthered by financial sector reforms. It was believed that as reforms are intensified, financial savings are expected to play a more crucial role in economic development than hitherto.
XI.7 There are doubts as to whether the financial deepening has been fully reflected in financial savings of the household sector contrary to the a priori expectation that financial development should spur economic growth and savings. In this regard, the HLC had discussed the related issues in detail. The important areas and issues considered in this context are a review of the trends of financial deepening and savings in a cross-country setting; considering the relevant aspects of financial deepening in India; a brief review of the savings trends in India; and considering an empirical exercise on the link between financial deepening and the financial savings estimates of households. The HLC has also considered the issues related to financial deepening and the savings estimates of the private corporate sector.
Review of Literature
XI.8 In the economic literature, the financial deepening has positive causal relationship with economic growth, thus, with savings rates as well in an economic system. In the classical and neo-classical economic, the savings is related to interest rates and the level of income, since financial deepening refers to developed financial market, elimination of credit controls, interest rate deregulation, free entry into the banking sector, bank autonomy, and private ownership of banks. In India, empirical evidence suggested that some of the indicator of financial deepening, such as real interest rate and spread of banking facilities as statistically significant positive influences on domestic savings (Sen and Authukorala, 2001).
XI.9 The impact of financial sector liberalisation measures on household sector savings rate in India by constructing a continuous time series financial sector liberalisation index. The impact of the index, along with the other determinants of household sector savings in India is estimated using a general model. The results suggest a significant negative impact of the index on household savings rate, which gives an indication of the increased credit availability due to financial sector liberalisation leading to increased consumption rather than savings.
XI.10 In general, it can be concluded that the impact of real interest rates on savings is ambiguous in the theoretical as well as empirical literature. In India, most of the studies (Muhleisen, 1997; Loayza and Shankar, 1998; Athukorala and Sen, 2001and 2003) have taken proxy variables like bank branch expansion and total institutional lending to the private sector to represent financial sector liberalisation in order to examine their impact on private savings and obtained insignificant impact of these variables.
XI.11 In the cross-country literature, the issue of financial deepening and its impact on the growth savings is traced in the 1960s. The seminal empirical contributions started in the late 1960s, which broadly focused on growth and financial structure Goldsmith (1969), Shaw (1973), and McKinnon (1973). A more recent empirical treatment is King and Levine (1993). The empirical work establishes that financial deepening is at least an intrinsic part of the growth process and may be causal—that is, repressed financial systems harm economic growth. Theoretical efforts at modeling growth and endogenous financial deepening include Townsend (1978, 1983) and Greenwood and Jovanovic (1990). Warman and Thirlwall (1992) using data from Mexico for 1960-1990 obtained a strong positive effect of interest rate on financial savings whereas its effect on total savings and private savings is insignificant. Masson, Bayoumi and Samiei (1998) have obtained a positive and significant effect of real interest rate on private savings in industrial countries and a negative insignificant coefficient for developing countries whereas Loayza, Schmidt-Hebbel and Serven (2000) got insignificant and negative coefficients for real interest rate changes on private savings and the results were not robust across samples also.
Financial Deepening and Savings in a Cross-Country Setting
XI.12 In order to measure financial deepening, the credit-GDP ratio and Money-GDP ratio have been used for the select countries (Chart 11.1 and Table 11.1). In countries like India and Malaysia, the rise in financial deepening has been witnessed with a corresponding rise in the savings rates, while in the developed countries like the US and Japan the rise in financial deepening has had a limited effect on the savings rates of the economies. The results may seem contrasting; however, the country specific reason such as the level of social security measures on welfare of people, wealth effect in the period of rising assets
prices and most significantly the demographic profile which explain the Life Cycle Hypothesis (LCH) may have dampened the savings propensity in a country.
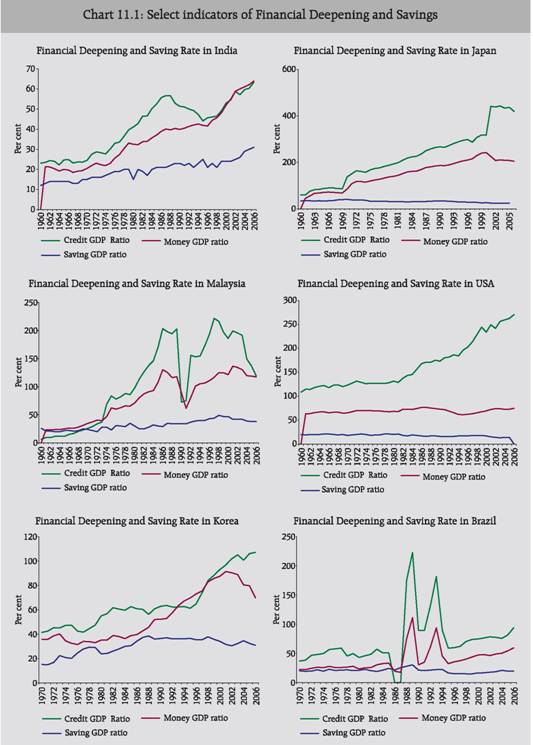
Table 11.1: Gross Domestic Savings and Financial Deepening Indicators |
Country |
|
1970 |
1980 |
1990 |
2000 |
2003 |
2004 |
2005 |
2006 |
1 |
2 |
3 |
4 |
5 |
6 |
7 |
8 |
9 |
10 |
Australia |
Savings/GDP |
31.2 |
26.1 |
23.1 |
22.4 |
23.5 |
23.8 |
25.2 |
.. |
| |
C/GDP |
38.9 |
39.1 |
69.5 |
89.6 |
100.2 |
105.3 |
109.0 |
115.0 |
| |
M3/GDP |
39.7 |
36.4 |
53.5 |
64.9 |
72.1 |
75.5 |
75.5 |
81.1 |
Brazil |
Savings/GDP |
20.1 |
21.1 |
21.4 |
16.5 |
18.7 |
21.0 |
19.6 |
19.7 |
| |
C/GDP |
36.8 |
43.0 |
89.3 |
74.6 |
77.5 |
75.7 |
81.4 |
93.8 |
| |
M3/GDP |
22.5 |
23.4 |
30.4 |
47.3 |
48.9 |
50.2 |
54.2 |
59.4 |
Chile |
Savings/GDP |
19.8 |
16.9 |
28.6 |
23.7 |
25.2 |
29.2 |
30.9 |
34.9 |
| |
C/GDP |
16.7 |
47.0 |
83.6 |
101.6 |
103.6 |
103.8 |
100.4 |
100.7 |
| |
M3/GDP |
14.8 |
28.4 |
39.2 |
42.8 |
37.6 |
35.7 |
35.6 |
36.3 |
China |
Savings/GDP |
28.9 |
35.0 |
39.9 |
37.5 |
43.4 |
45.8 |
49.4 |
52.5 |
| |
C/GDP |
.. |
53.6 |
90.0 |
119.7 |
151.9 |
140.4 |
135.1 |
136.9 |
| |
M3/GDP |
.. |
31.9 |
79.2 |
137.0 |
162.9 |
158.3 |
162.3 |
164.1 |
India |
Savings/GDP |
15.5 |
15.4 |
22.7 |
23.9 |
26.2 |
29.2 |
30.4 |
31.1 |
| |
C/GDP |
24.5 |
41.1 |
51.4 |
53.0 |
57.2 |
59.7 |
60.4 |
63.4 |
| |
M3/GDP |
23.6 |
36.3 |
43.1 |
55.6 |
63.8 |
65.9 |
66.7 |
70.2 |
Indonesia |
Savings/GDP |
14.3 |
38.0 |
32.3 |
32.8 |
32.9 |
28.7 |
28.9 |
29.4 |
| |
C/GDP |
10.7 |
8.2 |
46.7 |
60.7 |
49.2 |
49.6 |
46.0 |
41.7 |
| |
M3/GDP |
9.1 |
15.9 |
40.5 |
53.9 |
47.0 |
44.9 |
43.1 |
41.3 |
Japan |
Savings/GDP |
41.0 |
31.9 |
34.1 |
26.9 |
24.5 |
25.0 |
24.8 |
.. |
| |
C/GDP |
137.3 |
193.1 |
267.0 |
316.8 |
442.6 |
433.4 |
436.5 |
419.2 |
| |
M3/GDP |
106.3 |
146.5 |
192.7 |
243.8 |
207.9 |
204.9 |
204.2 |
200.6 |
Korea, Rep. |
Savings/GDP |
15.2 |
23.9 |
36.4 |
34.2 |
32.3 |
34.6 |
32.4 |
30.9 |
| |
C/GDP |
41.5 |
55.0 |
62.9 |
93.0 |
105.1 |
100.7 |
106.1 |
107.1 |
| |
M3/GDP |
35.8 |
35.1 |
52.3 |
87.5 |
88.9 |
80.4 |
79.7 |
69.8 |
Malaysia |
Savings/GDP |
24.3 |
29.8 |
34.5 |
47.3 |
42.5 |
39.1 |
37.9 |
37.7 |
| |
C/GDP |
26.0 |
97.9 |
72.7 |
186.1 |
191.7 |
149.5 |
137.0 |
119.4 |
| |
M3/GDP |
37.0 |
79.2 |
64.4 |
127.4 |
135.6 |
126.3 |
122.6 |
124.0 |
Thailand |
Savings/GDP |
21.2 |
22.9 |
33.8 |
31.5 |
31.6 |
31.7 |
29.9 |
31.8 |
| |
C/GDP |
31.0 |
60.3 |
94.1 |
138.3 |
122.9 |
116.5 |
111.4 |
101.3 |
| |
M3/GDP |
32.0 |
42.0 |
76.2 |
114.5 |
115.8 |
111.3 |
107.9 |
104.4 |
United Kingdom |
Savings/GDP |
21.1 |
19.9 |
17.6 |
15.5 |
13.8 |
14.0 |
13.5 |
13.6 |
| |
C/GDP |
49.5 |
36.6 |
120.8 |
133.4 |
148.9 |
156.9 |
165.8 |
176.9 |
| |
M3/GDP |
.. |
.. |
.. |
.. |
.. |
.. |
.. |
.. |
United States |
Savings/GDP |
18.4 |
19.8 |
16.3 |
16.6 |
13.5 |
13.6 |
13.5 |
.. |
| |
C/GDP |
122.8 |
131.5 |
173.0 |
233.8 |
256.3 |
259.4 |
262.4 |
270.4 |
| |
M3/GDP |
68.5 |
71.7 |
73.8 |
71.9 |
67.4 |
67.9 |
69.4 |
71.2 |
Source : World Development Indicator, World Bank |
XI.13 In the Indian experience, there is a clear rise in the savings rate along with the rise in the indicators of the financial deepening. The rate of savings have specially picked up in the recent period during 2003-04 to 2006-07 on the backdrop of financial sectors reforms, rise in total factor productivity and investment boom, which has led to acceleration in the growth performance (Chart 11.1).
Financial Deepening in India
There are clear signs of financial deepening in India going by the trends in select indicators.
a. Ratio of bank assets to GDP: According to an indicator of financial deepening, the ratio of bank assets to GDP, financial depth in India was among the lowest in the world (Barth, Caprio and Levine, 2001). Comparable cross-country data indicated that in 2001, this ratio, at 48.0 per cent for India, was lower than those prevalent in Asian economies such as Indonesia (101.0 per cent), Korea (98.0 per cent), Philippines (91.0 per cent), Malaysia (166.0 per cent) and much lower than developed economies, such as UK (311.0 per cent), France (147.0 per cent) and Germany (313.0 per cent). In India, while the ratio of bank assets to GDP has increased significantly to over 80.0 per cent in 2005-06 – obviously a consequence of the high credit growth in recent years - it is still lower than other emerging countries.
b.Growth in non-food credit: The current high industrial growth is reflected in the acceleration in growth of bank credit in recent years. Average growth in non-food credit between 1970 and 2000 had been 16.9 per cent, which in the period of industrial slowdown (1998 to 2002) had also slowed to 14.5 per cent, has accelerated significantly to 27.4 per cent during 2002-03 to 2006-07, implying financial deepening of the system.
c. Shift to retail credit can also be seen as a move toward financial deepening: Much of the recent expansion in non-food credit has been fuelled by an increase in retail credit. During the same period, 2002-03 to 2005-06 annual growth in retail credit was 46 per cent: its share in overall bank credit consequently increased from 6.4 per cent in 1990- 91 to 25.5 per cent in 2005-2006. Earlier, bulk of the bank credit had gone to the industrial corporate sector. Hence, this shift to retail credit can also be seen as a move toward financial deepening, and one that itself fuels industrial and overall economic growth through expansion of greater demand for consumer goods. On the liability side, there is an increase in household financial liabilities, with retail loans and advances from banks constituting a dominant proportion. It may be noted that loans and advances to the household sector from banks increased from 3.6 per cent in 2004- 05 to 5.0 per cent in 2005-06 - an increase of 1.4 percentage points. This is reflective of broad-based strengthening of economic activities, in general, and pick up in agriculture and housing credit, in particular, spurred by attractive tax incentives. Further, there has been a surge in the retail loans, attributable, in turn, to growing middle class with high disposable income, education and personal loans and increased availability of credit cards loans9.
d. Perception from the FoF accounts in India: A perception on the extent of financial deepening can be taken from the FoF magnitudes in India for the period since 1951-52 to 2000-01, where the period since 1991-92 constitutes a significant block in post-reform period of the Indian economy (Table 11.2). It shows that that the measure of financial deepening in the Indian economy has been improving and particularly in the post-reform period (Chart 11.2).
The following observations can be made in this regard:
• The Finance Ratio, as the ratio of total financial claims to national income, is an indicator of the rate of financial development in relation to economic growth. This ratio moved up from 0.034 in 1951-52 to 1955-56 to 0.425 in 1996-97 to 2000-01.
Table 11.2: Long-term Trends in Financial Development from FoF Data |
Period |
FR |
FIR |
NIR |
IR |
1 |
2 |
3 |
4 |
5 |
1951-52 to 1955-56 |
0.034 |
0.733 |
0.512 |
0.273 |
1956-57 to 1960-61 |
0.07 |
1.079 |
0.706 |
0.545 |
1961-62 to 1965-66 |
0.089 |
1.224 |
0.826 |
0.483 |
1966-67 to 1970-71 |
0.087 |
1.238 |
0.793 |
0.56 |
1971-72 to 1975-76 |
0.104 |
1.473 |
0.833 |
0.787 |
1976-77 to 1980-81 |
0.169 |
1.832 |
1.058 |
0.731 |
1981-82 to 1985-86 |
0.205 |
2.491 |
1.464 |
0.698 |
1986-87 to 1990-91 |
0.238 |
2.297 |
1.339 |
0.723 |
1991-92 to 1995-96 |
0.328 |
2.484 |
1.384 |
0.79 |
1996-97 to 2000-01 |
0.425 |
2.326 |
1.343 |
0.751 |
1994-95 |
0.50 |
2.53 |
1.38 |
0.84 |
1995-96 |
0.41 |
1.96 |
1.25 |
0.57 |
1996-97 |
0.37 |
2.05 |
1.12 |
0.83 |
1997-98 |
0.49 |
2.53 |
1.52 |
0.67 |
1998-99 |
0.45 |
2.67 |
1.52 |
0.76 |
1999-00 |
0.37 |
1.81 |
0.96 |
0.89 |
2000-01 |
0.46 |
2.57 |
1.6 |
0.61 |
Note : (i) Finance Ratio = Ratio of Total Issues to National Income (Net National Product at Factor Cost at Current Prices), (ii) Financial Inter-relations Ratio = Ratio of Total Issues to Net Domestic Capital Formation, (iii) New Issue Ratio = Ratio of Primary Issues to Net Domestic Capital Formation, and (iv) Intermediation Ratio = Ratio of Secondary Issues (i.e., issues by banks and other financial institutions) to Primary Issues.
Source : Flow of Funds Accounts, various issues. |
9 As per the Annual Policy Statement for the year 2006-07, the share of advances to ‘individuals’ increased from about 10 per cent of total bank credit in March 2002 to nearly 25 per cent in January 2006. Housing loans also increased by 29.1 per cent and accounted for 14.6 per cent of incremental non-food credit.
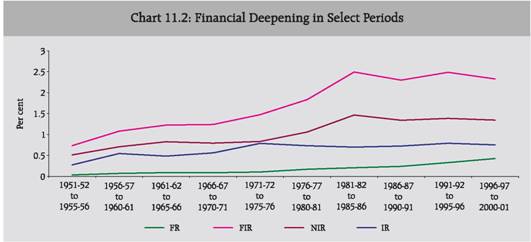 • The Financial Inter-relations Ratio (i.e., the ratio between total issues to net domestic capital formation) reflects the relation between the financial development and growth of physical investment. It is reflective of higher level of participation of the financial system in the capital formation indicating thereby the furtherance of financial deepening. This ratio moved up from 0.733 in 1951-52 to 1955-56 to 2.57 in 1996-97 to 2000-01.
• The New Issue Ratio (i.e., the ratio of primary issues to net domestic capital formation), is indicative of the extent of dependence of the non-financial sectors on other sectors in financing the capital formation. This ratio moved up from 0.512 in 1951-52 to 1955-56 to 1.343 in 1996-97 to 2000-01.
• The importance of financial intermediation by banks and other financial institutions in financing activities is also reflected in the Intermediation Ratio (the ratio between the financial claims issued by the financial institutions and the financial instruments issued by non-financial units). This ratio moved up from 0.273 in 1951-52 to 1955-56 to 0.751 in 1996-97 to 2000-01.
XI.14 Going, thus, by several indicators as above, it may be argued that there is financial deepening taking place in the Indian economy, particularly in the post-reform period. Next is the question of its link with financial savings of the households to see whether these estimates are duly reflective of the trends in financial deepening.
Dominance of Physical Savings over Financial Savings
XI.15 The savings in Indian economy has been rising since the 1970s. However, it has stagnated during the period of early 1990s due to initial structural adjustment in the economy after the reforms process. Subsequently, gross domestic savings picked up from 1997-98 onwards and reached the level of 34.8 per cent in 2006-07. Household savings -composed of both financial and physical savings, as a percentage of GDP at current market prices - increased from around 6.6 per cent in the 1950s to 17.7 per cent in the 1990s and to 22.2 per cent in 2000s, so far. The household savings, it is mainly led by physical savings while the pace of rise in financial savings is somewhat slower in comparison with physical savings. This, however, remains paradoxical in a sense that with the rise in financial deepening, the household financial savings has not picked up significantly.
XI.16 The present dominance of physical savings over financial savings for the household sector can be explained keeping in view of the current economic developments like booming residential property market, increasing loan financing for housing, favourable demographic features of the economy, high salaries in sectors (like IT, finance and BPOs) with young skilled employees earning and having higher savings potentials and savers considering real Estate investment as a hedge against inflation. The rising trend of household physical savings could possibly be explained by a host of factors, namely, (a) non-residential component of physical assets, which have been presumably contributed by the unincorporated business enterprises that are included in the household sector. The size of the unincorporated business enterprises is about 40 million at present; (b) High salaries in some sectors: In recent years the IT, finance and BPOs have emerged as the booming sectors of the economy. The young skilled employees of these sectors earn incomes which are much higher than the average incomes of the other lines of employment in the organised sectors (of course, the unorganised sector is kept out of the purview as no authentic data base is available). These high income net worth individuals have much higher savings compared to the rest of the working force. They prefer to invest this savings in the real estate, (c) Real estate investment as inflation hedge: The investment in real estate has been the destination of savings of the people in recent times particularly since 1999-2000. The average risk-averse wage-earners prefer residential investment as it would provide them with better inflation hedge compared to any financial assets, and (d) Increasing loan financing for housing: Increasing liquidity supply from banks and financial institutions provide easy access to the housing loan at a reasonable interest rate. This is an added incentive for the younger high net worth wage-earners to go for housing investment.
XI.17 A look at the composition of household financial savings shows that the bank deposits continue to remain the major contributor along with the rise in the share of life funds, reflective of the fact that the bank deposit and life insurance funds continue to remain the major instruments of household savings (Table 11.3 and 11.4).
XI.18 The increase in household savings in bank deposits in the recent years since 2004-05 has responded to factors like rise in interest rates, extra efforts made by banks to raise deposits to fund the credit demand and higher return to the savers (at 9 per cent per annum) that Senior Citizens’ Deposit Scheme (which started on August 02, 2004) is providing. The Government has provided fiscal incentives in the budget for the fiscal year 2006-07 - tax relief under Section 80CC. It is expected that households will increase their preference for bank deposits in the medium term, with the policy focus on financial inclusion and greater coverage of rural and semi-urban areas under banking facilities.
Table 11.3: Gross Domestic Savings as Percentage of GDP |
Item |
1970s |
1980s |
1990-91 |
1991-92 To 1996-97 |
1997-98 To 2002-03 |
2003-04 To 2006-07 |
2006-07 |
1 |
2 |
3 |
4 |
5 |
6 |
7 |
8 |
1. Gross Domestic Savings |
17.2 |
19.0 |
22.8 |
22.7 |
24.1 |
32.7 |
34.8 |
2. Household Savings |
11.4 |
13.5 |
18.4 |
16.8 |
20.8 |
23.8 |
23.8 |
(i) Financial Savings |
4.5 |
6.7 |
8.7 |
10.0 |
10.3 |
11.1 |
11.3 |
(ii) Physical Savings |
6.9 |
6.8 |
9.7 |
6.8 |
10.5 |
12.7 |
12.5 |
3. Private Corporate Savings |
1.5 |
1.7 |
2.7 |
3.7 |
4.0 |
6.6 |
7.8 |
4. Public Sector savings |
4.2 |
3.7 |
1.8 |
2.2 |
-0.7 |
2.3 |
3.2 |
5. Real GDP Growth |
2.9 |
5.6 |
5.3 |
5.7 |
5.2 |
8.7 |
9.6 |
XI.19 Contractual savings are on the rise since the 1990s. Among the instruments of contractual savings, it is observed that while the share of claims on life insurance has been increasing, the share of provident funds has been experiencing a decline. Contractual savings may be expected to continue to increase with the pension reforms that are under way and several policy-initiatives that have been taken to encourage insurance penetration through private insurance companies.
Reflection of Financial Deepening in Financial Savings
XI.20 The HLC has considered the possible reasons for the phenomenon of the financial deepening not being reflected in household financial savings. The main issue here is that the estimates of financial savings of the households are showing a decline over the recent years whereas the physical savings are showing an increasing trend.
XI.21 To capture the association between financial savings and financial deepening, an empirical exercise was conducted to examine the effect of financial deepening as proxied by M3-GDP ratio for the period since 1970s where the period of reforms was captured by a dummy (DFIN) from 1991 onwards with the following specification:
Table 11.4: Shares of Components of Household Financial Savings |
(in Per cent) |
| |
1970s |
1980s |
1990-91 |
1991-92 to 1996-97 |
1997-98 to 2002-03 |
2003-04 to 2006-07 |
1 |
2 |
3 |
4 |
5 |
6 |
7 |
Currency |
13.9 |
11.9 |
10.6 |
10.9 |
8.6 |
9.3 |
Bank deposits |
45.6 |
40.3 |
31.9 |
33.1 |
38.5 |
44.0 |
Non- banking deposits |
3.0 |
4.6 |
2.2 |
9.4 |
2.9 |
0.7 |
Life Insurance Fund |
9.0 |
7.5 |
9.5 |
9.5 |
13.1 |
14.6 |
Provident and Pension Fund |
19.6 |
17.5 |
18.9 |
17.6 |
19.0 |
11.4 |
Claims on Government |
4.2 |
11.1 |
13.4 |
7.1 |
14.9 |
16.9 |
Shares and Debentures |
1.5 |
3.9 |
8.4 |
8.3 |
3.7 |
3.9 |
Units of UTI |
0.5 |
2.2 |
5.8 |
5.0 |
0.1 |
-0.8 |
Trade Debt (Net) |
2.7 |
0.9 |
-0.8 |
-0.8 |
-0.7 |
0.0 |
Total Financial Savings (Gross) |
100.0 |
100.0 |
100.0 |
100.0 |
100.0 |
100.0 |
Source : Handbook of Statistics on the Indian Economy, RBI, 2006-07. |
HFS = 0.95 + 12.24 M3 GDP + 0.07PDI + 1.60 DFIN + 0.20 AR (1) |
(0.89) |
(5.01)* |
(1.83) |
(2.34)* |
(1.13) |
Figures in the parentheses are t-statistics. * Significant at conventional levels.
XI.22 Where, HFS stands for household financial savings, M3-GDP ratio proxies financial deepening, PDI represents growth in personal disposable income.
XI.23 It can be seen that financial deepening has a positive and significant impact on household financial savings. This, notwithstanding, the lack of adequate reflection of financial deepening in the financial savings estimates could be on account of the following reasons.
XI.24 First, since 2000-01, the household sector has shown a preference for savings in the form of physical assets, which could be attributed partly to the soft interest regime in recent years. Increase in the rate of household savings in physical asset in recent years was reflective of booming construction activities mainly of housing and accelerated industrial activities requiring machinery and equipments.
XI.25 Second, although logically, with financial deepening and move towards financial inclusion the financial savings is expected to go up. According to the Working Group on Savings for the Eleventh Plan (2007), part of the problem as to why the financial deepening is not getting adequately reflected may be methodological. The way the financial savings are estimated in India, the financial liabilities of the household sector are subtracted from the gross financial assets, while physical savings may be financed by such financial liabilities. Hence, for comparative purposes, it may be useful to look at gross financial savings vis-à-vis physical savings and the former has consistently outpaced the latter.
XI.26 Third, looking at retail portfolio of commercial banks, as percentage to GDP at current market prices (Table 11.5), it has been observed that the housing loan component of retail loans from the banks increased from 3.2 per cent of GDPCMP in 2003-04 to 4.3 per cent of GDPCMP in 2004-05 and further to 5.4 per cent in 2006-07 while that of other components maintained lower orders of increase or decreased during the same period. It may be mentioned that household financial liability is a subtraction item in the financial savings estimation.
Table 11.5 : Retail Credit from Banks |
(Per cent) |
Item |
Per cent to GDP at Current Market Prices |
2003-04 |
2004-05 |
2005-06 |
2006-07 |
1. Housing Loans |
3.2 |
4.3 |
5.0 |
5.4 |
2. Consumer Durables |
0.2 |
0.1 |
0.1 |
0.2 |
3. Credit Card Receivables |
0.2 |
0.3 |
0.3 |
0.4 |
4. Auto Loans |
3.2 |
1.1 |
1.7 |
2.0 |
5. Other Personal Loans |
6.8 |
2.7 |
3.3 |
3.7 |
Total Retail Loans |
13.7 |
8.5 |
10.5 |
11.8 |
Source : Report on Trends and Progress on Banking in India, RBI |
XI.27 Furthermore, as per the BSR data, the distribution of outstanding bank credit of scheduled commercial banks shows that there is considerable rise in the share of bank credit to the household sector, which increased to 47.8 per cent of total outstanding credit on end-March 2007 as compared with 43.3 per cent on end-March 1980.
XI.28 As a way out, an argument has been made that household savings in physical assets should be adjusted by the liabilities incurred to acquire those assets. Analytically, some commentators do not see merit in the argument that netting of gross financial savings by financial liabilities undermines the measure of the phenomenon of financial deepening and intermediation stating that one cannot be oblivious of the purpose for which the accounts are created. Here the net financial assets of the households provide a measure of the extent to which the surplus sector (households) finances the deficits of the public and private corporate sectors for accumulation.
XI.29 While the household sector’s savings in gross financial assets can be a measure of financial deepening, but the growth in financial liabilities of the household sector may also constitute a part of the process of financial deepening and intermediation. Reflecting the structural features of the economy, it is found that with the growth of self-employment, unincorporated enterprises included the household sector have to depend on external finance. Also, there are other distinct measures of financial development, deepening and intermediation: finance ratio, financial interrelations ratio, new issue ratio and intermediation ratio (Table 11.2).
Financial Deepening and Savings Estimates of the Private Corporate Sector
XI.30 It is shown theoretically that with financial deepening, savings are increasingly channelled in financial assets. Such tendency is evident from Table 11.6 where it is observed that there is a clear shift in corporates’ use of funds towards financial assets. The investments in financial assets for the select companies as proportion to total uses increased from average 4.6 per cent in the 1980s to 11.3 per cent in the 1990s and further to 19.2 per cent during 2000-2007, displacing mainly the share of funds used in gross fixed assets. Similarly for the select companies, the share of cash and bank balances in total uses of funds registered an increase from average 2.9 per cent in the 1980s, 2.6 per cent in the 1990s to 7.4 per cent during 2000-2007.
XI.31 Financial deepening in India seems to have largely increased access as well as choice of financing of the Indian corporates impacting the cost of investing funds and thereby profitability and the savings. Corporates are able to substitute domestic borrowings abroad through external commercial borrowings, trade credit and other forms of short-term loans. Banks also intermediate financing at lower costs for corporates by raising banking capital abroad. At the same time, domestic intermediation has become more efficient due to this competition, benefiting industry in reducing their cost of capital. It is seen from corporate data that with financial deepening, savings are increasingly channelled in financial assets with clear shift in corporates’ use of funds towards financial assets, displacing mainly the share of funds used in gross fixed assets. Similarly for the select companies, the share of cash and bank balances in total uses of funds registered an increase over the years. Secondly, though the debt and equity levels of corporates have been on the rise, debt equity ratio has been falling over the recent years, indicating faster rise in equity funds in relation to funds raised through debt, reflecting the financial deepening through the capital market where companies are raising more and more funds for their use.
Table 11.6 : Uses of Funds for the Sample Companies - Share in Total Uses |
(Per cent) |
Uses of Funds |
1981-82 |
1982-83 |
1983-84 |
1984-85 |
1985-86 |
1986-87 |
1987-88 |
1988-89 |
1989-90 |
1990-91 |
1 |
2 |
3 |
4 |
5 |
6 |
7 |
8 |
9 |
10 |
11 |
Number of companies |
1651 |
1651 |
1838 |
1838 |
1942 |
1942 |
1885 |
1885 |
2131 |
2131 |
A. Gross fixed assets |
45.6 |
57.3 |
61.5 |
54.7 |
43.5 |
53.1 |
58.7 |
41.1 |
38.5 |
50.9 |
B. Inventories |
29.0 |
16.0 |
5.1 |
15.4 |
22.9 |
14.4 |
16.6 |
24.0 |
19.6 |
21.3 |
C. Loans and advances and |
|
|
|
|
|
|
|
|
|
|
other debtor balances |
21.9 |
21.5 |
25.3 |
21.3 |
23.3 |
22.0 |
26.6 |
24.6 |
25.0 |
22.2 |
D. Investments |
0.7 |
1.7 |
2.8 |
5.4 |
5.4 |
3.7 |
3.7 |
7.7 |
12.2 |
2.7 |
E. Other assets |
-0.2 |
-0.6 |
0.4 |
0.2 |
-0.1 |
0.5 |
0.4 |
1.3 |
0.4 |
0.3 |
F. Cash and bank balances |
2.9 |
4.1 |
4.9 |
3.0 |
5.0 |
6.2 |
-6.1 |
1.5 |
4.3 |
2.7 |
TOTAL |
100.0 |
100.0 |
100.0 |
100.0 |
100.0 |
100.0 |
100.0 |
100.0 |
100.0 |
100.0 |
Uses of Funds |
1991-92 |
1992-93 |
1993-94 |
1994-95 |
1995-96 |
1996-97 |
1997-98 |
1998-99 |
1999-00 |
2000-01 |
| |
12 |
13 |
14 |
15 |
16 |
17 |
18 |
19 |
20 |
21 |
Number of companies |
1802 |
1802 |
1720 |
1720 |
1930 |
1930 |
1848 |
1848 |
1927 |
1927 |
A. Gross fixed assets |
49.1 |
53.3 |
53.3 |
43.0 |
56.5 |
65.8 |
69.2 |
59.3 |
53.4 |
48.9 |
B. Inventories |
14.6 |
17.0 |
4.5 |
12.5 |
14.3 |
4.7 |
5.5 |
1.3 |
10.3 |
11.7 |
C. Loans and advances and other debtor balances |
28.0 |
24.2 |
20.8 |
27.5 |
21.4 |
18.6 |
7.9 |
17.5 |
17.6 |
14.0 |
D. Investments |
3.2 |
1.2 |
15.1 |
15.1 |
3.9 |
8.0 |
8.6 |
8.6 |
25.5 |
24.0 |
E. Other assets |
0.9 |
1.2 |
1.3 |
0.8 |
1.5 |
2.4 |
0.4 |
6.5 |
2.0 |
5.7 |
F. Cash and bank balances |
4.2 |
3.2 |
5.1 |
1.2 |
2.4 |
0.5 |
8.4 |
6.7 |
-8.8 |
-4.3 |
TOTAL |
100.0 |
100.0 |
100.0 |
100.0 |
100.0 |
100.0 |
100.0 |
100.0 |
100.0 |
100.0 |
Uses of Funds |
2001-02 |
2002-03 |
2003-04 |
2004-05 |
2005-06 |
2006-0 |
|
|
|
|
| |
22 |
23 |
24 |
25 |
26 |
27 |
|
|
|
|
Number of companies |
2031 |
2031 |
2214 |
2214 |
3016 |
3016 |
|
|
|
|
A. Gross fixed assets |
62.5 |
45.1 |
34.9 |
40.2 |
39.4 |
37.4 |
|
|
|
|
B. Inventories |
-2.5 |
17.2 |
8.9 |
12.9 |
11.6 |
11.3 |
|
|
|
|
C. Loans and advances and |
|
|
|
|
|
|
|
|
|
|
other debtor balances |
15.3 |
10.7 |
12.0 |
21.6 |
23.7 |
25.3 |
|
|
|
|
D. Investments |
10.8 |
30.1 |
34.0 |
10.9 |
13.0 |
16.3 |
|
|
|
|
E. Other assets |
0.5 |
-4.2 |
1.8 |
0.4 |
0.7 |
2.2 |
|
|
|
|
F. Cash and bank balances |
13.3 |
1.0 |
8.4 |
13.9 |
11.7 |
7.5 |
|
|
|
|
TOTAL |
100.0 |
100.0 |
100.0 |
100.0 |
100.0 |
100.0 |
|
|
|
|
Source : Studies on ‘Finances of Private Corporate Sector’, Reserve Bank of India Bulletin, various issues. |
The HLC’s Observations
XI.a Going by a host of indicators, like credit-GDP ratio, M3-GDP ratio, and the flow of funds ratios, some degree of financial deepening has been taking place in the Indian economy. In absence of commensurate rise in financial savings, we need to accept that its effects are not being fully reflected in the estimates of household financial savings, contrary to the theoretical expectations. The HLC considered the possible reasons for the phenomenon of the financial deepening not being reflected in household financial savings.
XI.b In the case of household financial savings, the main issue is that the estimates of financial savings of the households are showing a decline over the recent years whereas the physical savings are showing an increasing trend. As mentioned earlier, the present dominance of physical savings over financial savings for the household sector can be explained keeping in view of the current economic developments like booming residential property market, increasing loan financing for housing, favourable demographic features of the economy, high salaries in sectors (like IT, finance and BPOs) with young skilled employees earning and having higher savings potentials and savers considering real Estate investment as a hedge against inflation. Secondly, non-residential component of physical assets, which have been presumably contributed by the unincorporated business enterprises are included in the household sector. The size of the unincorporated business enterprises is about 40 million at present.
XI.c As of the household financial savings, which is estimated net of household financial liabilities, the reason for a lower reflection of financial deepening on financial savings could be partly methodological, since household financial liabilities, which finance physical savings, are deducted from gross financial savings to arrive at the net financial savings. This apart, the following factors account for such a phenomenon:
-
It may be stated that the indicators of financial deepening suggest that India is still at a lower rung as compared with many comparable countries in South-East Asia and other regions. Relative use of currency continues to remain high; the process of disintermediation or the emergence of alternative financial savings instruments, alternative to bank deposits, has been very weak. Bank deposits as percentage of total household financial savings have jumped from 35.1 per cent in 1999-2000 to 55.6 per cent in 2006-07. In this sense, diversification has hardly taken place in the Indian financial system.
-
Increased preference for physical savings vis-à-vis financial savings among households in the recent years is due to a host of factors such as high returns, social safety net and tax incentives accruing to physical savings especially in housing. In addition, there was a significant rise in the import of gold and silver, which in terms of Rupees, increased almost six times to Rs.71,848.3 crore in 2007-08 from Rs.11,778.6 crore in 1997-98.
-
Within financial savings, over the years, while the postal savings attracted significant tax benefits, such benefits are accruing to bank deposits only recently.
-
Corporates have moved more, in favour of self-financing instruments in recent years. The commercial bonds market has not developed well, thus, emerging as constraint to financial deepening.
XI.d Financial deepening in the system increases range of options available to business enterprises for financing, which help reduce their cost of borrowing and hence improves profitability and savings. The HLC notes that cross-country empirical evidence indicates that a better financial system could stimulate private consumption by providing more credit and reduces the need for maintaining high savings levels and, hence, concludes that financial deepening lowers the household savings rate. Higher demand generated in this way results in more business activity for the private corporate sector and help pushing up corporates’ investments and savings. Progressively increasing savings rate of the private corporate sector in last few years is indicative of this phenomenon.
XI.e To sum up, despite the significant development in the structure of the financial markets and introduction of innovative financial products, the availability of array of instruments has essentially been limited when compared to developed countries with regard to their returns, liquidity and risk characteristics. In this regard, it may be mentioned that with the efforts of the RBI towards the financial inclusion and financial literacy, the impact of financial deepening is likely to better reflect in the estimates of household financial savings.
Chapter XII : A Review of the Empirical Methods and Procedures used in the Estimates based on Flow-of-Funds Method
XII.1 The Reserve Bank of India has been publishing the flow-of-funds accounts (FoF) since December 1964. The published flow-of-funds accounts covering the period 1951-52 to 2000-01 are available in the several issues of monthly Bulletins of the RBI.
XII.2 In the endevour for the compilation of FoF in India, Central Statistical Organisation (CSO) initiated preparatory work in 1956 along with the Reserve Bank of India (RBI). In 1959, Professor H. W. Arndt of the University of Australia carried out a study in consultation with CSO, Ministry of Finance and RBI, on FoF accounts. In his study, the economy was divided into four broad sectors, viz., Government, banks, rest of the world and residual. However, his analysis was confined to lending and borrowing only, since the main object of the accounts was to show as to how and in what forms domestic savings had become available to the Government for financing its expenditure.
XII.3 The FoF accounts in the modern sense represent a systematic record of net transactions involving financial instruments during a given period of time. In a monetised economy, all economic transactions involve exchange of financial claims among the participants. Keeping in view the similarities of economic activities, participants could be grouped into a few sectors. Similarly, the financial claims are amenable for grouping into a few instruments. Following the system of double entry book-keeping in financial accounting, the transactions between the participants could be treated in quadruple entry form (since the books of both participants are taken into account). This method not only enables the tracing of inter-sectoral funds flow but also ensures consistency and accuracy of capturing the transactions. The data are in flow form and pertain to a relevant period, usually a year or a quarter. As an analytical tool, FoF accounts enable the identification of individual sectors having overall financial surplus or deficits. The accounts facilitate the determination of the origin and causes of these surpluses and deficits. Owing to these features, an enquiry into the utilisation of surplus and the financing of deficit in each sector is possible. Besides bringing out such inter sectoral linkages, FoF accounts present a comprehensive picture of the economy in that they provide details of the pattern of financing of even capital stocks.
Flow of Funds as per UNSNA-1993
XII.4 The United Nations System of National Accounts (SNA) has a well established statistical framework for presenting the flow of funds (FoF) accounts. In fact, Dawson (1991) had shown the conceptual relation of FoF accounts to the SNA. FoF accounts can take the form of integrated capital and financial accounts or can cover only transactions in financial instruments. Accordingly, three variants of FoF accounts have emerged depending on the availability of data. They could be conceptualized as follows: (1) Basic FoF Accounts, (2) SNA Integrated Financial Accounts and (3) Detailed FoF Accounts. The Detailed FoF Accounts for the Indian economy are prepared by the Reserve Bank of India. The accounts of six sectors are presented for nine categories of financial instruments in two matrices, viz., (i) financial instruments by sector, and (ii) sector by sector. While the accounts are rich in content and prepared in line with the international standards, the widening and deepening of the Indian financial system in the wake of financial sector reforms in the 1990s have thrown up new challenges for the FoF compilers. Capturing the new financial instruments like zero coupon/deep discount bonds, warrants and financial derivatives continues to be a grey area in the absence of any authentic data source.
XII.5 The interrelationship between national income accounts and flow of funds accounts could be brought out as under:
S–I = ∆FA–∆FL
Where, S = savings, I = investment in physical assets or capital formation, ∆FA = financial uses or change in financial assets, and ∆FL = financial sources or changes in financial liabilities.
XII.6 For the economy as a whole, S (including foreign savings) should be equal to I. other things being equal, ∆FA should be equal to ∆FL. For individual sectors, S is greater than or less than I, and ∆FA is greater than or less than ∆FL, depending upon whether a sector is a net surplus or deficit one. In general, the private corporate and Government sectors are net deficit sectors, while households and the rest of the world sectors are net surplus sectors. In the above mentioned equality connecting the real and financial flows, the compilation of items on the right hand side is done by the RBI, while the work on the estimates on the left hand side is shared between RBI and CSO.
Household Sector
XII.7 The flow-of-funds method is used for estimating the household sector financial savings in India.
XII.8 All uncovered entities in the sectors like banking, other financial institutions, private corporate business, Government and rest of the world sectors are placed under this sector. There is no independent balance sheet or asset and liability accounts for the household sector. However, the sources and uses of funds accounts for this sector are prepared using the bench-mark ratios provided by the various surveys of financial instruments. Wherever such surveys are not available, they are derived as residual by netting the accounts of other organised sectors. The net uses of funds of the household sector, in effect, constitute the financial savings of the household sector.
XII.9 The instrument-wise methodology of FoF accounts for the household sector is presented in Table 12.1.
Table 12.1 : Methodology of FoF Accounts for the Household Sector |
Uses of Funds |
Methodology |
Accounts |
|
i) Currency |
On the basis of past trends of currency holding of the household and non-household sectors, 93 per cent of ‘currency with public’ issued in a financial year is treated as household contribution. |
ii) Commercial Bank Deposits |
Domestic bank deposits as on the last reporting Friday of March are obtained by excluding foreign currency and/or non-resident deposits from total bank deposits. These are classified as current, savings and fixed deposits based on relationship in RBI form X data. Household share in each category is estimated on the basis of RBI annual survey on ownership of deposits. |
iii) Deposits with |
i) Deposits with primary societies are treated as household deposits. |
Co-operative |
ii) For other credit societies and co-operative banks, household deposits are estimated based on |
Credit & Non- |
the ownership pattern of deposits, as obtained in additional returns by RBI. |
Credit Societies |
iii) Pending the availability of NABARD publication, deposits with co-operative banks and credit societies are estimated based on co-operative bank deposits, as available in RBI 42 return. |
| |
iv) Household deposits with non-credit societies are estimated similarly. |
iv) Deposits with Non-Banking Companies (NBCs) |
i) Household deposits with the NBCs excepting the electricity boards are directly obtained from the articles published in RBI Bulletin. |
|
ii) Household share in security deposits with State electricity boards is worked out on the basis of household share in electricity consumption. |
v) Trade Debt (Net) |
It is estimated as change of trade dues in respect of sundry creditors minus change in loans and advances to sundry debtors. |
vi) Shares and Debentures of Non- Government Companies. |
Household investment is calculated as a residual from the flow of funds accounts as follows.
First, a global estimate of shares and debentures is arrived at by blowing up the sample estimate of shares and debentures of public and private limited companies as per RBI surveys of company finances based on the ratio of sample paid-up capital (PUC) of public and private limited companies to global PUC as supplied by the Department of Company Affairs (DCA) of the Government of India. The estimates so arrived at are cross-checked with the primary market data. |
vii) Shares and Debentures of Co-operative Institutions |
Share capital of co-operative societies contributed by ‘individuals and others’ as obtained in NABARD publication is treated as household investment. |
viii) Mutual Funds |
i) Household investment in units of Unit trust of India Mutual Funds (UTIMF) is obtained by applying the proportion of household sector (i.e. adults/individuals, minors, Hindu-Undivided Family and trust/society) in total sales, net of repurchases, to the increase in unit capital during the year. |
| |
ii) Household investment in other mutual funds is obtained directly by RBI through a special return. In case required, household proportions worked out for the public sector mutual funds and UTIMF are made use of to arrive at the household investment in private mutual funds. |
ix) Claims on |
i) Investment in small savings out of provident fund contributions and deposit-linked insurance |
Government |
funds is subtracted from the receipts, net of disbursements, in the form of small savings to obtain household share. |
| |
ii) Household investment in Government securities is estimated by applying the proportion of securities purchased by household (as available in RBI survey on ownership of Government securities) on total sale of securities as per the budget documents of central and State Governments. |
x) Life Insurance |
i) Household savings with Life Insurance Corporation of India (LIC) is estimated as an increase |
Funds. |
in life fund of LIC and bonus to policy holders of India excluding Governmentshare in profit, capital gains and old claims. |
| |
ii) Household savings is estimated as the excess of receipts over payments for Postal Insurance and Life Annuity Fund, Central Government Employees Group Insurance Scheme and State Insurance Fund. |
xi) Provident and Pension Funds |
Household savings in provident fund (PF) is taken to be the contribution by both employees and employers (under contributory schemes) and by only employees (under non-contributory schemes) inclusive of interest and recovery of advances net of final withdrawals and advances. |
XII.10 The overall growth in the economy improved to 6.2 per cent during the period 1994-95 to 2000-01 from 4.4 per cent during the period 1990-91 to 1993-94. Increases in demand for the funds arose because of economic growth of a higher order. This growth was powered by rise in real investment rate to an average of 24.2 per cent from 21.9 per cent during this period. These changes need to be considered in the backdrop of reforms being implemented in several sectors of the economy during this period. With significant opening up of the capital account, particularly on inflows, there were sustained capital inflows since 1993-94. Household sector has remained a net surplus sector, financing the deficit sectors – like the public and the private corporate sectors. The sector wise FOF trends in financial flows are given in Table 12.2.
XII.11 The financing pattern followed by the corporate sector (mainly the non-Government non-financial public limited companies) shows four patterns: firstly, the reliance on internal sources (comprising bonus shares, reserves and surplus (mostly retained profits) and provisions (mainly depreciation) was on the rise during the period as compared to the external sources (comprising paid up capital (new capital issues including premium), borrowings (by way of debentures, loans and advances from financial intermediaries and public deposits) and trade dues). Secondly, the contribution of capital market instruments (paid-up capital, premium and debentures) in total sources of funds has attained higher importance during the period of analysis.
XII.12 Thirdly, in the buoyant capital market conditions, corporates substituted debt, especially borrowings from FIs, in favour of equity and vice versa. There is a welcome decline in the debt-equity ratio in the post-1991 period, notwithstanding the marginal reversal of trend in the recent years. Fourthly, an analysis by RBI on the performance of private corporate business sector in India during the period under review shows that the performance of the sector improved during the initial period of liberalisation, but could not be sustained in the latter half of the period (after 1995-96) in terms of profitability. However, the sector has shown improvements in better management practices (cost reduction, inventory management, etc.). Select Financial Ratios for India are shown in Table 12.3 and Chart 12.1.
Table 12.2: FoF Trends in India - Financial Flows by Sectors |
(Rs. crore) |
Sectors |
1994-95 |
1995-96 |
1996-97 |
1997-98 |
1998-99 |
1999-00 |
2000-01 |
1 |
2 |
3 |
4 |
5 |
6 |
7 |
8 |
1. Banking |
116217 |
73495 |
87585 |
140616 |
177055 |
154433 |
188495 |
| |
(28.3) |
(19.0) |
(21.5) |
(23.3) |
(27.5) |
(26.5) |
(24.2) |
2. Other Financial Institutions |
70458 |
66842 |
98054 |
100268 |
100443 |
119327 |
106270 |
| |
(17.2) |
(17.3) |
(24.0) |
(16.6) |
(15.6) |
(20.5) |
(13.6) |
3. All Financial Institutions |
186675 |
140337 |
185638 |
240884 |
277498 |
273759 |
294765 |
(1 + 2) |
(45.5) |
(36.3) |
(45.5) |
(40.0) |
(43.1) |
(47.1) |
(37.8) |
4. Private Corporate Business |
111876 |
136244 |
91633 |
106850 |
132745 |
79674 |
182126 |
| |
(27.3) |
(35.2) |
(22.5) |
(17.7) |
(20.6) |
(13.7) |
(23.4) |
5. Government |
71801 |
84985 |
83675 |
210145 |
189962 |
177612 |
220669 |
| |
(17.5) |
(22.0) |
(20.5) |
(34.9) |
(29.5) |
(30.5) |
(28.3) |
6. Rest of the World |
15064 |
6765 |
28849 |
19650 |
16986 |
14602 |
49888 |
| |
(3.7) |
(1.7) |
(7.1) |
(3.3) |
(2.6) |
(2.5) |
(6.4) |
7. Households |
24771 |
18620 |
18194 |
25365 |
27367 |
36067 |
31778 |
| |
(6.0) |
(4.8) |
(4.5) |
(4.2) |
(4.2) |
(6.2) |
(4.1) |
8. All Non-Financial |
223512 |
246614 |
222351 |
362009 |
367061 |
307956 |
484461 |
Institutions (4 to 7) |
(54.5) |
(63.7) |
(54.5) |
(60.0) |
(56.9) |
(52.9) |
(62.2) |
9. Total Claims Issued (3+8) |
410187 |
386951 |
407990 |
602893 |
644558 |
581715 |
779225 |
| |
(100.0) |
(100.0) |
(100.0) |
(100.0) |
(100.0) |
(100.0) |
(100.0) |
Note : i) Figures in brackets are percentages to total claims issued.
ii) Latest data for FoF pertains to 2000-01. |
Table 12.3 :Select Financial Ratios for India |
Year |
Finance Ratio |
Financial Interrelations Ratio |
New Issue Ratio |
Intermediation Ratio |
Year |
Finance Ratio |
Financial Interrelations Ratio |
New Issue Ratio |
Intermediation Ratio |
1 |
2 |
3 |
4 |
5 |
1 |
2 |
3 |
4 |
5 |
1951-52 |
0.015 |
0.109 |
0.179 |
-0.388 |
1976-77 |
0.14 |
1.745 |
0.981 |
0.779 |
1952-53 |
0.016 |
0.379 |
0.442 |
-0.144 |
1977-78 |
0.173 |
2.215 |
1.209 |
0.832 |
1953-54 |
0.026 |
0.831 |
0.565 |
0.47 |
1978-79 |
0.136 |
1.242 |
0.73 |
0.703 |
1954-55 |
0.039 |
1.127 |
0.635 |
0.775 |
1979-80 |
0.2 |
2.033 |
1.228 |
0.655 |
1955-56 |
0.074 |
1.218 |
0.738 |
0.651 |
1980-81 |
0.194 |
1.925 |
1.141 |
0.687 |
1956-57 |
0.049 |
0.675 |
0.398 |
0.695 |
1981-82 |
0.197 |
2.037 |
1.284 |
0.587 |
1957-58 |
0.064 |
0.998 |
0.61 |
0.638 |
1982-83 |
0.241 |
3.055 |
1.76 |
0.736 |
1958-59 |
0.067 |
1.325 |
0.82 |
0.615 |
1983-84 |
0.17 |
2.153 |
1.257 |
0.713 |
1959-60 |
0.085 |
1.475 |
0.955 |
0.544 |
1984-85 |
0.215 |
2.937 |
1.703 |
0.725 |
1960-61 |
0.084 |
0.92 |
0.746 |
0.234 |
1985-86 |
0.204 |
2.273 |
1.316 |
0.727 |
1961-62 |
0.077 |
1.261 |
0.835 |
0.511 |
1986-87 |
0.244 |
2.943 |
1.78 |
0.654 |
1962-63 |
0.089 |
1.164 |
0.809 |
0.439 |
1987-88 |
0.194 |
2.097 |
1.167 |
0.797 |
1963-64 |
0.095 |
1.292 |
0.88 |
0.468 |
1988-89 |
0.251 |
2.324 |
1.335 |
0.741 |
1964-65 |
0.078 |
1.125 |
0.736 |
0.529 |
1989-90 |
0.272 |
2.374 |
1.409 |
0.685 |
1965-66 |
0.107 |
1.276 |
0.87 |
0.467 |
1990-91 |
0.231 |
1.745 |
1.005 |
0.736 |
1966-67 |
0.101 |
1.08 |
0.73 |
0.48 |
1991-92 |
0.275 |
2.922 |
1.618 |
0.806 |
1967-68 |
0.089 |
1.212 |
0.841 |
0.442 |
1992-93 |
0.209 |
2.183 |
1.186 |
0.84 |
1968-69 |
0.073 |
1.376 |
0.84 |
0.638 |
1993-94 |
0.249 |
2.825 |
1.489 |
0.898 |
1969-70 |
0.076 |
1.139 |
0.722 |
0.578 |
1994-95 |
0.50 |
2.53 |
1.38 |
0.84 |
1970-71 |
0.097 |
1.381 |
0.832 |
0.66 |
1995-96 |
0.41 |
1.96 |
1.25 |
0.57 |
1971-72 |
0.095 |
1.323 |
0.772 |
0.713 |
1996-97 |
0.37 |
2.05 |
1.12 |
0.83 |
1972-73 |
0.1 |
1.742 |
0.955 |
0.824 |
1997-98 |
0.49 |
2.53 |
1.52 |
0.67 |
1973-74 |
0.076 |
1.074 |
0.525 |
1.045 |
1998-99 |
0.45 |
2.67 |
1.52 |
0.76 |
1974-75 |
0.11 |
1.373 |
0.855 |
0.606 |
1999-00 |
0.37 |
1.81 |
0.96 |
0.89 |
1975-76 |
0.139 |
1.853 |
1.06 |
0.748 |
2000-01 |
0.46 |
2.57 |
1.60 |
0.61 |
Note: i. Finance Ratio = Ratio of Total Issues to National Income.
ii. Financial Inter-relations Ratio = Ratio of Total Issues to Net Domestic Capital Formation. iii. New Issue Ratio = Ratio of Primary Issues to Net Domestic Capital Formation.
iv. Intermediation Ratio = Ratio of Secondary Issues (i.e., issues by banks and other financial institutions) to Primary Issues. |
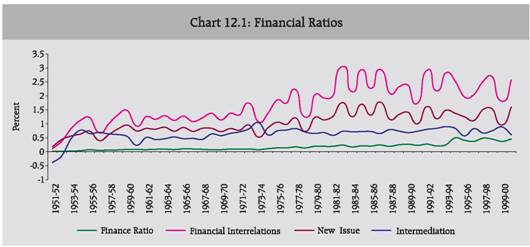
Interpretation of Latest FoF Trends in India
XII.13 The liberalisation of the Indian economy has seen the enhancement in growth performance and the impacts of these factors are exhibited in the flow- of-funds accounts. Select summary highlights of the following issues may be emphasised:
XII.14 Household sector continues to remain the net surplus sector providing finance to deficit sectors like the PCB and the Government sector during the period. The preferred instruments for households’ savings turned out to be small savings and contractual instruments, like insurance funds and provident and pension funds gradually replacing bank deposits. It may be mentioned that household financial assets during the period have shifted away from bank deposits to more market sensitive assets in most countries during the 1990s.
XII.15 The financial system in India – typically bank-based in combination with other financial institutions - was witnessing financial deepening achieved through financial liberalisation in turn broadening the institutions and instruments – have enabled intermediation of savings, predominantly by the household sector. In the process, it has improved investment opportunities, and diversified assets held by household and financial institutions. But the issue that comes to the fore is that this financial deepening is not associated with a significant rise in financial savings of the household sector, contrary to the expectation.
XII.16 The fiscal balance of the Government was under stress as reflected in the combined fiscal deficit of Centre and States, in turn, on account of additional commitments of Centre and States for meeting the obligations of the 5th Pay Commission ’s awards and high stock of accumulated Government debt which continued to cast its shadow on budget balance of the Government . The principal challenge, hence, is to reduce Government deficit and more broadly deficit of non-financial public sector in a way that is supportive of the efficiency aspects of the reform process.
XII.17 External flows, particularly non-debt creating flows, have assumed significance and there has been notable uptrend in foreign investment flows. The ‘rest of the world’ sector has started playing an increasingly important role in FoF – it is reflective of increasing integration of the Indian economy with the ‘rest of world’. To the extent that high level of real investment is financed by capital inflow from abroad (the other means being through higher domestic savings rate and private credit), this provided finance for the higher domestic capital formation during the period under consideration. The foreign claims flow by the banks becomes embedded in the intermediary process of the banking system.
XII.18 A profiling of the financial system, as seen through the select ratios, indicates that the financial liberalisation in the Indian economy during the period under review sustained the order of financial deepening reflecting a gradualist approach that the reforms adopted in the backdrop of East Asian crisis towards the later part of the 1990s. The upshot, thus, was the need for comprehensive reforms in the economy, with reforms encompassing the real and financial sectors of the economy.
Some Limitations of the FoF Accounts in India
XII.19 Due to the presence of diverse sources of data, the information content of FoF accounts in any country is subject to a number of limitations. In a situation of perfect information, the compiler would have the proper identification in linking the sectors issuing claims with the sectors holding these claims. In this context, the following three accounting identities would hold.
-
First, for any financial instrument, the aggregate sources of funds should theoretically be equal to its aggregate uses.
-
Secondly, for any particular sector, the excess of savings and net capital transfers over its physical investment should finance the excess of its financial uses over its financial sources.
-
Thirdly, the aggregation of all the financial sources across all the sectors should match with the total of all the financial uses.
XII.20 However, even in developed economies, in practice, in the actual FoF accounts, these accounting identities do not hold and three types of discrepancies arise. First, the mismatch between the total sources and total uses for each instrument appears as transaction discrepancy. Secondly, the divergence for a sector between ‘financial uses net of financial sources’ and the ‘excess of savings plus net capital transfers received net of capital formation’ is sector discrepancy. Thirdly, the financial deficits across some sectors do not cancel the financial surpluses across the rest of the sectors of the economy.
Major Issues to be considered in the Compilation of FoF
XII.21 Some of the issues regarding estimation methodology and absence of data base are listed below, which needs to be addressed in order to strengthen the robustness of flow-of-funds compilation in India. However, it may be noted that some of these issues have already been highlighted in the context of estimation of household financial savings:
-
The method of blowing up of sample data is used in the estimation of flow-of -fund compilation for the private corporate sector. For this purpose, the paid up capital is taken for blowing up the sample estimates to arrive at the estimates for the population. An inherent limitation of this procedure was that it implicitly assumed that the relationship of characteristics estimated in the selected companies and the population of all companies was in the same proportion as the paid-up capital of sample companies to the population. However, it is expected that with eventual availability of MCA-21 data base, the need for blowing up sample estimates will no more be required.
-
There is no systematic data source on the household sector savings in the form of deposit held in non-banking companies. This is mainly due to discontinuation of the survey on “Growth of Deposits with Non-banking Companies” since 1995-96, which puts constraints on a reliable estimation of household deposits with non-banking companies.
-
Similarly there is no systematic data source on the household sector savings in the form of shares and debentures. In order to get this information, the SEBI should provide information on a regular basis to RBI on areas like annual subscription to public issues of shares, debentures, mutual funds and commercial bonds (each separately and consolidated for all depositories) as per the ownership categories. The RBI will extract household investment in shares, debentures, mutual funds and commercial bonds for household financial savings estimation and that may also be used for the flow-of-funds compilation.
-
There is a prolonged gap in the availability of data on assets and liabilities of the cooperative sector for credit as well as non-credit societies. In the light of genuine difficulties expressed by NABARD in regularly compiling the cooperative data, the FoF compilation may have to depend on “projections” from NABARD in these regards, which could be revised when firm data are available.
-
Up-to-date survey is not available for the ownership pattern of Government securities with the latest such survey being available is for 1995-96.
-
Similarly for ownership of Capital of Joint Stock Companies, the latest survey available is for end-March 1995.
XII.22 The above data limitations in the form of lack of availability of updated surveys and prolonged data gap in respect of some of the critical sectors lead to delay in the FoF compilation. It needs to be recognised that the delay with which FoF accounts are compiled are intricately linked to the backlog with which detailed sectoral accounts are available especially in respect of cooperative sector from the NABARD. Secondly, while the FoF rates and ratios are used in financial savings estimation, the compilation uses the latest available ratios for deposit, credit, mutual funds, etc. The importance of frequent revalidation of some of these ratios in the light of latest data availability need not be re-emphasised. To the extent that FoF remains the analytical basis for financial savings estimation, it needs to be seen whether the backlog in its compilation be cleared through sustained efforts. It is expected that apex bodies ’ involvement with regard to certain data requirements will help in this effort.
Analytical Presentation of FoF
XII.23 There is a scope for taking a second look at some of selected financial ratios worked out and presented in the study. First, macroeconomic aggregates appropriate for relating the stock or flow of financial assets (liabilities) should be in gross from - gross national product or gross capital formation. Likewise, the GNP or GCF should be at market prices. This is obvious because all financial flows (stock) embody market values and, hence, their counterparts of real infrastructure should be at current prices. Raymond W Goldsmith, 1969 ‘Financial Structure and Development, Yale University Press’ has related the financial ratio to total GNP at current market prices.
XII.24 The inter-dependence between sectors amongst financial institutions is measured by the layering ratio - a concept fairly known in literature. Layers of financial transactions that are taking place within the financial system are captured by this concept. It may also measure the degree of diversification occurring in the financial structure. A layering ratio may, thus, be worked out and presented.
Recommendations
XII.a Cooperative sector data: All efforts should be undertaken to improve the time gap in the publication ‘Statistical Statements Relating to the Co-operative Movement in India (Credit and Non-credit societies)’, a process that is said to be underway at the NABARD.
XII.b In the light of genuine difficulties expressed by NABARD in regularly compiling the comprehensive data, NABARD may endeavour undertaking “projections”, which could be revised when firm data become available. The data issues need to engage the attention of the highest level in NABARD. In this context, the HLC recommends that NABARD should be involved in providing a projection of household deposits in co-operative banks and credit societies to get around the problem of considerable time-lag in the publication such as ‘Statistical Statements Relating to the Co-operative Movement in India (Credit and Non-credit societies)’.
XII.c NABARD should continue in its role as the nodal agency for the co-operative sector and provide data for the compilation of national accounts, savings estimates and FoF accounts in so far as the cooperative sector is concerned (Annexes A6.5.3 and A6.5.4). In this regard, NABARD may collaborate with National Federation of State Co-operative Banks (NAFSCOB), National Cooperative Union of India (NCUI) as these agencies are publishing some basic data on credit and non-credit societies.
(Action: NABARD)
XII.d Treatment of non-banking companies: Since there exists large data gap in the estimation of non-banking companies, because of non-inclusion of a wide array of unregistered companies, the HLC recommends that a census should collect data on assets, liabilities, income and expenditure of NBFCs including the unregistered/exempted category of NBFCs. The census should be conducted by DSIM, RBI in collaboration with the Department of Company Affairs, Government of India.
(Action: DCA, GOI and RBI)
XII.e The HLC recommends that the data emerging from the census on the assets/ liabilities position of the NBFCs should be appropriately incorporated in the flow-of-funds accounts also.
XII.f In respect of companies registered with the RBI, data for registered companies have to be firmed up with appropriate consolidation and follow up if response is weak. For the unregistered companies, sample studies will have to be undertaken and their results will have to be used after establishing proper blow-up factors.
XII.g Consolidated data on the insurance sector: The RBI may approach the IRDA to provide combined balance sheet for all insurance institutions – public and private - as per the flow-of-funds format. This will go a long way in the IRDA providing an alternative database not only for ‘life fund’ but also for flow-of-funds compilation at the RBI from time to time (A6.5.6).
XII.h Consolidated data for capital market institutions: The SEBI may collect the consolidated balance sheet position for all registrars and broker houses and provide the data to the RBI as per the flow-of-funds format (Annex A6.5.2) to be forwarded by the RBI, so that the same can be incorporated in the FoF accounts.
XII.i The HLC recommends that the consolidated Statements of assets/liabilities of all capital market institutions (namely, merchant bankers and registered brokers) should be compiled by the SEBI or have them compiled and forwarded to RBI for compilation of flow-of-funds account of the Indian economy.
(Action: SEBI)
XII.j Ownership of Government securities: The HLC recommends that an appropriate format as prescribed in this Report on the ownership pattern of Government securities (consolidated for all levels of Government), comprising six categories, viz., 1) Government , 2) Banks, 3) Financial Sector other than Banks, 4) Non-Service Sector (Corporates, Firms and Societies), 5) External Sector and 6) Household Sector, may be prepared by the RBI to provide the data based on the revised format (Annex A6.6) as at end-March every year, so that the residual status can be accorded to household (as defined in national accounts and FoF framework) in this instrument. The concerned Department within the RBI should ensure the providing of such information for estimation of household financial savings estimates.
(Action: RBI)
XII.k In respect of the accounts of local authorities, only the data for port trusts are available. In this regard, the data for the local self Government may also be provided to enhance the coverage of flow-of- funds accounts.
(Action: CSO)
XII.25 To sum up, it may be mentioned that India is one among the few countries which compiles the detailed flow-of-funds account. The recent updation of flow-of-funds account pertaining to the period 1994-95 to 2000-01 provide us an opportunity to understand how this change of emphasis has influenced financial interrelationships in the economy. India has one of the detailed FoF in the world. However, there is an imperative need to reduce the inordinate delay in compiling and publishing the FoF accounts. Effort to improve the timely availability of detailed sectoral data would go a long way in streamlining the FoF compilation. The compiling agency and the relevant data supplying institutions should have better coordination in cutting the delay and compilation of the FoF accounts.
Chapter XIII : Farm Sector Savings in Relation to Investment
Importance of Farm Sector Savings
XIII.1 The process of increasing and sustaining a nation’s economic growth hinges critically on the generation of greater savings and its channelisation into productive investment. For attaining growth objectives and ushering in self-reliance, mobilisation of domestic resources from the various sectors of the economy and their efficient utilisation is vital for a developing country like India. A high level of savings helps the economy to progress on a continuous growth path since investment is mainly financed out of savings. It is not generally possible to observe countries with sustained high rates of economic growth without the accompanying trend of high rates of domestic savings.
XIII.2 Indian agriculture, being a predominant sector in terms of dependent population, forms a critical edifice of the strategy for overall development of the economy. Notwithstanding the decline in its share in the overall GDP (from over 24 per cent in 2000-01 to around 19 per cent in 2007-08), agriculture continues to be the main source of livelihood for about two-thirds of country’s population. It generates employment for around over 50.0 per cent of country’s workforce and forms the single largest occupation in the private sector in the country. Besides, it accounts for about 16.0 per cent of the country’s exports. Therefore, savings generated in the farm sector-a vital segment of the Indian economy cannot be overlooked. As agriculture holds an important key in elevating a country’s growth trajectory and the overall upliftment and prosperity of a nation, there is a need to examine the savings generated in relation to the investment that occurs in the farm sector.
XIII.3 Within the agricultural sector, the degree of progress attained largely depends upon how the farmers deploy the additional incomes generated from year to year from their farm activities. This stems from the fact that the growth rate in the farming economy largely depends on the stock of capital built by the farming community and the ploughing back of such stocks in the form of savings for further improvement of farm activity. If these increments are spent on household expenditure, without building up the necessary infrastructure, the future economic development of the nation will be hampered.
Nature and Constraints of Estimating Farm Sector Savings
XIII.4 Studies on farm sector savings, notwithstanding their importance, are conspicuous by their absence in the literature. Since agriculture falls under the unorganised sector, and unorganised activities are not documented properly, it is difficult to find the regular account of income, expenditure and savings of farmers. Moreover, farmers in addition to their farm cultivation undertake several supplementary activities such as animal husbandry, fishing, poultry, small scale-businesses, etc. As there are multiple sources of income, it is difficult to capture the extent of income, related expenditure and resultant savings from such activities. Besides, there is uncertainty involved in the flow of income from agriculture as it is subject to the vicissitudes of monsoon, fluctuations in the yield levels and the market prices. Given such a nature of farming activity, it is plausible to conceive that farm sector savings are uncertain, volatile and difficult to quantify.
XIII.5 Given the vast size of our economy, where a substantial portion of area remains unbanked, it is difficult to estimate the savings of the entire farm sector from the bank accounts as not all the farmers hold or maintain accounts with the banking sector. As the SHG momentum spreads across all the parts of the country, it could be possible to segregate the savings of farmers who are the members of such micro-finance activities. However, to arrive at an estimate of farm sector savings, a national sample survey remains the only option as of now.
Savings in the Farm Sector
NSSO Surveys
XIII.6 Although no specific attempt to capture the farm sector savings was made earlier, to assess the well-being of farmer households, study their access to various resources, and judge the impact of technological change on Indian farming, the Ministry of Agriculture, Government of India, decided that a Situation Assessment Survey (SAS) of farmers should be conducted at the beginning of the third millennium. The survey was accordingly carried out during 2003 in the rural areas by the National Sample Survey Organisation (NSSO), Ministry of Statistics and Programme Implementation, Government of India. Data for the survey were collected from 51,770 households spread over 6,638 villages across the country.
XIII.7 It dealt with different dimensions of the level of income, expenditure and investments by the farmer households for farm and non-farm business. It covered farm business including orchards and plantation, and farming of animals such as dairy, rearing of sheep and goats, piggery, poultry, duckery, fishery, bee-keeping, etc. The Survey Report brought out the average number of productive assets of different kinds possessed by per farmer household in respect of farm and non-farm business, separately for households in different size classes of land possessed, as well as in different classes of monthly per capita consumer expenditure.
XIII.8 It further presents average monthly expenditure incurred by farmer households on productive assets for farm and non-farm business and also average monthly expenses for and receipts from cultivation and farming of animals per farmer household. It also shows the average income from different sources as well as, consumption expenditure and net investment in productive assets per farmer household. This Survey Report was the fifth10 and the last of a series of five reports planned to be brought out on the basis of the Situation Assessment Survey of Farmers.
XIII.9 From Table 13.1 it can be derived that the share of wages in the total of income from the four sources was 39 per cent for farmers in rural India as a whole but was, reportedly, as high as 62 per cent in Rajasthan, 53-54 per cent in Orissa, and Tamil Nadu, 50 per cent in Kerala and 43 per cent in West Bengal. In all other States, income from cultivation exceeded wage income in farmer households.
XIII.10 Table 13.2 gives average monthly household consumption expenditure for farmer households as well as all households in rural areas in each of the major States, as derived from the consumer expenditure survey of NSS 59th round, carried out concurrently with the Situation Assessment Survey of farmers. It is observed that there is little difference in average household consumption expenditures between farmer households and all rural households. At the all-India level, the two averages, observed from two independent samples, happened to be the same. At State level, farmer households in Punjab, Haryana and Rajasthan appear to be somewhat better off than non-farmers, while they appear to be slightly worse off than others in Jharkhand, Maharashtra and Orissa. For other States the difference is only marginal.
Table 13.1: Average Monthly Income (excluding rent, interest, dividend etc.) Per Farmer Household during the Agricultural Year 2002-03 |
State |
Average monthly income (Rs.) per farmer household from |
wages |
cultivation |
farming of animals |
non-farm business |
total |
1 |
2 |
3 |
4 |
5 |
6 |
Andhra Pradesh |
643 |
743 |
93 |
155 |
1634 |
Assam |
973 |
1792 |
141 |
255 |
3161 |
Bihar |
497 |
846 |
265 |
202 |
1810 |
Chhattisgarh |
709 |
811 |
-3 |
101 |
1618 |
Gujarat |
925 |
1164 |
455 |
140 |
2684 |
Harayana |
1268 |
1494 |
-236 |
356 |
2882 |
Jammu & Kashmir |
2060 |
2426 |
382 |
620 |
5488 |
Jharkhand |
924 |
852 |
86 |
207 |
2069 |
Karnataka |
1051 |
1266 |
131 |
168 |
2616 |
Kerala |
2013 |
1120 |
154 |
717 |
4004 |
Madhya Pradesh |
560 |
996 |
-227 |
101 |
1430 |
Maharashtra |
799 |
1263 |
144 |
257 |
2463 |
Orissa |
573 |
336 |
16 |
137 |
1062 |
Punjab |
1462 |
2822 |
236 |
440 |
4960 |
Rajasthan |
931 |
359 |
5 |
203 |
1498 |
Tamil Nadu |
1105 |
659 |
110 |
198 |
2072 |
Uttar Pradesh |
559 |
836 |
53 |
185 |
1633 |
West Bengal |
887 |
737 |
77 |
378 |
2079 |
All India |
819 |
969 |
91 |
236 |
2115 |
Source : Situation Assessment Survey (SAS) of Farmers (2003), NSSO, 2005 |
10The first four reports dealt with Indebtedness of Farmer Households; Access to Modern Technology for Farming; Some Aspects of Farming; and Consumption Expenditure of Farmer Households.
Table 13.2: Average Monthly Household Consumption Expenditure for Farmer and All Rural Households during the Agricultural Year July 2002 to June 2003. |
(in Rs) |
State |
Average Monthly Consumption Exp. |
State |
Average Monthly Consumption Exp. |
Farmer hhs |
All hhs |
Farmer hhs |
All hhs |
1 |
2 |
3 |
4 |
5 |
6 |
Andhra Pradesh |
2386 |
2325 |
Madhya Pradesh |
2339 |
2457 |
Assam |
2714 |
2704 |
Maharashtra |
2689 |
2803 |
Bihar |
2459 |
2407 |
Orissa |
1697 |
1831 |
Chhattisgarh |
2045 |
2084 |
Punjab |
4840 |
4696 |
Gujarat |
3127 |
3255 |
Rajasthan |
3288 |
3078 |
Haryana |
4414 |
4217 |
Tamil Nadu |
2506 |
2436 |
Jammu & Kashmir |
4109 |
4492 |
Uttar Pradesh |
2899 |
2952 |
Jharkhand |
1897 |
2110 |
West Bengal |
2668 |
2690 |
Karnataka |
2608 |
2724 |
|
|
|
Kerala |
4250 |
4316 |
All India |
2770 |
2770 |
Source : Situation Assessment Survey (SAS) of Farmers (2003), NSSO. |
XIII.11 The All-India Debt and Investment Survey (AIDIS), which was carried out as part of the 59th round of the National Sample Survey (NSS) during the period January to December 2003, was the sixth such survey conducted at the all-India level. Accordingly, the distribution of total household debts between the two broad categories of households in the rural sector, namely cultivators and non-cultivators revealed that as high as 73 per cent of the total debt (amounting to Rs.111,468 crores), in 2002, was accounted for by the cultivator households. The average amount of cash loan per cultivator household was Rs.9261. Among the States, Kerala, followed by Punjab, Haryana and Andhra Pradesh accounted for the highest amount of cash loan per cultivator household (Table 13.3).
Estimation of Savings in the Farm Sector
XIII.12 Presently no data is available on the income and consumption expenditure of farm households on regular basis. However, taking into account the monthly average income and monthly consumption expenditure of farm households as reported by the Situation Assessment Survey (SAS) of Farmers (July 2002 to June, 2003) of NSSO, an attempt is made to estimate the savings of farm sector during 2002-03.
XIII.13 Going by the Keynesian concept, viz., S = Y-C (Consumption Expenditure), the average monthly savings of per farmer household have turned out be negative (Rs.655), implying that there are dis-savings in the farm sector. Accordingly, the estimated annual savings of all cultivator households during 2002-03 have been found negative at Rs.69,348 crore. Resultantly, the ratio of farm sector savings to overall GDP is estimated at - 2.8 per cent for the year 2002-03. Conversely, the ratio of GCF in agriculture to overall GDP during that year stands at 2.1 per cent (Table 13.4).
XIII.14 Taking into account the indebtedness of cultivator households from the All India Debt and Investment Survey (2003), NSSO, the proportion of cash loans as proportion of overall GDP turns out to be 3.3 per cent during 2002-03. Interestingly, this ratio is quite close to the amount of dis-savings, indicating thereby that, the gap between income and consumption expenditure is financed by borrowings.
XIII.15 Alternatively, one can estimate the income of agricultural households as sum of GDP from agriculture and allied activities and subsidiary incomes of agricultural households (by imputing incomes for the subsidiary status workers engaged in non-farm activities), and consumption expenditure of agricultural households from the NSS consumer expenditure surveys, to arrive at an indicative and approximate estimate of savings in the farm households.
Table 13.3: No. of Cultivator Households Reporting Cash Loans Outstanding and Average Amount of Cash Loans per Cultivator Household (as on June 30, 2002). |
State |
No. of Households |
No. of Sample Household Reporting Cash Loan |
Average Amount of Cash Loan Per Household (Rs.) |
Estimated (00) |
Sample |
1 |
2 |
3 |
4 |
5 |
Andhra Pradesh |
61186 |
2714 |
1278 |
16154 |
Assam |
26132 |
2386 |
408 |
641 |
Bihar |
70639 |
4038 |
1518 |
3336 |
Chattisgarh |
27358 |
1353 |
458 |
4833 |
Gujarat |
35252 |
1416 |
563 |
12958 |
Haryana |
18532 |
1013 |
402 |
17340 |
Himachal |
9007 |
1574 |
532 |
5843 |
Jammu & Kashmir |
9230 |
1338 |
175 |
1198 |
Jharkhand |
28041 |
1690 |
482 |
1021 |
Karnataka |
40147 |
2143 |
826 |
13422 |
Kerala |
24771 |
1645 |
669 |
27641 |
Madhya Pradesh |
62164 |
2941 |
1203 |
12246 |
Maharashtra |
64989 |
3361 |
1509 |
14268 |
Orissa |
42698 |
2105 |
844 |
3976 |
Punjab |
16040 |
1105 |
343 |
25211 |
Rajasthan |
52393 |
3019 |
1261 |
13261 |
Tamil Nadu |
38381 |
2189 |
805 |
14823 |
Uttaranchal |
8851 |
516 |
87 |
693 |
Uttar Pradesh |
165973 |
8143 |
2838 |
5363 |
West Bengal |
68836 |
3742 |
1285 |
3820 |
India |
882296 |
54195 |
18387 |
9261 |
Source : All India Debt and Investment Survey (2002) NSSO. |
Table 13.4: Estimation of Savings in the Farm Sector (2002-03) |
Item |
(Amount in Rs.) |
1 |
2 |
1 |
Sample Households (Number) |
51,770 |
2 |
Average monthly income per farmer household |
2,115 |
3 |
Average monthly consumption expenditure per farmer household |
2,770 |
4 |
Average savings per farmer household |
-655 |
5 |
Average amount of cash loan per cultivator household |
9261 |
| |
(Amount in Rs. crore) |
6 |
Estimated No. total cultivator households (Number) |
8,82,29,600 |
7 |
Total monthly income of cultivator households |
18661 |
8 |
Total monthly consumption expenditure of cultivator households |
24440 |
9 |
Total monthly savings of all cultivator households |
-5779 |
10 |
Total annual savings of all cultivator households |
-69348 |
11 |
Total amount of cash loan of all cultivator households |
81709 |
| |
(Amount in Rs. crore) |
12 |
Overall GDP at current market prices |
2454561 |
13 |
Agriculture GDP |
425521 |
14 |
GCF in agriculture |
52123 |
| |
(In per cent) |
15 |
GCF in agriculture as a proportion of overall GDP |
2.1 |
16 |
Agriculture savings as a proportion of overall GDP |
-2.8 |
17 |
GCF in agriculture as a proportion of agriculture GDP |
12.2 |
18 |
Agriculture savings as a proportion of agriculture GDP |
-16.3 |
19 |
Total amount of cash loans as a proportion of overall GDP |
3.3 |
20 |
Total amount of cash loans as a proportion of GDP in agriculture |
19.2 |
Source : Compiled based on data from Situation Assessment Survey (SAS) of Farmers and All India Debt and Investment Survey (2003), NSSO. |
XIII.16 Thus, the foregoing analysis reveals that there is wide gap between the amount of savings and investment in the farm sector. Given the imperative need for enhancing the level of investment in the farm sector (as could be seen in the subsequent section), concerted efforts have to be made for generation and mobilisation of savings in order to realise the desired growth potential of the agriculture sector.
National Sample Survey could be an Option
XIII.17 Similar such survey needs to be conducted on regular basis to gather data on the farm sector savings. Given the importance of farm sector in the country’s development and extent of population that is dependent on the sector, the savings of this sector can’t be ignored. Therefore, Survey Design and Research Division of NSSO may evolve survey methodology for carrying out the necessary Survey work. Such Surveys need to be commenced at regular intervals till the time that our banking sector is able to capture the savings of all the segments of farm sector.
Farm Sector Investment
Nature and Criticality of Investment in the Farm Sector
XIII.18 The investments in any sector generate capital in the form of infrastructure, improvement in the quality of natural resources and assets, and creation of productive assets. The importance of capital in economic development is well recognised and documented. Several studies have found investment as the single most important factor in the growth process (Lewis, 1955; Rostow, 1960). Given the importance of investment in economic growth, there has been a considerable interest in the factors affecting investment during different periods and stages of development. While public investment is determined largely as a matter of policy and by the availability of funds, private investment is affected by a variety of factors, which differ over time and space.
XIII.19 Investment in agriculture has two components viz., the (1) Gross Fixed Capital Formation (GFCF), which includes primarily the investment in physical assets in agriculture, and (2) change in stocks which are presently in the form of inventories but which are not actually used for further production, although they could be used. The two components taken together constitute the Gross Capital Formation (GCF). The relative shares of the two components viz. GFCF and GCF indicate that investment in agriculture is predominantly in the form of physical assets and that stocks (which include livestock) are relatively less important. Investment in agriculture is generally undertaken for realising the long-term potential by (i) augmenting natural resources, (ii) enhancing efficiency of use of existing resources and (iii) generating value addition. Thus, in simple terms, investment means acquiring physical assets that result in the creation of a stream of incremental income over a period of time. Capital formation through investment in agriculture helps in improving the stock of equipment, tools and productivity of natural resources, which in turn enables the farmers to use their resources, particularly land and labour, more productively. Creation of capital goods, thus, is necessary for raising productivity of existing resources and realising the long-term growth potential.
XIII.20 The relationship between capital formation and agricultural growth, and agricultural growth and poverty alleviation are very well articulated in literature. Given the positive impact of agricultural growth on poverty alleviation, the role of capital formation as one of the major engines of agricultural growth has been well placed in the development policy perspective. There are some major streams of research on capital formation that have sharpened this role in the development policy perspective (FAO 2004).
XIII.21 Public investment reduces rural poverty through improved growth in agricultural production, agribusiness development, rural non-farm employment and lower food prices. While there are often long time lags between investment and visible impact, investments in agricultural research, education, and rural infrastructure are often the most effective in promoting agricultural growth and poverty reduction. Regional analysis within India also suggests that public investment in less-favored areas not only offers the largest poverty reduction per unit of spending but also leads to the highest economic returns (Fan, Zhang, and Zhang, 2002).
Public vis-a-vis Private Investment in the Farm Sector
XIII.22 Investment in agriculture is made by public as well as by private sectors. While public sector investment in agriculture is made for building necessary infrastructure, private investment in agriculture is either for augmenting productivity of natural resources or for undertaking such activities, which supplement income sources of farmers. Private sector investment includes investments made by private corporates and households. The corporate sector investment includes investment by organised corporate bodies like big private companies and unorganised entities like sugar cooperatives and milk cooperatives. The household sector investment comprises investment on farm equipments, machinery, irrigation, land improvement and land reclamation. With about 90.0 per cent share, households dominate the private investment activity. These investments enable farmers to grow existing crops more productively and intensively and take up non-conventional/high value crops.
Trends in Farm Sector Investment
XIII.23 As outlined above investment remains one of the key determinants of agricultural growth. The data on investment in farm sector are available from the National Accounts Statistics. The analytics of investment trends in agriculture over a span of last five decades brings out following points.
•
Over the years, investment in agriculture has been losing its share in total investment, more rapidly in the 1990s (7.9 per cent) and between 2000-01 to 2005-06 (7.4 per cent). The decline is significant when compared with the share that prevailed during 1980s and 1970s (11.4 and 15.3 per cent, respectively) (Table 13.5).
•
Following the above trend, the share of public sector in the total investment in agriculture has declined, more pronouncedly in 1990s, as compared to the 1980s.
Table 13.5: Trends in Investment in Agriculture and the Economy |
(Amount in Rs. Crore) |
Decade |
Average Annual Investment in Agriculture |
Share of Agriculture in Total Investment(%) |
Public |
Private |
Total |
1 |
2 |
3 |
4 |
5 |
1950s |
NA |
NA |
4,370 |
17.9 |
1960s |
2,904 |
3,929 |
6,833 |
13.9 |
1970s |
4,851 |
7,297 |
12,149 |
15.3 |
1980s |
6,443 |
7,840 |
14,283 |
11.4 |
1990s |
4,837 |
12,299 |
17,136 |
7.9 |
2000-2006 |
5,237 |
17,184 |
22,387 |
7.4 |
Source : Computed from National Accounts Statistics and Agricultural Statistics at a Glance, Ministry of Agriculture, GoI. |
This indicates that the preeminence of the public sector in investment in agriculture has declined, highlighting increasing importance of the private sector in agriculture.
•
The loss in momentum in public sector investment in agriculture is more clearly noticed when it is juxtaposed with the public sector investment in the economy. Private sector investment in agriculture also showed a similar trend over the years. It could, therefore, be inferred that the decline in investment in agriculture is due to relatively lower shares of both public and private sector investments in agriculture compared to their shares in total investment in the economy.
•
During the current decade, there was some revival in the share of agriculture in total GCF during 2001-02 (10.2 per cent), but has been declining gradually since then to reach at 5.8 per cent in 2006-07.
•
Ratio of GCF to GDP (Table 13.6) is an important measure for assessment of investment efficiency in a given sector. Contrary to the above trends, the ratio of GCF to GDP originating in agriculture improved gradually from 9.6 per cent in 2000-01 to 12.5 per cent in 2006-07. This, however, needs to be raised to 16 per cent during the Eleventh Five Year Plan to achieve the target growth of 4 per cent in this sector (Economic Survey, 2007-08).
Table 13.6 Gross Capital Formation in Agriculture |
(Rs. crore) |
(at current prices) |
Year |
GCF Total |
GCF in agriculture |
Share of agriculture
in total GCF (%) |
GDP agriculture |
GCF/GDP in
agriculture (%) |
1 |
2 |
3 |
4 |
5 |
6 |
1999-00 |
506244 |
43473 |
8.6 |
409660 |
10.6 |
2000-01 |
511788 |
40048 |
7.8 |
408932 |
9.8 |
2001-02 |
520655 |
52009 |
10.0 |
442464 |
11.8 |
2002-03 |
619485 |
52123 |
8.4 |
425521 |
12.2 |
2003-04 |
775647 |
51570 |
6.6 |
483030 |
10.7 |
2004-05 |
1013761 |
61173 |
6.0 |
501415 |
12.2 |
2005-06 |
1271953 |
72013 |
5.7 |
557118 |
12.9 |
2006-07 |
1487786 |
83421 |
5.6 |
634519 |
13.1 |
(at 1999-2000 prices) |
1999-2000 |
506244 |
43473 |
8.6 |
409660 |
10.6 |
2000-01 |
488658 |
39027 |
8.0 |
407176 |
9.6 |
2001-02 |
474448 |
48215 |
10.2 |
433475 |
11.1 |
2002-03 |
555287 |
46823 |
8.4 |
398206 |
11.8 |
2003-04 |
665625 |
44833 |
6.7 |
441360 |
10.2 |
2004-05 |
795642 |
49108 |
6.2 |
441183 |
11.1 |
2005-06 |
950102 |
54905 |
5.8 |
468013 |
11.7 |
2006-07 |
1053323 |
60762 |
5.8 |
485937 |
12.5 |
Sources : CSO and Economic Survey, 2007-08 |
XIII.24 Declining investment overtime has emerged as one of the binding constraints on the performance of agriculture and has been a major cause of concern. Inadequacy of new capital formation has slowed the pace and pattern of technological change and the infrastructural development with adverse effects on agricultural productivity. Investment in agriculture, the prime mover, therefore, needs to be accelerated to achieve the desired rate of growth. More importantly, this investment needs to be appropriately structured, timed and well implemented to have the maximum impact.
HLC’s Observation
XIII.a Presently, there are no estimates of farm sector savings undertaken in the country. Although it is difficult to arrive at savings estimates of the farm sector given the unorganised and uncertain nature of the sector, such estimates could be had by conducting national level sample surveys by the NSSO at regular intervals. Given the importance of this sector in the country’s economic growth, the savings estimates of this sector can’t be overlooked. The estimation of savings based on the NSSO Surveys during 2002-03 reveals that there are dis-savings in the farm sector. Resultantly, the gap between the amount of savings and investment in the farm sector appears to be wide. Given the imperative need of enhancing the level of investment in the farm sector, concerted efforts have to be made for generation and mobilisation of savings in order to realise the desired growth potential of the agriculture sector. The trends in the farm sector investment reveal that agriculture is losing its share in the total investment particularly more rapidly during the decade of 1990s and onwards led mainly by the loss in the momentum of public sector. Even though the GCF to agricultural GDP ratio has revived in the recent period, it remains below the desired level and, hence, need to be improved substantially to achieve the desired trajectory of farm sector growth.
Chapter XIV : Separate Savings Estimates for Pure Households, Household Enterprises and Unincorporated Bodies
XIV.1 The HLC considered the issue of arriving at separate savings estimates for pure households, household enterprises and unincorporated bodies. Presently, there is no system in place to provide disaggregated household savings. The only way forward is to develop alternative data base including surveys and requesting apex financial bodies to provide the disaggregated information regularly to the compilers.
Constituents of Household Sector in Savings Estimation
XIV.2 The need for estimating savings of various constituents of the household sector separately, particularly with regard to ‘pure households’ was considered by the HLC. In this connection, it may be mentioned that presently, as per the national accounts of India, household sector has a much wider coverage, as it comprises all the sectors other than private corporate and public sectors. The household sector is ‘unorganised’, which includes conceptually not only farm households engaged in agricultural production, but all unincorporated enterprises engaged in industry, trade, transport and finance, private charitable trusts, as also households that are not directly involved at all in production. In other words, the household sector comprises, apart from individuals, all non-Government, non-corporate enterprises like sole proprietorships and partnerships owned and/or controlled by individuals and non-profit institutions which furnish educational, health, cultural, recreational and other social and community services to households. Therefore, information is presently not available for the constituents of the household sector.
Residual Treatment to Households
XIV.3 As per the present methodology, for savings and investment estimation, the economy is divided into three broad sectors: the public sector, the private corporate sector and the household sector. While the former two are organised sectors for which data are available in respect of their savings and investment estimates, the estimates of savings and investment of this heterogeneous and unorganised segments of the economy covered by the household sector are taken essentially in the nature of residuals derived by deducting the savings and investment estimates for the organised sectors, namely, the public and the private corporate sectors from the estimates for the total economy.
XIV.4 For the household sector, savings is taken as the sum of its investments in various instruments of financial savings and in the form of physical assets. Since direct annual data on household income expenditure of households are not available, the savings of the household sector is worked out by following the residual method. It may be mentioned that flow-of-funds method and commodity flow method form the basis of estimation of financial and physical savings for the household sector, where the sector is treated to be a residual sector.
XIV.5 In view of the above treatment of the household sector, and given the two methodologies adopted presently, it is not possible to go for further disaggregation of the household sector. It may be mentioned that the issue has been a point of discussion in the earlier Committees, where it has been recognised that any attempt to achieve further disaggregation of the household sector to ‘pure households’ would need to have an alternative method to estimate savings of the various constituents of the household sector separately. One possible candidate for such an alternative methods would be to devise new surveys. In addition to financial savings, the physical savings also needs to be included in the survey since there are no independent estimates of the physical savings of the households (other than those are worked out as a residual process). There is a need to examine various issues involved in ‘residual method’ critically.
The Limitation of FoF Method to provide Household Disaggregation
XIV.6 To the extent that FoF remains the analytical basis for financial savings estimation, which in turn represents a systematic record of net transactions involving financial instruments during a given period of time. Keeping in view the similarities of economic activities, participants have been grouped into a few sectors (namely, banking, other financial institutions, private corporate business, Government, rest of world and households). Similarly, the financial claims have been grouped into instruments (namely, currency, deposits, shares and debentures, life funds etc.). It may be mentioned here that households as per this scheme is a composite residual, with no further breakup available for its constituents except in respect of certain instruments pertaining to the banking sector available through Basic Statistical Returns.
Recommendations
XIV.a In this regard, the HLC had detailed interaction with the apex financial bodies (namely, RBI, SEBI, NABARD and NHB) which are regulatory authorities for important instruments (namely, shares and debentures, cooperative deposits, investment and credit etc.). Detailed formats for such instruments of financial savings deployed by households disaggregated along the lines like, farmers and pure households have been devised. Once these alternative data base develop, it is thought that one will be in a position to make an estimate of savings by pure households, farmers, household enterprises and unincorporated bodies. |
(i) Detailed instrument-wise data of select financial savings in respect of pure households, farmers, household enterprises and unincorporated bodies, if made available by the concerned institutions.
(ii) Once the comprehensive income–expenditure survey of the household sector is available, an attempt can be made to estimate the savings of the pure households. It is important that to be able to get the savings estimates disaggregated along the lines of the national account concept of households (namely, for the unincorporated enterprises etc.), the Enterprise Survey is conducted concurrent with the income-expenditure survey.
(iii) An appropriate design of the survey format is important in this context to be able to obtain State-level estimates of savings for the components of the household sector.
(Action: NSSO and CSO)
Chapter XV : Impact of High Current Transfers on Financial Savings
XV.1 In the context of household savings estimation, an issue that has been noted by some observers is about the implication of high ‘current transfers’ from abroad on household savings, particularly financial savings. It has been argued that to the extent, remittances form part of current account as transfers.
XV.2 It should be seen that a major part of private transfers from the rest of the world (treated as current transfers in the BoP accounts) is utilised by households for current consumption—52 percent as per a study by RBI (2006). Of the balance, a part is used up for accumulation of physical assets by the recipient households (which consist of household enterprises and non-profit institutions serving households), and the rest gets added to the financial assets of the households and all of such savings are fully accounted for as part of financial savings of the household sector and, hence, fully reflected in the estimates of savings.
XV.3 With no allocation to the capital account, India’s domestic savings are overestimated. This is in view of the fact that the utilisation pattern of current transfers from abroad as reflected in the RBI Survey on Remittances shows that a predominant portion of the remittances received (around 54.0 per cent) are utilised for family maintenance, i.e., to meet the requirements of migrant families regarding food, education, health, etc.
XV.4 This issue requires some elaboration as below. If we have to be true to the UN SNA framework and be actually true to the nature of these transfers, it would be necessary to classify a part of such transfers as capital transfers flowing from savings of the non-resident Indians living abroad which are used for capital accumulation proposes in India, may be technically in the hands of the recipients. If such a presumption is accepted, the implication for household savings and investment estimation, and in turn, for the aggregate domestic savings and investment, is of a significant nature. Briefly, under such a dispensation, of the total private transfers indicated above, the part designated as capital transfers will have to be deducted from household savings in the form of financial assets and simultaneously added to the amount of capital inflow from abroad as they would represent that part of the savings of the rest of the world used as a source of finance for accumulation in the domestic economy (EPWRF, 1995). Even if they enter the disposable income stream appropriate adjustment could be made while preparing the ‘consolidated accounts of the nation’.
XV.5 The logic of deducting capital transfers from household savings in financial assets is explained in a summary picture presented below of the capital finance account of the household sector as designed in the SNA (A = B+C):
A Finance for gross accumulation
A1 Savings (Gross)
A 2 Capital transfers received, net
B Gross accumulation
C net acquisition of financial assets (net of liabilities)
XV.6 In this SNA accounting framework, household savings (A1) should equal gross accumulation (B) plus net acquisition of financial assets (C) minus capital transfers from abroad (net) (A2). As the estimates of household accumulation (i.e. physical assets formation) are independently derived by the CSO by a residual method, capital transfers have to be deducted from net financial savings. This is an obvious formulation because foreign remittances are transformed into financial assets in the domestic economy (This also assumes that all private capital transfers are in favour of the household sector, which is in turn the recipient, to begin with, of financial assets on that count).
XV.7 Table 15.1 provides a snapshot of the trends in unrequited Private Transfers from Abroad. The utilisation pattern of current transfers from abroad as reflected in the RBI Survey on Remittances (Invisibles in India’s Balance of Payments, RBI Bulletin, November 2006) attempted to find out the possible end-use of the funds remitted by the overseas Indians to their families back home (Table 15.2). The RBI study based on the sample survey of the micro aspects of remittances conducted at nine centres reveals the following important dimensions of inward remittances from overseas Indians. Some of the findings of the study are as follows:
(i) A predominant portion of the remittances received (54 per cent) are utilised for family maintenance, i.e., to meet the requirements of migrant families for food, education, health, etc.
(ii) On an average, about 20 per cent of the funds received are deposited in the bank accounts and 13 per cent of the funds received were invested in land/property/equity shares.
Table 15.1: Unrequited Private Transfers from Abroad. |
Year |
Amount in Rs. crore |
Per cent of GDP |
Receipts |
Payment |
Net |
Receipts |
Payment |
Net |
1 |
2 |
3 |
4 |
5 |
6 |
7 |
1997-98 |
43930 |
165 |
43765 |
2.88 |
0.01 |
2.87 |
1998-99 |
43494 |
252 |
43242 |
2.48 |
0.01 |
2.47 |
1999-00 |
53280 |
148 |
53132 |
2.73 |
0.01 |
2.72 |
2000-01 |
59792 |
981 |
58811 |
2.84 |
0.05 |
2.80 |
2001-02 |
75092 |
1729 |
73363 |
3.30 |
0.08 |
3.22 |
2002-03 |
83115 |
3886 |
79229 |
3.39 |
0.16 |
3.23 |
2003-04 |
101798 |
2633 |
99165 |
3.70 |
0.10 |
3.60 |
2004-05 |
94439 |
2468 |
91971 |
3.00 |
0.08 |
2.92 |
2005-06 |
110596 |
2031 |
108565 |
3.09 |
0.06 |
3.03 |
2006-07 |
130653 |
4565 |
126088 |
3.15 |
0.11 |
3.04 |
Source : RBI (2008) ‘Invisibles in India’s Balance of Payments’, RBI Monthly Bulletin, February and earlier issues. |
Table 15.2: Utilisation Pattern of Private Remittances (Percentage share in Total Remittances) |
Centre |
Family Maintenance |
Deposits in Bank |
Investment in Land/Property |
Investment in Equity Shares |
Others |
Total |
1 |
2 |
3 |
4 |
5 |
6 |
7 |
Ahmedabad |
69 |
- |
- |
- |
31 |
100 |
Bangalore |
58 |
15 |
20 |
5 |
2 |
100 |
Kochi |
58 |
29 |
7 |
3 |
4 |
100 |
Chennai |
64 |
19 |
4 |
1 |
12 |
100 |
Chandigarh |
51 |
29 |
7 |
1 |
12 |
100 |
Delhi |
54 |
35 |
3 |
- |
8 |
100 |
Hyderabad |
48 |
17 |
11 |
3 |
21 |
100 |
Jaipur |
50 |
14 |
25 |
- |
11 |
100 |
Mumbai |
36 |
25 |
7 |
12 |
20 |
100 |
Average |
54 |
20 |
10 |
3 |
13 |
100 |
Source : RBI (2006): ‘Invisibles in India’s Balance of Payments’, RBI Bulletin, November. p.1368 |
XV.8 However, according to the CSO, remittances form part of personal disposable income and since the current income gets allocated as consumption and savings, to that extent savings increases in a situation of high current transfers.
XV.9 As far as the current estimation process is concerned, since ‘flow-of-funds (FoF)’ continues to remain the analytical base for such compilation and the household financial savings is derived from the capital accounts of different organised sectors with a clear-cut sectorisation scheme for ‘rest of the world’, the present compilation takes care of the impact of current transfers. Its impact, however, would depend on the extent to which these flows would get embedded in the domestic sector through increase in the household financial savings instruments, namely, deposits, insurance, shares and debentures etc, which are captured as domestic savings as per the flows under these instruments.
HLC’s Observation
XV.a Therefore, the HLC recognises that in the event of a shift to direct estimation of household savings, the issue of treatment of current transfers would assume significance. This is because as the amount of current transfers that the households receive from ‘rest of the world’ and their current expenditure out of this need to be captured through either (i) studying the pattern from the banking channels, and/or (ii) household surveys of income and expenditure. Under option (i), it would be required of the RBI to make available the survey results based on banking channel well in time. Therefore, the HLC recommends that, as of now, the treatment of remittances in vogue i.e., the CSO treating remittances as a part of personal disposable income and the FoF accounts continuing to capture remittances’ impact on instruments of savings to the extent they get embedded in the domestic sector through increase in the household financial savings instruments, namely, deposits, insurance, shares and debentures, etc) may be continued till we completely switch over to the direct (survey) method of estimation of household savings.
Chapter XVI : Executive Summary
Introduction
XVI.1 It is recognised that estimation of savings and capital formation in an economy with large unorganised sector is a complex exercise. Especially, when the Indian economy is undergoing rapid structural changes, the income levels and consumption patterns are undergoing transformation, data compilation for estimation of savings and investment has to be undertaken by diverse institutions the precise estimation of these variables is an intricate and arduous exercise. It may be mentioned that the flow of information in the pre-liberalisation era in India was dependent on administrative flow of information, which in the post-reforms period has raised challenges for diverse data needs with reforms having widened the scope for private players.
XVI.2 As mentioned elsewhere in this Report, a review of the estimation procedures pertaining to savings and capital formation was undertaken earlier by other Committees as well. As compared with the approach adopted by the earlier Committees, there are certain distinctive features of the approach adopted by the HLC, which aim at improving the data quality not only for unorganised sectors but also for organised sectors, minimising the data gaps and ensuring revalidation of the data bases.
XVI.3 The household sector, private corporate sector and the public sector are the major drivers of savings in the economy. Similarly, private corporate sector, household sector and the public sector, in that order, are the major drivers of investment activities. Given the complexities/intricacies involved in each of the sectors, the HLC has followed a sector-wise approach for reviewing the estimation procedure and accordingly, four sub-Committees were set up keeping in view the relatively large number of ToRs assigned to it and the intricacies involved in the estimational issues of savings and investment. Other approaches followed by the HLC included discussion with apex institutions and the National Sample Survey Organisation (NSSO) and working out trial estimates for some of the changes recommended. This was a contrast from the approach followed by earlier Committees.
Approach adopted by the HLC
XVI.4 Salient features of the approach followed by the HLC are explained in the following paragraphs:
Household Sector Savings
XVI.5 The HLC accorded significant attention to the estimation of household sector’s savings, which has the dominant position in gross domestic savings. Its importance in savings and investment stems from the fact that it constitutes the largest surplus sector.
Being a conglomerate entity consisting of both consumer and producer households as per Indian national accounts and with significant structural changes in its savings behaviour, the approach adopted by the HLC was conceived along the following lines:
a. In order to pave way for eventual introduction of periodical comprehensive income-expenditure survey for household sector, the HLC succeeded in having a detailed
interaction with the NSSO to understand the nuances for initiating such an exercise.
The outcome of this interaction has turned out to be positive and the NSSO has agreed
in principle to initiate necessary action from 2010-11 onwards with a pilot survey to
begin with. Since the income-expenditure survey would be based on an alternative
data base and methodology, and combined with Enterprise Surveys, it is expected to
provide direct estimation of household savings for the consumer households as is the
practice in a number of advanced countries and provide for cross-validation of the
present residual based estimates.
b. It was recognised that even when the direct estimation comes into operation and stabilises in future, this cannot be on annual basis and, hence, this method has to complement the present method of estimation of household savings as is the practice in several other countries. Hence, the direct estimates and the presently followed
residual based method will complement each other in providing the estimates of household savings.
c. In order to improve the quality of the estimation procedure currently adopted, the HLC meticulously examined each and every component of the worksheet for financial savings and offered many recommendations. Through the ‘Worksheet Approach’ for household financial savings, the HLC’s attempt was to examine at the very micro-level of the compilation, if an alternative and more accurate data base can be created, keeping especially in view the dated ‘rates and ratios’ underlying the present estimation procedure, and the need for improvement of data coverage and evolution of an alternative data base. The recommendations provided by the HLC in this context are expected to improve the quality of the estimates in a significant manner.
d. It was considered appropriate that the present flow-of-funds based residual method needs to be strengthened as it will have to be used in conjunction with the direct estimation method. Accordingly greater focus was accorded for improving the data base, quality and methodology as also deviation from the accepted methodology for FoFs.
e. It was felt that data pertaining to different financial instruments can be sourced from the apex financial bodies under whose regulatory purview the instruments are deployed. The HLC’s interaction with the apex financial bodies, namely, NABARD, SEBI, NHB and IRDA helped in sensitising them about their role in putting in place a statistical system which will enable regular flow of data to RBI and CSO for preparation of household savings and flow-of-funds with updated and accurate data. These apex financial bodies have genuinely made commitments to streamline the data compilation at their end and instituting a mechanism to ensure smooth flow of data at regular intervals.
f. The above information, when made available and incorporated in the estimation, would give a reliable and robust estimate of financial savings of the household sector as well as enable a timely compilation of flow-of-funds accounts of the Indian economy.
g. Improvement in the public and private corporate sector investment estimates is expected to improve the estimates for household physical savings as per the residual method followed for the household sector.
h. The HLC recommends emphatically that to be able to find out the estimates of savings for the different segments of the household sector (as per National Accounts Framework), it is imperative that the Survey of Income and Expenditure of ‘pure households’ needs to be taken up concurrently with the Enterprise Surveys.
Private Corporate Sector Savings
XVI.6 With the substantially expanded space accorded to the private corporate sector in the post-reform period and its emergence as a significant contributor to savings and capital formation in the economy, it is important to address the database issues for this sector. The HLC’s initiative in this regard was to identify a database for the population of all the companies so that it can enable a shift from the presently followed sample-based methodology of estimation of savings and investment using blow up factors to a census-based procedure. A significant success achieved by the HLC in this regard is entering into an understanding with the Ministry of Corporate Affairs (MCA) to share their database under an E-Governance arrangement (MCA 21) on a regular basis to substantially improve the quality of the private corporate sector savings and investment.
XVI.7 It is recognised that the current methodology adopted for estimating private corporate sector savings can be improved by shifting the focus from the ‘sample-oriented’ method. A substantial portion of corporate savings is generated by non-Government joint stock companies – mainly the non-financial companies. The savings are obtained from the corporate data compiled by the Reserve Bank of India. As the Reserve Bank’s study does not include all the companies, the savings have to be necessarily estimated. The estimation is done in two steps. First, corporate savings of the companies included in the Reserve Bank study is calculated using the usual definitions. In the second stage, this figure is blown up to the global corporate savings figure by multiplying it with a blow up factor. Traditionally, the blow up factor is obtained as the ratio of global paid up capital to the paid up of capital of the companies included in the Reserve Bank study. All along it is known that the ‘blow up factor methodology’ has certain weaknesses. The coverage in terms of paid up capital has not been very high. More importantly, the correlation between corporate savings and paid up capital is not significant. In addition, it is difficult to make any further analysis of savings at industry level. Still the methodology is being used for want of any better method.
XVI.8 During the past two years, the MCA has taken a major technology initiative by implementing electronic filing of financial Statements by companies (E-Governance MCA 21). As a result, all companies are required to submit their annual accounts to MCA online. Although most of the data is submitted in non-computable format (pdf), some of the data elements are captured in computable format by MCA, so that they can be processed directly and quickly. As data pertaining to all companies is available with MCA, the HLC felt that it would be a significant improvement in compilation of corporate savings and investment if this data can be used as it obviates the need for using the blow up factor, which is known to be having certain drawbacks. The HLC identified the set of data elements that are required for corporate savings to be included in the data to be received in computable form at MCA so that the data of all the companies submitting accounts to MCA can be used to obtain corporate savings. Using the data of all the companies (including companies under construction and different categories of companies like finance and PPPs) is a major deviation from the previous methodology of estimation using blow up factors.
XVI.9 This collaborated exercise between the RBI and MCA is expected to significantly improve the quality of the private corporate sector’s savings and investment estimates.
Public Sector Savings
XVI.10 Coverage of the public sector savings is one of the significant issues that the HLC took on board and suggested for separate estimates of GDP, consumption expenditure, savings and capital formation for the Local Bodies and quasi/autonomous Government bodies by CSO. The HLC also looked at the issues of treatment of defence capital expenditures, capital transfers made to the autonomous Government institutions, local bodies and the public-private partnerships (PPPs). It has recommended that a part of the defence capital expenditure on construction, ordnance factories and defence establishments is treated as capital expenditure and hence, capital formation of the public sector. The HLC’s recommendation that a mechanism needs to be instituted to capture the annual accounts of the PPPs would ensure that the savings and investment estimates from these ventures are adequately captured. This is particularly important at a time PPPs are emerging as major vehicles for infrastructural development in the country.
XVI.11 The HLC examined the reasons for differences in the estimates of savings of public authorities being released by the CSO and the revenue deficit of Centre and State Governments as appearing in the budget documents.
Capital Formation
XVI.12 On the issues relating to estimation of capital formation, the HLC had a fresh look at the various ‘rates and ratios’ that are used in the estimation of capital formation through the commodity flow approach. Besides this, the HLC considered usage of different qualities of cement and recycled bricks in construction, feasibility of including direct estimates of capital formation made by the companies under construction using the MCA21 data. The HLC also took a holistic view of the treatment of ‘valuables’ in the estimates of GCF and the ‘errors and omissions’.
XVI.13 However, it is conceded that there are also issues that the HLC could not address for reasons beyond its control. Particular mention may be made of the fact of the HLC’s retaining the conceptual framework underlying the estimation of savings and investment in India’s National Accounts Statistics, i.e., the flow-of-funds and the commodity flow methods. The HLC recommends that the existing practice of indirect method of estimation of household savings may continue. This is on account of non-availability of an acceptable, practical and alternative method. Having accepted this, the Committee recognises the scope for improvement in respect of all the constituent sectors.
XVI.14 It has been recognised that the Indian framework for estimation of savings and investment presently in vogue is conceptually sound. Given the existence of the large unorganised sector in India, the estimates for the household sector, for which income-expenditure and balance sheets are not available, is derived residually by deducting those for the organised sector from total for the economy. The HLC recognises that “Independent Estimates” of savings is a process for distant future. Since a residual method is followed for the household sector, improvement in estimation for organised sectors like corporate and public sectors etc, will lead to improvement in the savings estimation of household sector. The HLC has also recognised that the issues related to savings and capital formation are not merely confined to data in respect of unorganised sector alone. There is a need to improve the organised sector’s data as well in terms of improving data quality, minimising the data gaps and ensuring revalidation of the data bases.
XVI.15 Moving ahead, it is important that estimation of macroeconomic aggregates, like savings and capital formation, is placed on a sounder footing. This is an arduous task, given the fact that important structural changes are taking place in the savings behaviour of economic agents and paradigm shifts are characterising the growth performance of Indian economy in the more recent period.
• Under the given circumstances of the complexities involved in estimating savings and investment from various sectors, it is considered worthwhile to accord significant attention to improve the present data base and methodologies adopted for the different sectors of the economy – both organised and unorganised.
•
Reassess the ‘rates and ratios’ underlying the present methods for estimation of savings and investment, namely, the flow-of-funds and commodity flow methods.
•
To the extent possible shift from sample-based estimates of savings and investment to a census based one, particularly for the private corporate sector.
•
To achieve robustness of the savings and investment estimates, cross-validation of the estimates across data bases and methodologies holds the key. Towards this pursuit, as explained in the following paragraphs, the HLC has undertaken detailed sector-wise attempts to generate newer databases and methodologies.
XVI.16 As economic agents are living in a highly leveraged setting, financial liabilities are increasing in pace to finance a host of transactions – both financial and physical investment activities. An issue that has emerged and is being debated for some time in India now is that while financial liabilities are increasing there is no commensurate increase in financial savings, which leads one to believe that financial deepening is not properly captured in the financial savings estimates. At the same time some believe that even physical savings could be underestimated. In this regard, the approach of the HLC is that the concept of ‘transferable savings’ is more relevant for estimation of savings and assess its deployment. In view of the status of the household sector to be predominantly a financially surplus sector, it is useful to look at ‘gross financial savings’ and not ‘net financial savings’.
XVI.17 Against this setting, we now summarise the major recommendations offered by the HLC to improve the quality, scope and reliability of the estimates of savings and investment in India.
Major Recommendations and Observations11
The major recommendations and observations made by the HLC pertaining to various ToRs are summarised as below:
Household Sector Savings Estimation
Comprehensive Income-Expenditure Survey
VI.a In order to pave way for eventual introduction of periodical comprehensive survey, the HLC interacted with the NSSO to examine the possibility of introducing such a survey. The outcome of this interaction has turned out to be favourable in the sense that the NSSO has agreed to undertake such a survey for households with a pilot survey to begin with, in the year 2010-11. The survey will provide an alternative data base for direct estimation of household savings for cross-validation of the present estimates. The HLC recommends that the NSSO should initiate at the earliest, the task of launching a comprehensive income-expenditure survey for household sector. While initiating such a survey, the NSSO may give a careful thought to the design issues through consultation with all appropriate institutions, like the CSO and the RBI. The NSSO should come out with a concrete action plan in this regard. To be able to find out the estimates of savings for all components of the household sector (as per national accounts statistics framework), and also generate reliable estimates of savings, consumption, investment and income at the State level in India, appropriate sampling design needs to be done. It is imperative that the survey of income and expenditure of ‘pure households’ needs to be taken up concurrently with the Enterprise Survey.
11 The recommendations and observations of the HLC are provided here chapter-wise with the paragraph numbers corresponding to those in the respective chapters.
Review of the Existing Methodology
VI.b The HLC is of the opinion that no alternative is possible to the present method of estimation of savings but it is recognised that the present method needs to be strengthened through regular updation of rates and ratios and development of alternative data bases for constant cross-validation of the estimates. The envisaged system of conducting a regular and comprehensive income and expenditure survey of the household sector once in five years, when stabilises, will complement the present procedure and provide a cross-validation for the household savings estimates. Thereafter, both the methods would be used in the estimation and would complement each other
Treatment of Currency Holdings by Households
VI.c Rather than using a fixed ratio like 93.0 per cent, which is a rough approximation, the HLC recommends that the currency held by households as per the latest available flow-of-funds data be considered for the purpose of estimating the currency component for the household sector’s financial savings estimation. As the latest flow-of-funds data is available up to 2000-01 and significant shift in behavioural ratios (such as currency holdings with the public) might have happened since then with structural changes in the economy, the HLC recommends compilation of flow-of-funds data in a more timely manner to consider different ratios including the ratio of households’ cash holding on a more realistic basis. Therefore, the HLC recommends that the flow-of-funds accounts of the Indian economy need to be compiled regularly and in a more up-to-date manner. There is a need to closely examine the current data gaps and constraints coming in the way of compiling the flow-of-funds accounts regularly.
VI.d Till the flow-of-funds accounts compilation is updated on a regular basis, alternatively, the HLC recommends periodic review of the assumed proportion of the household share of ‘currency with public’. While estimating the household financial savings for a particular year, it may be appropriate to deduct the sectoral currency holdings (to the extent they are available for the organised sectors) from the ‘currency with public’. In case the former is not available, estimates for the year may be approximated by using the latest 2 to 3 years average holdings. This practice may enable to move away from the assumed proportion of the household share of ‘currency with public’ in a phased manner. Therefore, in future, household currency holding can be estimated residually following the method as Stated in Table 6.4 for the purpose of estimation of the household financial savings. For this purpose, data on currency held by the corporate sector can be sourced from DSIM, RBI and currency holding by the Government sector can be sourced from the CSO.
Treatment of Bank Deposits
VI.e RBI’s annual survey on ‘Composition and Ownership Pattern of Scheduled Commercial Bank Deposits’ needs to be looked at for further refinement in terms of :
• Representative nature of the sample
•
Margin of error
• Reduction in time-lag
VI.f In view of the emerging importance of farmers and institutions like NonGovernment Organisations (NGOs) and self-help groups (SHGs) in the financial system and also from the perspective of policy issues, the HLC recommends that such unincorporated non-profit institutions be treated as separate categories under households. Accordingly, there is need to capture these entities in the returns for deposits provided by banks to the RBI.
VI.g Since the ownership of deposits by sectors is not available for the latest year for which estimation of financial savings is undertaken and there is usually a year’s lag, the ratio for the year of the estimation needs to be projected. In this pursuit, an appropriate statistical basis for arriving at the ratios of household ownership in deposits (like using the average for the latest 2 to 3 years) needs to be arrived at through a consultative approach among various institutions such as the CSO, RBI, etc.
VI.h Presently, as per the existing method in the compilation of household financial savings, use is made of Section 42 data (as of the last reporting Friday of the year) for data on commercial banks’ deposits for each year while form X data on liabilities and assets of scheduled commercial banks in India for the bifurcation of deposits into current, savings and fixed deposits, the latter being on end-March basis, and the Ownership Pattern of Scheduled Commercial Bank Deposits on an end-March basis. There is, thus, a need to standardise the database for the estimation of household deposits by using consistently the March 31 figure in place of the last reporting Friday of March. This is available for every year with a lag of three to four months.
Treatment of Co-operative Bank Deposits
VI.i In the light of genuine difficulties expressed by NABARD in regularly compiling the comprehensive data, NABARD may endeavour undertaking “projections”, which could be revised when firm data become available. The data issues need to engage the attention of the highest level in NABARD. In this context, the HLC recommends that NABARD should be involved in providing a projection of household deposits in co-operative banks and credit societies to get around the problem of considerable time-lag in the publication such as ‘Statistical Statements Relating to the Co-operative Movement in India (Credit and Non-credit societies)’.
VI.j All efforts should be undertaken to improve the time gap in the publication ‘Statistical Statements Relating to the Co-operative Movement in India (Credit and Non-credit societies)’, a process that is said to be underway at the NABARD.
VI.k NABARD should continue in its role as the nodal agency for the co-operative sector and provide data for the compilation of national accounts, savings estimates and FoF accounts in so far as the cooperative sector is concerned (Annexes A6.5.3 and A6.5.4). In this regard, NABARD may collaborate with National Federation of State Co-operative Banks (NAFSCOB), National Cooperative Union of India (NCUI) as these agencies are publishing some basic data on credit and non-credit societies.
VI.l Considering the similarity in the nature of issues, the HLC’s recommendations pertaining to cooperative credit societies may be applied to cooperative non-credit societies.
Treatment of Deposits with Non-banking Companies
VI.m As the discontinuation of the survey on “Growth of Deposits with Non-banking Companies” since 1995-96 puts constraints on a reliable estimation of household deposits with non-banking companies, the HLC recognises that there exists large data gap in the estimation of household savings in the form of deposits with non-banking companies, because of non-inclusion of a wide array of unregistered companies. Hence, the HLC recommends that a census should be conducted on a regular basis, say once in five years, covering all companies incorporated with the Department of Company Affairs. The census should collect data on assets, liabilities, income and expenditure of NBFCs including the unregistered/ exempted category of NBFCs. The census should be conducted by DSIM, RBI in collaboration with the Department of Company Affairs, Government of India, if necessary by outsourcing the same. It may be noted that this is in consonance with the recommendations made earlier by the Committee on Informal Financial Sector Statistics, 2001 (Chairman: P. Venkataramaiah).
VI.n The HLC recommends that the data emerging from the census on the assets/ liabilities position of the NBFCs should be appropriately incorporated in the flow-of-funds accounts also.
VI.o In respect of companies registered with the RBI, the RBI should provide the necessary details of deposits of public. Data for registered companies have to be firmed up with appropriate consolidation of data and follow up if response is weak. For the unregistered companies, sample studies will have to be undertaken and their results will have to be used after establishing proper blow-up factors.
Treatment of Life Insurance Funds
VI.p The HLC recommends that the IRDA should be involved in the household financial savings estimation by way of providing regular information on ‘life funds’ consolidated for all insurance institutions – both in the public and private sector in the format prescribed in this Report (A6.5.5).
VI.q To net out the household liabilities against assets in respect of the insurance sector, the IRDA may arrange to get the required data on the insurance institutions’ ‘loans to their staff’ in addition to the policy-holders.
VI.r The RBI may approach the IRDA to provide combined balance sheet for all insurance institutions – public and private - as per the flow-of-funds format. This will go a long way in the IRDA providing an alternative database not only for ‘life fund’ but also for flow-of-funds compilation at the RBI from time to time (A6.5.6).
Treatment of Provident and Pension Fundsc
VI.s As the present system of compilation of household savings in provident and pension funds is reasonably satisfactory, the HLC recommends that the existing system may continue.
VI.t Since there is a need to capture household savings in the form of pension funds, the relevant apex body, namely, the Provident Fund Regulatory and Development Authority (PFRDA) should collect and disseminate such information on a regular basis.
VI.u The share of 6.0 per cent of wages and salaries paid to the employees of local authorities as their savings in PF is based on an old exercise conducted by the CSO. Therefore, the HLC recommends that the CSO should conduct a fresh study to update this ratio and keep it updated from time to time.
Treatment of Claims on Government
VI.v The HLC recommends that an appropriate format as prescribed in this Report on the ownership pattern of Government securities (consolidated for all levels of Government), comprising six categories, viz., 1) Government, 2) Banks, 3) Financial Sector other than Banks, 4) Non-Service Sector (Corporates, Firms and Societies), 5) External Sector and 6) Household Sector, may be prepared by the RBI to provide the data based on the revised format (Annex A6.4) as at end-March every year, so that the residual status can be accorded to household (as defined in national accounts and FoF framework) in this instrument. The concerned Department within the RBI should ensure the providing of such information for estimation of household financial savings estimates.
Treatment of Shares, Bonds, Debentures and Units of Mutual Funds
VI.w The HLC recommends the involvement of the SEBI in providing information on a regular basis to the RBI on areas like annual subscription to public issues of shares, debentures, mutual funds and commercial bonds (each separately and consolidated for all depositories) as per the ownership categories (categories of subscribers are Qualified Institutional Investors, FIIs, NRIs, corporate, trusts and other categories) from which the RBI will extract household investment in shares, debentures, mutual funds and commercial bonds for household financial savings estimation (Annex A6.5.1). Registrars/Depositories/ AMFI need to be involved for regular data support. Henceforth, the SEBI would arrange to collect the required data from these entities, which are the primary sources of those data, by sensitising them and explaining the requirement of their data for estimation of household financial savings.
VI.x The SEBI may collect the consolidated balance sheet position for all registrars and broker houses and provide the data to the RBI as per the flow-of-funds format (Annex A6.5.2) to be forwarded by the RBI, so that the same can be incorporated in the FoF accounts.
VI.y The HLC recommends that the consolidated Statements of assets/liabilities of all capital market institutions (namely, merchant bankers and registered brokers) should be compiled by the SEBI or have them compiled and forwarded to RBI for compilation of flow-of-funds account of the Indian economy.
VI.z The NABARD should be involved in providing projections of household investment in shares and debentures of co-operative banks and credit as well as non-credit societies to get around the problem of considerable time lag in the publication such as “Statistical Statements Relating to the Co-operative Movement in India”.
VI.aa In view of the back dated Survey of Ownership of Capital of Joint Stock Companies as on end-March 1995, there is a need to update this at least once in five years. The SEBI may look into the modalities of conducting such a survey.
VI.bb Till a reliable flow of data from the SEBI on various parameters is available on a regular basis, the need for a blow-up factor for computing household investment in the shares, debentures, mutual funds and bonds of all companies is there. Accordingly, global paid-up capital series needs to be provided to the RBI by the Ministry of Corporate Affairs.
VI.cc The CSO should forward requisite formats to SEBI for estimation of savings, capital formation and GDP for the bodies under the regulatory purview of SEBI.
Treatment of Trade Debt
VI.dd Till the MCA 21 data is available and can be used for the purpose of financial savings estimation under trade debt, the existing methodology of computing trade debt may be continued. For estimating trade debt figure for all companies from the sample studies of the RBI, there is a need to have an appropriate blow-up factor. As recommended earlier, global paid-up capital series needs to be provided to the RBI by the Ministry of Corporate Affairs.
Treatment of Loans and Advances of the Households
VI.ee The HLC recommends that as BSR data on bank credit is available with a lag of one year, proportion of the previous year may be applied wherever necessary. Care should be taken to ensure that the database on loans and advances by sectors/institutions/categories are comparable.
VI.ff The HLC recommends incorporation of an estimate of loans to households and employees from the non-financial companies. This will entail requisite modifications/ inclusion in the questionnaire forwarded to companies by the RBI for conducting the Company Finance Studies.
VI.gg The NABARD should provide a projection of loans and advances to the household sector from the co-operative credit and non-credit societies to get around the problem of considerable time lag in the publication such as ‘Statistical Statements Relating to the Cooperative Movement in India’.
VI.hh The IRDA should provide an estimate of loans and advances to households from the insurance companies – both public and private – by way of providing regular information to the RBI.
VI.ii While the present practice of subtraction of household financial liabilities from the gross financial assets to arrive at the household net financial savings is conceptually appropriate, the problem with this practice, however, is that the household financial liabilities may have been incurred for the purpose of acquisition of not only the financial assets but also physical assets. In the context of deployment of savings, what is important is the concept of ‘transferrable savings’. Hence, the CSO should present the total household savings as:
[Gross Financial Assets + Physical Assets – Financial Liabilities]
Instead of the present practice of reporting as:
[Net financial savings (i.e., Gross Financial Assets – Financial Liabilities + Physical Assets].
It would be appropriate for the CSO to present household financial savings by instruments in gross terms and not net of respective liabilities as is the present practice. In addition, for presenting household savings in form of financial assets, the estimate would consist of gross financial assets less financial liabilities.
New Data Bases
VI.jj On examination of the instruments of financial savings for households, it was agreed by the HLC that presently all the financial instruments available for deployment of household savings are taken into account while estimating the household financial savings. However, there is need to continuously monitor the emergence of new instruments for incorporating them in the savings estimates. Accordingly, new data base for such instruments need to be developed.
VI.kk New databases should be devised/built-up for improving the reliability or checking validity of the estimates of household savings. The HLC examined the present data collection procedure adopted for estimating household financial savings and arrived at a consensus that in the existing scheme of things, although some apex bodies (namely, NABARD and NHB) are already involved, there is a possibility of involving the other apex bodies such as IRDA and SEBI for the purpose of building up an alternative database in respect of financial instruments under their regulatory purview and in respect of assets and liabilities of capital market institutions for the purpose of compiling the flow-of-funds accounts. Towards this pursuit, SEBI’s involvement was envisaged in respect of household investment in shares, debentures, mutual funds and commercial bonds, IRDA’s in respect of ‘life funds’ of insurance companies, NABARD’s in respect of deposit, credit and investment data pertaining to co-operative banks, credit and non-credit societies and NHB’s in respect of household deposits with the housing finance companies. The HLC recommends creation of a regular data supply mechanism from the apex bodies to the RBI for which specific forms will be supplied. Going forward, it is also envisioned that all the apex bodies are engaged in the ongoing review of the data on household financial savings from the following standpoints:
i. Identification of the database used;
ii. Methodology prescribed and in practice used;
iii. Validating the data as well as results; and
iv. Comment on changes required in the procedure.
VI.ll The HLC agreed that there is a need for field studies by different institutions like CSO and NSSO for developing new databases. The appropriate case studies and type studies to be undertaken may be funded by CSO and RBI.
Institutional Support for Statistics
VI.mm The issue of institutional support for generating reliable statistics as public good was discussed. The HLC was convinced that constraints by way of inadequate staffing of the desks involved with timely compilation of massive statistical exercises have led to difficulties in completion of such exercises in time. The HLC recommends that the National Statistical Commission should identify such units in NSSO, CSO and the Research Departments in the RBI for strengthening them through appropriate staffing so that in future statistical exercises like income-expenditure survey, Company Finance Studies, BSR, FoF and similar exercises can be completed expeditiously at these organisations.
Private Corporate Sector Savings
VII.a With progressive implementation of MCA21 and improvement in data reporting, the coverage is expected to improve further. Therefore, the HLC strongly suggests using MCA21 data for estimating savings and capital formation of non-Government non-financial companies and non-banking financial companies. Once data quality and reporting issues are resolved, it is suggested to do away with the present methodology and implement direct aggregation method based on MCA21 data.
VII.b In addition to estimating the corporate savings and capital formation for the nonGovernment and non-financial companies and non-banking financial companies using the present blow up factor methodology, estimates may be made using MCA21 global data from the year 2008-09. The two sets of estimates may be compared for improving coverage and quality of MCA21 data base. It is expected that MCA21 data base would stabilise by 2010-11 and accordingly, the HLC recommends that savings and investment estimates from the year 2010-11 may be made using MCA21 data for all companies, dispensing with the blow up factor method.
VII.c The HLC suggests including the following additional data fields in Form 23ACA submitted under MCA21 as (a) net amount transferred to reserves, (b) net amount transferred to Balance sheet, (c) capital gains (+)/losses(-), and (d) income(+)/ expenditure(-) related to previous years. In addition, it was decided that net deferred tax liability could be taken from balance sheet as a difference in current year and previous year figure, which is already being captured in Form 23AC. The HLC also indicated including two additional data fields, viz., non-producible intangible assets and revaluation of fixed assets in Form 23AC.
VII.d The HLC also considered MCA21 data for supplementing relevant information required for estimating household financial savings. In order to incorporate the elements for use in estimating household financial savings, the HLC suggests including the following items in the balance sheet structure in Form 23AC as (a) public deposits, (b) trade debt, (c) loans and advances to public (including Directors and employees), (d) investment in Government securities, (e) cash at hand and (f) bank balances.
VII.e There are few other indicators relating to private corporate sector activity which are envisaged to be critically important to banking sector and national economy. Inclusion of those items in 23AC would facilitate better understanding between corporate performance and bank lending. In this context, the HLC suggests including (a) borrowing from banks (under ‘Secured Loans’) and (b) borrowing from banks (under ‘Un-secured Loans’). In addition, it is worthwhile to include reporting of installed capacity (under ‘Turnover details of three principal products’, Form 23ACA) to build up a ‘capacity utilisation index’ at national level. (Suggested formats for Form 23AC and Form 23ACA are presented at the end of this Report). Further, the HLC suggests MCA to explore collection of information on different types of employment from companies.
VII.f As regards the data quality issues between two databases that are maintained by the MCA and RBI, the HLC suggests that data definitions must be unique, and the practice and definitions followed in RBI company finance studies should be implemented in MCA21 data so that these two datasets are consistent and comparable. In addition, the metadata issues and sources of discrepancy should be sorted out mutually between MCA and RBI.
VII.g The HLC, upon in-depth deliberation, notes the innovative features of XBRL and feels that XBRL platform may be helpful in assuring consistency and accuracy of reporting system in the context of corporate data reporting in the country. In particular, the HLC suggests the Ministry of Corporate Affairs to explore the likely benefits from adopting XBRL platform for its’ MCA 21 database.
VII.h Further, noting the role played by the ICAI as a nodal institute for the XBRL-India, the HLC recommends that the ICAI works with the MCA towards inclusion of MCA 21 database under the XBRL platform.
VII.i In order to capture the data at the RBI-end, the MCA needs to provide appropriate access rights, specifically computable format electronically, to the MCA21 database so that dataflow is ensured.
VII.j In respect of cooperative institutions, there is an urgent need to fill up the data gaps. The NABARD should speed up bringing out their annual publications on Statistical Statements Relating to Cooperative Movements in India (credit and non-credit societies) within a period of one year instead of the current delay of say, four years. The HLC is aware of the arduous task ahead, but nevertheless wishes to emphasise the need to correct this long standing data gap once and for all; it will go a long way in improving the data base on the estimation of savings and capital formation as are derived from the cooperative sector.
VII.k The HLC also recommends that for the years for which the required data are not available as detailed in the NABARD’s above-mentioned publication, the NABARD should put in place a regular system of generating the required estimates based on information available for major institutions or otherwise and making them available to the RBI and CSO from time to time. This should cover all aspects of data requirements for household savings, and savings and investment of cooperative credit and non-credit institutions as well as related area of flow-of-funds accounts. For this purpose, the CSO should provide the NABARD with appropriate formats in which the data have to be furnished.
VII.l Presently, the CSO is estimating the savings of private insurance based on the data available from the Annual Reports of IRDA. This is considered adequate.
VII.m There is need to improve the coverage of non-profit corporate institutions serving the private corporate sector. The HLC suggests identifying the frame of such companies. The CSO may undertake sample surveys and also identify appropriate blowing up factor by analysing accounts of sample companies.
VII.n The HLC feels the need for an ongoing consultative approach and strengthening of the statistical system at concerned organisations namely, CSO, NABARD, MCA and RBI.
VII.o The HLC strongly suggests the setting up of a full-fledged unit/cell at the MCA to improve coverage, quality and timeliness of MCA21 database.
VII.p The HLC recommends augmenting the staffing position at the RBI to enable handling and analysis of huge corporate database, expected to flow from MCA21 to the RBI.
VII.q The HLC also recommends strengthening statistical units both at the CSO, NSSO and NABARD.
VII.r The HLC feels that basing savings estimates on ‘mark to market basis’ may not be apt as it may lead to wide fluctuations from one reporting period to the next even when the underlying fundamentals do not change. Moreover, absence of liquid market for various types of assets also makes such estimation inappropriate.
Estimation of Public Sector Savings
VIII.a The HLC recommends creation of a separate category for Quasi-Government Bodies in the CSO’s estimates of GDP, consumption expenditure, savings and capital formation. Regarding capital grants made by the central and State Governments to the autonomous Government institutions, the HLC recommends that these grants should be treated as revenue expenditure in the donor’s accounts (which will reduce their savings), and included in the total receipts of the donee’s (which will show corresponding increase in the savings, if the capital grants are utilised for acquisition of fixed assets).
VIII.b The CSO should make separate estimates of GDP, consumption expenditure, savings and capital formation for the Local Bodies. These could best be prepared based on census of Urban Local Bodies and on sample basis in the case of Rural Local Bodies. For this purpose, States may be provided financial assistance and training by the CSO to undertake analysis of Local Bodies’ accounts.
VIII.c The CSO, instead of analysing Profit and Loss Accounts of all the UTI schemes separately, should explore the feasibility of using consolidated data of all mutual funds which is available with the Association of Mutual Fund, as the treatment of UTI scheme applicable to all mutual funds.
VIII.d The CSO or the Planning Commission or the nodal agencies for the PPPs, should obtain the annual accounts of the PPPs in the private sector and analyse them for the purpose of estimating savings and capital formation made by them.
VIII.e The HLC recommends that the CSO should include the capital expenditures of Defence on construction, ordinance factories and defence establishments as capital formation.
Estimation of Capital Formation
IX.a On the issue of the treatment of the estimates of capital formation arrived through three different methods to be shown separately without any adjustments, the HLC recommends that the estimates of capital formation arrived from the savings side should be treated as firmer estimates relative to estimates based on commodity flow / expenditure approach as those estimates are based on numerous rates and ratios and various adhoc sources. It was, therefore, recommended that for operational convenience, only one figure of capital formation arrived at through savings route should be used for compiling aggregate rates of capital formation as is being done at present.
IX.b Keeping in view the fact that the quality of estimates of savings of households in physical assets depends indirectly on the overall estimates of GCF arrived through commodity-flow approach, the HLC recommends regular updation of rates and ratios used in this approach.
IX.c The rates and ratios used in the estimation of various types of capital goods should be updated through small studies to be conducted with the help of State Governments and other research institutions, such as agro-economic research centres, etc.
IX.d The HLC recommends that efforts should be made to estimate the value of materials other than cement, iron & steel, bricks, furniture & fittings and timber so that the ratio used for blowing up other materials could be brought down. It was also recommended that ratios used for factor payments should be revised at the time of base year revision.
IX.e There should be some adjustment for recycled bricks in the estimation procedure of value of output of construction.
IX.f The value of cement used in construction should be arrived at by taking into account different qualities of cement using appropriate weights.
IX.g Regarding Valuables, the HLC recommends that the estimates of net acquisition of valuables should be shown as a separate category distinct from the GFCF and Change in Stocks in the estimates of Gross Capital Formation.
IX.h Filing of returns of both public sector and private sector projects under PPPs should be made mandatory under provision of Indian Statistical Act.
IX.i The MCA should make available the annual accounts of companies under construction, as it was observed that accounts filed under MCA21 would includes these companies.
IX.j Regarding the estimation of capital formation by industry (expenditure approach), the HLC felt that possible improvement to this is the launching of annual enterprise surveys (or annual surveys of non manufacturing enterprises, ASNME), as recommended by the NSC. The HLC, therefore, recommends that the Steering Committee of NSSO should be requested to immediately launch ASNME on a regular basis.
IX.k The HLC also recommends that the Steering Committee of the NSSO may be requested to launch annual survey of non-manufacturing enterprises or annual enterprise surveys focusing on larger enterprises which maintain annual accounts for collecting data on income, expenditure and capital formation.
IX.l Expressing concern about the deteriorating quality of ASI data, the HLC observed that adequate staff/logistic and infrastructural support are required to improve the quality of ASI data, besides taking measures to simplify the ASI schedule, electronic submission of ASI returns, increasing the coverage of census factories and releasing separate data for the census factories.
IX.m Having regard to the above under-coverage issues in IIP, the HLC recommends that the CSO should devise suitable procedures, including the usage of central excise databases on production, to cover total production as far as medium and large scale industrial undertakings are concerned, in respect of the commodities included in the item-basket of IIP.
IX.n The HLC further recommends that the CSO may explore preparing an alternative index of sales/total income by taking into account both industry and service activities in the country based on quarterly financial results announced by the listed companies.
Capital Formation at Regional Level
X.a The Steering Committee of the NSSO may be requested to launch annual survey of non-manufacturing enterprises or annual enterprise surveys focusing on larger enterprises which maintain annual accounts for collecting data on income, expenditure and capital formation. The surveys should be designed in such a manner that reliable estimates of capital formation are available, for each State - however small or big it is. This is particularly important for the north-east States and the newly formed States.
X.b The present enterprise surveys should be conducted with suitable sample size (including a usable sample from each State) for estimation of capital formation at State level and by industry.
X.c Regarding the estimation of State level capital formation, the HLC observed that most of the States compile GFCF for only public sector and the compilation is done by industry of use. The state wise data on public sector is available from the Gross Block of public enterprises survey. The main problem is getting the data on private investments made in the States. For this, only annual enterprise surveys can provide reliable estimates of regional capital formation. The Steering Committee of the NSSO, therefore, should be requested to launch annual enterprise surveys, which should provide reliable data on capital formation at state level and by industry. Other options to compile GFCF could be to use capital–output ratios of all-India or public sector within the State. With increase in coverage of companies in the MCA21, it should, however, be possible to get state-wise estimates of capital formation on the basis of location of companies, rather than on the basis of location of establishments, which is what is required at State level.
X.d Regarding GSDP at market prices, the States should attempt to release this data by adding indirect taxes net of subsidies to the GSDP at factor cost (which follows income-originating concept). The data on indirect taxes net of subsidies for the States, including those of local bodies, part is available from the analysis of budget documents of the State Governments, and for the Centre’s part of these taxes and subsidies (including indirect subsidies from the Centre in each State), which is difficult to estimate but possible, efforts should be made to estimate the same.
X.e The States may also try to estimate savings by subtracting private final consumption expenditure and government final consumption expenditure from the estimated GSDP at market prices, after assuming that the net transfers and factor incomes from abroad and from other states is either negligible or making suitable adjustments from the data available at State level on bank deposits. This procedure gives a rough estimate of savings in the State, which can further be approximated to GCF, if one assumes the net capital inflow to the state is negligible. This is, however, a very crude and rough estimate of both savings and GCF in the State, but could be an indicative dataset. Another problem in this procedure is the lack of availability of data on private final consumption expenditure. States can derive this data from the NSS Consumer Expenditure surveys by suitably adjusting to the differences between consumption expenditure data shown in NSS and NAS. For estimating income accruals (if one follows this approach to estimate GSDP), the data on factor income flows across States is needed. Flows of goods and non-factor services don’t create conceptual difficulty, but they create practical difficulty for estimation. However, such flows are now available to some extent from Railways and Road Transport operators. The international trade needs to be captured.
X.f The HLC recommends that enterprise surveys should be conducted with suitable
sample size for estimation of capital formation by industry and by States. Till such time, alternate methods like working out capital output ratios, using ASI data at two digit level and studying its variations with all India capital output ratios may be tried for estimating capital formation at State level.
Interpretational Significance of the Savings and Investment Estimates
II.a Despite the fact that the national accounts statistics (NAS) provide a consistent and coherent set of macro-economic accounts, often interpretational issues arise while analysing these data. The following points can be made in regard to the interpretational significance of the savings and investment estimates:
II.b Contribution-wise, with regard to the generation of savings, the major drivers are household sector, corporate sector and public sector in that order and for investment; they are corporate sector, household sector and public sector. While households have traditionally remained major savings sector in Indian economy reinforced by demographic dividends in turn reflecting lower dependency, of late corporate savings have emerged as savings generator responding inter alia to robust sales and corporate profitability with the economy on a high growth trajectory recently. Cross-country differences in the evolution of gross corporate savings over the past half decade have tended to reflect to a large extent those of the gross operating surplus, which in turn are likely to be due to countries’ exposure to global factors (accelerated globalisation and technological progress), presumably depending on institutional framework conditions (such as product and labour market regulations), as well as the sectoral composition of their economies. With Indian economy being increasingly gloabalised, the interplay of domestic and external factors in enhancing corporate savings can be envisaged. Within the public sector, the sources of savings are characterised by certain differential performance with the Government Administration being on a consistent deficit mode since the 1990s and the non-Departmental enterprises and Departmental enterprises in that order compensating by way of positive savings reflective of their steady improvement in commercial functioning. Significantly, these changes are occurring when the economy remained on a high growth trajectory in the last five years.
II.c As highlighted in the aforementioned paras, there are limitations in the estimation of savings and investment at the level of each of the institutional sectors. This is understandable given the predominance of unorganised sector in India. Even for the organised sectors, analysts have pointed out the data gaps and quality issues for those data that are available. Interpretational issues have, thus, remained endemic to the savings and investment estimates, surfacing from time to time leading thereby to formation of Committees to address these concerns.
II.d A point mentioned in the past Committees regarding correct interpretation and a clear understanding of the available estimates of domestic savings and capital formation, it is essential to first keep in mind the various data sources used and the current methodology of estimation of savings and the capital formation. In doing so, it would be possible to indicate the areas where errors in estimation could arise.
II.e Interpretational issues with regard to estimates of savings and investment are important to be assessed from time to time, as is the practice so far in India. In this connection, it is desirable to develop alternative data bases for these estimates for the constituent sectors so that savings estimates could be cross-validated with the help of appropriate alternative data bases, methodologies and surveys. In the absence of income-expenditure survey for pure households accompanied by enterprise surveys for other components of the household sector (as defined in the national accounts statistics framework), there is no direct estimation of household savings and as a result, there is no cross-validation of the indirect (residual) estimates of savings at present which is expected to be taken up in due course enabling cross-validation of savings of the predominant household sector. With regard to private corporate sector and the public sector, the issues of inadequate data coverage and local bodies and autonomous Government institutions, respectively, are the weak areas that need to be resolved.
II.f Notwithstanding the limitations, which are well accepted, the HLC observes that the existing methodology for estimation of savings has broadly captured the changes that are taking place in the economy in general and various sectors like the household, corporate and public sectors in particular. The estimates are reasonably reliable reflective of the trends in the economy. The estimates may be reasonably reliable on account of the following factors:
• To the extent increase in GDS is spread across all constituent sectors, the improvement in the GDS rate in the recent decades is essentially a reflection of the fundamental transformation of the structure of the economy. The rise during 2000s simultaneous with the buoyant growth performance corroborates the positive cycle of growth, savings and investment, such that as growth enhances savings, which in turn further enhances growth. The rise in savings rates in India appears to be mainly structural and one can expect savings rates to increase further with rising income and declining dependency ratio.
• A look at the time series of ‘errors and omissions’ relative to GDP indicates that the magnitude of this item is narrowing over time which is a welcome development.
• Seen vis-à-vis the efficiency of capital use (ICOR) trends, there is a clear movement downwards, which has enabled the same dose of capital formation leading to higher GDP growth contributed to a larger extent by services sector which is less capital intensive in nature. It may be mentioned that at the economy level, the ICOR has decreased to 4.2 during the Tenth Five Year Plan period as compared to 4.5 during the Ninth Five Year Plan.
II.g The savings and investment estimates are crucial in the decision making and planning process. They are used to compile incremental capital-output ratios (ICORs). The ICOR is a summary measure of the productivity of investment in the economy or the output generating capacity of incremental capital (ICOR = (capital employed - previous year capital employed) / (value of output - previous year value of output)). That is, the ratio of incremental capital to incremental output or the amount of incremental capital that goes to generate one unit of incremental output. The recent increases in the savings and investment rates indicate to some extent the lowering of the ICORs. As in the case of aggregates which hide inherent deficiencies at the detailed industry levels, the data on industry-wise deployment of capital formation is crucial in further identifying the key sectors of the economy, data on which are currently provided through national accounts statistics.
II.h Increasing evidences of a rise in efficiency in the economy is seen by the declining share of inputs - final use of commodities and services in gross value added (GVA). The share of inputs in the gross value added has come down to 49.7 per cent in 2003-04 as compared to 60.3 per cent in 1968-69.
II.i Another issue that has come into focus in the recent literature was that if the corporate sector’s savings is going up, the household sector’s savings would come down, to the extent that unincorporated entities, constituting a part of the household sector, get incorporated and such savings are reflected as corporate savings. An examination of the data since the 1950s shows a declining trend in the share of unincorporated sector. If this trend continues, as to be expected, the share of household savings as a percentage of GDP may decline correspondingly with a rise in corporate sector savings.
II.j In sum, the interpretational issues with regard to estimates of savings and investment are important to be assessed from time to time, as is the practice so far in India. In this connection, it is desirable to develop alternative data bases for these estimates for the constituent sectors so that savings estimates could be cross-validated with the help of appropriate alternative data bases, methodologies and surveys. In the absence of income-expenditure survey of households and household enterprises, there is no direct estimation of household savings and as a result, there is no cross validation of the indirect (residual) estimates of savings at present which is expected to be taken up in due course enabling cross-validation of savings of the predominant household sector. With regard to private corporate sector and the public sector, the issues of inadequate data coverage and local bodies and autonomous Government institutions, respectively, are the weak areas that need to be resolved.
The Impact of Financial Deepening on the Estimates of Savings
The HLC’s Observations
XI.a Going by a host of indicators, like credit-GDP ratio, M3-GDP ratio, and the flow of funds ratios, some degree of financial deepening has been taking place in the Indian economy. In absence of commensurate rise in financial savings, we need to accept that its effects are not being fully reflected in the estimates of household financial savings, contrary to the theoretical expectations. The HLC considered the possible reasons for the phenomenon of the financial deepening not being reflected in household financial savings.
XI.b In the case of household financial savings, the main issue is that the estimates of financial savings of the households are showing a decline over the recent years whereas the physical savings are showing an increasing trend. As mentioned earlier, the present dominance of physical savings over financial savings for the household sector can be explained keeping in view of the current economic developments like booming residential property market, increasing loan financing for housing, favourable demographic features of the economy, high salaries in sectors (like IT, finance and BPOs) with young skilled employees earning and having higher savings potentials and savers considering real Estate investment as a hedge against inflation. Secondly, non-residential component of physical assets, which have been presumably contributed by the unincorporated business enterprises are included in the household sector. The size of the unincorporated business enterprises is about 40 million at present.
XI.c As of the household financial savings, which is estimated net of household financial liabilities, the reason for a lower reflection of financial deepening on financial savings could be partly methodological, since household financial liabilities, which finance physical savings, are deducted from gross financial savings to arrive at the net financial savings. This apart, the following factors account for such a phenomenon:
• It may be stated that the indicators of financial deepening suggest that India is still at a lower rung as compared with many comparable countries in South-East Asia and other regions. Relative use of currency continues to remain high; the process of disintermediation or the emergence of alternative financial savings instruments, alternative to bank deposits, has been very weak. Bank deposits as percentage of total household financial savings have jumped from 35.1 per cent in 1999-2000 to 55.6 per cent in 2006-07. In this sense, diversification has hardly taken place in the Indian financial system.
•
Increased preference for physical savings vis-à-vis financial savings among households in the recent years is due to a host of factors such as high returns, social safety net and tax incentives accruing to physical savings especially in housing. In addition, there was a significant rise in the import of gold and silver, which in terms of Rupees, increased almost six times to Rs.71,848.3 crore in 2007-08 from Rs.11,778.6 crore in 1997-98.
• Within financial savings, over the years, while the postal savings attracted significant tax benefits, such benefits are accruing to bank deposits only recently.
•
Corporates have moved more in favour of self-financing instruments in recent years. The commercial bonds market has not developed well, thus, emerging as constraint to financial deepening.
XI.d Financial deepening in the system increases range of options available to business enterprises for financing, which help reduce their cost of borrowing and hence improves profitability and savings. The HLC notes that cross-country empirical evidence indicates that a better financial system could stimulate private consumption by providing more credit and reduces the need for maintaining high savings levels and, hence, concludes that financial deepening lowers the household savings rate. Higher demand generated in this way results in more business activity for the private corporate sector and help pushing up corporates’ investments and savings. Progressively increasing savings rate of the private corporate sector in last few years is indicative of this phenomenon.
XI.e To sum up, despite the significant development in the structure of the financial markets and introduction of innovative financial products, the availability of array of instruments has essentially been limited when compared to developed countries with regard to their returns, liquidity and risk characteristics. In this regard, it may be mentioned that with the efforts of the RBI towards the financial inclusion and financial literacy, the impact of financial deepening is likely to better reflect in the estimates of household financial savings.
Issues related to Compilation of Flow-of-Funds Accounts
XII.a Cooperative sector data: All efforts should be undertaken to improve the time gap in the publication ‘Statistical Statements Relating to the Co-operative Movement in India (Credit and Non-credit societies)’, a process that is said to be underway at the NABARD.
XII.b In the light of genuine difficulties expressed by NABARD in regularly compiling the comprehensive data, NABARD may endeavour undertaking “projections”, which could be revised when firm data become available. The data issues need to engage the attention of the highest level in NABARD. In this context, the HLC recommends that NABARD should be involved in providing a projection of household deposits in co-operative banks and credit societies to get around the problem of considerable time-lag in the publication such as ‘Statistical Statements Relating to the Co-operative Movement in India (Credit and Non-credit societies)’.
XII.c NABARD should continue in its role as the nodal agency for the co-operative sector and provide data for the compilation of national accounts, savings estimates and FoF accounts in so far as the cooperative sector is concerned (Annexes A6.5.3 and A6.5.4). In this regard, NABARD may collaborate with National Federation of State Co-operative Banks (NAFSCOB), National Cooperative Union of India (NCUI) as these agencies are publishing some basic data on credit and non-credit societies.
XII.d Treatment of non-banking companies: Since there exists large data gap in the estimation of non-banking companies, because of non-inclusion of a wide array of unregistered companies, the HLC recommends that a census should collect data on assets, liabilities, income and expenditure of NBFCs including the unregistered/exempted category of NBFCs. The census should be conducted by DSIM, RBI in collaboration with the Ministry of Corporate Affairs, Government of India.
XII.e The HLC recommends that the data emerging from the census on the assets/ liabilities position of the NBFCs should be appropriately incorporated in the flow-of-funds accounts also.
XII.f In respect of companies registered with the RBI, data for registered companies have to be firmed up with appropriate consolidation and follow up if response is weak. For the unregistered companies, sample studies will have to be undertaken and their results will have to be used after establishing proper blow-up factors.
XII.g Consolidated data on the insurance sector: The RBI may approach the IRDA to provide combined balance sheet for all insurance institutions – public and private - as per the flow-of-funds format. This will go a long way in the IRDA providing an alternative database not only for ‘life fund’ but also for flow-of-funds compilation at the RBI from time to time (A6.5.6).
XII.h Consolidated data for capital market institutions: The SEBI may collect the consolidated balance sheet position for all registrars and broker houses and provide the data to the RBI as per the flow-of-funds format (Annex A6.5.2) to be forwarded by the RBI, so that the same can be incorporated in the FoF accounts.
XII.i The HLC recommends that the consolidated Statements of assets/liabilities of all capital market institutions (namely, merchant bankers and registered brokers) should be compiled by the SEBI or have them compiled and forwarded to RBI for compilation of flow-of-funds account of the Indian economy.
XII.j Ownership of Government securities: The HLC recommends that an appropriate format as prescribed in this Report on the ownership pattern of Government securities (consolidated for all levels of Government), comprising six categories, viz., 1) Government , 2) Banks, 3) Financial Sector other than Banks, 4) Non-Service Sector (Corporates, Firms and Societies), 5) External Sector and 6) Household Sector, may be prepared by the RBI to provide the data based on the revised format (Annex A6.4) as at end-March every year, so that the residual status can be accorded to household (as defined in national accounts and FoF framework) in this instrument. The concerned Department within the RBI should ensure the providing of such information for estimation of household financial savings estimates.
XII.k In respect of the accounts of local authorities, only the data for port trusts are available. In this regard, the data for the local self Government may also be provided to enhance the coverage of flow-of- funds accounts.
Estimation of Farm Sector Savings
HLC’s Observation
XIII.a Presently, there are no estimates of farm sector savings undertaken in the country. Although it is difficult to arrive at savings estimates of the farm sector given the unorganised and uncertain nature of the sector, such estimates could be had by conducting national level sample surveys by the NSSO at regular intervals. Given the importance of this sector in the country’s economic growth, the savings estimates of this sector can’t be overlooked. The estimation of savings based on the NSSO Surveys during 2002-03 reveals that there are dis-savings in the farm sector. Resultantly, the gap between the amount of savings and investment in the farm sector appears to be wide. Given the imperative need of enhancing the level of investment in the farm sector, concerted efforts have to be made for generation and mobilisation of savings in order to realise the desired growth potential of the agriculture sector. The trends in the farm sector investment reveal that agriculture is losing its share in the total investment particularly more rapidly during the decade of 1990s and onwards led mainly by the loss in the momentum of public sector. Even though the GCF to agricultural GDP ratio has revived in the recent period, it remains below the desired level and, hence, need to be improved substantially to achieve the desired trajectory of farm sector growth.
Treatment of pure households (consumer households)
Recommendation
XIV.a In this regard, the HLC had detailed interaction with the apex financial bodies (namely, RBI, SEBI, NABARD and NHB) which are regulatory authorities for important instruments (namely, shares and debentures, cooperative deposits, investment and credit etc.). Detailed formats for such instruments of financial savings deployed by household disaggregated along the lines like, farmers and pure households have been devised. Once these alternative data base develop, it is thought that one will be in a position to make an estimate of savings by pure households, farmers, household enterprises and unincorporated bodies.
• The HLC, after due deliberations on the concept and methodology presently followed to estimate savings, feels that it is not possible to go for separate estimation of household savings for ‘pure households (consumer households)’. This is mainly due to the methodological practice in national accounts currently in vogue to accord a residual treatment for households, given that households in a residual sense represents composite households - incorporating ‘pure households’ as well as others. The HLC feels that the three steps suggested below will enable the disaggregated estimation of household savings in future to some extent:
(i) Detailed instrument-wise data of select financial savings in respect of pure households, farmers, household enterprises and unincorporated bodies, if made available by the concerned institutions.
(ii) Once the comprehensive income–expenditure survey of the household sector is available, an attempt can be made to estimate the savings of the pure households. It is important that to be able to get the savings estimates disaggregated along the lines of the national account concept of households (namely, for the unincorporated enterprises etc.), the Enterprise Survey is conducted concurrent with the income-expenditure survey.
(iii) An appropriate design of the survey format is important in this context to be able to obtain State-level estimates of savings for the components of the household sector.
Treatment of Current Transfers
XV.a The HLC recognises that in the event of a shift to direct estimation of household savings, the issue of treatment of current transfers would assume significance. This is because as the amount of current transfers that the households receive from ‘rest of the world’ and their current expenditure out of this need to be captured through either (i) through studying the pattern from the banking channels, and/or (ii) household surveys of income and expenditure. Under option (i), it would be required of the RBI to make available the survey results based on banking channel well in time. Therefore, the HLC recommends that, as of now, the treatment of remittances in vogue i.e., the CSO treating remittances as a part of personal disposable income and the FoF accounts continuing to capture remittances’ impact on instruments of savings to the extent they get embedded in the domestic sector through increase in the household financial savings instruments, namely, deposits, insurance, shares and debentures, etc) may be continued till we completely switch over to the direct (survey) method of estimation of household savings.
|
A6.1: Financial Assets and Liabilities of the Household Sector -Rates and Ratios Used and Data Source |
Item |
Rates/Ratio |
Source |
Comments |
Financial Assets |
|
|
|
1. Currency |
93% of Currency with Public |
DMB, DEAP RBI |
Historical ratio |
2. Bank Deposits |
|
|
|
2.1 Commercial Banks |
Form X data |
DSIM, RBI |
one year lag in availability of data |
| |
Deposit Survey 2005 (Current 12.6%, Saving 24.4% and Fixed 63.0%) |
DSIM, RBI |
one year lag in availability of data |
| |
4 Years Average for household share: Current 49.76%, Savings 90.75% and Fixed 61.87% |
DSIM, RBI |
Due to non- availability of survey for estimation |
| |
Subtract NRD with ratio Savings deposits 3.6%and for Term deposit 96.4% |
DNISFF, RBI |
Historical ratio. The last survey period is not known |
2.2 Co-Operative Bank & Credit Societies |
on DMB, DEAP data for Co-op Banks, NABARD 133.8% applied and from that 61.60% for household share and flow is taken |
NABARD |
NABARD data is available upto 2001-02 |
2.3 Co-Operative Non-Credit Societies |
3 years Average |
|
|
3. Non-banking Deposits |
|
Studies on Finances of public Ltd., Companies of Private Ltd. Companies DSIM, RBI Survey on “growth of Deposit with Non-Banking Companies” |
The survey was discontinued after 1995-96 |
3.1 Financial Companies |
|
|
|
a) Government |
Total of DNBS and NHB data, of which 85% is accounted for Government . |
DNBS , RBI (Public Deposits and Other Borrowings) and NHB (Regulated Deposits & Exempted Borrowing) Statement. |
The last survey was carried out in 1995-96 |
| b) Non-Government |
15% is posted as non-Government |
|
|
A6.1: Financial Assets and Liabilities of the Household Sector -Rates and Ratios Used and Data Source (Contd.) |
Item |
Rates/Ratio |
Source |
Comments |
| |
3.2 |
Non-Financial Companies |
3 years average |
Company finance study |
The global paid-up capital figures for non-financial companies are not available for the year of estimation. |
| |
|
a) |
Government |
15% of total |
|
The last survey was carried out in 1995-96 |
| |
|
b) |
Non-Government |
85% of total |
|
|
| |
3.3 |
Electricity Boards |
3 years average |
State Electricity Board |
The last survey was done in 2000-01 |
4. |
Life Insurance Fund |
| |
|
Actual data |
LIC (Life Fund) data |
|
| |
4.2 |
Life Fund of Pvt. Insurance Companies |
Actual data from their Annual Report -Balance sheet |
(Policy holder) data from Pvt. insurance companies |
|
| |
4.3 |
Postal insurance & Life Annuity fund |
Public Account of India - net figures sourced from website: http://Indiabudget.nic.in |
Annual financial Statement of the Central Government |
|
| |
4.4 |
Central Government . Insurance Fund. |
3 years average |
CSO data (up-to 2005-06 data is published) |
One year lag in the availability of data |
| |
4.5 |
State Government Insurance Fund |
3 years average |
CSO data (up-to 2005-06 data is published) |
One year lag in the availability of data |
5. |
Provident & Pension Funds |
| |
5.1 |
Central Govt. provident Fund |
actual data |
Provisional accounts 2006-07 |
|
| |
5.2 |
Public Provident Fund |
actual data |
Provisional accounts 2006-07 |
|
| |
5.3 |
State Govt. Provident Fund |
actual data |
DSLF data, RBI |
|
| |
5.4 |
Non-Govt. Provident Funds |
3 years average |
CSO data (up-to 2005-06 data is published) |
One year lag in the availability of data |
| |
5.5 |
Pension Funds |
3 years average |
CSO data (up-to 2005-06 data is published) |
One year lag in the availability of data |
A6.1: Financial Assets and Liabilities of the Household Sector -Rates and Ratios Used and Data Source (Contd.) |
Item |
Rates/Ratio |
Source |
Comments |
| |
5.6 |
New Pension Scheme |
Actual data |
Data received for the first time from MoF, Delhi in July 2007 for the period since 2003-04 onwards |
Newly added |
6. |
Claims on Government |
| |
6.1 |
Small Savings |
Actual data |
Provisional account 06-07 Statement of (Receipts, Expenditure & financing) |
|
| |
6.2 |
Investment in Govt. securities |
Actual data |
From the publication ‘An Economic & Functional Classification’ data is taken on the item Market Borrowing less Repayment for State and central Government securities. Then applied is 0.06% for household for central govt. and 0.13% for State govt. securities and total is taken. |
The RBI survey of ownership of Government securities has been discontinued since 1992 |
| |
6.3 |
National Rural |
Actual data from DGBA |
|
|
| |
|
Development Bonds |
|
|
|
| |
6.4 |
National Deposits |
Actual data from DGBA |
|
|
| |
|
Scheme |
|
|
|
| |
6.5 |
Capital Investment |
Actual data from DGBA |
|
|
| |
|
Bonds |
|
|
|
| |
6.6 |
Deposits Scheme for |
Actual data from DGBA |
|
Scheme is closed |
| |
|
retiring Govt. Employees |
|
|
|
| |
6.7 |
Relief Bonds \ Savings |
Actual data from DGBA |
|
|
| |
|
Bonds |
(total relief bond & savings bond) |
|
|
| |
6.8 |
Compulsory Deposits |
DGBA is not reporting |
|
|
| |
6.9 |
Special Bearer Bonds |
Actual data from DGBA |
|
|
A6.1: Financial Assets and Liabilities of the Household Sector -Rates and Ratios Used and Data Source (Contd.) |
Item |
Rates/Ratio |
Source |
Comments |
7. |
Investment in Share & debenture including units of UTIMF |
| |
7.1 |
Banking |
|
|
|
| |
|
a) |
Commercial Bank |
3 years average |
|
|
| |
|
b) |
Co-op. Banks & credit Society |
3 years average |
NABARD |
Latest available data up-to 2001-02 |
| |
7.2 |
Units of Unit Trust of India |
Actual data on which household share of 36.19% is applied. |
Actual data of UTI |
|
| |
7.3 |
Mutual Funds (other than UTIMF) |
CMD, DEAP data on which household share of 42.35 % is applied as per the SEBI data. |
CMD, DEAP, RBI and SEBI |
|
| |
7.4 |
Private Corporate Business |
|
|
|
| |
|
a) |
Co-operative non-credit society |
3 years average |
|
Latest available data upto 2001-02 |
| |
|
b) |
Non-financial companies |
CMD data for share public non-financial companies 83.09% and Private. 34.81% (ratio) applied to CMD data for debentures of non-financial public limited companies 83.09% and for non-financial private limited companies 1.14% (ratio) applied at last for household share for equities 23% and for debenture 28.8% |
CMD, Ministry of Company Affairs, DSIM sample survey of Public and Private Limited Companies. |
The global paid-up capital figures for non-financial companies are not available for the year of estimation. |
| |
|
c) |
Financial & Investment companies |
3 years average |
CMD, Ministry of Company Affairs, DSIM |
The global paid-up capital figures for non- |
sample survey of Public |
financial companies are |
and Private Limited |
not available for the |
Companies. |
year of estimation. |
| |
7.5 |
Public sector Bonds |
3 years average |
Ministry of Finance |
Latest available data upto 2003 |
8 |
Trade Debt (Net) |
3 years average |
RBI sample survey on |
The global paid-up |
Public & Private limited |
capital figures for non- |
companies and global |
financial companies are |
paid-up capital from |
not available for the year |
Ministry o f Company Affairs |
of estimation. |
| |
8.1 |
Non-financial companies |
Same |
same |
Same |
| |
8.2 |
Fin. & investment companies\corporation |
Same |
same |
Same |
A6.1: Financial Assets and Liabilities of the Household Sector -Rates and Ratios Used and Data Source (Concld.) |
Item |
Rates/Ratio |
Source |
Comments |
B. FINANCIAL LIABILITIES |
|
|
|
1. |
Loans and Advances from Banks |
| |
1.1 |
Reserve Bank of India |
Actual data from DAD, RBI |
|
|
| |
1.2 |
Commercial banks |
Data on aggregate credit provided by Commercial bank is available from DMB, BSR 2006 survey on “Organisation-wise Classification of Outstanding, Credit of Scheduled Commercial Bank according to Occupation” is used to work out the ratio of household sector. This ratio was 37%. |
BSR Survey “Organisation-wise classification of outstanding, credit of scheduled commercial bank according to Occupation” |
The survey is available with one year lag. |
| |
1.3 |
Co-operative Banks & credit societies |
3 years average |
NABARD |
NABARD data is available upto 2001-02 |
2. |
Loans and advances from OFI |
| |
2.1 |
Financial corporations |
3 years average |
NAS Statement No 73 |
One year lag in availability of actual data |
| |
2.2 |
Insurance companies |
3 years average |
NAS Statement No 73 |
One year lag in availability of actual data |
| |
2.3 |
Financial Investment companies |
3 years average |
NAS Statement No 73 |
One year lag in availability of actual data |
3. |
Loans and advances from Co-op. non-credit society |
3 years average |
NABARD |
NABARD data is available upto 2001-02 |
4. |
Loans and advances from Govt. |
| |
4.1 |
Central Government |
3 years average |
CSO data available up- |
One year lag in |
| |
|
|
|
to 2005-06 |
availability of actual data |
| |
4.2 |
State Governments |
actual data |
DSLF, DEAP, RBI |
|
| |
4.3 |
Electricity Boards |
3 years average |
State Electricity Boards |
The last survey was done for 2000-01. |
A6.2: Trends in ‘Currency Component in Households Savings’ under Assumptions of Different Proportions of ‘Currency with Public’ |
| |
1995-96 |
1996-97 |
1997-98 |
1998-99 |
1999-00 |
2000-01 |
I. |
Currency with Households at 85 per cent of Currency with Public Household Currency Savings as: |
|
|
|
|
|
|
| |
(a) |
Percentage to GDP |
1.3 |
0.9 |
0.8 |
1.1 |
1.0 |
0.7 |
| |
(b) |
Percentage to GFS of Households |
12.1 |
7.9 |
6.8 |
9.6 |
8.1 |
5.8 |
| |
(c) |
Percentage to GDS |
5.2 |
4.0 |
3.2 |
5.1 |
3.9 |
2.9 |
II. |
Currency with Households at 88 per cent of Currency with Public Household Currency Savings as: |
|
|
|
|
|
|
| |
(a) |
Percentage to GDP |
1.3 |
0.9 |
0.8 |
1.2 |
1.0 |
0.7 |
| |
(b) |
Percentage to GFS of Households |
12.6 |
8.1 |
7.0 |
10.0 |
8.4 |
6.0 |
| |
(c) |
Percentage to GDS |
5.4 |
4.1 |
3.3 |
5.3 |
4.1 |
3.0 |
III. |
Currency with Households at 90 per cent of Currency with Public Household Currency Savings as: |
|
|
|
|
|
|
| |
(a) |
Percentage to GDP |
1.4 |
1.0 |
0.8 |
1.2 |
1.0 |
0.7 |
| |
(b) |
Percentage to GFS of Households |
12.9 |
8.3 |
7.2 |
10.2 |
8.5 |
6.1 |
| |
(c) |
Percentage to GDS |
5.5 |
4.2 |
3.4 |
5.4 |
4.2 |
3.0 |
IV. |
Currency with Households at 93 per cent of Currency with Public Household Currency Savings as: |
|
|
|
|
|
|
| |
(a) |
Percentage to GDP |
1.4 |
1.0 |
0.8 |
1.2 |
1.1 |
0.7 |
| |
(b) |
Percentage to GFS of Households |
13.3 |
8.6 |
7.4 |
10.5 |
8.8 |
6.3 |
| |
(c) |
Percentage to GDS |
5.7 |
4.4 |
3.5 |
5.6 |
4.3 |
3.1 |
V. |
Currency with Households at 95 per cent of Currency with Public Household Currency Savings as: |
|
|
|
|
|
|
| |
(a) |
Percentage to GDP |
1.4 |
1.0 |
0.9 |
1.3 |
1.1 |
0.8 |
| |
(b) |
Percentage to GFS of Households |
13.6 |
8.8 |
7.6 |
10.8 |
9.0 |
6.4 |
| |
(c) |
Percentage to GDS |
5.8 |
4.5 |
3.6 |
5.7 |
4.4 |
3.2 |
VI. |
Currency with Households at 98 per cent of Currency with Public Household Currency Savings as: |
|
|
|
|
|
|
| |
(a) |
Percentage to GDP |
1.5 |
1.1 |
0.9 |
1.3 |
1.1 |
0.8 |
| |
(b) |
Percentage to GFS of Households |
14.0 |
9.1 |
7.8 |
11.1 |
9.3 |
6.6 |
| |
(c) |
Percentage to GDS |
6.0 |
4.6 |
3.7 |
5.9 |
4.5 |
3.3 |
A6.2: Trends in ‘Currency Component in Households Savings’ under Assumptions of Different Proportions of ‘Currency with Public’ (Concld.) |
| |
2001-02 |
2002-03 |
2003-04 |
2004-05 |
2005-06 |
2006-07 |
I. |
Currency with Households at 85 per cent of Currency with Public Household Currency Savings as: |
|
|
|
|
|
|
| |
(a) |
Percentage to GDP |
1.2 |
1.1 |
1.4 |
1.1 |
1.3 |
1.4 |
| |
(b) |
Percentage to GFS of Households |
9.0 |
8.1 |
10.3 |
7.8 |
8.0 |
7.9 |
| |
(c) |
Percentage to GDS |
5.0 |
4.0 |
4.8 |
3.4 |
3.9 |
4.2 |
II. |
Currency with Households at 88 per cent of Currency with Public Household Currency Savings as: |
|
|
|
|
|
|
| |
(a) |
Percentage to GDP |
1.2 |
1.1 |
1.5 |
1.1 |
1.4 |
1.5 |
| |
(b) |
Percentage to GFS of Households |
9.3 |
8.4 |
10.7 |
8.1 |
8.3 |
8.2 |
| |
(c) |
Percentage to GDS |
5.1 |
4.2 |
4.9 |
3.5 |
4.0 |
4.3 |
III |
.Currency with Households at 90 per cent of Currency with Public Household Currency Savings as: |
|
|
|
|
|
|
| |
(a) |
Percentage to GDP |
1.2 |
1.1 |
1.5 |
1.1 |
1.4 |
1.5 |
| |
(b) |
Percentage to GFS of Households |
9.5 |
8.6 |
10.9 |
8.2 |
8.4 |
8.3 |
| |
(c) |
Percentage to GDS |
5.3 |
4.3 |
5.0 |
3.6 |
4.1 |
4.4 |
IV. |
Currency with Households at 93 per cent of Currency with Public Household Currency Savings as: |
|
|
|
|
|
|
| |
(a) |
Percentage to GDP |
1.3 |
1.2 |
1.5 |
1.2 |
1.5 |
1.6 |
| |
(b) |
Percentage to GFS of Households |
9.8 |
8.9 |
11.3 |
8.5 |
8.7 |
8.6 |
| |
(c) |
Percentage to GDS |
5.4 |
4.4 |
5.2 |
3.7 |
4.2 |
4.5 |
V. |
Currency with Households at 95 per cent of Currency with Public Household Currency Savings as: |
|
|
|
|
|
|
| |
(a) |
Percentage to GDP |
1.3 |
1.2 |
1.6 |
1.2 |
1.5 |
1.6 |
| |
(b) |
Percentage to GFS of Households |
10.0 |
9.1 |
11.6 |
8.7 |
8.9 |
8.8 |
| |
(c) |
Percentage to GDS |
5.5 |
4.5 |
5.3 |
3.8 |
4.3 |
4.6 |
VI |
Currency with Households at 98 per cent of Currency with Public Household Currency Savings as: |
|
|
|
|
|
|
| |
(a) |
Percentage to GDP |
1.3 |
1.2 |
1.6 |
1.2 |
1.5 |
1.7 |
| |
(b) |
Percentage to GFS of Households |
10.3 |
9.4 |
11.9 |
9.0 |
9.2 |
9.1 |
| |
(c) |
Percentage to GDS |
5.7 |
4.7 |
5.5 |
3.9 |
4.5 |
4.8 |
A6.3: Financial Assets and Liabilities of the
Household Sector |
Item |
Financial Assets (Gross) |
1. |
Currency |
2. |
Bank Deposits |
| |
2.1 |
Commercial Banks |
| |
2.2 |
Co-operative Banks & Credit Societies |
| |
2.3 |
Co-operative Non-Credit Societies |
3. |
Non-banking Deposits |
| |
3.1 |
Financial Companies |
| |
|
a) Government |
| |
|
b) Non-Government |
| |
3.2 |
Non-financial Companies |
| |
|
a) Government |
| |
|
b) Non-Government |
| |
3.3 |
Electricity Boards |
4. |
Life Insurance Fund |
| |
4.1 |
Life Fund of LIC |
| |
4.2 |
Life Fund of Private Insurance Cos. |
| |
4.3 |
Postal Ins.& Life Annuity Fund |
| |
4.4 |
Central Government Insurance Fund |
| |
4.5 |
State Government Insurance Fund |
5. |
Provident & Pension Funds |
| |
5.1 |
Central Government Provident Fund |
| |
5.2 |
Public Provident Fund |
| |
5.3 |
State Government Provident Fund |
| |
5.4 |
Non-Government Provident Funds |
| |
5.5 |
Pension Funds |
| |
5.6 |
New Pension Scheme |
6. |
Claims on Government |
| |
6.1 |
Small Savings |
| |
6.2 |
Investment in Government securities |
| |
6.3 |
National Rural Development Bonds |
| |
6.4 |
National Deposit Scheme |
| |
6.5 |
Capital Investment Bonds |
| |
6.6 |
Deposit Scheme for retiring Government Employees |
| |
6.7 |
Relief Bonds/Savings Bonds |
| |
6.8 |
Compulsory Deposits |
| |
6.9 |
Special Bearer bonds |
A6.3: Financial Assets and Liabilities of the Household Sector (Concld.) |
Item |
7. |
Investment in shares, debentures and mutual fund units |
| |
7.1 |
Banking |
| |
|
a) |
Commercial Banks |
| |
|
b) |
Co-operative Banks & Credit Societies |
| |
7.2 |
Mutual Funds Units |
| |
7.3 |
Private Corporate Business |
| |
|
a) |
Co-operative Non-credit Societies |
| |
|
b) |
Non-financial Companies |
| |
|
c) |
Financial & Investment Cos/Corps |
| |
7.4 |
Public Sector Bonds |
8. |
Trade Debt ( Net ) |
| |
8.1 |
Non-financial Companies |
| |
8.2 |
Financial & Investment Cos/Corps |
B. |
Financial Liabilities |
1. |
Loans and Advances from Banks |
| |
1.1 |
Reserve Bank of India |
| |
1.2 |
Commercial banks |
| |
1.3 |
Co-operative Banks & Credit Societies |
2. |
Loans and advances from Other Financial Institutions |
| |
2.1 |
Financial Corporations |
| |
2.2 |
Insurance Companies |
| |
2.3 |
Financial & Investment Companies |
3. |
Loans and Advances from Co-operative Non Credit Societies. |
4. |
Loans and Advances from Govt. |
| |
4.1 |
Central Government |
| |
4.2 |
State Government |
| |
4.3 |
Electricity Boards |
Savings in Financial Assets (Net)(A-B) |
A6.4: IDMD Data Format on Ownership of Central Government securities |
(Rupees crore) |
Category of Holders |
End-March |
2004 |
2005 |
2006 |
2007 |
2008 |
1 |
2 |
3 |
4 |
5 |
6 |
I. |
Government |
|
|
|
|
|
| |
Centre |
|
|
|
|
|
| |
State |
|
|
|
|
|
| |
Other approved bodies |
|
|
|
|
|
II. |
Banks |
|
|
|
|
|
| |
a. |
Reserve Bank of India |
|
|
|
|
|
| |
b. |
PDO |
|
|
|
|
|
| |
c. |
Commercial Banks of which |
|
|
|
|
|
| |
|
i. |
State Bank of India and Associates |
|
|
|
|
|
| |
|
ii. |
Nationalised Banks |
|
|
|
|
|
| |
|
iii. |
Private Sector Banks |
|
|
|
|
|
| |
|
|
Old Private Sector Banks |
|
|
|
|
|
| |
|
|
New Private Sector Banks |
|
|
|
|
|
| |
|
iv. |
Foreign Banks |
|
|
|
|
|
| |
d. |
Co-operative Banks |
|
|
|
|
|
III. |
Financial Sector Other than Banks |
|
|
|
|
|
| |
a. |
Financial Institutions |
|
|
|
|
|
| |
b. |
Insurance Companies |
|
|
|
|
|
| |
|
i. |
Life Insurance Corporation Co.Ltd. |
|
|
|
|
|
| |
|
ii. |
General Insurance Corporation Co.Ltd. |
|
|
|
|
|
| |
|
iii. |
New India Assurance Co.Ltd. |
|
|
|
|
|
| |
|
iv. |
National Insurance Co.Ltd. |
|
|
|
|
|
| |
|
v. |
United India Insurance Co.Ltd. |
|
|
|
|
|
| |
|
vi. |
Oriental Fire and |
|
|
|
|
|
| |
|
|
General Insurance Co.Ltd. |
|
|
|
|
|
| |
|
vii |
Other Insurance Companies |
|
|
|
|
|
| |
c. |
Primary Dealers |
|
|
|
|
|
| |
d. |
Gilt Funds |
|
|
|
|
|
| |
e. |
Mutual Funds |
|
|
|
|
|
| |
|
i. |
UTI |
|
|
|
|
|
| |
|
ii. |
Other Mutual Funds |
|
|
|
|
|
| |
f. |
Provident Funds |
|
|
|
|
|
| |
g. |
Clearing Corporation of India |
|
|
|
|
|
IV. |
Non-Service Sector |
|
|
|
|
|
| |
a. |
Corporates |
|
|
|
|
|
| |
b. |
Firms |
|
|
|
|
|
| |
c. |
Societies |
|
|
|
|
|
V. |
External Sector |
|
|
|
|
|
| |
a. |
NRI |
|
|
|
|
|
| |
b. |
FIIs |
|
|
|
|
|
VI. |
Household Sector |
|
|
|
|
|
| |
a. |
Individuals |
|
|
|
|
|
| |
b. |
Trusts |
|
|
|
|
|
| |
c. |
Unincorporated enterprises of Farm business |
|
|
|
|
|
| |
d. |
Unincorporated enterprises of Non-farm business |
|
|
|
|
|
| |
e. |
Non-profit institutions |
|
|
|
|
|
| |
f. |
Self Help Groups |
|
|
|
|
|
Total (I to VI) |
|
|
|
|
|
A6.4: IDMD Data Format on Ownership of State Government
securities (Contd.) |
(Rupees crore) |
Category of Holders |
End-March |
| |
2004 |
2005 |
2006 |
2007 |
2008 |
1 |
2 |
3 |
4 |
5 |
6 |
I. |
Government |
|
|
|
|
|
| |
Centre |
|
|
|
|
|
| |
State |
|
|
|
|
|
| |
Other approved bodies |
|
|
|
|
|
II. |
Banks |
|
|
|
|
|
| |
a. |
Reserve Bank of India |
|
|
|
|
|
| |
b. |
PDO |
|
|
|
|
|
| |
c. |
Commercial Banks of which |
|
|
|
|
|
| |
|
i. |
State Bank of India and Associates |
|
|
|
|
|
| |
|
ii. |
Nationalised Banks |
|
|
|
|
|
| |
|
iii. |
Private Sector Banks |
|
|
|
|
|
| |
|
|
Old Private Sector Banks |
|
|
|
|
|
| |
|
|
New Private Sector Banks |
|
|
|
|
|
| |
|
iv. |
Foreign Banks |
|
|
|
|
|
| |
d. |
Co-operative Banks |
|
|
|
|
|
III. |
Financial Sector Other than Banks |
|
|
|
|
|
| |
a. |
Financial Institutions |
|
|
|
|
|
| |
b. |
Insurance Companies |
|
|
|
|
|
| |
|
i. |
Life Insurance Corporation Co.Ltd. |
|
|
|
|
|
| |
|
ii. |
General Insurance Corporation Co.Ltd. |
|
|
|
|
|
| |
|
iii. |
New India Assurance Co.Ltd. |
|
|
|
|
|
| |
|
iv. |
National Insurance Co.Ltd. |
|
|
|
|
|
| |
|
v. |
United India Insurance Co.Ltd. |
|
|
|
|
|
| |
|
vi. |
Oriental Fire and General Insurance Co.Ltd. |
|
|
|
|
|
| |
|
vii |
Other Insurance Companies |
|
|
|
|
|
| |
c. |
Primary Dealers |
|
|
|
|
|
| |
d. |
Gilt Funds |
|
|
|
|
|
| |
e. |
Mutual Funds |
|
|
|
|
|
| |
|
i. |
UTIMF |
|
|
|
|
|
| |
|
ii. |
Other Mutual Funds |
|
|
|
|
|
| |
f. |
Provident Funds |
|
|
|
|
|
| |
g. |
Clearing Corporation of India |
|
|
|
|
|
IV. |
Non-Service Sector |
|
|
|
|
|
| |
a. |
Corporates |
|
|
|
|
|
| |
b. |
Firms |
|
|
|
|
|
| |
c. |
Societies |
|
|
|
|
|
V. |
External Sector |
|
|
|
|
|
| |
a. |
NRI |
|
|
|
|
|
| |
b. |
FIIs |
|
|
|
|
|
VI. |
Household Sector |
|
|
|
|
|
| |
a. |
Individuals |
|
|
|
|
|
| |
b. |
Trusts |
|
|
|
|
|
| |
c. |
Unincorporated enterprises of Farm business |
|
|
|
|
|
| |
d. |
Unincorporated enterprises of Non-farm business |
|
|
|
|
|
| |
e. |
Non-profit institutions |
|
|
|
|
|
| |
f. |
Self Help Groups |
|
|
|
|
|
Total (I to VI) |
|
|
|
|
|
A6.4: IDMD Data Format on Ownership of Central and State Government
securities (Concld.) |
(Rupees crore) |
Category of Holders |
End-March |
2004 |
2005 |
2006 |
2007 |
2008 |
1 |
2 |
3 |
4 |
5 |
6 |
I. |
Government |
|
|
|
|
|
| |
Centre |
|
|
|
|
|
| |
State |
|
|
|
|
|
| |
Other approved bodies |
|
|
|
|
|
II. |
Banks |
|
|
|
|
|
| |
a. |
Reserve Bank of India |
|
|
|
|
|
| |
b. |
PDO |
|
|
|
|
|
| |
c. |
Commercial Banks of which |
|
|
|
|
|
| |
|
i. |
State Bank of India and Associates |
|
|
|
|
|
| |
|
ii. |
Nationalised Banks |
|
|
|
|
|
| |
|
iii. |
Private Sector Banks |
|
|
|
|
|
| |
|
|
Old Private Sector Banks |
|
|
|
|
|
| |
|
|
New Private Sector Banks |
|
|
|
|
|
| |
|
iv |
Foreign Banks |
|
|
|
|
|
| |
d. Co-operative Banks |
|
|
|
|
|
III. |
Financial Sector Other than Banks |
|
|
|
|
|
| |
a. |
Financial Institutions |
|
|
|
|
|
| |
b. |
Insurance Companies |
|
|
|
|
|
| |
|
i. |
Life Insurance Corporation Co.Ltd. |
|
|
|
|
|
| |
|
ii. |
General Insurance Corporation Co.Ltd. |
|
|
|
|
|
| |
|
iii. |
New India Assurance Co.Ltd. |
|
|
|
|
|
| |
|
iv |
National Insurance Co.Ltd. |
|
|
|
|
|
| |
|
v. |
United India Insurance Co.Ltd. |
|
|
|
|
|
| |
|
vi |
Oriental Fire and General Insurance Co.Ltd. |
|
|
|
|
|
| |
|
vii |
. Other Insurance Companies |
|
|
|
|
|
| |
c. |
Primary Dealers |
|
|
|
|
|
| |
d. |
Gilt Funds |
|
|
|
|
|
| |
e. |
Mutual Funds |
|
|
|
|
|
| |
|
i. |
UTIMF |
|
|
|
|
|
| |
|
ii. |
Other Mutual Funds |
|
|
|
|
|
| |
f. |
Provident Funds |
|
|
|
|
|
| |
g. |
Clearing Corporation of India |
|
|
|
|
|
IV. |
Non-Service Sector |
|
|
|
|
|
| |
a. |
Corporates |
|
|
|
|
|
| |
b. |
Firms |
|
|
|
|
|
| |
c. |
Societies |
|
|
|
|
|
V. |
External Sector |
|
|
|
|
|
| |
a. |
NRI |
|
|
|
|
|
| |
b. |
FIIs |
|
|
|
|
|
VI. |
Household Sector |
|
|
|
|
|
| |
a. |
Individuals |
|
|
|
|
|
| |
b. |
Trusts |
|
|
|
|
|
| |
c. |
Unincorporated enterprises of Farm business |
|
|
|
|
|
| |
d. |
Unincorporated enterprises of |
|
|
|
|
|
| |
|
Non-farm business |
|
|
|
|
|
| |
e. |
Non-profit institutions |
|
|
|
|
|
| |
f. |
Self Help Groups |
|
|
|
|
|
Total (I to VI) |
|
|
|
|
|
A6.5: Data Formats Requested from the Apex Financial Bodies |
A.6.5.1: SEBI Format for Data on Household Financial Savings |
Instruments of financial savings |
Subscription of institutions (In Rs. Lakh) -flows during the financial year |
(i) |
New Issues (Shares) |
i. |
Banking Sector |
| |
|
|
i.1 |
Reserve Bank of India |
| |
|
|
i.2 |
Scheduled Commercial Banks |
| |
|
|
i.3 |
Cooperative Banks and Credit Societies |
| |
|
ii. |
Other Financial Institutions |
| |
|
|
ii.1 |
Financial Corporations and companies (separately for |
| |
|
|
|
development financial institutions at all-India and State |
| |
|
|
|
levels, UTI, Mutual Funds, Non-banking financial and |
| |
|
|
|
investment companies, and Non-Government PFs) |
| |
|
|
ii.2 |
Insurance Sector |
| |
|
iii. |
Private Corporate Sector |
| |
|
|
iii.1 |
Private Non-financial companies |
| |
|
|
iii.2 |
Cooperative Non-credit Societies |
| |
|
iv. |
Government sector |
| |
|
|
iv.1 |
Central Government |
| |
|
|
iv.2 |
State Governments & UTs including their departmental commercial undertakings) |
| |
|
|
iv.3 |
Local Authorities (City corporations, municipalities, panchayats and port trusts) |
| |
|
|
iv.4 |
Government Non-departmental Non-financial undertakings |
| |
|
|
iv.5 |
State Electricity Boards |
| |
|
v. |
Rest of the World Sector (for FIIs, NRIs etc shown separately) |
| |
|
vi. |
Household Sector |
| |
|
|
vi.1 |
Individuals |
| |
|
|
vi.2 |
Trusts |
| |
|
|
vi.3 |
Unincorporated enterprises of Farm business |
| |
|
|
vi.4 |
Unincorporated enterprises of Non-farm business |
| |
|
|
vi.5 |
Self Help Groups |
(ii) |
New issues (Debentures) |
i. |
Banking Sector |
| |
|
|
i.1 |
Reserve Bank of India |
| |
|
|
i.2 |
Scheduled Commercial Banks |
| |
|
|
i.3 |
Cooperative Banks and Credit Societies |
A6.5: Data Formats Requested from the Apex Financial Bodies (Contd.) |
A.6.5.1: SEBI Format for Data on Household Financial Savings |
Instruments of financial savings |
Subscription of institutions (In Rs. Lakh) -flows during the financial year |
| |
|
ii. |
Other Financial Institutions |
| |
|
|
ii.1 |
Financial Corporations and companies (separately for development financial institutions at all-India and State levels, UTI, Mutual Funds, Non-banking financial and investment companies, and Non-Government PFs) |
| |
|
|
ii.2 |
Insurance Sector |
| |
|
iii. |
Private Corporate Sector |
| |
|
|
iii.1 |
Private Non-financial companies |
| |
|
|
iii.2 |
Cooperative Non-credit Societies |
| |
|
iv. |
Government sector |
| |
|
|
iv.1 |
Central Government |
| |
|
|
iv.2 |
State Governments & UTs including their departmental commercial undertakings) |
| |
|
|
iv.3 |
Local Authorities (City corporations, municipalities, panchayats and port trusts) |
| |
|
|
iv.4 |
Government Non-departmental Non-financial undertakings |
| |
|
|
iv.5 |
State Electricity Boards |
| |
|
v. |
Rest of the World Sector (for FIIs, NRIs etc shown separately) |
| |
|
vi. |
Household Sector |
| |
|
|
vi.1 |
Individuals |
| |
|
|
vi.2 |
Trusts |
| |
|
|
vi.3 |
Unincorporated enterprises of Farm business |
| |
|
|
vi.4 |
Unincorporated enterprises of Non-farm business |
| |
|
|
vi.5 |
Self Help Groups |
(iii) |
commercial bonds |
i. |
Banking Sector |
| |
|
|
i.1 |
Reserve Bank of India |
| |
|
|
i.2 |
Scheduled Commercial Banks |
| |
|
|
i.3 |
Cooperative Banks and Credit Societies |
| |
|
ii. |
Other Financial Institutions |
| |
|
|
ii.1 |
Financial Corporations and companies (separately for development financial institutions at all-India and State levels, UTI, Mutual Funds, Non-banking financial and investment companies, and Non-Government PFs) |
| |
|
|
ii.2 |
Insurance Sector |
A6.5: Data Formats Requested from the Apex Financial Bodies (Concld.) |
A.6.5.1: SEBI Format for Data on Household Financial Savings |
Instruments of financial savings |
Subscription of institutions (In Rs. Lakh) -flows during the financial year |
| |
iii. |
Private Corporate Sector |
| |
|
iii.1 |
Private Non-financial companies |
| |
|
iii.2 |
Cooperative Non-credit Societies |
| |
iv. |
Government sector |
| |
|
iv.1 |
Central Government |
| |
|
iv.2 |
State Governments & UTs including their departmental commercial undertakings) |
| |
|
iv.3 |
Local Authorities (City corporations, municipalities, panchayats and port trusts) |
| |
|
iv.4 |
Government Non-departmental Non-financial undertakings |
| |
|
iv.5 |
State Electricity Boards |
| |
v. |
Rest of the World Sector (for FIIs, NRIs etc shown separately) |
| |
vi. |
Household Sector |
| |
|
vi.1 |
Individuals |
| |
|
vi.2 |
Trusts |
| |
|
vi.3 |
Unincorporated enterprises of Farm business |
| |
|
vi.4 |
Unincorporated enterprises of Non-farm business |
| |
|
vi.5 |
Self Help Groups |
Annex 6.5.2 : SEBI Format For Data on Flow of Funds Statement on Registrars and Broker Houses |
(Rs. crore) |
Sources |
1. |
Paid-up |
| |
a) |
Banking |
| |
b) |
Other Financial Institutions |
| |
c) |
Government |
| |
d) |
Rest Of the World |
| |
e) |
Households |
2. |
Debentures |
| |
a) |
Banking |
| |
b) |
OFI |
| |
c) |
Government |
| |
d) |
Rest Of the World |
| |
e) |
Households |
3. |
Fixed Deposits |
| |
a) |
Households |
| |
b) |
Other Financial Institutions |
4. |
Borrowings |
| |
a) |
Banking |
| |
b) |
Other Financial Institutions |
| |
c) |
Government |
| |
d) |
Rest Of the World |
| |
e) |
Others |
5. |
Trade Credit (Net) |
6. |
Other Liabilities |
TOTAL |
Uses |
1. |
Cash in Hand |
| |
a) |
RBI Notes |
| |
b) |
One Rupee Notes |
2. |
Fixed Deposits |
| |
a) |
Commercial Banks |
| |
b) |
Co-operatives |
| |
c) |
Government |
3. |
Loans and Advances |
| |
a) |
Households |
| |
b) |
Others |
4. |
Investments |
| |
a) |
Co-operatives |
| |
b) |
Other Financial Institutions |
| |
c) |
Government |
| |
d) |
Rest Of the World |
| |
e) |
Others |
TOTAL |
A6.5.3: NABARD Format for the Data on Household Financial Savings |
Instruments of financial savings |
Subscription of institutions (In Rs. Lakh) -flows during the financial year |
(i) |
Deposits raised by Cooperative Banks |
i. |
Banking Sector |
| |
and Credit Societies |
|
i.1 |
Reserve Bank of India |
| |
|
|
i.2 |
Scheduled Commercial Banks |
| |
|
|
i.3 |
Cooperative Banks and Credit Societies |
| |
|
ii. |
Other Financial Institutions |
| |
|
|
ii.1 |
Financial Corporations and companies (separately for development financial institutions at all-India and State levels, UTI, Mutual Funds, Non-banking financial and investment companies, and Non-Government PFs) |
| |
|
|
ii.2 |
Insurance Sector |
| |
|
iii. |
Private Corporate Sector |
| |
|
|
iii.1 |
Private Non-financial companies |
| |
|
|
iii.2 |
Cooperative Non-credit Societies |
| |
|
iv. |
Government sector |
| |
|
|
iv.1 |
Central Government |
| |
|
|
iv.2 |
State Governments & UTs including their departmental |
| |
|
|
|
commercial undertakings) |
| |
|
|
iv.3 |
Local Authorities (City corporations, municipalities, |
| |
|
|
|
panchayats and port trusts) |
| |
|
|
iv.4 |
Government Non-departmental Non-financial undertakings |
| |
|
|
iv.5 |
State Electricity Boards |
| |
|
v. |
Rest of the World Sector (for FIIs, NRIs etc shown separately) |
| |
|
vi. |
Household Sector |
| |
|
|
vi.1 |
Individuals |
| |
|
|
vi.2 |
Trusts |
| |
|
|
vi.3 |
Unincorporated enterprises of Farm business |
| |
|
|
vi.4 |
Unincorporated enterprises of Non-farm business |
| |
|
|
vi.5 |
Self Help Groups |
(ii) |
Deposits raised by Cooperative Non- |
i. |
Banking Sector |
| |
Credit Societies |
|
i.1 |
Reserve Bank of India |
| |
|
|
i.2 |
Scheduled Commercial Banks |
| |
|
|
i.3 |
Cooperative Banks and Credit Societies |
A6.5.3: NABARD Format for the Data on Household Financial Savings (Contd.) |
Instruments of financial savings |
Subscription of institutions (In Rs. Lakh) -flows during the financial year |
| |
|
ii. |
Other Financial Institutions |
| |
|
|
ii.1 |
Financial Corporations and companies (separately for development financial institutions at all-India and State levels, UTI, Mutual Funds, Non-banking financial and investment companies, and Non-Government PFs) |
| |
|
|
ii.2 |
Insurance Sector |
| |
|
iii. |
Private Corporate Sector |
| |
|
|
iii.1 |
Private Non-financial companies |
| |
|
|
iii.2 |
Cooperative Non-credit Societies |
| |
|
iv. |
Government sector |
| |
|
|
iv.1 |
Central Government |
| |
|
|
iv.2 |
State Governments & UTs including their departmental commercial undertakings) |
| |
|
|
iv.3 |
Local Authorities (City corporations, municipalities, panchayats and port trusts) |
| |
|
|
iv.4 |
Government Non-departmental Non-financial undertakings |
| |
|
|
iv.5 |
State Electricity Boards |
| |
|
v. |
Rest of the World Sector (for FIIs, NRIs etc shown separately) |
| |
|
vi. |
Household Sector |
| |
|
|
vi.1 |
Individuals |
| |
|
|
vi.2 |
Trusts |
| |
|
|
vi.3 |
Unincorporated enterprises of Farm business |
| |
|
|
vi.4 |
Unincorporated enterprises of Non-farm business |
| |
|
|
vi.5 |
Self Help Groups |
(iii) |
Loans from Cooperative Banks and |
i. |
Banking Sector |
| |
Credit Societies |
|
i.1 |
Reserve Bank of India |
| |
|
|
i.2 |
Scheduled Commercial Banks |
| |
|
|
i.3 |
Cooperative Banks and Credit Societies |
| |
|
ii. |
Other Financial Institutions |
| |
|
|
ii.1 |
Financial Corporations and companies (separately for development financial institutions at all-India and State levels, UTI, Mutual Funds, Non-banking financial and investment companies, and Non-Government PFs) |
| |
|
|
ii.2 |
Insurance Sector |
A6.5.3: NABARD Format for the Data on Household Financial Savings (Contd.) |
Instruments of financial savings |
Subscription of institutions (In Rs. Lakh) -flows during the financial year |
| |
|
iii. |
Private Corporate Sector |
| |
|
|
iii.1 |
Private Non-financial companies |
| |
|
|
iii.2 |
Cooperative Non-credit Societies |
| |
|
iv. |
Government sector |
| |
|
|
iv.1 |
Central Government |
| |
|
|
iv.2 |
State Governments & UTs including their departmental |
| |
|
|
|
commercial undertakings) |
| |
|
|
iv.3 |
Local Authorities (City corporations, municipalities, |
| |
|
|
|
panchayats and port trusts) |
| |
|
|
iv.4 |
Government Non-departmental Non-financial |
| |
|
|
|
undertakings |
| |
|
|
iv.5 |
State Electricity Boards |
| |
|
v. |
Rest of the World Sector (for FIIs, NRIs etc shown separately) |
| |
|
vi. |
Household Sector |
| |
|
|
vi.1 |
Individuals |
| |
|
|
vi.2 |
Trusts |
| |
|
|
vi.3 |
Unincorporated enterprises of Farm business |
| |
|
|
vi.4 |
Unincorporated enterprises of Non-farm business |
| |
|
|
vi.5 |
Self Help Groups |
(iv) |
Loans from Cooperative Non- |
i. |
Banking Sector |
| |
Credit Societies |
|
i.1 |
Reserve Bank of India |
| |
|
|
i.2 |
Scheduled Commercial Banks |
| |
|
|
i.3 |
Cooperative Banks and Credit Societies |
| |
|
ii. |
Other Financial Institutions |
| |
|
|
ii.1 |
Financial Corporations and companies (separately for |
| |
|
|
|
development financial institutions at all-India and State |
| |
|
|
|
levels, UTI, Mutual Funds, Non-banking financial and |
| |
|
|
|
investment companies, and Non-Government PFs) |
| |
|
|
ii.2 |
Insurance Sector |
| |
|
iii. |
Private Corporate Sector |
| |
|
|
iii.1 |
Private Non-financial companies |
| |
|
|
iii.2 |
Cooperative Non-credit Societies |
| |
|
iv. |
Government sector |
| |
|
|
iv.1 |
Central Government |
A6.5.3: NABARD Format for the Data on Household Financial Savings |
Instruments of financial savings |
Subscription of institutions (In Rs. Lakh) -flows during the financial year |
| |
|
|
iv.2 |
State Governments & UTs including their departmental |
| |
|
|
iv.3 |
Local Authorities (City corporations, municipalities, panchayats and port trusts) |
| |
|
|
iv.4 |
Government Non-departmental Non-financial undertakings |
| |
|
|
iv.5 |
State Electricity Boards |
| |
|
v. |
Rest of the World Sector (for FIIs, NRIs etc shown separately) |
| |
|
vi. |
Household Sector |
| |
|
|
vi.1 |
Individuals |
| |
|
|
vi.2 |
Trusts |
| |
|
|
vi.3 |
Unincorporated enterprises of Farm business |
| |
|
|
vi.4 |
Unincorporated enterprises of Non-farm business |
| |
|
|
vi.5 |
Self Help Groups |
(v) |
Investment in Shares, debentures, and |
i. |
Banking Sector |
| |
bonds (to be shown separately for each of these categories) issued by |
|
i.1 |
Reserve Bank of India |
| |
Cooperative Banks and Credit Societies |
|
i.2 |
Scheduled Commercial Banks |
| |
|
|
i.3 |
Cooperative Banks and Credit Societies |
| |
|
ii. |
Other Financial Institutions |
| |
|
|
ii.1 |
Financial Corporations and companies (separately for development financial institutions at all-India and State levels, UTI, Mutual Funds, Non-banking financial and investment companies, and Non-Government PFs) |
| |
|
|
ii.2 |
Insurance Sector |
| |
|
iii. |
Private Corporate Sector |
| |
|
|
iii.1 |
Private Non-financial companies |
| |
|
|
iii.2 |
Cooperative Non-credit Societies |
| |
|
iv. |
Government sector |
| |
|
|
iv.1 |
Central Government |
| |
|
|
iv.2 |
State Governments & UTs including their departmental commercial undertakings) |
| |
|
|
iv.3 |
Local Authorities (City corporations, municipalities, panchayats and port trusts) |
| |
|
|
iv.4 |
Government Non-departmental Non-financial undertakings |
| |
|
|
iv.5 |
State Electricity Boards |
| |
|
v. |
Rest of the World Sector (for FIIs, NRIs etc shown separately) |
A6.5.3: NABARD Format for the Data on Household Financial Savings (Concld.) |
Instruments of financial savings |
Subscription of institutions (In Rs. Lakh) -flows during the financial year |
| |
|
vi. |
Household Sector |
| |
|
|
vi.1 |
Individuals |
| |
|
|
vi.2 |
Trusts |
| |
|
|
vi.3 |
Unincorporated enterprises of Farm business |
| |
|
|
vi.4 |
Unincorporated enterprises of Non-farm business |
| |
|
|
vi.5 |
SHGs |
(vi) |
Investment in Shares, debentures, and bonds (to be shown separately for each of these categories) issued by Cooperative Non-Credit Societies |
i. |
Banking Sector |
| |
|
|
i.1 |
Reserve Bank of India |
| |
|
|
i.2 |
Scheduled Commercial Banks |
| |
|
|
i.3 |
Cooperative Banks and Credit Societies |
| |
|
ii. |
Other Financial Institutions |
| |
|
|
ii.1 |
Financial Corporations and companies (separately for |
| |
|
|
|
development financial institutions at all-India and State |
| |
|
|
|
levels, UTI, Mutual Funds, Non-banking financial and |
| |
|
|
|
investment companies, and Non-Government PFs) |
| |
|
|
ii.2 |
Insurance Sector |
| |
|
iii. |
Private Corporate Sector |
| |
|
|
iii.1 |
Private Non-financial companies |
| |
|
|
iii.2 |
Cooperative Non-credit Societies |
| |
|
iv. |
Government sector |
| |
|
|
iv.1 |
Central Government |
| |
|
|
iv.2 |
State Governments & UTs including their departmental |
| |
|
|
|
commercial undertakings) |
| |
|
|
iv.3 |
Local Authorities (City corporations, municipalities, |
| |
|
|
|
panchayats and port trusts) |
| |
|
|
iv.4 |
Government Non-departmental Non-financial |
| |
|
|
|
undertakings |
| |
|
|
iv.5 |
State Electricity Boards |
| |
|
v. |
Rest of the World Sector (for FIIs, NRIs etc shown separately) |
| |
|
vi. |
Household Sector |
| |
|
|
vi.1 |
Individuals |
| |
|
|
vi.2 |
Trusts |
| |
|
|
vi.3 |
Unincorporated enterprises of Farm business |
| |
|
|
vi.4 |
Unincorporated enterprises of Non-farm business |
| |
|
|
vi.5 |
Self Help Groups |
A6.5.4: NABARD Flow of Funds Format for the Cooperative Sector for financial years 2002-03 onwards till date |
Statement on Co - Operative Banks and Credit Societies |
(Rs. Crore) |
Sources |
1. |
Paid-Up Capital |
| |
a) |
Non-Credit Societies |
| |
b) |
Government |
| |
c) |
Households |
| |
d) |
Others |
2. |
Debentures |
| |
a) |
Commercial Banks |
| |
b) |
Financial Corporations |
| |
c) |
Insurance |
| |
d) |
Government |
| |
e) |
Households |
3. |
Deposits |
| |
a) |
Non-Credit Societies |
| |
b) |
Local Bodies |
| |
c) |
Households |
| |
d) |
Others |
4. |
Borrowings |
| |
a) |
R B I |
| |
b) |
Commercial Banks |
| |
c) |
Other Financial Institutions |
| |
d) |
Government |
| |
e) |
Others |
5. |
Other Liabilities |
TOTAL |
A6.5.4: NABARD Flow of Funds Format for the Cooperative Sector for financial years 2002-03 onwards till date (Contd.) |
Statement on Co - Operative Banks and Credit Societies (Concld.) |
(Rs. Crore) |
Uses |
1. |
Cash in Hand |
| |
a) |
Reserve Bank Of India |
| |
b) |
One Rupee Notes and Coins |
2. |
Deposits |
| |
a) |
Reserve Bank Of India |
| |
b) |
Commercial Banks |
| |
c) |
Government |
| |
d) |
Others |
3. |
Loans and Advances |
| |
a) |
Non-Credit Societies |
| |
b) |
Households |
| |
c) |
Others |
4. |
Investments |
| |
a) |
Shares of Non-Credit Societies |
| |
b) |
Shares/Debentures of Other Financial Institutions |
| |
c) |
Government securities |
| |
d) |
Semi-Government securities |
| |
e) |
Others |
5. |
Other Assets |
TOTAL |
A6.5.5: IRDA Format for the Data on Household Financial Savings |
Instruments of financial savings |
Subscription of institutions (In Rs. Lakh) – flows during the financial year |
(i) |
Life Funds (Domestic) |
i. |
Household Sector |
| |
|
|
i.1 |
Individuals |
| |
|
|
i.2 |
Trusts |
| |
|
|
i.3 |
Unincorporated enterprises of Farm business |
| |
|
|
i.4 |
Unincorporated enterprises of Non-farm business |
(ii) |
Bonus to policy holders excluding Government’s share in profit, capital gains and old claims (These items may be shown separately) |
i. |
Household Sector |
| |
|
|
i.1 |
Individuals |
| |
|
|
i.2 |
Trusts |
| |
|
|
i.3 |
Unincorporated enterprises of Farm business |
| |
|
|
i.4 |
Unincorporated enterprises of Non-farm business |
| |
|
|
vi.5 |
Self Help Groups |
(iii) |
Loans and advances from the Insurance |
i. |
Banking Sector |
| |
Sector |
|
i.1 |
Reserve Bank of India |
| |
|
|
i.2 |
Scheduled Commercial Banks |
| |
|
|
i.3 |
Cooperative Banks and Credit Societies |
| |
|
ii. |
Other Financial Institutions |
| |
|
|
ii.1 |
Financial Corporations and companies (separately for development financial institutions at all-India and State levels, UTI, Mutual Funds, Non-banking financial and investment companies, and Non-Government PFs) |
| |
|
|
ii.2 |
Insurance Sector |
| |
|
iii. |
Private Corporate Sector |
| |
|
|
iii.1 |
Private Non-financial companies |
| |
|
|
iii.2 |
Cooperative Non-credit Societies |
A6.5.5: IRDA Format for the Data on Household Financial Savings (Concld.) |
Instruments of financial savings |
Subscription of institutions (In Rs. Lakh) – flows during the financial year |
| |
iv. |
Government sector |
| |
|
iv.1 |
Central Government |
| |
|
iv.2 |
State Governments & UTs including their departmental commercial undertakings) |
| |
|
iv.3 |
Local Authorities (City corporations, municipalities, panchayats and port trusts) |
| |
|
iv.4 |
Government Non-departmental Non-financial undertakings |
| |
|
iv.5 |
State Electricity Boards |
| |
v. |
Household Sector |
| |
|
v. 1 |
Individuals |
| |
|
v.2 |
Trusts |
| |
|
v.3 |
Unincorporated enterprises of Farm business |
| |
|
v.4 |
Unincorporated enterprises of Non-farm business |
| |
|
vi.5 |
Self Help Groups |
A6.5.6: IRDA Format for the Data on Flow of Funds of the Insurance Sector for financial year 2001-02 onwards till date |
Statement on Insurance Sector |
(Rs. Crore) |
Sources |
1. |
Paid-up Capital |
| |
a) |
Banking |
| |
b) |
Other financial institutions |
| |
c) |
Private Corporate Business sector |
| |
d) |
Government |
2. |
Life Fund |
| |
a) |
In India |
| |
b) |
Outside India |
3. |
Borrowings |
| |
a) |
Banking |
| |
b) |
Other financial institutions |
| |
c) |
Private Corporate Business sector |
| |
d) |
Government |
4. |
Other Liabilities |
| |
a) |
In India |
| |
b) |
Outside India |
TOTAL |
A6.5.6: IRDA Format for the Data on Flow of Funds of the Insurance Sector for financial year 2001-02 onwards till date(Contd.) |
Statement on Insurance Sector (Contd.) |
(Rs. Crore) |
Uses |
1. |
Cash in Hand |
2. |
Deposits |
| |
a) |
Reserve Bank of India |
| |
b) |
Commercial Banks |
| |
c) |
Co-operative Banks |
| |
d) |
Companies |
| |
e) |
Government |
| |
f) |
Rest of the World |
| |
g) |
Others |
3. |
Loans and Advances |
| |
a) |
Commercial banks |
| |
b) |
Financial Corporations |
| |
c) |
Private Corporate Business |
| |
|
i) |
Companies |
| |
|
ii) |
Non-credit Societies |
| |
d) |
Government |
| |
|
i) |
State and Union Territories |
| |
|
ii) |
Local Authorities |
| |
|
iii) |
Electricity Boards |
| |
|
iv) |
Commercial Undertakings |
| |
e) |
Rest of the World |
| |
f) |
Households |
| |
g) |
Others |
4. |
Investments |
| |
a) |
Banking |
| |
i) |
Commercial banks |
| |
ii) |
Co-operatives |
A6.5.6: IRDA Format for the Data on Flow of Funds of the Insurance Sector for financial year 2001-02 onwards till date (Concld.) |
Statement on Insurance Sector (Concld.) |
(Rs. Crore) |
Uses |
| |
b) |
Financial Corporations |
| |
|
i) |
Shares |
| |
|
ii) |
Debentures |
| |
|
iii) |
Units of UTI Mutual Fund |
| |
c) |
Private Corporate Business |
| |
|
i) |
Companies |
| |
|
|
(1) |
Shares |
| |
|
|
(2) |
Debentures |
| |
|
ii) |
Non-credit Societies |
| |
d) |
Government |
| |
|
i) |
Central Government securities |
| |
|
ii) |
State Government securities |
| |
|
iii) |
Local Authorities |
| |
|
iv) |
Electricity Boards |
| |
|
v) |
Commercial Undertakings |
| |
e) |
Rest of the World |
| |
f) |
Others |
5. |
Other Assets |
| |
a) |
Banking |
| |
b) |
Other financial institutions |
| |
c) |
Private Corporate Business sector |
| |
d) |
Government |
| |
e) |
Rest of the world |
| |
f) |
Others |
TOTAL |
A6.6: State-wise shares in Number of Branches and Deposits of Total and Sampled Branches as on March 31, 2006 |
S. No. |
State/UT |
Share in number of branches (Per Cent) |
Share in Deposits (Per Cent) |
Total |
Selected in Sample |
Total |
Selected in Sample |
1 |
2 |
3 |
4 |
5 |
6 |
1 |
Andaman & Nicobar Island |
0.05 |
0.18 |
0.04 |
0.06 |
2 |
Andhra Pradesh |
7.92 |
7.11 |
5.61 |
4.42 |
3 |
Arunachal Pradesh |
0.10 |
0.25 |
0.07 |
0.08 |
4 |
Assam |
1.80 |
1.60 |
1.00 |
0.73 |
5 |
Bihar |
5.22 |
4.05 |
2.22 |
1.06 |
6 |
Chandigarh |
0.29 |
0.74 |
0.88 |
1.23 |
7 |
Chhattlsgarh |
1.51 |
1.47 |
0.98 |
0.71 |
8 |
Dadra&Nagar Havell |
0.02 |
0.10 |
0.02 |
0.04 |
9 |
Daman & Diu |
0.02 |
0.14 |
0.04 |
0.07 |
10 |
Delhi |
2.44 |
5.56 |
12.73 |
19.65 |
11 |
Goa |
0.50 |
0.70 |
0.77 |
0.60 |
12 |
Gujarat |
5.43 |
5.48 |
5.02 |
3.90 |
13 |
Haryana |
2.51 |
2.65 |
2.36 |
1.67 |
14 |
Himachal Pradesh |
1.18 |
1.14 |
0.67 |
0.39 |
15 |
Jammu & Kashmir |
1.25 |
1.24 |
0.92 |
0.57 |
16 |
Jharkhand |
2.19 |
2.00 |
1.52 |
0.94 |
17 |
Karnataka |
7.28 |
6.79 |
6.44 |
6.11 |
18 |
Kerala |
5.17 |
4.45 |
3.81 |
2.00 |
19 |
Lakshadweep |
0.01 |
0.06 |
0.01 |
0.01 |
20 |
Madhya Pradesh |
5.06 |
4.13 |
2.65 |
1.35 |
21 |
Maharashtra |
9.45 |
12.60 |
23.40 |
34.85 |
22 |
Manlpur |
0.11 |
0.29 |
0.06 |
0.07 |
23 |
Meghalaya |
0.27 |
0.54 |
0.15 |
0.18 |
24 |
Mlzoram |
0.12 |
0.23 |
0.05 |
0.07 |
25 |
Nagaland |
0.10 |
0.28 |
0.09 |
0.12 |
26 |
Orlssa |
3.32 |
2.78 |
1.54 |
1.02 |
27 |
Pondlcherry |
0.13 |
0.45 |
0.16 |
0.18 |
28 |
Punjab |
4.00 |
3.85 |
3.48 |
1.83 |
29 |
Rajasthan |
4.99 |
3.98 |
2.33 |
1.03 |
30 |
Slkklm |
0.08 |
0.21 |
0.06 |
0.09 |
31 |
Tamil Nadu |
7.11 |
6.65 |
6.37 |
4.61 |
32 |
Trlpura |
0.27 |
0.51 |
0.16 |
0.18 |
33 |
Uttar Pradesh |
12.15 |
9.93 |
7.24 |
3.88 |
34 |
Uttaranchal |
1.31 |
1.28 |
1.12 |
1.00 |
35 |
West Bengal |
6.64 |
6.55 |
6.02 |
5.28 |
| |
Total |
100.0 |
100.0 |
100.0 |
100.0 |
| |
|
(68,681) |
(10,531) |
(20,93,040) |
(11,00,913) |
Figures in bracket relate to Number of branches and Deposits (in Rs. Crore). |
A6.6: State-wise shares in Number of Branches and Deposits of
Total and Sampled Branches as on March 31, 2006 |
S. No. |
State/UT |
Share in number of branches (Per Cent) |
Share in Deposits (Per Cent) |
Total |
Selected in Sample |
Total |
Selected in Sample |
1 |
2 |
3 |
4 |
5 |
6 |
1 |
Andaman & Nicobar Island |
0.05 |
0.18 |
0.04 |
0.06 |
2 |
Andhra Pradesh |
7.92 |
7.11 |
5.61 |
4.42 |
3 |
Arunachal Pradesh |
0.10 |
0.25 |
0.07 |
0.08 |
4 |
Assam |
1.80 |
1.60 |
1.00 |
0.73 |
5 |
Bihar |
5.22 |
4.05 |
2.22 |
1.06 |
6 |
Chandigarh |
0.29 |
0.74 |
0.88 |
1.23 |
7 |
Chhattlsgarh |
1.51 |
1.47 |
0.98 |
0.71 |
8 |
Dadra&Nagar Havell |
0.02 |
0.10 |
0.02 |
0.04 |
9 |
Daman & Diu |
0.02 |
0.14 |
0.04 |
0.07 |
10 |
Delhi |
2.44 |
5.56 |
12.73 |
19.65 |
11 |
Goa |
0.50 |
0.70 |
0.77 |
0.60 |
12 |
Gujarat |
5.43 |
5.48 |
5.02 |
3.90 |
13 |
Haryana |
2.51 |
2.65 |
2.36 |
1.67 |
14 |
Himachal Pradesh |
1.18 |
1.14 |
0.67 |
0.39 |
15 |
Jammu & Kashmir |
1.25 |
1.24 |
0.92 |
0.57 |
16 |
Jharkhand |
2.19 |
2.00 |
1.52 |
0.94 |
17 |
Karnataka |
7.28 |
6.79 |
6.44 |
6.11 |
18 |
Kerala |
5.17 |
4.45 |
3.81 |
2.00 |
19 |
Lakshadweep |
0.01 |
0.06 |
0.01 |
0.01 |
20 |
Madhya Pradesh |
5.06 |
4.13 |
2.65 |
1.35 |
21 |
Maharashtra |
9.45 |
12.60 |
23.40 |
34.85 |
22 |
Manlpur |
0.11 |
0.29 |
0.06 |
0.07 |
23 |
Meghalaya |
0.27 |
0.54 |
0.15 |
0.18 |
24 |
Mlzoram |
0.12 |
0.23 |
0.05 |
0.07 |
25 |
Nagaland |
0.10 |
0.28 |
0.09 |
0.12 |
26 |
Orlssa |
3.32 |
2.78 |
1.54 |
1.02 |
27 |
Pondlcherry |
0.13 |
0.45 |
0.16 |
0.18 |
28 |
Punjab |
4.00 |
3.85 |
3.48 |
1.83 |
29 |
Rajasthan |
4.99 |
3.98 |
2.33 |
1.03 |
30 |
Slkklm |
0.08 |
0.21 |
0.06 |
0.09 |
31 |
Tamil Nadu |
7.11 |
6.65 |
6.37 |
4.61 |
32 |
Trlpura |
0.27 |
0.51 |
0.16 |
0.18 |
33 |
Uttar Pradesh |
12.15 |
9.93 |
7.24 |
3.88 |
34 |
Uttaranchal |
1.31 |
1.28 |
1.12 |
1.00 |
35 |
West Bengal |
6.64 |
6.55 |
6.02 |
5.28 |
| |
Total |
100.0 |
100.0 |
100.0 |
100.0 |
| |
|
(68,681) |
(10,531) |
(20,93,040) |
(11,00,913) |
Figures in bracket relate to Number of branches and Deposits (in Rs. Crore). |
A7.1: Correlation Coefficient between Retained Profits and two Auxiliary Variables |
Year 2006-07 |
PUC size Rs.Crore) |
No.of Companies |
(Rs. Crore) |
corr (pucrp) |
corr (sales,rp) |
PUC |
SALES |
Retained Profits (rp) |
less than 5cr |
993 |
257 |
6913 |
332 |
-0.014 |
0.456 |
5cr - 10cr |
675 |
484 |
9993 |
466 |
0.115 |
0.505 |
10cr - 25cr |
752 |
1159 |
21055 |
1265 |
0.098 |
0.476 |
25cr - 50cr |
292 |
1017 |
16811 |
1239 |
0.059 |
0.698 |
above 50cr |
304 |
6473 |
63237 |
5622 |
0.044 |
0.913 |
Year 2005-06 |
PUC size |
No.of Companies |
(Rs. Crore) |
corr (pucrp) |
corr (sales,rp) |
PUC |
SALES |
RP |
Less than 5cr |
1056 |
2736 |
65169 |
2535 |
-0.004 |
0.396 |
5cr - 10cr |
716 |
5098 |
91796 |
3694 |
0.074 |
0.458 |
10cr - 25cr |
698 |
10726 |
166169 |
8753 |
0.108 |
0.495 |
25cr - 50cr |
269 |
9461 |
146720 |
11651 |
0.101 |
0.834 |
above 50cr |
277 |
61749 |
462669 |
31632 |
0.025 |
0.920 |
Source : RBI Studies on Public Limited Companies. |
A7.2: Select Data Items of Select Companies for 2006-07 – A Comparison of Databases
maintained at MCA and RBI* |
(Rs. Crore) |
Name of the Company |
PUC |
Dividends |
Depreciation |
RBI Database |
MCA21 Database |
RBI Database |
MCA21 Database |
RBI Database |
MCA21 Database |
3I Infotech Ltd. |
156 |
156 |
18 |
12 |
14 |
14 |
Abhishek Industries Ltd. |
194 |
194 |
0 |
0 |
80 |
80 |
Abirami Financial Services (India) Ltd. |
6 |
6 |
0 |
0 |
1 |
1 |
Bajaj Auto Finance Ltd. |
35 |
35 |
11 |
11 |
3 |
3 |
Balaji Distilleries Ltd. |
113 |
113 |
0 |
0 |
10 |
10 |
Binani Cement Ltd. |
203 |
203 |
41 |
41 |
43 |
43 |
Dewan Housing Finance Corporation Ltd. |
74 |
77 |
14 |
8 |
2 |
2 |
Dhandapani Finance Ltd. |
28 |
28 |
0 |
0 |
1 |
1 |
Escorts Finance Ltd. |
50 |
50 |
0 |
0 |
0 |
0 |
Essar Oil Ltd. |
1140 |
1156 |
0 |
0 |
5 |
5 |
Essar Shipping Ltd. |
426 |
426 |
0 |
0 |
91 |
91 |
Finolex Industries Ltd. |
124 |
124 |
37 |
37 |
55 |
55 |
First Leasing Co Of India Ltd. |
23 |
23 |
5 |
5 |
16 |
16 |
Gic Housing Finance Ltd. |
54 |
54 |
16 |
16 |
0 |
1 |
Gujarat NRE Coke Ltd. |
244 |
244 |
39 |
39 |
21 |
25 |
Gujarat Pipavav Port Ltd. |
262 |
262 |
0 |
0 |
25 |
25 |
Gujarat Sidhee Cement Ltd. |
145 |
145 |
0 |
0 |
9 |
9 |
Hexaware Technologies Ltd. |
176 |
176 |
24 |
0 |
16 |
16 |
Hindalco Industries Ltd. |
104 |
104 |
177 |
0 |
638 |
638 |
Idea Cellular Ltd. |
2593 |
2593 |
0 |
0 |
675 |
672 |
IL & FS Investment Managers Ltd. |
26 |
26 |
10 |
10 |
2 |
2 |
Indian Acrylics Ltd. |
125 |
125 |
0 |
0 |
15 |
15 |
Infosys Technologies Ltd. |
286 |
286 |
653 |
371 |
469 |
469 |
ITC Ltd. |
376 |
376 |
1166 |
1166 |
363 |
363 |
Jindal Saw Ltd. |
148 |
148 |
32 |
28 |
56 |
52 |
JRG Securities Ltd. |
13 |
13 |
2 |
2 |
1 |
1 |
JSW Steel Ltd. |
443 |
504 |
233 |
205 |
498 |
607 |
Khandwala Securities Ltd. |
15 |
15 |
1 |
0 |
0 |
0 |
Mahindra Holdings & Finance Ltd. |
147 |
147 |
6 |
6 |
0 |
0 |
Maruti Udyog Ltd. |
145 |
145 |
130 |
130 |
271 |
271 |
Mascon Global Ltd. |
264 |
264 |
0 |
0 |
2 |
2 |
Max Healthcare Institute Ltd. |
228 |
228 |
0 |
0 |
13 |
13 |
Modern Syntex (India) Ltd. |
125 |
125 |
0 |
0 |
31 |
31 |
Morepen Laboratories Ltd. |
168 |
65 |
0 |
0 |
47 |
49 |
Mundhwa Investment Ltd. |
24 |
24 |
0 |
0 |
0 |
0 |
Parsvnath Developers Ltd. |
185 |
185 |
46 |
46 |
14 |
14 |
Peerless Securities Ltd. |
9 |
9 |
1 |
0 |
0 |
0 |
Petronet LNG Ltd. |
750 |
750 |
94 |
94 |
102 |
102 |
Prism Cement Ltd. |
298 |
298 |
0 |
0 |
31 |
33 |
Saurashtra Chemicals Ltd. |
184 |
184 |
0 |
0 |
18 |
18 |
Silverline Technologies Ltd. |
250 |
250 |
0 |
0 |
4 |
4 |
South Asian Petrochem Ltd. |
191 |
191 |
0 |
0 |
23 |
23 |
Tata Chemicals Ltd. |
215 |
215 |
172 |
172 |
150 |
150 |
Tech Mahindra Ltd. |
121 |
121 |
27 |
0 |
46 |
46 |
Uttam Galva Steels Ltd. |
108 |
108 |
0 |
0 |
49 |
49 |
Videocon Industries Ltd |
267 |
267 |
81 |
77 |
336 |
336 |
* : RBI collects the data from Annual Accounts of the Companies., Source : RBI and MCA. |
Note A : Capital gains/losses may be calculated as sum of (i) profit(+)/loss(-) on sale of fixed assets, (ii) profit(+)/ loss(-) on sale of investments (excluding for the companies trading in shares), (iii) loss(-) due to fire, flood, theft, etc and any such other profit(+)/loss(-) of capital nature.
Note 1 : Raw material consumed is to be given as per following calculation -Opening stock of raw materials + purchases of raw materials - closing stock of raw materials
Note 2 : Purchases made for re-sale is to be given as per following calculation Opening stock of goods traded + purchases of goods traded - closing stock of goods traded
Note 3 : Consumption of stores and spare parts to be given as per following calculation-Opening stock of stores and spares + purchases of stores and spares - closing stock of store and spares
Note 4 : Income(+)/expenditure(-) related to previous years may be calculated as sum of (i) provisions no longer required written back (bad debts, taxation, etc.), (ii) liabilities written back, (iii) assets or investments written off and (iv) any other income(+)/expenditure(-) relating to previous years.
Note 5 : Net amount transferred to reserves may be calculated as amount transferred to any kind of reserves – amount transferred from any kind of reserves.
Note 6 : Net amount transferred to balance sheet may be calculated as amount transferred to balance sheet – amount transferred from balance sheet.
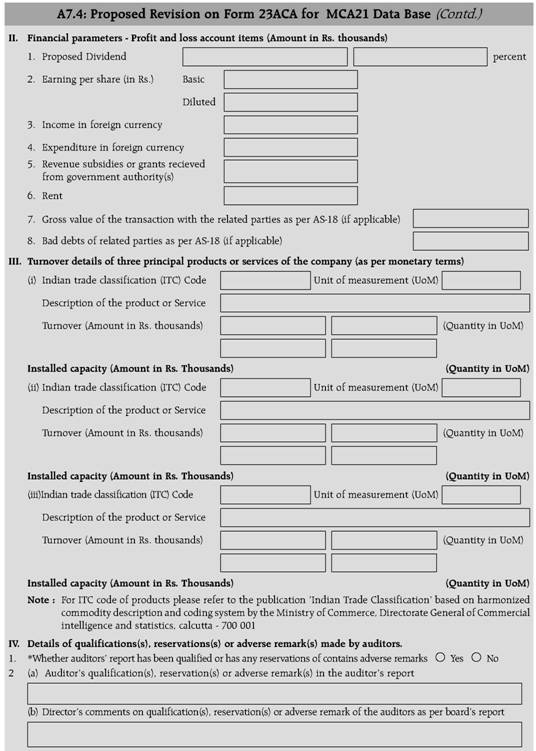
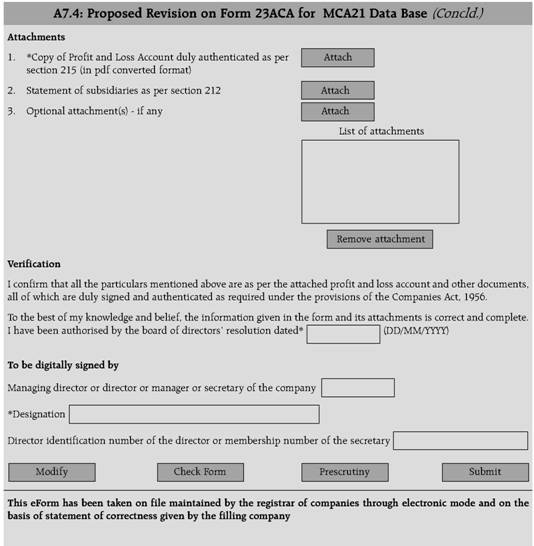 A8.1: Present Status of the Recommendations of Raj Committee on Estimation of Savings and Capital Formation
Item (i) Classification of expenditure items of the Central Government into ‘Current’ and ‘Capital’.
Recommendation : Ministry of Finance and CSO study the details of each other’s mode of classification and arrive at identical estimates of current expenditure like consumption expenditure, transfer payments etc., based on known conventions and guidelines.
Status : The issue has been resolved and the Ministry of Finance utilises the estimates prepared by CSO.
Item (ii) : Similar classificatory questions relating to certain expenditure of the Railways.
Recommendation : In case of Railways, the CFC is assumed to be equivalent to their works expenditure met from depreciation reserve fund less expenditure on improvements of assets replaced as available from the budgets. This needs to be examined.
Status : Presently the CFC is worked out by CSO on the basis of estimated value and expected life of the assets. No further examination is required.
Item (iii) : The question of treating replacement expenditure as depreciation in Departmental Enterprises.
Recommendation : The idea of treating the entire actual expenditure on replacement as equivalent to depreciation in respect of some departmental enterprises needs to be examined.
Status : Same as item (ii) above.
Item (iv) : Need to study the nature and size of “Suspense Account’ that may affect the estimates of Government savings.
Recommendation : Unclassified amounts of receipt or expenditure booked under the ‘Suspense Account’ in Public Account of the Central & State Governments Budgets which might affect savings estimates deserves to be eliminated.
Status : This has been examined and it was observed that the net effect of ‘Suspense Account’ transactions on savings are only marginal.
Item (v) : Inter Government Accounting Adjustment in respect of interest and other current transfers
Recommendation : The differences in Inter-Government receipts & payments of interest and other current transfers are treated as Inter Government accounting adjustment on the expenditure side of the Income and Outlay Account of Administrative Departments. The committee has suggested presenting the figures of interest payments by Central Government on a gross basis rather than net of interest received from NDCUs.
Status : Interest payments by Central and State Governments are being shown on gross basis except for interest receipts from DCUs. However, a small amount of Inter Government accounting adjustment still exists.
Item (vi) : Discrepancies in the figures shown in the ‘Account’, given in the Budget documents and those published in the Combined Finance and Revenue Accounts (CFRAs) by CAG
Recommendation : It is suggested that CSO should attempt a study on the difference existing between the ‘Account’ figures given against various items of Receipts & Expenditure in the Financial Statements of the budget and those published later in CFRAs by the Controller and Auditor General of India.
Status : Final estimates of CSO are based on the ‘Accounts’ figures published in the Annual Financial Statement. Due to time lag especially in respect of State Governments CFRAs, it has not been possible to make use of data published therein for annual estimates.
Item (vii) : Treatment of the profits of RBI
Recommendation : The Working Group felt that the existing practice of CSO of apportioning the profits of the RBI between issue and Banking Departments and treating the former as part of Central Government (Administrative) Departments is arbitrary and contrary to the guidelines laid down in UN (SNA). The Group felt that this issue be better examined more carefully by the Advisory Committee of National Accounts.
Status : The matter was taken up with Advisory Committee and there were no censuses on treating RBI as an autonomous body. Certain issues relating to monetary policy still remain with the Government and as such the present treatment cannot be said strictly contrary to the guidelines of SNA 93.
Item viii) : Finance of Local Bodies and Non-Departmental undertaking of the State Governments
Recommendation : With a view to improve the quality of data on urban and rural local bodies and on the non-departmental undertaking of the State Governments, the Raj Committee agreed to various useful and practical suggestions already advanced by a different Working Group appointed by the CSO on ‘Statistics of Local Bodies and Non-Departmental undertakings of the State Governments’. However, it urged the CSO to publish in NAS separately (a) the accounts of different levels of Government; (b) the data on savings of Non-Departmental financial and non-financial undertakings.
Status : Income and outlay accounts of Non-Departmental financial and non-financial undertakings are being published separately. The accounts of Government are compiled separately for different levels of Government and published in the consolidated form.
A8.2: Accounting Treatment in Public Private Partnership
The investment requirements of infrastructure sector are massive. According to the Approach of the 11th Five Year Plan investment in infrastructure defined as road, rail, air and water, transport, power generation, transmission and distribution, telecommunication, water supply, irrigation and storage will need to increase from 4.6 per cent to around 8.0 per cent of GDP in the 11th Plan. It may not be possible to fund the very large investment requirements of this sector from the budgetary resources of the Government alone. In order to remove this shortcoming and to bring in private sector resources and techno-managerial efficiencies, there is a need to promote public-private partnership (PPP) in a larger scale. PPP is a partnership between the public sector and the private sector for the purpose of delivering a project or a service traditionally provided by public sector.
PPP recognises that both the public sector and the private sector have certain advantages relative to the other in the performance of specific tasks. By allowing each sector to do what it does best, public services and infrastructure can be provided in the most economically efficient manner. Drawing on the best of the public and private sectors, PPPs provide additional resources for investment in public sector and the efficient management of investment. PPP has certain potential benefits such as cost-effectiveness, higher productivity, accelerated delivery, clear customer focus and improvement in recovery of user charges.
PPPs in India
A number of initiatives have been taken in the last two years of the 10th Plan by both the Centre and the States to promote infrastructure development through PPPs and the experience gained helps identify the conditions under which PPPs are more likely to succeed. However, considerable work is needed to create an enabling environment which should not only attract private investment but must also be seen to be in the public interest and this is best assured if the process is seen to provide services at reasonable cost and in a transparent manner. If we adopt best practices, it will be possible to create credible PPP projects that evoke a positive public response and do not require re-negotiation or payment of unforeseen liabilities by the Government or the users.
PPPs are best implemented through standardised arrangements that constitute a stable policy and regulatory regime where private capital derives greater comfort and seeks the least possible risk premium. To address these constraints, several initiatives have been taken by the Government of India to create an enabling framework for PPPs by addressing issues relating to policy and regulatory environment. Progressively, additional sectors have been opened to private and foreign investment, levy of user charges is being promoted, regulatory institutions are being set up and strengthened, and fiscal incentives are given to infrastructure projects. Standardized contractual documents such as sector-specific Model Concession Agreements, which will lay down the standard terms relating to allocation of risks, contingent liabilities and guarantees as well as service quality and performance standards, and standardised bidding documents such as Model Request for Qualifications and Model Request for Proposals are being prepared and notified.
To expedite the PPP projects in the Central sector, an appraisal mechanism has been notified including the setting up of the Public Private Partnership Appraisal Committee (PPPAC) which will be responsible for the appraisal of PPP projects in the Central sector. To accelerate and increase PPPs in infrastructure, two major initiatives have been taken by the Government: (a) provision of viability gap funding; and (b) setting up of a SPV, India Infrastructure Finance Company Limited (IIFCL) to meet the long term financing requirements of potential investors. The viability gap funding will normally be in the form of a capital grant at the stage of project construction, not exceeding 20 per cent of the total project cost. In order to be eligible for funding under this viability gap support scheme, the PPP must be implemented by an entity with at least 51 per cent private equity.
Primarily, this facility of viability gap funding is meant to reduce capital cost of the projects by credit enhancement and to make them viable and attractive for private investments through supplementary grant funding. Provision for this facility is made on a year to year basis. Viability gap funding can take various forms, including but not limited to capital grant, subordinated loans, operations and maintenance support grants or interest subsidy. A mix of capital and revenue support may also be considered. The following conditions are attached to viability gap funding:
- The funding is to be disbursed contingent on agreed milestones, preferably physical, and performance levels being achieved, as detailed in funding arrangements.
-
The funding is to be provided in installments, preferably in the form of annuities, and with at least 15 per cent of the funding to be disbursed only after the project is fully functional.
-
In the first year of the facility, funding is to be allocated to projects on a first come, first served basis subject to meeting the eligibility criteria.
Accounting of PPP- International Perspective
There are currently no internationally accepted comprehensive accounting and reporting standards in place for PPPs. One major element of PPP accounting is risk sharing which would determine fiscal cost of the projects concerned.
Risk Analysis
Like all projects, PPPs entail different types of risks. The risks sharing by the Government would determine the fiscal cost of the PPPs. The major project related risks encounter in PPPs are as follows:
-
Construction risk - Design problems as well as cost and schedule overruns.
-
Financial risk - The possibility that a project’s cash flow may fall short of the level needed to repay the project loans and capital invested, for instance due to interest and exchange rate variability.
-
Demand risk - The possibility that the demand for the services provided declines, reducing the cash flow generating potential of the project.
-
Availability risk - The possible lack of continuity and low quality of service provision.
-
Political risk - Situations where Government actions could impair the private sector’s earnings potential.
-
Force majeure - Risks beyond the control of public and private partners (i.e., natural disasters).
-
Residual value risk - Uncertainty regarding the market price of the infrastructure asset at the end of the contract period.
To achieve efficiency gains, each risk must be assigned to the party that is best equipped to manage it. Successful PPPs recognise that both partners have certain advantages relative to the other in performing certain tasks and managing certain risks. For example, the Government will typically be in a better position to manage political risk, while the private sector can generally handle construction risk more efficiently. However, good contractual risk sharing arrangements alone do not ensure that fiscal risks are averted. In many countries, PPPs are popular in part because they can be used to bypass normal budgetary procedures, which in itself exacerbated fiscal risks. In general, PPPs allow Governments to avoid or defer spending on infrastructure without deferring its benefits. Independent of the value for money, they promise to deliver, PPPs can be a tempting alternative for financially constrained Governments, as they can support increases in infrastructure investment without immediate adding to Government borrowings. Hence, while they have the potential to increase efficiency and ease fiscal constraints for infrastructure investment, PPPs can also simply be a tool for bypassing expenditure controls, delaying borrowings and moving public investment off budget and debt off the Government balance sheet. Sometimes, Governments can still be left bearing most of the fiscal risk involved and facing potentially large fiscal costs over the medium to long term. Specific fiscal risks from PPPs often involve the creation of Government liabilities that can be direct or contingent, explicit or implicit, known or unexpected. Direct fiscal liabilities occur when the Government has a fiscal obligation in any event, while contingent liabilities are triggered by a particular event. For example, contingent liabilities may include minimum income guarantees given to the private sector partner, or Government guarantees to banks that finance a PPP. Explicit liabilities are those created by a law or contract, while implicit ones reflect public and interest-group pressures. For example, an implicit liability would be a bailout that may need to be provided to the private partners in a PPP that is too big or politically sensitive to fail.
Fiscal Accounting
Existing standards provide only a starting point for addressing the accounting and reporting treatment of PPPs. The 1993 System of National Accounts (1993 SNA) and the 1995 European System of Accounts (ESA 95) cover some operations that characterize PPPs, including leases, while ESA 95, supplemented by the ESA 95 Manual on Government Deficit and Debt, covers public infrastructure built and operated by the private sector. The IMF’s Government Finance Statistics Manual 2001 (GFSM 2001) proposes a fiscal reporting framework that integrates flows and stocks, and shifts the emphasis toward accrual reporting and balance sheets; this framework is, therefore, also well suited to reporting on PPPs, although it does not currently provide comprehensive coverage of such operations.
Currently, there are no commonly accepted fiscal accounting and reporting standards for PPPs. This makes it difficult to prevent PPPs from being used to bypass expenditure controls – that is, move public investment off budget and debt off the Government’s balance sheet. Moreover, the use of guarantees to secure private financing can expose the Government to hidden and often higher costs than traditional public finance. An internationally accepted accounting and reporting standard could promote transparency about the fiscal consequences of PPPs and, in the process, make increased efficiency rather than a desire to meet fiscal targets the main motive for using PPPs.
A Eurostat (the Statistical Office of the European Communities) decision in February 2004 on accounting for risk transfer provides an initial attempt to provide guidance on fiscal accounting for PPPs. According to the Eurostat decision the assets involved in a public-private partnership should be classified as non-Government assets, and, therefore, recorded off balance sheet for Government, if both of the following conditions are met:
-
The private partner bears the construction risk, and
-
The private partner bears at least one of either availability or demand risk
If the construction risk is borne by Government, or if the private partner bears only the construction risk and no other risks, the assets are classified as Government assets. This has important consequences for Government finances, both for the deficit and the debt. The initial capital expenditure relating to the assets will be recorded as Government fixed capital formation, with a negative impact on Government deficit/surplus. As a counterpart of this Government expenditure, Government debt will increase in the form of an “imputed loan” from the partner. The regular payments made by Government to the partner will have an impact on Government deficit/surplus only for the part relating to purchases of services and “imputed interest”.
Since the private sector usually bears the construction and availability risk, it seems likely that most PPPs will be treated as private investment, even when the Government bears substantial demand risk (for example, when it guarantees to the private operator a minimum level of demand for the service provided through the PPP).
Following Eurostat accounting treatment and GFSM 2001 fiscal reporting framework, the under mentioned PPP operations are addressed as set out below:
Operating Contracts – Where a PPP asset is owned by the private operator, payments under operating contracts for services provided to the Government are recorded in the Government operating Statement as an expense.
Concessions and Operating Leases – Concession fees and other payments by private operators of concessions to the Government (e.g., profit shares) are recorded in the operating Statement as revenue. When the Government leases an asset it owns to a private operator, lease payments to the Government by a private operator are also recorded as revenue.
Financial Leases - The acquisition of an asset under a financial lease would be recorded in the operating Statement at cost, together with incurrence of a lease liability to the private sector. The asset and liability would also be recorded on the Government balance sheet. Subsequent depreciation of the asset and interest and amortisation payments on the lease, would then be recorded in the operating Statement. As the lease liability is reduced, the PPP net asset value will build up on the balance sheet (provided that the liability is reduced at a faster rate than that at which the asset is depreciated). When the lease concludes, the asset will be recorded on the Government balance sheet at its residual value.
Transfer of PPP Assets to Government - If there is provision for a PPP asset to be transferred at zero cost to the Government, the asset transfer is recorded in the operating Statement as the acquisition of a non-financial asset at its residual value, balanced by a capital transfer from the private owner. Any purchase price involved would be an expense, and the capital transfer is reduced by the corresponding amount. The asset would also be recorded on the balance sheet at its residual value at the time the transfer takes place, and subsequent depreciation of the asset would be recorded in the operating Statement.
Eurostat accounting principles appears to underestimate the fiscal cost implications of PPPs. According to Eurostat, countries can consider as private investment any PPP project that is judged by the relevant national statistical body to transfer to the private partner (most of) the construction risk and either the availability (continuity of service supply) or the demand risk. Also, the Eurostat decision creates moral hazard, making it more likely that PPPs will be designed to meet a minimum standard of risk transfer rather than an optimal level of risk transfer.
Hence, until a comprehensive international accounting standard for PPPs emerges, there remains a substantial risk that, in designing PPPs, value-for-money considerations are traded off against other considerations. This would both defeat the objective of using PPPs for efficiency gains and disguise the medium-to-long-term implications of many PPPs for public finances.
Disclosure Requirements
In view of the problems associated with lack of standardized accounting principles, considerable emphasis has been placed on disclosure as a mean of making fiscal consequences of PPPs fully transparent (IMF, 2004).
Budget documents and end-year financial reports should include an outline of the objectives of a current or planned PPP program, and a summary description of projects that have been contracted or at an advanced stage in the contracting process (their nature, the private partner or partners, and capital value). In addition, the following more detailed information should be provided for each PPP project or group of similar projects:
-
Future service payments and receipts (such as concession and operating lease fees) by Government specified in PPP contracts over for the following 20-30 years.
-
Details of contracts provisions that give rise to contingent payments or receipts (e.g., guarantees, shadow tolls, profit sharing arrangements, events triggering contract renegotiation), with the latter valued to the extent feasible.
-
Amount and terms of financing and other support for PPPs provided through Government on lending, or via public financial institutions and other entities (such as special purpose vehicles) owned or controlled by Government.
-
How the project affects the reported fiscal balance and public debt and whether PPP assets are recognised as assets on the Government balance sheet. It should also be noted whether PPP assets are recognised as assets on the balance sheet of any special purpose vehicle.
It may be mentioned that Government guarantees provided in connection with PPPs are a major source of fiscal risk. Thus, the disclosure of Government guarantees is widely called for. The IMF’s Code of Good Practices on Fiscal Transparency and the related Manual on Fiscal Transparency require Statements as part of the budget documents that describe the nature and significance of all contingent liabilities. Guarantees should ideally be reported in a fuller Statement of Contingent Liabilities which is part of the budget documentation and accompanies financial Statements, with updates provided in fiscal reports. A common core of information to be disclosed annually for each guarantee or guarantee program is as follows:
-
A brief description of its nature, intended purpose, beneficiaries and expected duration.
-
The Government’s gross financial exposure and where feasible, an estimate of the likely fiscal cost of called guarantees.
-
Payments made, reimbursements, recoveries, financial claims established against beneficiaries, and any waivers of such claims.
-
Guarantee fees or other revenue received.
It may be clear from the foregoing analysis that the Government has an important stake in all PPP projects. Besides usual responsibilities concerning regulatory and legal affairs and in policy and administrative matters, the Government may have both direct and indirect direct stakes in PPP projects. The Government involvement may be through assets ownership, equity participation, risk sharing and provision of various incentives including loan guarantees for sub-sovereign and non-sovereign borrowings. These types of involvements require the Government to bear explicit direct and contingent liabilities.
The direct and contingent liabilities (explicit or implicit) have important implications for fiscal management in Government. The underlying fiscal costs of PPPs that may arise in the medium and short term would require provision of substantial public financing in budget. Therefore, there is a necessity to estimate the likely direct and contingent liabilities of PPP projects in future while approvals by Government is considered.
Implications for India
As alluded in the earlier sections, there is presently no commonly accepted fiscal accounting framework for PPPs. Eurostat principles may be considered for guidance in the matter. However, the fiscal cost of PPPs would be determined on a case-by-case basis taking into account factors such as risk sharing, Government’s involvement through direct and contingent liabilities. High priority should be accorded to strengthen country’s capacity to establish appropriate legal and regulatory framework for PPPs; structure contracts to ensure adequate transfer of risks to the private partner, including through appropriate pricing of such risks and appropriately reflect PPPs in the fiscal accounts.
A9.1: Present status on the Proposed Improvements suggested by the Raj Committee -1982 on the Estimation of Savings and Capital Formation
Household Sector
Item (i) Estimation of pucca construction by commodity flow method.
Brief description : Considering the heterogeneous character of various types of construction taking place in the economy (e.g. housing, roads, irrigation and other works) estimates of construction derived through the aggregate ‘commodity flow’ method may probably be subject to large and unknown margins of error. It is, however, not possible to give up the ‘Commodity Flow’ method because of insuperable data problems. Nevertheless, it is necessary to have an independent estimate of capital formation in pucca construction by expenditure method’ also at least for the purpose of cross checking. Further, a full-fledged survey of undertaken by households, private unincorporated enterprises and nonprofit institutions in rural urban areas should be undertaken by NSSO.
Status : Present AIDIS covers only households. Entire household sector includes unincorporated enterprises and non-profit institutions as well. Therefore, an independent estimate of construction by following expenditure approach has so far not been possible because the unincorporated enterprises and nonprofit institutions have not so far been covered by the NSSO. Besides, the household Survey which provides data on construction expenditure of the households is available only on decennial basis. Also a comprehensive survey on construction activity following site approach has not been found feasible.
Item (ii) Improvement in the Commodity Flow approach
Brief description : Attempts should be made to improve the ‘commodity flow’ estimate itself. First the margin of error can be reduced if the estimates are made as far as possible on a disaggregated basis. For this purpose, the possibility of segregating the quantity of major inputs for pucca construction for at least some of the major categories of construction may be explored. Input structure for building construction should be obtained from the NBO, CPWD and CBRI. Secondly, while preparing the estimates of total new construction, the ratios of various factor and non-factor inputs as well as kutcha and pucca construction which are kept constant over time should be worked out afresh as frequently as possible so that changes in the composition of construction are taken care of over a period of time. For this purpose, special efforts in the form of regular or ad hoc surveys are necessary in order to evaluate such ratios over time.
Status : Norms used for various factor inputs and non-factor inputs as well as kutcha and pucca construction are based on reports of NBO, CPWD and CBRI, cost of construction indices compiled by various States and Survey on Housing conditions, 2002-03, NSSO (58th Round). The ratio of factor inputs used in the 1999-00 series is same as that used for 1993-94 series.
Item (iii) : Estimation of Capital Formation in Machinery & Equipment
Brief description : The major problem in the estimation of capital formation in machinery and equipment for the household sector arises from the non-availability of regular direct information either of production from unregistered manufacturing units or of use in the household sector. The result is reliance on out-of-date survey data. In this case, according to the Working Group, there was no simple way of arriving at reliable quantities without survey conducted periodically to ascertain both the levels of production, in one case and levels of use in the other.
Status : The reports of DME, NDME and OAE surveys conducted by CSO and NSSO were examined but the results were not found consistent. Hence, estimates of machinery and equipment of public and private corporate sector including cooperatives are subtracted from corresponding estimates of commodity flow to arrive at estimates for household sector as a residual.
Item (iv) : Inventory accumulation in the household sector
Brief Description : In respect of stocks with unregistered manufacturing and trade (registered and unregistered) dealing in commodities other than foodgrains, the Working Group has proposed that sample studies on the monthly stock Statements/ stocks registers maintained with commercial bank branches may be used as a primary source to begin with. Subsequently, these may be supported by benchmark surveys on stocks with the various constituents of the unorganised segment and also benchmark surveys on the monthly stock Statements themselves. In case of food grains stocks with trade, specially designed field survey alone could determine the nature of the relationship between private trading stocks and market arrivals. For private agriculture, an estimate of the ratio of inventories to gross value added be used for this purpose and the ratio updated with the help of the periodic surveys of the AIDIS type.
Status : The requisite surveys have not so far been conducted. The estimates of change in stocks in unregistered manufacturing are estimated using the proportion of inventory to GVA (20.07 per cent) obtained from the latest available survey results of NSSO and DCSSI. For stocks with trade, bench mark estimate is moved using the credit to household trade by Scheduled Commercial Banks as obtained from RBI publication, Basic Statistical Returns, Table 5.2. The bench mark estimates of trading activity in the household sector is based on DTE Survey 1990-91, and NSS report No. 403-Small Trading Units in India 1990-91. In the case of stocks of food grains, bench mark estimate (based on Prof. Dandekar’s method) is moved forward using the food credit (RBI Publication, Basic Statistical Returns).
Item (v) Estimation of GCF in unorganised manufacturing and household sector trading activities.
Brief description : As the method of estimation followed by CSO in both these cases is very unsatisfactory it is necessary to have periodic surveys, at least once in five years, to collect information on capital formation and output in details relating to unregistered manufacturing sector. It was felt that even within interim period, corrections may be needed in the investment-income ratios and these can be done with the help of data thrown by surveys carried out by various organisations e.g. the results of follow-up surveys of the Economic census conducted by the CSO.
In the case of machinery prices in unregistered manufacturing sector, it was felt that the items of machinery included in the calculation of index of prices are not representative of the tools and machinery generally used in the unregistered sector. It was, therefore, suggested that in this case, efforts may be made to collect prices relating to the more commonly used machines and implements in household manufacturing. Some of these are identified as lathes, hand tools, handlooms and simple machine tools.
In the case of trade sector, practically no data exists which gives an indication of current levels of capital formation. For the improvement of the estimates, detailed data based on sample surveys are necessary at least at an interval of five years covering household and non-household trade. In the interim period, a small study could be taken for the registered trade sector. It was also noted that the results of the Economic Census would also be useful. The limitations of price index can be solved, just as in the case of unregistered manufacturing.
Status : The reports of follow-up surveys of the Economic Census were examined, but the results were not found to be usable. Separate index of machinery used in unregistered manufacturing has not been attempted for want of requisite data.
For the unregistered manufacturing sector, results of NSS 56th round survey (2000-01) on unorganised manufacturing enterprises (GVO estimates at three and four digit level) have been used in compiling the estimates of value of capital goods from unorganised sector. Using the GVO estimates at the relevant 4-digit level from this survey and the ratio of value of capital goods to the GVO as available from the ASI 1999-2000 detailed results, the estimates of value of capital goods at 4-digit levels have been compiled for the unorganised sector.
For household trade, the estimates of GFCF for bench mark year have been prepared using the capital output ratio and moved for subsequent years on the basis of respective GVA estimates.
Item (vi) Treatment of ‘errors & omissions’ as statistical discrepancy.
Brief Description : The Committee has suggested that the errors & Omissions emerging in the process of reconciling the estimates of domestic savings plus foreign inflow and the estimates of capital formation arrived at with the help of divergent methods and separate sources of data (i.e. capital formation by industry of use), be treated as statistical discrepancy and that no adjustment be made to any of the independent estimates.
Status : The term ‘errors and omissions’ was substituted by the term ‘difference’. However, in the 1999-00 series, as the sources of data used for compilation of GFCF estimates by industry of use are the same as that used for commodity flow method, the industry wise GFCF estimates for Private Corporate and Household Sectors compiled by the expenditure method are adjusted proportionately with the estimates compiled by institutions through the commodity flow approach.
A9.2: Recommendations of Chelliah Committee and Status of Implementation |
S. No. |
Recommendation |
Present position |
1. |
Updation of various ratios and proportions used in the estimation of capital formation. |
The conduct of type studies to update some of the rates and ratios has been done through State Governments. However, it has not been possible to update all the rates and ratios, partly due to lack of resources in NSSO and partly due to the inherent problems associated with updation of rates and ratios, like destination of cement production to various uses. Such ratios can only be updated through IO tables, which the CSO has been doing while revising the base years.
The ratios of basic materials, other materials and factor inputs in construction were updated at the time of 1999-2000 base year using the results of NSS 58th round survey on housing conditions and the studies done by few States.
Norm on quantity of coal used for burning one lakh of bricks (updated on the basis of data from Coal Controller) |
2. |
All norms/ratios adopted in the estimation of savings and capital formation should be consistent with the norms used in the estimation of other national accounts aggregates including IOTT. |
This has been done. The norms/ratios adopted in the estimation of savings and capital formation are now consistent with those of IOTT 1999-2000. |
3. |
Periodic reviews of the basket of fixtures & fittings considered in the estimation of construction output. |
It was reviewed at the time of base year revision |
4. |
For the estimation of machinery and equipment at constant prices, the estimates of imports, exports and import duties on various items may be deflated by DGCI&S index of unit value of imports/exports. |
This recommendation has been examined, but not found to be feasible to implement due to the fluctuating nature of unit value indices and the substantial delay in the availability of these indices from the DGCI&S. |
5. |
Aggregative measures may be taken to keep the absolute errors and omissions between the estimates of gross capital formation and resources to finance, within a small margin. |
The recent years’ estimates have very small margin of errors and omissions |
6. |
The PIM method of preparing the estimates of CFC may be reviewed periodically for assumptions made regarding the average life of various assets. |
The life of assets data was reviewed at the time of base year revision |
7. |
All States should produce estimates of total capital formation. |
Almost all the States are now compiling capital formation estimates for the public sector. Also, few States are compiling GFCF estimates for the whole economy. On its part, the CSO has been imparting training on the compilation of GFCF estimates at State level, every year |
A9.2: Recommendations of Chelliah Committee and Status of Implementation (Contd.) |
S. No. |
Recommendation |
Present position |
8. |
The 1993 SNA recommends that the change in monetary gold owned by the monetary authorities as a component of international reserves may be treated as part of savings of the nation in the concerned financial year. The group, however, suggests that the increase/ decrease in monetary gold held by the central bank does not affect savings/capital formation of the economy. The change in the non-monetary gold which may occur due to new production or imports may be treated as final consumption if the gold is converted into jewellery for customary use. Acquisition of gold by an institution as a store of value only should be treated as a “Valuable” and included in acquisition of valuables and, thus, in gross capital formation of that institution. |
Valuables are now estimated in totality and shown separately in the estimates of gross capital formation |
9. |
SNA 1993 recommends that trees which are repeatedly used to produce valuable goods are to be taken as cultivated assets. The group recommends that the item trees which are used repeatedly or continuously to produce product such as fruits and rubber be treated as capital formation. |
In the new series, this has been done. The capital expenditure incurred on cultivation of plantation crops during the gestation period is treated as output under kutcha construction of the ‘Construction Industry’ for that year. |
10. |
Capital work in progress, in whichever industries takes place should form part of inventories and accordingly no CFC should be charged on it,. |
Being done |
11. |
Though the 1993 SNA recommends that small tool be treated as material used for intermediate consumption, the groups recommends that if a small tool has service life of more than one year, it should be taken as part of gross fixed capital formation. |
Being done |
12. |
Expenditures on mineral explorations should be taken to form part of fixed capital formation. |
Being done |
13. |
Software and data base which are purchased from the market by the business enterprises should be treated as part of capital formation. However, the increase in productivity of the existing software due to development of utilisation techniques should not be treated as part of capital formation. |
Being done |
14. |
The originals of firms/books/research/artistic work, identified by copy rights/patents, need to be taken as a part of capital formation. The |
These items are to be included in the asset block of enterprise surveys |
A9.2: Recommendations of Chelliah Committee and Status of Implementation (Concld.) |
S. No. |
Recommendation |
Present position |
| |
research and development expenditure should not be capitalised, when research succeeds it results in new copy rights/patents which in turn get included in capital assets. |
|
15. |
Expenditure made on the improvement of land and reclamation of land should form part of capital formation. |
Being done |
16. |
For households, information on associated cost of capital assets transfer from one hand to another needs to be collected. |
No progress, as the details of stamp duties by purpose are not available. |
17. |
Defence expenditure on capital equipments such as radar, satellite launching system and vehicles and on construction of buildings for offices, hospitals and schools etc. and on other construction works like roads, air fields, docks which are useable for civilian purposes may be considered as part of gross capital formation as per 1993 SNA. |
Due to non-availability of data, this recommendation could not be implemented |
A10.1: Status of Compilation of Estimates of GFCF in the States |
| |
State |
Public sector |
Both public and private sectors |
Position |
1 |
Andhra Pradesh |
|
Upto 2005-06 |
Released |
2 |
Arunachal Pradesh |
|
|
No estimates |
3 |
Assam |
|
Upto 2005-06 |
|
4 |
Bihar |
Upto 2006-07 |
|
Only state Government |
5 |
Chhattisgarh |
2000-01 to 2006-07 |
|
Trial estimates |
6 |
Goa |
Upto 2006-07 |
|
|
7 |
Gujarat |
Upto 2006-07 |
|
Only state Government |
8 |
Harayana |
|
Upto 2005-06 |
|
9 |
Himachal Pradesh |
Upto 2006-07 |
|
Only state Government |
10 |
Jharkhand |
2006-07 |
|
Trial estimates |
11 |
Jammu & Kashmir |
|
|
|
12 |
Karnataka |
Upto 2005-06 |
|
|
13 |
Kerala |
|
|
trial estimates of public sector |
14 |
Madhya Pradesh |
|
1999-2000 to 2004-05 |
Trial estimates |
15 |
Maharashtra |
From 1980-81 |
|
Trial estimates of private sector |
16 |
Manipur |
|
|
No estimates |
17 |
Meghalaya |
Upto 2005-06 |
|
|
18 |
Mizoram |
|
|
No estimates |
19 |
Nagaland |
|
|
No estimates |
20 |
Orissa |
Upto 2006-07 |
|
|
21 |
Punjab |
Upto 2006-07 |
|
|
22 |
Rajasthan |
|
Upto 2006-07 |
|
23 |
Sikkim |
Upto 2005-06 |
|
|
24 |
Tamil Nadu |
|
upto 2005-06 |
|
25 |
Tripura |
Upto 2004-05 |
|
|
26 |
Uttar Pradesh |
|
1999-2000 to 2005-06 |
Released |
27 |
Uttarakhand |
2001-02 to 2005-06 |
|
Trial estimates |
28 |
West Bengal |
Upto 2006-07 |
Trial estimates |
|
29 |
A & N Islands |
|
|
No estimates |
30 |
D&N Haveli |
|
|
No estimates |
31 |
Daman &Diu |
|
|
No estimates |
32 |
Delhi |
Upto 2006-07 |
|
|
33 |
Lakshadweep |
|
|
No estimates |
34 |
Puducherry |
|
|
No estimates |
35 |
Chandigarh |
|
|
No estimates |
A10.2: Total GFCF in the Economy at Current Prices, 2004-05 |
(Rs. crore) |
S. No. |
State/UTs |
Private Sector |
Public sector |
Supra Regional |
Total |
NDCU |
DCU |
State+ Local Admn |
Central Govt Admn |
Total |
1 |
2 |
3 |
4 |
5 |
6 |
7 |
8 |
9 |
10 |
1 |
Andhra Pradesh |
47123 |
4520 |
3238 |
3079 |
381 |
11219 |
1456 |
59797 |
2 |
Arunachal Pradesh |
176 |
832 |
312 |
778 |
39 |
1962 |
66 |
2205 |
3 |
Assam |
4309 |
1166 |
117 |
4558 |
794 |
6636 |
346 |
11290 |
4 |
Bihar |
3522 |
1735 |
508 |
2314 |
302 |
4858 |
1157 |
9537 |
5 |
Chhattisgarh |
14986 |
1737 |
607 |
2050 |
109 |
4503 |
473 |
19962 |
6 |
Goa |
5686 |
94 |
161 |
375 |
88 |
718 |
81 |
6485 |
7 |
Gujarat |
58587 |
6885 |
1229 |
3394 |
990 |
12498 |
1160 |
72244 |
8 |
Haryana |
32974 |
3537 |
435 |
1344 |
343 |
5659 |
376 |
39009 |
9 |
Himachal Pradesh |
6428 |
1915 |
95 |
1284 |
243 |
3537 |
168 |
10132 |
10 |
Jharkhand |
8821 |
1234 |
252 |
1208 |
53 |
2746 |
1628 |
13195 |
11 |
Jammu & Kashmir |
3437 |
1035 |
1081 |
2891 |
44 |
5051 |
556 |
9044 |
12 |
Karnataka |
49809 |
3680 |
1303 |
4710 |
613 |
10307 |
1626 |
61742 |
13 |
Kerala |
37515 |
1829 |
23 |
1166 |
585 |
3603 |
900 |
42019 |
14 |
Madhya Pradesh |
19122 |
4090 |
895 |
2855 |
2593 |
10434 |
760 |
30316 |
15 |
Maharashtra |
116632 |
15883 |
202 |
4508 |
274 |
20866 |
2970 |
140467 |
16 |
Manipur |
853 |
8 |
139 |
830 |
160 |
1136 |
63 |
2052 |
17 |
Meghalaya |
350 |
145 |
17 |
508 |
46 |
716 |
63 |
1129 |
18 |
Mizoram |
126 |
25 |
131 |
687 |
1159 |
2002 |
51 |
2179 |
19 |
Nagaland |
332 |
16 |
208 |
720 |
103 |
1048 |
67 |
1446 |
20 |
Orissa |
12495 |
2364 |
572 |
1514 |
974 |
5424 |
715 |
18634 |
21 |
Punjab |
23043 |
1394 |
288 |
1298 |
94 |
3073 |
999 |
27115 |
22 |
Rajasthan |
30521 |
1435 |
865 |
3220 |
138 |
5659 |
954 |
37135 |
23 |
Sikkim |
143 |
694 |
170 |
511 |
2 |
1377 |
13 |
1533 |
24 |
Tamil Nadu |
86318 |
7241 |
326 |
5183 |
352 |
13103 |
1444 |
100866 |
25 |
Tripura |
269 |
105 |
131 |
536 |
190 |
963 |
78 |
1310 |
26 |
Uttar Pradesh |
55812 |
6945 |
952 |
6810 |
872 |
15579 |
1951 |
73343 |
27 |
Uttarakhand |
6327 |
2886 |
166 |
1630 |
94 |
4775 |
202 |
11304 |
28 |
West Bengal |
37636 |
5092 |
342 |
1718 |
2440 |
9592 |
1732 |
48961 |
29 |
Andaman & N.I. |
194 |
-1 |
0 |
19 |
180 |
198 |
39 |
432 |
30 |
Chandigarh |
1505 |
5 |
0 |
17 |
153 |
175 |
78 |
1757 |
31 |
Dadra & Nagar H. |
3273 |
2 |
0 |
3 |
30 |
35 |
1 |
3309 |
32 |
Daman & Diu |
1848 |
1 |
0 |
1 |
10 |
12 |
2 |
1862 |
33 |
Delhi |
14958 |
1092 |
114 |
2651 |
1669 |
5526 |
3933 |
24417 |
34 |
Lakshadweep |
64 |
2 |
93 |
293 |
2 |
391 |
2 |
456 |
35 |
Puducherry |
1203 |
29 |
0 |
5 |
16 |
49 |
15 |
1268 |
36 |
Un allocated |
3476 |
884 |
0 |
0 |
1083 |
1969 |
1280 |
6725 |
37 |
All India |
689873 |
80538 |
14972 |
64667 |
17220 |
177400 |
27405 |
894675 |
ANSC 1: Annex for the National Statistical Commission
Major Recommendations 12
The major recommendations made by the HLC pertaining to various ToRs are summarised as below:
Household Sector Savings Estimation
Comprehensive Income-Expenditure Survey
VI.a In order to pave way for eventual introduction of periodical comprehensive survey, the HLC interacted with the NSSO to examine the possibility of introducing such a survey. The outcome of this interaction has turned out to be favourable in the sense that the NSSO has agreed to undertake such a survey for households with a pilot survey to begin with, in the year 2010-11. The survey will provide an alternative data base for direct estimation of household savings for cross-validation of the present estimates. The HLC recommends that the NSSO should initiate at the earliest, the task of launching a comprehensive income-expenditure survey for household sector. While initiating such a survey, the NSSO may give a careful thought to the design issues through consultation with all appropriate institutions, like the CSO and the RBI. The NSSO should come out with a concrete action plan in this regard. To be able to find out the estimates of savings for all components of the household sector (as per national accounts statistics framework), and also generate reliable estimates of savings, consumption, investment and income at the State level in India, appropriate sampling design needs to be done. It is imperative that the survey of income and expenditure of ‘pure households’ needs to be taken up concurrently with the Enterprise Survey.
Review of the Existing Methodology
VI.b The HLC is of the opinion that no alternative is possible to the present method of estimation of savings but it is recognised that the present method needs to be strengthened through regular updation of rates and ratios and development of alternative data bases for constant cross-validation of the estimates. The envisaged system of conducting a regular and comprehensive income and expenditure survey of the household sector once in five years, when stabilises, will complement the present procedure and provide a cross-validation for the household savings estimates. Thereafter, both the methods would be used in the estimation and would complement each other.
Treatment of Currency Holdings by Households
VI.c Rather than using a fixed ratio like 93.0 per cent, which is a rough approximation, the HLC recommends that the currency held by households as per the latest available flow-of-funds data be considered for the purpose of estimating the currency component for the household sector’s financial savings estimation. As the latest flow-of-funds data is available up to 2000-01 and significant shift in behavioural ratios (such as currency holdings with the public) might have happened since then with structural changes in the economy, the HLC recommends compilation of flow-of-funds data in a more timely manner to consider different ratios including the ratio of households’ cash holding on a more realistic basis. Therefore, the HLC recommends that the flow-of-funds accounts of the Indian economy need to be compiled regularly and in a more up-to-date manner. There is a need to closely examine the current data gaps and constraints coming in the way of compiling the flow-of-funds accounts regularly.
12 The recommendations of the HLC are provided here chapter-wise with the paragraph numbers corresponding to those in the respective chapters.
VI.d Till the flow-of-funds accounts compilation is updated on a regular basis, alternatively, the HLC recommends periodic review of the assumed proportion of the household share of ‘currency with public’. While estimating the household financial savings for a particular year, it may be appropriate to deduct the sectoral currency holdings (to the extent they are available for the organised sectors) from the ‘currency with public’. In case the former is not available, estimates for the year may be approximated by using the latest 2 to 3 years average holdings. This practice may enable to move away from the assumed proportion of the household share of ‘currency with public’ in a phased manner. Therefore, in future, household currency holding can be estimated residually following the method as Stated in Table 6.4 for the purpose of estimation of the household financial savings. For this purpose, data on currency held by the corporate sector can be sourced from DSIM, RBI and currency holding by the Government sector can be sourced from the CSO.
VI.e RBI’s annual survey on ‘Composition and Ownership Pattern of Scheduled Commercial Bank Deposits’ needs to be looked at for further refinement in terms of :
VI.f In view of the emerging importance of farmers and institutions like Non- Government Organisations (NGOs) and self-help groups (SHGs) in the financial system and also from the perspective of policy issues, the HLC recommends that such unincorporated non-profit institutions be treated as separate categories under households. Accordingly, there is need to capture these entities in the returns for deposits provided by banks to the RBI.
VI.g Since the ownership of deposits by sectors is not available for the latest year for which estimation of financial savings is undertaken and there is usually a year’s lag, the ratio for the year of the estimation needs to be projected. In this pursuit, an appropriate statistical basis for arriving at the ratios of household ownership in deposits (like using the average for the latest 2 to 3 years) needs to be arrived at through a consultative approach among various institutions such as the CSO, RBI, etc.
VI.h Presently, as per the existing method in the compilation of household financial savings, use is made of Section 42 data (as of the last reporting Friday of the year) for data on commercial banks’ deposits for each year while form X data on liabilities and assets of scheduled commercial banks in India for the bifurcation of deposits into current, savings and fixed deposits, the latter being on end-March basis, and the Ownership Pattern of Scheduled Commercial Bank Deposits on an end-March basis. There is, thus, a need to standardise the database for the estimation of household deposits by using consistently the March 31 figure in place of the last reporting Friday of March. This is available for every year with a lag of three to four months.
Treatment of Co-operative Bank Deposits
VI.i In the light of genuine difficulties expressed by NABARD in regularly compiling the comprehensive data, NABARD may endeavour undertaking “projections”, which could be revised when firm data become available. The data issues need to engage the attention of the highest level in NABARD. In this context, the HLC recommends that NABARD should be involved in providing a projection of household deposits in co-operative banks and credit societies to get around the problem of considerable time-lag in the publication such as ‘Statistical Statements Relating to the Co-operative Movement in India (Credit and Non-credit societies)’.
VI.j All efforts should be undertaken to improve the time gap in the publication ‘Statistical Statements Relating to the Co-operative Movement in India (Credit and Non-credit societies)’, a process that is said to be underway at the NABARD.
VI.k NABARD should continue in its role as the nodal agency for the co-operative sector and provide data for the compilation of national accounts, savings estimates and FoF accounts in so far as the cooperative sector is concerned (Annexes A6.5.3 and A6.5.4). In this regard, NABARD may collaborate with National Federation of State Co-operative Banks (NAFSCOB), National Cooperative Union of India (NCUI) as these agencies are publishing some basic data on credit and non-credit societies.
VI.l Considering the similarity in the nature of issues, the HLC’s recommendations pertaining to cooperative credit societies may be applied to cooperative non-credit societies.
Treatment of Deposits with Non-banking Companies
VI.m As the discontinuation of the survey on “Growth of Deposits with Non-banking Companies” since 1995-96 puts constraints on a reliable estimation of household deposits with non-banking companies, the HLC recognises that there exists large data gap in the estimation of household savings in the form of deposits with non-banking companies, because of non-inclusion of a wide array of unregistered companies. Hence, the HLC recommends that a census should be conducted on a regular basis, say once in five years, covering all companies incorporated with the Department of Company Affairs. The census should collect data on assets, liabilities, income and expenditure of NBFCs including the unregistered/exempted category of NBFCs. The census should be conducted by DSIM, RBI in collaboration with the Department of Company Affairs, Government of India, if necessary by outsourcing the same. It may be noted that this is in consonance with the recommendations made earlier by the Committee on Informal Financial Sector Statistics, 2001 (Chairman: P. Venkataramaiah).
VI.n The HLC recommends that the data emerging from the census on the assets/liabilities position of the NBFCs should be appropriately incorporated in the flow-of-funds accounts also.
VI.o In respect of companies registered with the RBI, the RBI should provide the necessary details of deposits of public. Data for registered companies have to be firmed up with appropriate consolidation of data and follow up if response is weak. For the unregistered companies, sample studies will have to be undertaken and their results will have to be used after establishing proper blow-up factors.
Treatment of Life Insurance Funds
VI.p The HLC recommends that the IRDA should be involved in the household financial savings estimation by way of providing regular information on ‘life funds’ consolidated for all insurance institutions – both in the public and private sector in the format prescribed in this Report (A6.5.5).
VI.q To net out the household liabilities against assets in respect of the insurance sector, the IRDA may arrange to get the required data on the insurance institutions’ ‘loans to their staff’ in addition to the policy-holders.
VI.r The RBI may approach the IRDA to provide combined balance sheet for all insurance institutions – public and private - as per the flow-of-funds format. This will go a long way in the IRDA providing an alternative database not only for ‘life fund’ but also for flow-of-funds compilation at the RBI from time to time (A6.5.6).
Treatment of Provident and Pension Funds
VI.s As the present system of compilation of household savings in provident and pension funds is reasonably satisfactory, the HLC recommends that the existing system may continue.
VI.t Since there is a need to capture household savings in the form of pension funds, the relevant apex body, namely, the Provident Fund Regulatory and Development Authority (PFRDA) should collect and disseminate such information on a regular basis.
VI.u The share of 6.0 per cent of wages and salaries paid to the employees of local authorities as their savings in PF is based on an old exercise conducted by the CSO. Therefore, the HLC recommends that the CSO should conduct a fresh study to update this ratio and keep it updated from time to time.
Treatment of Claims on Government
VI.v The HLC recommends that an appropriate format as prescribed in this Report on the ownership pattern of Government securities (consolidated for all levels of Government), comprising six categories, viz., 1) Government, 2) Banks, 3) Financial Sector other than Banks, 4) Non-Service Sector (Corporates, Firms and Societies), 5) External Sector and 6) Household Sector, may be prepared by the RBI to provide the data based on the revised format (Annex A6.6) as at end-March every year, so that the residual status can be accorded to household (as defined in national accounts and FoF framework) in this instrument. The concerned Department within the RBI should ensure the providing of such information for estimation of household financial savings estimates.
Treatment of Shares, Bonds, Debentures and Units of Mutual Funds
VI.w The HLC recommends the involvement of the SEBI in providing information on a regular basis to the RBI on areas like annual subscription to public issues of shares, debentures, mutual funds and commercial bonds (each separately and consolidated for all depositories) as per the ownership categories (categories of subscribers are Qualified Institutional Investors, FIIs, NRIs, corporate, trusts and other categories) from which the RBI will extract household investment in shares, debentures, mutual funds and commercial bonds for household financial savings estimation (Annex A6.5.1). Registrars/ Depositories/AMFI need to be involved for regular data support. Henceforth, the SEBI would arrange to collect the required data from these entities, which are the primary sources of those data, by sensitising them and explaining the requirement of their data for estimation of household financial savings.
VI.x The SEBI may collect the consolidated balance sheet position for all registrars and broker houses and provide the data to the RBI as per the flow-of-funds format (Annex A6.5.2) to be forwarded by the RBI, so that the same can be incorporated in the FoF accounts.
VI.y The HLC recommends that the consolidated Statements of assets/liabilities of all capital market institutions (namely, merchant bankers and registered brokers) should be compiled by the SEBI or have them compiled and forwarded to RBI for compilation of flow-of-funds account of the Indian economy.
VI.z The NABARD should be involved in providing projections of household investment in shares and debentures of co-operative banks and credit as well as non-credit societies to get around the problem of considerable time lag in the publication such as “Statistical Statements Relating to the Co-operative Movement in India”.
VI.aa In view of the back dated Survey of Ownership of Capital of Joint Stock Companies as on end-March 1995, there is a need to update this at least once in five years. The SEBI may look into the modalities of conducting such a survey.
VI.bb Till a reliable flow of data from the SEBI on various parameters is available on a regular basis, the need for a blow-up factor for computing household investment in the shares, debentures, mutual funds and bonds of all companies is there. Accordingly, global paid-up capital series needs to be provided to the RBI by the Ministry of Corporate Affairs.
VI.cc The CSO should forward requisite formats to SEBI for estimation of savings, capital formation and GDP for the bodies under the regulatory purview of SEBI.
Treatment of Trade Debt
VI.dd Till the MCA 21 data is available and can be used for the purpose of financial savings estimation under trade debt, the existing methodology of computing trade debt may be continued. For estimating trade debt figure for all companies from the sample studies of the RBI, there is a need to have an appropriate blow-up factor. As recommended earlier, global paid-up capital series needs to be provided to the RBI by the Ministry of Corporate Affairs.
Treatment of Loans and Advances of the Households
VI.ee The HLC recommends that as BSR data on bank credit is available with a lag of one year, proportion of the previous year may be applied wherever necessary. Care should be taken to ensure that the database on loans and advances by sectors/institutions/categories are comparable.
VI.ff The HLC recommends incorporation of an estimate of loans to households and employees from the non-financial companies. This will entail requisite modifications/inclusion in the questionnaire forwarded to companies by the RBI for conducting the Company Finance Studies.
VI.gg The NABARD should provide a projection of loans and advances to the household sector from the co-operative credit and non-credit societies to get around the problem of considerable time lag in the publication such as ‘Statistical Statements Relating to the Co-operative Movement in India’.
VI.hh The IRDA should provide an estimate of loans and advances to households from the insurance companies – both public and private – by way of providing regular information to the RBI.
VI.ii While the present practice of subtraction of household financial liabilities from the gross financial assets to arrive at the household net financial savings is conceptually appropriate, the problem with this practice, however, is that the household financial liabilities may have been incurred for the purpose of acquisition of not only the financial assets but also physical assets. In the context of deployment of savings, what is important is the concept of ‘transferrable savings’. Hence, the CSO should present the total household savings as:
[Gross Financial Assets + Physical Assets – Financial Liabilities]
Instead of the present practice of reporting as:
[Net financial savings (i.e., Gross Financial Assets – Financial Liabilities + Physical Assets].
It would be appropriate for the CSO to present household financial savings by instruments in gross terms and not net of respective liabilities as is the present practice. In addition, for presenting household savings in form of financial assets, the estimate would consist of gross financial assets less financial liabilities.
New Data Bases
VI.jj On examination of the instruments of financial savings for households, it was agreed by the HLC that presently all the financial instruments available for deployment of household savings are taken into account while estimating the household financial savings. However, there is need to continuously monitor the emergence of new instruments for incorporating them in the savings estimates. Accordingly, new data base for such instruments need to be developed.
VI.kk New databases should be devised/built-up for improving the reliability or checking validity of the estimates of household savings. The HLC examined the present data collection procedure adopted for estimating household financial savings and arrived at a consensus that in the existing scheme of things, although some apex bodies (namely, NABARD and NHB) are already involved, there is a possibility of involving the other apex bodies such as IRDA and SEBI for the purpose of building up an alternative database in respect of financial instruments under their regulatory purview and in respect of assets and liabilities of capital market institutions for the purpose of compiling the flow-of-funds accounts. Towards this pursuit, SEBI’s involvement was envisaged in respect of household investment in shares, debentures, mutual funds and commercial bonds, IRDA’s in respect of ‘life funds’ of insurance companies, NABARD’s in respect of deposit, credit and investment data pertaining to co-operative banks, credit and non-credit societies and NHB’s in respect of household deposits with the housing finance companies. The HLC recommends creation of a regular data supply mechanism from the apex bodies to the RBI for which specific forms will be supplied. Going forward, it is also envisioned that all the apex bodies are engaged in the ongoing review of the data on household financial savings from the following standpoints:
i. Identification of the database used;
ii. Methodology prescribed and in practice used;
iii. Validating the data as well as results; and
iv. Comment on changes required in the procedure.
VI.ll The HLC agreed that there is a need for field studies by different institutions like CSO and NSSO for developing new databases. The appropriate case studies and type studies to be undertaken may be funded by CSO and RBI.
Institutional Support for Statistics
VI.mm The issue of institutional support for generating reliable statistics as public good was discussed. The HLC was convinced that constraints by way of inadequate staffing of the desks involved with timely compilation of massive statistical exercises have led to difficulties in completion of such exercises in time. The HLC recommends that the National Statistical Commission should identify such units in NSSO, CSO and the Research Departments in the RBI for strengthening them through appropriate staffing so that in future statistical exercises like income-expenditure survey, Company Finance Studies, BSR, FoF and similar exercises can be completed expeditiously at these organisations.
Private Corporate Sector Savings
VII.a With progressive implementation of MCA21 and improvement in data reporting, the coverage is expected to improve further. Therefore, the HLC strongly suggests using MCA21 data for estimating savings and capital formation of non-Government non-financial companies and non-banking financial companies. Once data quality and reporting issues are resolved, it is suggested to do away with the present methodology and implement direct aggregation method based on MCA21 data.
VII.b In addition to estimating the corporate savings and capital formation for the non-Government and non-financial companies and non-banking financial companies using the present blow up factor methodology, estimates may be made using MCA21 global data from the year 2008-09. The two sets of estimates may be compared for improving coverage and quality of MCA21 data base. It is expected that MCA21 data base would stabilise by 2010-11 and accordingly, the HLC recommends that savings and investment estimates from the year 2010-11 may be made using MCA21 data for all companies, dispensing with the blow up factor method.
VII.c The HLC suggests including the following additional data fields in Form 23ACA submitted under MCA21 as (a) net amount transferred to reserves, (b) net amount transferred to Balance sheet, (c) capital gains (+)/losses(-), and (d) income(+)/expenditure(-) related to previous years. In addition, it was decided that net deferred tax liability could be taken from balance sheet as a difference in current year and previous year figure, which is already being captured in Form 23AC. The HLC also indicated including two additional data fields, viz., non-producible intangible assets and revaluation of fixed assets in Form 23AC.
VII.d The HLC also considered MCA21 data for supplementing relevant information required for estimating household financial savings. In order to incorporate the elements for use in estimating household financial savings, the HLC suggests including the following items in the balance sheet structure in Form 23AC as (a) public deposits, (b) trade debt, (c) loans and advances to public (including Directors and employees), (d) investment in Government securities, (e) cash at hand and (f) bank balances.
VII.e There are few other indicators relating to private corporate sector activity which are envisaged to be critically important to banking sector and national economy. Inclusion of those items in 23AC would facilitate better understanding between corporate performance and bank lending. In this context, the HLC suggests including (a) borrowing from banks (under ‘Secured Loans’) and (b) borrowing from banks (under ‘Un-secured Loans’). In addition, it is worthwhile to include reporting of installed capacity (under ‘Turnover details of three principal products’, Form 23ACA) to build up a ‘capacity utilisation index’ at national level. (Suggested formats for Form 23AC and Form 23ACA are presented at the end of this Report). Further, the HLC suggests MCA to explore collection of information on different types of employment from companies.
VII.f As regards the data quality issues between two databases that are maintained by the MCA and RBI, the HLC suggests that data definitions must be unique, and the practice and definitions followed in RBI company finance studies should be implemented in MCA21 data so that these two datasets are consistent and comparable. In addition, the metadata issues and sources of discrepancy should be sorted out mutually between MCA and RBI.
VII.g The HLC, upon in-depth deliberation, notes the innovative features of XBRL and feels that XBRL platform may be helpful in assuring consistency and accuracy of reporting system in the context of corporate data reporting in the country. In particular, the HLC suggests the Ministry of Corporate Affairs to explore the likely benefits from adopting XBRL platform for its’ MCA 21 database.
VII.h Further, noting the role played by the ICAI as a nodal institute for the XBRL-India, the HLC recommends that the ICAI works with the MCA towards inclusion of MCA 21 database under the XBRL platform.
VII.i In order to capture the data at the RBI-end, the MCA needs to provide appropriate access rights, specifically computable format electronically, to the MCA21 database so that dataflow is ensured.
VII.j In respect of cooperative institutions, there is an urgent need to fill up the data gaps. The NABARD should speed up bringing out their annual publications on Statistical Statements Relating to Cooperative Movements in India (credit and non-credit societies) within a period of one year instead of the current delay of say, four years. The HLC is aware of the arduous task ahead, but nevertheless wishes to emphasise the need to correct this long standing data gap once and for all; it will go a long way in improving the data base on the estimation of savings and capital formation as are derived from the cooperative sector.
VII.k The HLC also recommends that for the years for which the required data are not available as detailed in the NABARD’s above-mentioned publication, the NABARD should put in place a regular system of generating the required estimates based on information available for major institutions or otherwise and making them available to the RBI and CSO from time to time. This should cover all aspects of data requirements for household savings, and savings and investment of cooperative credit and non-credit institutions as well as related area of flow-of-funds accounts. For this purpose, the CSO should provide the NABARD with appropriate formats in which the data have to be furnished.
VII.l Presently, the CSO is estimating the savings of private insurance based on the data available from the Annual Reports of IRDA. This is considered adequate.
VII.m There is need to improve the coverage of non-profit corporate institutions serving the private corporate sector. The HLC suggests identifying the frame of such companies. The CSO may undertake sample surveys and also identify appropriate blowing up factor by analysing accounts of sample companies.
VII.n The HLC feels the need for an ongoing consultative approach and strengthening of the statistical system at concerned organisations namely, CSO, NABARD, MCA and RBI.
VII.o The HLC strongly suggests the setting up of a full-fledged unit/cell at the MCA to improve coverage, quality and timeliness of MCA21 database.
VII.p The HLC recommends augmenting the staffing position at the RBI to enable handling and analysis of huge corporate database, expected to flow from MCA21 to the RBI.
VII.q The HLC also recommends strengthening statistical units both at the CSO, NSSO and NABARD.
VII.r The HLC feels that basing savings estimates on ‘mark to market basis’ may not be apt as it may lead to wide fluctuations from one reporting period to the next even when the underlying fundamentals do not change. Moreover, absence of liquid market for various types of assets also makes such estimation inappropriate.
Estimation of Public Sector Savings
VIII.a The HLC recommends creation of a separate category for Quasi-Government Bodies in the CSO’s estimates of GDP, consumption expenditure, savings and capital formation. Regarding capital grants made by the central and State Governments to the autonomous Government institutions, the HLC recommends that these grants should be treated as revenue expenditure in the donor’s accounts (which will reduce their savings), and included in the total receipts of the donee’s (which will show corresponding increase in the savings, if the capital grants are utilised for acquisition of fixed assets).
VIII.b The CSO should make separate estimates of GDP, consumption expenditure, savings and capital formation for the Local Bodies. These could best be prepared based on census of Urban Local Bodies and on sample basis in the case of Rural Local Bodies. For this purpose, States may be provided financial assistance and training by the CSO to undertake analysis of Local Bodies’ accounts.
VIII.c The CSO, instead of analysing Profit and Loss Accounts of all the UTI schemes separately, should explore the feasibility of using consolidated data of all mutual funds which is available with the Association of Mutual Fund, as the treatment of UTI scheme applicable to all mutual funds.
VIII.d The CSO or the Planning Commission or the nodal agencies for the PPPs, should obtain the annual accounts of the PPPs in the private sector and analyse them for the purpose of estimating savings and capital formation made by them.VIII.e The HLC recommends that the CSO should include the capital expenditures of Defence on construction, ordinance factories and defence establishments as capital formation.
Estimation of Capital Formation
IX.a On the issue of the treatment of the estimates of capital formation arrived through three different methods to be shown separately without any adjustments, the HLC recommends that the estimates of capital formation arrived from the savings side should be treated as firmer estimates relative to estimates based on commodity flow / expenditure approach as those estimates are based on numerous rates and ratios and various adhoc sources. It was, therefore, recommended that for operational convenience, only one figure of capital formation arrived at through savings route should be used for compiling aggregate rates of capital formation as is being done at present.
IX.b Keeping in view the fact that the quality of estimates of savings of households in physical assets depends indirectly on the overall estimates of GCF arrived through commodity-flow approach, the HLC recommends regular updation of rates and ratios used in this approach.
IX.c The rates and ratios used in the estimation of various types of capital goods should be updated through small studies to be conducted with the help of State Governments and other research institutions, such as agro-economic research centres, etc.
IX.d The HLC recommends that efforts should be made to estimate the value of materials other than cement, iron & steel, bricks, furniture & fittings and timber so that the ratio used for blowing up other materials could be brought down. It was also recommended that ratios used for factor payments should be revised at the time of base year revision.
IX.e There should be some adjustment for recycled bricks in the estimation procedure of value of output of construction.
IX.f The value of cement used in construction should be arrived at by taking into account different qualities of cement using appropriate weights.
IX.g Regarding Valuables, the HLC recommends that the estimates of net acquisition of valuables should be shown as a separate category distinct from the GFCF and Change in Stocks in the estimates of Gross Capital Formation.
IX.h Filing of returns of both public sector and private sector projects under PPPs should be made mandatory under provision of Indian Statistical Act.
IX.i The MCA should make available the annual accounts of companies under construction, as it was observed that accounts filed under MCA21 would includes these companies.
IX.j Regarding the estimation of capital formation by industry (expenditure approach), the HLC felt that possible improvement to this is the launching of annual enterprise surveys (or annual surveys of non manufacturing enterprises, ASNME), as recommended by the NSC. The HLC, therefore, recommends that the Steering Committee of NSSO should be requested to immediately launch ASNME on a regular basis.
IX.k The HLC also recommends that the Steering Committee of the NSSO may be requested to launch annual survey of non-manufacturing enterprises or annual enterprise surveys focusing on larger enterprises which maintain annual accounts for collecting data on income, expenditure and capital formation.
IX.l Expressing concern about the deteriorating quality of ASI data, the HLC observed that adequate staff/logistic and infrastructural support are required to improve the quality of ASI data, besides taking measures to simplify the ASI schedule, electronic submission of ASI returns, increasing the coverage of census factories and releasing separate data for the census factories.
IX.m Having regard to the above under-coverage issues in IIP, the HLC recommends that the CSO should devise suitable procedures, including the usage of central excise databases on production, to cover total production as far as medium and large scale industrial undertakings are concerned, in respect of the commodities included in the item-basket of IIP.
IX.n The HLC further recommends that the CSO may explore preparing an alternative index of sales/ total income by taking into account both industry and service activities in the country based on quarterly financial results announced by the listed companies.
Capital Formation at Regional Level
X.a The Steering Committee of the NSSO may be requested to launch annual survey of non-manufacturing enterprises or annual enterprise surveys focusing on larger enterprises which maintain annual accounts for collecting data on income, expenditure and capital formation. The surveys should be designed in such a manner that reliable estimates of capital formation are available, for each State -however small or big it is. This is particularly important for the north-east States and the newly formed States.
X.b The present enterprise surveys should be conducted with suitable sample size (including a usable sample from each State) for estimation of capital formation at State level and by industry.
X.c Regarding the estimation of State level capital formation, the HLC observed that most of the States compile GFCF for only public sector and the compilation is done by industry of use. The state wise data on public sector is available from the Gross Block of public enterprises survey. The main problem is getting the data on private investments made in the States. For this, only annual enterprise surveys can provide reliable estimates of regional capital formation. The Steering Committee of the NSSO, therefore, should be requested to launch annual enterprise surveys, which should provide reliable data on capital formation at state level and by industry. Other options to compile GFCF could be to use capital–output ratios of all-India or public sector within the State. With increase in coverage of companies in the MCA21, it should, however, be possible to get state-wise estimates of capital formation on the basis of location of companies, rather than on the basis of location of establishments, which is what is required at State level.
X.d Regarding GSDP at market prices, the States should attempt to release this data by adding indirect taxes net of subsidies to the GSDP at factor cost (which follows income-originating concept). The data on indirect taxes net of subsidies for the States, including those of local bodies, part is available from the analysis of budget documents of the State Governments, and for the Centre’s part of these taxes and subsidies (including indirect subsidies from the Centre in each State), which is difficult to estimate but possible, efforts should be made to estimate the same.
X.e The States may also try to estimate savings by subtracting private final consumption expenditure and government final consumption expenditure from the estimated GSDP at market prices, after assuming that the net transfers and factor incomes from abroad and from other states is either negligible or making suitable adjustments from the data available at State level on bank deposits. This procedure gives a rough estimate of savings in the State, which can further be approximated to GCF, if one assumes the net capital inflow to the state is negligible. This is, however, a very crude and rough estimate of both savings and GCF in the State, but could be an indicative dataset. Another problem in this procedure is the lack of availability of data on private final consumption expenditure. States can derive this data from the NSS Consumer Expenditure surveys by suitably adjusting to the differences between consumption expenditure data shown in NSS and NAS. For estimating income accruals (if one follows this approach to estimate GSDP), the data on factor income flows across States is needed. Flows of goods and non-factor services don’t create conceptual difficulty, but they create practical difficulty for estimation. However, such flows are now available to some extent from Railways and Road Transport operators. The international trade needs to be captured.
X.f The HLC recommends that enterprise surveys should be conducted with suitable sample size for estimation of capital formation by industry and by States. Till such time, alternate methods like working out capital output ratios, using ASI data at two digit level and studying its variations with all India capital output ratios may be tried for estimating capital formation at State level.
Issues related to Compilation of Flow-of-Funds Accounts
XII.a Cooperative sector data: All efforts should be undertaken to improve the time gap in the publication ‘Statistical Statements Relating to the Co-operative Movement in India (Credit and Non-credit societies)’, a process that is said to be underway at the NABARD.
XII.b In the light of genuine difficulties expressed by NABARD in regularly compiling the comprehensive data, NABARD may endeavour undertaking “projections”, which could be revised when firm data become available. The data issues need to engage the attention of the highest level in NABARD. In this context, the HLC recommends that NABARD should be involved in providing a projection of household deposits in co-operative banks and credit societies to get around the problem of considerable time-lag in the publication such as ‘Statistical Statements Relating to the Co-operative Movement in India (Credit and Non-credit societies)’.
XII.c NABARD should continue in its role as the nodal agency for the co-operative sector and provide data for the compilation of national accounts, savings estimates and FoF accounts in so far as the cooperative sector is concerned (Annexes A6.5.3 and A6.5.4). In this regard, NABARD may collaborate with National Federation of State Co-operative Banks (NAFSCOB), National Cooperative Union of India (NCUI) as these agencies are publishing some basic data on credit and non-credit societies.
XII.d Treatment of non-banking companies: Since there exists large data gap in the estimation of non-banking companies, because of non-inclusion of a wide array of unregistered companies, the HLC recommends that a census should collect data on assets, liabilities, income and expenditure of NBFCs including the unregistered/exempted category of NBFCs. The census should be conducted by DSIM, RBI in collaboration with the Ministry of Corporate Affairs, Government of India.
XII.e The HLC recommends that the data emerging from the census on the assets/liabilities position of the NBFCs should be appropriately incorporated in the flow-of-funds accounts also.
XII.f In respect of companies registered with the RBI, data for registered companies have to be firmed up with appropriate consolidation and follow up if response is weak. For the unregistered companies, sample studies will have to be undertaken and their results will have to be used after establishing proper blow-up factors.
XII.g Consolidated data on the insurance sector: The RBI may approach the IRDA to provide combined balance sheet for all insurance institutions – public and private - as per the flow-of-funds format. This will go a long way in the IRDA providing an alternative database not only for ‘life fund’ but also for flow-of-funds compilation at the RBI from time to time (A6.5.6).
XII.h Consolidated data for capital market institutions: The SEBI may collect the consolidated balance sheet position for all registrars and broker houses and provide the data to the RBI as per the flow-of-funds format (Annex A6.5.2) to be forwarded by the RBI, so that the same can be incorporated in the FoF accounts.
XII.i The HLC recommends that the consolidated Statements of assets/liabilities of all capital market institutions (namely, merchant bankers and registered brokers) should be compiled by the SEBI or have them compiled and forwarded to RBI for compilation of flow-of-funds account of the Indian economy.
XII.j Ownership of Government securities: The HLC recommends that an appropriate format as prescribed in this Report on the ownership pattern of Government securities (consolidated for all levels of Government), comprising six categories, viz., 1) Government , 2) Banks, 3) Financial Sector other than Banks, 4) Non-Service Sector (Corporates, Firms and Societies), 5) External Sector and 6) Household Sector, may be prepared by the RBI to provide the data based on the revised format (Annex A6.4) as at end-March every year, so that the residual status can be accorded to household (as defined in national accounts and FoF framework) in this instrument. The concerned Department within the RBI should ensure the providing of such information for estimation of household financial savings estimates.
XII.k In respect of the accounts of local authorities, only the data for port trusts are available. In this regard, the data for the local self Government may also be provided to enhance the coverage of flow-of-funds accounts.
Treatment of Pure Households (Consumer Households)
XIV.a In this regard, the HLC had detailed interaction with the apex financial bodies (namely, RBI, SEBI, NABARD and NHB) which are regulatory authorities for important instruments (namely, shares and debentures, cooperative deposits, investment and credit etc.). Detailed formats for such instruments of financial savings deployed by households disaggregated along the lines like, farmers and pure households have been devised. Once these alternative data base develop, it is thought that one will be in a position to make an estimate of savings by pure households, farmers, household enterprises and unincorporated bodies.
The HLC, after due deliberations on the concept and methodology presently followed to estimate savings, feels that it is not possible to go for separate estimation of household savings for ‘pure households (consumer households)’. This is mainly due to the methodological practice in national accounts currently in vogue to accord a residual treatment for households, given that households in a residual sense represents composite households - incorporating ‘pure households’ as well as others. The HLC feels that the three steps suggested below will enable the disaggregated estimation of household savings in future to some extent:
i) Detailed instrument-wise data of select financial savings in respect of pure households, farmers, household enterprises and unincorporated bodies, if made available by the concerned institutions.
i) Once the comprehensive income–expenditure survey of the household sector is available, an attempt can be made to estimate the savings of the pure households. It is important that to be able to get the savings estimates disaggregated along the lines of the national account concept of households (namely, for the unincorporated enterprises etc.), the Enterprise Survey is conducted concurrent with the income-expenditure survey.
iii) An appropriate design of the survey format is important in this context to be able to obtain State-level estimates of savings for the components of the household sector.
Treatment of Current Transfers
XV.a The HLC recognises that in the event of a shift to direct estimation of household savings, the issue of treatment of current transfers would assume significance. This is because as the amount of current transfers that the households receive from ‘rest of the world’ and their current expenditure out of this need to be captured through either (i) through studying the pattern from the banking channels, and/or (ii) household surveys of income and expenditure. Under option (i), it would be required of the RBI to make available the survey results based on banking channel well in time. Therefore, the HLC recommends that, as of now, the treatment of remittances in vogue i.e., the CSO treating remittances as a part of personal disposable income and the FoF accounts continuing to capture remittances’ impact on instruments of savings to the extent they get embedded in the domestic sector through increase in the household financial savings instruments, namely, deposits, insurance, shares and debentures, etc) may be continued till we completely switch over to the direct (survey) method of estimation of household savings.
Statistical Annex |
SA 1 : Sector-wise Domestic Savings (At Current Prices) |
(Rupees crore) |
Year |
Household sector |
Private corporate sector |
Public sector |
Gross domestic savings (4+5+6) |
Consumption of Fixed Capital |
Net domestic savings |
Financial savings |
Physical |
Total(2+3) |
1 |
2 |
3 |
4 |
5 |
6 |
7 |
8 |
9 |
New Series (Base : 1999-2000) |
1950-51 |
62 |
516 |
578 |
93 |
200 |
871 |
526 |
345 |
1951-52 |
14 |
532 |
546 |
136 |
287 |
969 |
591 |
378 |
1952-53 |
72 |
527 |
599 |
64 |
182 |
845 |
634 |
211 |
1953-54 |
142 |
474 |
616 |
90 |
169 |
875 |
647 |
228 |
1954-55 |
282 |
389 |
671 |
118 |
199 |
988 |
677 |
311 |
1955-56 |
429 |
562 |
991 |
134 |
231 |
1356 |
481 |
875 |
1956-57 |
333 |
775 |
1108 |
155 |
298 |
1561 |
546 |
1015 |
1957-58 |
291 |
629 |
920 |
121 |
315 |
1356 |
621 |
735 |
1958-59 |
362 |
572 |
934 |
140 |
305 |
1379 |
685 |
694 |
1959-60 |
433 |
772 |
1205 |
185 |
330 |
1720 |
765 |
955 |
1960-61 |
456 |
680 |
1136 |
281 |
535 |
1952 |
847 |
1105 |
1961-62 |
489 |
654 |
1143 |
320 |
611 |
2074 |
945 |
1129 |
1962-63 |
499 |
895 |
1394 |
344 |
702 |
2440 |
1046 |
1394 |
1963-64 |
743 |
696 |
1439 |
394 |
870 |
2703 |
1049 |
1654 |
1964-65 |
714 |
970 |
1684 |
389 |
1004 |
3077 |
1205 |
1872 |
1965-66 |
1072 |
1337 |
2409 |
405 |
1019 |
3833 |
1404 |
2429 |
1966-67 |
864 |
2155 |
3019 |
424 |
885 |
4328 |
1652 |
2676 |
1967-68 |
865 |
2128 |
2993 |
410 |
890 |
4293 |
1896 |
2397 |
1968-69 |
795 |
2327 |
3122 |
439 |
1096 |
4657 |
1935 |
2722 |
1969-70 |
919 |
3292 |
4211 |
549 |
1284 |
6044 |
2218 |
3826 |
1970-71 |
1371 |
3000 |
4371 |
672 |
1528 |
6571 |
2562 |
4009 |
1971-72 |
1555 |
3362 |
4917 |
769 |
1595 |
7281 |
2919 |
4362 |
1972-73 |
2128 |
3135 |
5263 |
806 |
1719 |
7788 |
3348 |
4440 |
1973-74 |
3612 |
3978 |
7590 |
1083 |
2239 |
10912 |
4059 |
6853 |
1974-75 |
2374 |
5294 |
7668 |
1465 |
3165 |
12298 |
5276 |
7022 |
1975-76 |
3918 |
5245 |
9163 |
1083 |
3950 |
14196 |
6080 |
8116 |
1976-77 |
4852 |
6371 |
11223 |
1181 |
4916 |
17320 |
6554 |
10766 |
1977-78 |
5853 |
7766 |
13619 |
1413 |
4963 |
19995 |
7231 |
12764 |
1978-79 |
6658 |
9642 |
16300 |
1652 |
5649 |
23601 |
8200 |
15401 |
SA 1 : Sector-wise Domestic Savings (At Current Prices)(Concld.) |
(Rupees crore) |
Year |
Household sector |
Private
corporate
sector |
Public sector |
Gross
domestic
savings
(4+5+6) |
Consumption of Fixed Capital |
Net
domestic savings |
Financial savings |
Physical |
Total(2+3) |
1 |
2 |
3 |
4 |
5 |
6 |
7 |
8 |
9 |
New Series (Base : 1999-2000) |
1979-80 |
6081 |
9747 |
15828 |
2398 |
5987 |
24213 |
10013 |
14200 |
1980-81 |
8610 |
10114 |
18724 |
2339 |
5818 |
26881 |
11736 |
15145 |
1981-82 |
9614 |
10045 |
19659 |
2560 |
8677 |
30896 |
14085 |
16811 |
1982-83 |
12739 |
8491 |
21230 |
2980 |
9577 |
33787 |
16305 |
17482 |
1983-84 |
13294 |
12828 |
26122 |
3254 |
8715 |
38091 |
18533 |
19558 |
1984-85 |
17879 |
14810 |
32689 |
4040 |
8724 |
45453 |
21397 |
24056 |
1985-86 |
18538 |
18404 |
36942 |
5426 |
11021 |
53389 |
25295 |
28094 |
1986-87 |
23336 |
18317 |
41653 |
5336 |
11047 |
58036 |
28935 |
29101 |
1987-88 |
26820 |
29087 |
55907 |
5932 |
10425 |
72264 |
32979 |
39285 |
1988-89 |
27183 |
39724 |
66907 |
8486 |
11773 |
87166 |
38634 |
48532 |
1989-90 |
37998 |
44767 |
82765 |
11845 |
11482 |
106092 |
45567 |
60525 |
1990-91 |
49640 |
55149 |
104789 |
15164 |
10057 |
130010 |
51078 |
78932 |
1991-92 |
62101 |
41394 |
103495 |
20304 |
17290 |
141089 |
61971 |
79118 |
1992-93 |
65367 |
57948 |
123315 |
19968 |
16399 |
159682 |
72129 |
87553 |
1993-94 |
94738 |
54796 |
149534 |
29866 |
10533 |
189933 |
80882 |
109050 |
1994-95 |
120733 |
68057 |
188790 |
35260 |
23412 |
247462 |
93822 |
153640 |
1995-96 |
105719 |
95296 |
201015 |
59153 |
30834 |
291002 |
111126 |
179876 |
1996-97 |
141661 |
79312 |
220973 |
62209 |
29886 |
313068 |
128391 |
184677 |
1997-98 |
146777 |
123531 |
270308 |
65769 |
27429 |
363506 |
143749 |
219757 |
1998-99 |
180346 |
149414 |
329760 |
68856 |
-8869 |
389747 |
162202 |
227545 |
1999-00 |
206602 |
205914 |
412516 |
87234 |
-15494 |
484256 |
181422 |
302835 |
2000-01 |
215219 |
239634 |
454853 |
81062 |
-36882 |
499033 |
201817 |
297215 |
2001-02 |
247476 |
256689 |
504165 |
76906 |
-46186 |
534885 |
228298 |
306588 |
2002-03 |
253255 |
315879 |
569134 |
94772 |
-15936 |
647970 |
250477 |
397493 |
2003-04 |
313260 |
357516 |
670776 |
120730 |
29521 |
821026 |
279982 |
541046 |
2004-05 |
318264 |
406846 |
725110 |
206363 |
68951 |
1000424 |
328923 |
671501 |
2005-06 P |
420841 |
445915 |
866756 |
268329 |
92263 |
1227348 |
378804 |
848544 |
| 2006-07 QE |
467985 |
517837 |
985822 |
322242 |
133359 |
1441423 |
434468 |
1006956 |
P : Provisional. QE : Quick Estimates. Sources : Central Statistical Organisation |
SA 1a : Sector-wise Domestic Savings (At Current Prices) |
(As percentage to GDP) |
Year |
Household sector |
Private corporate sector |
Public sector |
Gross domestic savings (4+5+6) |
Consumption of Fixed Capital |
Net domestic savings |
Financial savings |
Physical |
Total(2+3) |
1 |
2 |
3 |
4 |
5 |
6 |
7 |
8 |
9 |
New Series (Base : 1999-2000) |
1950-51 |
0.6 |
5.1 |
5.7 |
0.9 |
2.0 |
8.6 |
5.2 |
3.4 |
1951-52 |
0.1 |
5.0 |
5.1 |
1.3 |
2.7 |
9.0 |
5.5 |
3.5 |
1952-53 |
0.7 |
5.0 |
5.7 |
0.6 |
1.7 |
8.0 |
6.0 |
2.0 |
1953-54 |
1.2 |
4.1 |
5.4 |
0.8 |
1.5 |
7.6 |
5.6 |
2.0 |
1954-55 |
2.6 |
3.6 |
6.2 |
1.1 |
1.8 |
9.1 |
6.2 |
2.9 |
1955-56 |
3.9 |
5.1 |
9.0 |
1.2 |
2.1 |
12.3 |
4.4 |
7.9 |
1956-57 |
2.5 |
5.9 |
8.4 |
1.2 |
2.3 |
11.9 |
4.2 |
7.7 |
1957-58 |
2.1 |
4.6 |
6.8 |
0.9 |
2.3 |
10.0 |
4.6 |
5.4 |
1958-59 |
2.4 |
3.8 |
6.2 |
0.9 |
2.0 |
9.1 |
4.5 |
4.6 |
1959-60 |
2.7 |
4.9 |
7.6 |
1.2 |
2.1 |
10.8 |
4.8 |
6.0 |
1960-61 |
2.6 |
3.9 |
6.5 |
1.6 |
3.1 |
11.2 |
4.9 |
6.3 |
1961-62 |
2.7 |
3.5 |
6.2 |
1.7 |
3.3 |
11.2 |
5.1 |
6.1 |
1962-63 |
2.5 |
4.5 |
7.0 |
1.7 |
3.5 |
12.3 |
5.3 |
7.0 |
1963-64 |
3.3 |
3.1 |
6.3 |
1.7 |
3.8 |
11.9 |
4.6 |
7.3 |
1964-65 |
2.7 |
3.7 |
6.3 |
1.5 |
3.8 |
11.6 |
4.5 |
7.0 |
1965-66 |
3.8 |
4.8 |
8.6 |
1.4 |
3.6 |
13.7 |
5.0 |
8.7 |
1966-67 |
2.7 |
6.8 |
9.5 |
1.3 |
2.8 |
13.6 |
5.2 |
8.4 |
1967-68 |
2.3 |
5.7 |
8.1 |
1.1 |
2.4 |
11.6 |
5.1 |
6.5 |
1968-69 |
2.0 |
5.9 |
7.9 |
1.1 |
2.8 |
11.8 |
4.9 |
6.9 |
1969-70 |
2.1 |
7.6 |
9.7 |
1.3 |
3.0 |
14.0 |
5.1 |
8.8 |
1970-71 |
3.0 |
6.5 |
9.5 |
1.5 |
3.3 |
14.2 |
5.5 |
8.7 |
1971-72 |
3.1 |
6.8 |
9.9 |
1.6 |
3.2 |
14.7 |
5.9 |
8.8 |
1972-73 |
3.9 |
5.7 |
9.6 |
1.5 |
3.1 |
14.3 |
6.1 |
8.1 |
1973-74 |
5.4 |
6.0 |
11.4 |
1.6 |
3.4 |
16.4 |
6.1 |
10.3 |
1974-75 |
3.0 |
6.8 |
9.8 |
1.9 |
4.0 |
15.7 |
6.7 |
9.0 |
1975-76 |
4.7 |
6.2 |
10.9 |
1.3 |
4.7 |
16.9 |
7.2 |
9.6 |
1976-77 |
5.3 |
7.0 |
12.4 |
1.3 |
5.4 |
19.1 |
7.2 |
11.9 |
1977-78 |
5.7 |
7.6 |
13.2 |
1.4 |
4.8 |
19.5 |
7.0 |
12.4 |
1978-79 |
6.0 |
8.7 |
14.6 |
1.5 |
5.1 |
21.2 |
7.4 |
13.8 |
SA 1a : Sector-wise Domestic Savings (At Current Prices) (Concld.) |
(As percentage to GDP) |
Year |
Household sector |
Private
corporate
sector |
Public sector |
Gross domestic savings
(4+5+6) |
Consumption of Fixed Capital |
Net domestic savings |
Financial savings |
Physical |
Total(2+3) |
1 |
2 |
3 |
4 |
5 |
6 |
7 |
8 |
9 |
New Series (Base : 1999-2000) |
1979-80 |
5.0 |
8.0 |
13.0 |
2.0 |
4.9 |
19.8 |
8.2 |
11.6 |
1980-81 |
5.9 |
7.0 |
12.9 |
1.6 |
4.0 |
18.5 |
8.1 |
10.4 |
1981-82 |
5.6 |
5.9 |
11.5 |
1.5 |
5.1 |
18.1 |
8.2 |
9.8 |
1982-83 |
6.7 |
4.4 |
11.1 |
1.6 |
5.0 |
17.7 |
8.5 |
9.2 |
1983-84 |
6.0 |
5.8 |
11.7 |
1.5 |
3.9 |
17.1 |
8.3 |
8.8 |
1984-85 |
7.2 |
5.9 |
13.1 |
1.6 |
3.5 |
18.2 |
8.6 |
9.7 |
1985-86 |
6.6 |
6.5 |
13.1 |
1.9 |
3.9 |
19.0 |
9.0 |
10.0 |
1986-87 |
7.4 |
5.8 |
13.2 |
1.7 |
3.5 |
18.4 |
9.2 |
9.2 |
1987-88 |
7.5 |
8.1 |
15.6 |
1.7 |
2.9 |
20.2 |
9.2 |
11.0 |
1988-89 |
6.4 |
9.4 |
15.8 |
2.0 |
2.8 |
20.5 |
9.1 |
11.4 |
1989-90 |
7.8 |
9.2 |
17.0 |
2.4 |
2.4 |
21.8 |
9.3 |
12.4 |
1990-91 |
8.7 |
9.7 |
18.4 |
2.7 |
1.8 |
22.8 |
9.0 |
13.9 |
1991-92 |
9.5 |
6.3 |
15.8 |
3.1 |
2.6 |
21.5 |
9.5 |
12.1 |
1992-93 |
8.7 |
7.7 |
16.4 |
2.7 |
2.2 |
21.2 |
9.6 |
11.6 |
1993-94 |
10.9 |
6.3 |
17.3 |
3.4 |
1.2 |
21.9 |
9.3 |
12.6 |
1994-95 |
11.9 |
6.7 |
18.6 |
3.5 |
2.3 |
24.4 |
9.2 |
15.1 |
1995-96 |
8.9 |
8.0 |
16.9 |
5.0 |
2.6 |
24.4 |
9.3 |
15.1 |
1996-97 |
10.3 |
5.8 |
16.0 |
4.5 |
2.2 |
22.7 |
9.3 |
13.4 |
1997-98 |
9.6 |
8.1 |
17.7 |
4.3 |
1.8 |
23.8 |
9.4 |
14.4 |
1998-99 |
10.3 |
8.5 |
18.8 |
3.9 |
-0.5 |
22.3 |
9.3 |
13.0 |
1999-00 |
10.6 |
10.5 |
21.1 |
4.5 |
-0.8 |
24.8 |
9.3 |
15.5 |
2000-01 |
10.2 |
11.4 |
21.6 |
3.9 |
-1.8 |
23.7 |
9.6 |
14.1 |
2001-02 |
10.9 |
11.3 |
22.1 |
3.4 |
-2.0 |
23.5 |
10.0 |
13.5 |
2002-03 |
10.3 |
12.9 |
23.2 |
3.9 |
-0.6 |
26.4 |
10.2 |
16.2 |
2003-04 |
11.4 |
13.0 |
24.4 |
4.4 |
1.1 |
29.8 |
10.2 |
19.6 |
2004-05 |
10.1 |
12.9 |
23.0 |
6.6 |
2.2 |
31.8 |
10.4 |
21.3 |
2005-06 P |
11.8 |
12.5 |
24.2 |
7.5 |
2.6 |
34.3 |
10.6 |
23.7 |
| 2006-07 QE |
11.3 |
12.5 |
23.8 |
7.8 |
3.2 |
34.8 |
10.5 |
24.3 |
P : Provisional. QE : Quick Estimates. Sources : Central Statistical Organisation. |
SA 2 : Gross / Net Domestic Capital Formation (At Current Prices) |
(Rupees crore) |
Year |
GFCF |
Change in stocks |
GDCF |
CFC |
CFC |
NDCF |
At current Prices |
At constant prices |
At current prices |
At constant prices |
At current prices |
At constant prices |
At current prices |
At constant prices |
At current prices |
At constant prices |
1 |
2 |
3 |
4 |
5 |
6 |
7 |
8 |
9 |
10 |
11 |
New Series (Base : 1999-2000) |
1950-51 |
877 |
26897 |
160 |
3478 |
850 |
24643 |
526 |
18975 |
324 |
5668 |
1951-52 |
969 |
27704 |
170 |
3198 |
1152 |
31265 |
591 |
19810 |
561 |
11455 |
1952-53 |
892 |
25368 |
20 |
524 |
811 |
23030 |
634 |
20552 |
177 |
2478 |
1953-54 |
898 |
26902 |
-71 |
-1639 |
862 |
26312 |
647 |
21299 |
215 |
5012 |
1954-55 |
1027 |
30345 |
30 |
743 |
1004 |
29508 |
677 |
22144 |
327 |
7364 |
1955-56 |
1295 |
37194 |
62 |
1516 |
1395 |
39798 |
481 |
13693 |
914 |
26106 |
1956-57 |
1636 |
42730 |
240 |
4317 |
1921 |
48223 |
546 |
14900 |
1375 |
33323 |
1957-58 |
1714 |
42773 |
246 |
5412 |
1829 |
44927 |
621 |
16099 |
1208 |
28828 |
1958-59 |
1723 |
43810 |
12 |
309 |
1755 |
44633 |
685 |
17185 |
1070 |
27448 |
1959-60 |
1888 |
44363 |
210 |
3437 |
1951 |
44355 |
765 |
18417 |
1186 |
25938 |
1960-61 |
2179 |
48377 |
333 |
5868 |
2433 |
52500 |
847 |
19328 |
1586 |
33172 |
1961-62 |
2437 |
54340 |
283 |
3996 |
2419 |
51617 |
945 |
20604 |
1474 |
31013 |
1962-63 |
2698 |
57718 |
365 |
4929 |
2880 |
58725 |
1046 |
21928 |
1834 |
36797 |
1963-64 |
3193 |
66627 |
288 |
4077 |
3143 |
63651 |
1049 |
21183 |
2094 |
42468 |
1964-65 |
3712 |
72469 |
368 |
4808 |
3677 |
69412 |
1205 |
22907 |
2472 |
46505 |
1965-66 |
4187 |
75040 |
332 |
4318 |
4432 |
77792 |
1404 |
24723 |
3028 |
53069 |
1966-67 |
4658 |
77479 |
534 |
6220 |
5251 |
84686 |
1652 |
26656 |
3599 |
58030 |
1967-68 |
5139 |
81754 |
433 |
4503 |
5130 |
79229 |
1896 |
28785 |
3234 |
50444 |
1968-69 |
5431 |
83084 |
139 |
1760 |
5073 |
77235 |
1935 |
28115 |
3138 |
49120 |
1969-70 |
5957 |
85370 |
586 |
6182 |
6285 |
87852 |
2218 |
30397 |
4067 |
57455 |
1970-71 |
6367 |
84706 |
844 |
8432 |
6965 |
89870 |
2562 |
32534 |
4403 |
57336 |
1971-72 |
7165 |
90191 |
1110 |
10620 |
7759 |
94318 |
2919 |
34756 |
4840 |
59562 |
1972-73 |
8231 |
96635 |
488 |
4741 |
8085 |
93933 |
3348 |
37141 |
4737 |
56792 |
1973-74 |
9204 |
94137 |
1742 |
13772 |
11304 |
111567 |
4059 |
39498 |
7245 |
72069 |
1974-75 |
11179 |
92708 |
3046 |
17934 |
12951 |
100075 |
5276 |
41862 |
7675 |
58214 |
1975-76 |
13526 |
101967 |
2299 |
14878 |
14079 |
103685 |
6080 |
44093 |
7999 |
59592 |
1976-77 |
15523 |
115195 |
1645 |
11032 |
16011 |
117640 |
6554 |
46665 |
9457 |
70976 |
1977-78 |
17443 |
124154 |
1542 |
8892 |
18530 |
129808 |
7231 |
49548 |
11299 |
80260 |
1978-79 |
19159 |
128311 |
3691 |
22756 |
23729 |
156955 |
8200 |
52421 |
15529 |
104534 |
1979-80 |
21670 |
127834 |
4239 |
20516 |
24793 |
141769 |
10013 |
55224 |
14780 |
86544 |
SA 2 : Gross / Net Domestic Capital Formation (At Current Prices) (Concld.) |
(Rupees crore) |
Year |
GFCF |
Change in stocks |
GDCF |
CFC |
CFC |
NDCF |
At current Prices |
At constant prices |
At current prices |
At constant prices |
At current prices |
At constant prices |
At current prices |
At constant prices |
At current prices |
At constant prices |
1 |
2 |
3 |
4 |
5 |
6 |
7 |
8 |
9 |
10 |
11 |
New Series (Base : 1999-2000) |
1980-81 |
26714 |
137835 |
250 |
1516 |
28975 |
149728 |
11736 |
58371 |
17239 |
91357 |
1981-82 |
32045 |
144160 |
5852 |
19785 |
33507 |
144196 |
14085 |
61478 |
19422 |
82718 |
1982-83 |
36384 |
147850 |
4548 |
14715 |
36353 |
143958 |
16305 |
64899 |
20048 |
79058 |
1983-84 |
41537 |
155828 |
1827 |
5759 |
40608 |
151247 |
18533 |
68432 |
22075 |
82815 |
1984-85 |
48331 |
164424 |
4894 |
14085 |
48745 |
163269 |
21397 |
72365 |
27348 |
90904 |
1985-86 |
57524 |
175621 |
8492 |
22886 |
59623 |
178991 |
25295 |
76491 |
34328 |
102499 |
1986-87 |
65829 |
185520 |
6664 |
17284 |
64391 |
179971 |
28935 |
80811 |
35456 |
99161 |
1987-88 |
76382 |
198624 |
2348 |
5659 |
79089 |
205216 |
32979 |
85730 |
46110 |
119486 |
1988-89 |
91733 |
216453 |
8615 |
19346 |
99470 |
233728 |
38634 |
90990 |
60836 |
142738 |
1989-90 |
109533 |
231192 |
6156 |
12857 |
118371 |
249711 |
45567 |
96868 |
72804 |
152842 |
1990-91 |
131145 |
258420 |
6453 |
12287 |
148206 |
291611 |
51078 |
99921 |
97128 |
191690 |
1991-92 |
144486 |
246267 |
-601 |
-1159 |
144466 |
246099 |
61971 |
106140 |
82495 |
139959 |
1992-93 |
168866 |
262822 |
10046 |
15252 |
173498 |
269647 |
72129 |
112597 |
101369 |
157051 |
1993-94 |
185402 |
272111 |
-1674 |
-1946 |
194724 |
286305 |
80882 |
119648 |
113842 |
166657 |
1994-95 |
224423 |
303156 |
14548 |
18575 |
259355 |
349266 |
93822 |
127366 |
165533 |
221899 |
1995-96 |
291174 |
352767 |
25770 |
29375 |
311782 |
375888 |
111126 |
136598 |
200656 |
239290 |
1996-97 |
318948 |
360490 |
-13987 |
-15695 |
330806 |
374006 |
128391 |
146130 |
202415 |
227876 |
1997-98 |
351713 |
382150 |
13292 |
14624 |
385808 |
419378 |
143749 |
156218 |
242059 |
263160 |
1998-99 |
398511 |
410407 |
-2127 |
-2596 |
408109 |
419885 |
162202 |
167375 |
245907 |
252510 |
1999-00 |
456416 |
456416 |
37583 |
37583 |
506244 |
506244 |
181422 |
181422 |
324823 |
324823 |
2000-01 |
477818 |
456380 |
15467 |
14413 |
511788 |
488658 |
201817 |
193852 |
309970 |
294803 |
2001-02 |
538179 |
490009 |
-1325 |
-1383 |
520655 |
474448 |
228298 |
208469 |
292358 |
265979 |
2002-03 |
584242 |
522592 |
21291 |
19769 |
619485 |
555287 |
250477 |
223652 |
369008 |
331632 |
2003-04 |
687016 |
593964 |
25884 |
17116 |
775647 |
665625 |
279982 |
241369 |
495667 |
424254 |
2004-05 |
894674 |
705945 |
60215 |
41765 |
1013761 |
795642 |
328923 |
262366 |
684838 |
533276 |
| 2005-06 P |
1109160 |
828986 |
86248 |
61702 |
1271953 |
950102 |
378804 |
286266 |
893149 |
663836 |
| 2006-07 QE |
1346501 |
954350 |
96103 |
64091 |
1487786 |
1053323 |
434468 |
314661 |
1053319 |
738664 |
| 2007-08 RE |
1598078 |
1085618 |
109321 |
68541 |
— |
— |
492313 |
341679 |
— |
— |
P : Provisional. QE : Quick Estimates. RE : Revised Estimates. — : Not available. Source : Central Statistical Organisation. |
SA 2a : Gross / Net Domestic Capital Formation (At Current Prices) |
(As percentage to GDP) |
Year |
GFCF |
Change in stocks |
GDCF |
CFC |
CFC |
NDCF |
At current Prices |
At constant prices |
At current prices |
At constant prices |
At current prices |
At constant prices |
At current prices |
At constant prices |
At current prices |
At constant prices |
1 |
2 |
3 |
4 |
5 |
6 |
7 |
8 |
9 |
10 |
11 |
1950-51 |
8.7 |
11.4 |
1.6 |
1.5 |
8.4 |
10.4 |
5.2 |
8.0 |
0.1 |
2.4 |
1951-52 |
9.0 |
11.4 |
1.6 |
1.3 |
10.7 |
12.9 |
5.5 |
8.2 |
0.2 |
4.7 |
1952-53 |
8.5 |
10.2 |
0.2 |
0.2 |
7.7 |
9.2 |
6.0 |
8.2 |
0.1 |
1.0 |
1953-54 |
7.8 |
10.2 |
-0.6 |
-0.6 |
7.5 |
9.9 |
5.6 |
8.0 |
0.1 |
1.9 |
1954-55 |
9.5 |
10.9 |
0.3 |
0.3 |
9.3 |
10.6 |
6.2 |
8.0 |
0.1 |
2.7 |
1955-56 |
11.7 |
13.0 |
0.6 |
0.5 |
12.6 |
13.9 |
4.4 |
4.8 |
0.3 |
9.1 |
1956-57 |
12.5 |
14.1 |
1.8 |
1.4 |
14.6 |
15.9 |
4.2 |
4.9 |
0.5 |
11.0 |
1957-58 |
12.7 |
14.2 |
1.8 |
1.8 |
13.5 |
14.9 |
4.6 |
5.3 |
0.4 |
9.6 |
1958-59 |
11.4 |
13.5 |
0.1 |
0.1 |
11.6 |
13.8 |
4.5 |
5.3 |
0.3 |
8.5 |
1959-60 |
11.9 |
13.4 |
1.3 |
1.0 |
12.3 |
13.4 |
4.8 |
5.6 |
0.4 |
7.8 |
1960-61 |
12.5 |
13.8 |
1.9 |
1.7 |
14.0 |
15.0 |
4.9 |
5.5 |
0.5 |
9.5 |
1961-62 |
13.2 |
15.0 |
1.5 |
1.1 |
13.1 |
14.2 |
5.1 |
5.7 |
0.4 |
8.5 |
1962-63 |
13.6 |
15.4 |
1.8 |
1.3 |
14.5 |
15.7 |
5.3 |
5.9 |
0.5 |
9.8 |
1963-64 |
14.0 |
16.8 |
1.3 |
1.0 |
13.8 |
16.1 |
4.6 |
5.3 |
0.5 |
10.7 |
1964-65 |
14.0 |
17.0 |
1.4 |
1.1 |
13.8 |
16.3 |
4.5 |
5.4 |
0.6 |
10.9 |
1965-66 |
14.9 |
18.1 |
1.2 |
1.0 |
15.8 |
18.8 |
5.0 |
6.0 |
0.7 |
12.8 |
1966-67 |
14.7 |
18.7 |
1.7 |
1.5 |
16.6 |
20.4 |
5.2 |
6.4 |
0.9 |
14.0 |
1967-68 |
13.8 |
18.3 |
1.2 |
1.0 |
13.8 |
17.7 |
5.1 |
6.4 |
0.7 |
11.3 |
1968-69 |
13.8 |
18.0 |
0.4 |
0.4 |
12.9 |
16.7 |
4.9 |
6.1 |
0.7 |
10.6 |
1969-70 |
13.8 |
17.4 |
1.4 |
1.3 |
14.5 |
17.9 |
5.1 |
6.2 |
0.8 |
11.7 |
1970-71 |
13.8 |
16.4 |
1.8 |
1.6 |
15.1 |
17.4 |
5.5 |
6.3 |
0.9 |
11.1 |
1971-72 |
14.5 |
17.2 |
2.2 |
2.0 |
15.7 |
17.9 |
5.9 |
6.6 |
0.9 |
11.3 |
1972-73 |
15.1 |
18.5 |
0.9 |
0.9 |
14.8 |
18.0 |
6.1 |
7.1 |
0.9 |
10.9 |
1973-74 |
13.9 |
17.4 |
2.6 |
2.6 |
17.0 |
20.7 |
6.1 |
7.3 |
1.3 |
13.3 |
1974-75 |
14.3 |
17.0 |
3.9 |
3.3 |
16.5 |
18.3 |
6.7 |
7.7 |
1.4 |
10.7 |
1975-76 |
16.1 |
17.1 |
2.7 |
2.5 |
16.7 |
17.4 |
7.2 |
7.4 |
1.3 |
10.0 |
1976-77 |
17.1 |
19.0 |
1.8 |
1.8 |
17.6 |
19.4 |
7.2 |
7.7 |
1.6 |
11.7 |
1977-78 |
17.0 |
19.1 |
1.5 |
1.4 |
18.0 |
20.0 |
7.0 |
7.6 |
1.7 |
12.3 |
1978-79 |
17.2 |
18.7 |
3.3 |
3.3 |
21.3 |
22.8 |
7.4 |
7.6 |
2.3 |
15.2 |
SA 2a : Gross / Net Domestic Capital Formation (At Current Prices) (Concld.) |
(As percentage to GDP) |
Year |
GFCF |
Change in stocks |
GDCF |
CFC |
CFC |
NDCF |
At current Prices |
At constant prices |
At current prices |
At constant prices |
At current prices |
At constant prices |
At current prices |
At constant prices |
At current prices |
At constant prices |
1 |
2 |
3 |
4 |
5 |
6 |
7 |
8 |
9 |
10 |
11 |
1979-80 |
17.7 |
19.6 |
3.5 |
3.1 |
20.3 |
21.8 |
8.2 |
8.5 |
2.3 |
13.3 |
1980-81 |
18.4 |
19.8 |
0.2 |
0.2 |
19.9 |
21.5 |
8.1 |
8.4 |
2.5 |
13.1 |
1981-82 |
18.8 |
19.6 |
3.4 |
2.7 |
19.6 |
19.6 |
8.2 |
8.3 |
2.6 |
11.2 |
1982-83 |
19.0 |
19.4 |
2.4 |
1.9 |
19.0 |
18.9 |
8.5 |
8.5 |
2.6 |
10.4 |
1983-84 |
18.7 |
19.0 |
0.8 |
0.7 |
18.3 |
18.5 |
8.3 |
8.4 |
2.7 |
10.1 |
1984-85 |
19.4 |
19.4 |
2.0 |
1.7 |
19.6 |
19.2 |
8.6 |
8.5 |
3.2 |
10.7 |
1985-86 |
20.4 |
19.6 |
3.0 |
2.6 |
21.2 |
20.0 |
9.0 |
8.6 |
3.8 |
115 |
1986-87 |
20.9 |
19.8 |
2.1 |
1.8 |
20.5 |
19.2 |
9.2 |
8.6 |
3.8 |
10.6 |
1987-88 |
21.3 |
20.4 |
0.7 |
0.6 |
22.1 |
21.1 |
9.2 |
8.8 |
4.7 |
12.3 |
1988-89 |
21.6 |
20.3 |
2.0 |
1.8 |
23.4 |
21.9 |
9.1 |
8.5 |
5.7 |
13.4 |
1989-90 |
22.5 |
20.4 |
1.3 |
1.1 |
24.3 |
22.1 |
9.3 |
8.6 |
6.4 |
13.5 |
1990-91 |
23.0 |
21.6 |
1.1 |
1.0 |
26.0 |
24.4 |
9.0 |
8.4 |
8.1 |
16.1 |
1991-92 |
22.1 |
20.4 |
-0.1 |
-0.1 |
22.1 |
20.4 |
9.5 |
8.8 |
6.8 |
11.6 |
1992-93 |
22.4 |
20.7 |
1.3 |
1.2 |
23.1 |
21.2 |
9.6 |
8.8 |
8.0 |
12.3 |
1993-94 |
21.4 |
20.4 |
-0.2 |
-0.1 |
22.5 |
21.5 |
9.3 |
9.0 |
8.5 |
12.5 |
1994-95 |
22.1 |
21.3 |
1.4 |
1.3 |
25.5 |
24.6 |
9.2 |
9.0 |
11.6 |
15.6 |
1995-96 |
24.4 |
23.1 |
2.2 |
1.9 |
26.2 |
24.6 |
9.3 |
8.9 |
13.1 |
15.6 |
1996-97 |
23.1 |
21.9 |
-1.0 |
-1.0 |
24.0 |
22.7 |
9.3 |
8.9 |
12.3 |
13.9 |
1997-98 |
23.0 |
22.3 |
0.9 |
0.9 |
25.3 |
24.5 |
9.4 |
9.1 |
14.1 |
15.4 |
1998-99 |
22.8 |
22.6 |
-0.1 |
-0.1 |
23.3 |
23.1 |
9.3 |
9.2 |
13.5 |
13.9 |
1999-00 |
23.4 |
23.4 |
1.9 |
1.9 |
25.9 |
25.9 |
9.3 |
9.3 |
16.6 |
16.6 |
2000-01 |
22.7 |
22.5 |
0.7 |
0.7 |
24.3 |
24.1 |
9.6 |
9.5 |
15.3 |
14.5 |
2001-02 |
23.6 |
22.9 |
-0.1 |
-0.1 |
22.8 |
22.2 |
10.0 |
9.8 |
13.7 |
12.4 |
2002-03 |
23.8 |
23.6 |
0.9 |
0.9 |
25.2 |
25.0 |
10.2 |
10.1 |
16.6 |
15.0 |
2003-04 |
24.9 |
24.7 |
0.9 |
0.7 |
28.2 |
27.7 |
10.2 |
10.0 |
20.6 |
17.7 |
2004-05 |
28.4 |
27.1 |
1.9 |
1.6 |
32.2 |
30.6 |
10.4 |
10.1 |
26.3 |
20.5 |
2005-06 P |
31.0 |
29.2 |
2.4 |
2.2 |
35.5 |
33.4 |
10.6 |
10.1 |
31.4 |
23.4 |
| 2006-07 QE |
32.5 |
30.6 |
2.3 |
2.1 |
35.9 |
33.8 |
10.5 |
10.1 |
33.8 |
23.7 |
| 2007-08 RE |
33.9 |
31.9 |
2.3 |
2.0 |
— |
— |
10.4 |
10.1 |
— |
— |
P : Provisional. QE : Quick Estimates. RE : Revised Estimates. — : Not available. Source : Central Statistical Organisation. |
SA 3 : Sector-wise Gross Capital Formation |
(Rupees crore) |
Year |
Household sector |
Private corporate sector |
Public sector |
Gross capital formation |
At current Prices |
At constant prices |
At current prices |
At constant prices |
At current prices |
At constant prices |
At current prices |
At constant prices |
1 |
2 |
3 |
4 |
5 |
6 |
7 |
8 |
9 |
New Series (Base : 1999-2000) |
1950-51 |
516 |
- |
227 |
- |
294 |
- |
1037 |
- |
1951-52 |
532 |
- |
265 |
- |
342 |
- |
1139 |
- |
1952-53 |
527 |
- |
88 |
- |
296 |
- |
912 |
- |
1953-54 |
474 |
- |
16 |
- |
337 |
- |
827 |
- |
1954-55 |
389 |
- |
161 |
- |
508 |
- |
1057 |
- |
1955-56 |
562 |
- |
232 |
- |
563 |
- |
1357 |
- |
1956-57 |
775 |
- |
363 |
- |
738 |
- |
1876 |
- |
1957-58 |
629 |
- |
423 |
- |
908 |
- |
I960 |
- |
1958-59 |
572 |
- |
264 |
- |
898 |
- |
1735 |
- |
1959-60 |
772 |
- |
325 |
- |
1000 |
- |
2098 |
- |
1960-61 |
680 |
- |
572 |
- |
1259 |
- |
2512 |
- |
1961-62 |
654 |
- |
794 |
- |
1272 |
- |
2720 |
- |
1962-63 |
895 |
- |
579 |
- |
1590 |
- |
3063 |
- |
1963-64 |
696 |
- |
933 |
- |
1852 |
- |
3481 |
- |
1964-65 |
970 |
- |
964 |
- |
2146 |
- |
4080 |
- |
1965-66 |
1337 |
- |
745 |
- |
2438 |
- |
4519 |
- |
1966-67 |
2155 |
- |
671 |
- |
2366 |
- |
5192 |
- |
1967-68 |
2128 |
- |
873 |
- |
2570 |
- |
5572 |
- |
1968-69 |
2327 |
- |
821 |
- |
2422 |
- |
5570 |
- |
1969-70 |
3292 |
- |
721 |
- |
2530 |
- |
6543 |
- |
1970-71 |
3000 |
- |
1107 |
- |
3104 |
- |
7211 |
- |
1971-72 |
3362 |
- |
1282 |
- |
3631 |
- |
8275 |
- |
1972-73 |
3135 |
- |
1432 |
- |
4152 |
- |
8719 |
- |
1973-74 |
3978 |
- |
1757 |
- |
5212 |
- |
10946 |
- |
1974-75 |
5294 |
- |
2848 |
- |
6083 |
- |
14225 |
- |
1975-76 |
5245 |
- |
2344 |
- |
8236 |
- |
15825 |
- |
1976-77 |
6371 |
- |
1437 |
- |
9360 |
- |
17168 |
- |
1977-78 |
7766 |
- |
2530 |
- |
8689 |
- |
18985 |
- |
1978-79 |
9642 |
- |
2403 |
- |
10805 |
- |
22850 |
- |
SA 3 : Sector-wise Gross Capital Formation (Concld.) |
(Rupees crore) |
Year |
Household sector |
Private corporate sector |
Public sector |
Gross capital formation |
At current Prices |
At constant prices |
At current prices |
At constant prices |
At current prices |
At constant prices |
At current prices |
At constant prices |
1 |
2 |
3 |
4 |
5 |
6 |
7 |
8 |
9 |
New Series (Base : 1999-2000) |
1979-80 |
9747 |
- |
3263 |
- |
12898 |
- |
25909 |
- |
1980-81 |
10114 |
- |
3855 |
- |
12994 |
- |
26964 |
- |
1981-82 |
10045 |
- |
9760 |
- |
18092 |
- |
37897 |
- |
1982-83 |
8491 |
- |
10898 |
- |
21543 |
- |
40932 |
- |
1983-84 |
12828 |
- |
7726 |
- |
22810 |
- |
43364 |
- |
1984-85 |
14810 |
- |
11048 |
- |
27366 |
- |
53225 |
- |
1985-86 |
18404 |
- |
15549 |
- |
32063 |
- |
66016 |
- |
1986-87 |
18317 |
- |
16901 |
- |
37275 |
- |
72493 |
- |
1987-88 |
29087 |
- |
13282 |
- |
36361 |
- |
78730 |
- |
1988-89 |
39724 |
- |
17487 |
- |
43137 |
- |
100348 |
- |
1989-90 |
44767 |
- |
21215 |
- |
49707 |
- |
115689 |
- |
1990-91 |
55149 |
- |
25575 |
- |
56874 |
- |
137598 |
- |
1991-92 |
41394 |
- |
40439 |
- |
62052 |
- |
143885 |
- |
1992-93 |
57948 |
- |
52431 |
- |
68533 |
- |
178912 |
- |
1993-94 |
54796 |
- |
53008 |
- |
75923 |
- |
183727 |
- |
1994-95 |
68057 |
- |
76139 |
- |
94775 |
- |
238971 |
- |
1995-96 |
95296 |
- |
123899 |
- |
97749 |
- |
316944 |
- |
1996-97 |
79312 |
- |
122491 |
- |
103159 |
- |
304961 |
- |
1997-98 |
122531 |
- |
134643 |
- |
107830 |
- |
365005 |
- |
1998-99 |
149414 |
- |
124122 |
- |
122849 |
- |
396384 |
- |
1999-00 |
205914 |
205914 |
143475 |
143475 |
144610 |
144610 |
509518 |
509518 |
2000-01 |
239634 |
227566 |
109013 |
102912 |
144638 |
140315 |
508009 |
485049 |
2001-02 |
256689 |
232360 |
123628 |
111726 |
156537 |
144540 |
551041 |
502115 |
2002-03 |
315879 |
281769 |
140255 |
126124 |
149399 |
134468 |
619490 |
555291 |
2003-04 |
357517 |
308766 |
180804 |
156736 |
174579 |
145578 |
737472 |
632621 |
2004-05 |
406846 |
312549 |
331081 |
268172 |
216962 |
166989 |
995943 |
781583 |
2005-06 P |
445916 |
322950 |
477490 |
364854 |
272002 |
202884 |
1236800 |
923828 |
| 2006-07 QE |
517837 |
351714 |
603014 |
439419 |
321753 |
227308 |
1492313 |
1056532 |
P : Provisional. QE : Quick Estimates. – : Not available. Sources : Central Statistical Organisation. |
SA 3a : Sector-wise Gross Capital Formation |
(As percentage to GDP) |
Year |
Household sector |
Private corporate sector |
Public sector |
Gross capital formation |
At current Prices |
At constant prices |
At current prices |
At constant prices |
At current prices |
At constant prices |
At current prices |
At constant prices |
1 |
2 |
3 |
4 |
5 |
6 |
7 |
8 |
9 |
New Series (Base : 1999-2000) |
1950-51 |
5.1 |
- |
2.2 |
- |
2.9 |
- |
10.3 |
- |
1951-52 |
5.0 |
- |
2.5 |
- |
3.2 |
- |
10.6 |
- |
1952-53 |
5.0 |
- |
0.8 |
- |
2.8 |
- |
8.7 |
- |
1953-54 |
4.1 |
- |
0.1 |
- |
2.9 |
- |
7.2 |
- |
1954-55 |
3.6 |
- |
1.5 |
- |
4.7 |
- |
9.8 |
- |
1955-56 |
5.1 |
- |
2.1 |
- |
5.1 |
- |
12.3 |
- |
1956-57 |
5.9 |
- |
2.8 |
- |
5.6 |
- |
14.3 |
- |
1957-58 |
4.6 |
- |
3.1 |
- |
6.7 |
- |
14.5 |
- |
1958-59 |
3.8 |
- |
1.8 |
- |
6.0 |
- |
11.5 |
- |
1959-60 |
4.9 |
- |
2.0 |
- |
6.3 |
- |
13.2 |
- |
1960-61 |
3.9 |
- |
3.3 |
- |
7.2 |
- |
14.4 |
- |
1961-62 |
3.5 |
- |
4.3 |
- |
6.9 |
- |
14.7 |
- |
1962-63 |
4.5 |
- |
2.9 |
- |
8.0 |
- |
15.5 |
- |
1963-64 |
3.1 |
- |
4.1 |
- |
8.1 |
- |
15.3 |
- |
1964-65 |
3.7 |
- |
3.6 |
- |
8.1 |
- |
15.4 |
- |
1965-66 |
4.8 |
- |
2.7 |
- |
8.7 |
- |
16.1 |
- |
1966-67 |
6.8 |
- |
2.1 |
- |
7.5 |
- |
16.4 |
- |
1967-68 |
5.7 |
- |
2.4 |
- |
6.9 |
- |
15.0 |
- |
1968-69 |
5.9 |
- |
2.1 |
- |
6.2 |
- |
14.2 |
- |
1969-70 |
7.6 |
- |
1.7 |
- |
5.8 |
- |
15.1 |
- |
1970-71 |
6.5 |
- |
2.4 |
- |
6.7 |
- |
15.6 |
- |
1971-72 |
6.8 |
- |
2.6 |
- |
7.3 |
- |
16.7 |
- |
1972-73 |
5.7 |
- |
2.6 |
- |
7.6 |
- |
16.0 |
- |
1973-74 |
6.0 |
- |
2.6 |
- |
7.8 |
- |
16.5 |
- |
1974-75 |
6.8 |
- |
3.6 |
- |
7.8 |
- |
18.1 |
- |
1975-76 |
6.2 |
- |
2.8 |
- |
9.8 |
- |
18.8 |
- |
1976-77 |
7.0 |
- |
1.6 |
- |
10.3 |
- |
18.9 |
- |
1977-78 |
7.6 |
- |
2.5 |
- |
8.5 |
- |
18.5 |
- |
1978-79 |
8.7 |
- |
2.2 |
- |
9.7 |
- |
20.5 |
- |
SA 3a : Sector-wise Gross Capital Formation (Concld.) |
(Rupees crore) |
Year |
Household sector |
Private corporate sector |
Public sector |
Gross capital formation |
At current Prices |
At constant prices |
At current prices |
At constant prices |
At current prices |
At constant prices |
At current prices |
At constant prices |
1 |
2 |
3 |
4 |
5 |
6 |
7 |
8 |
9 |
New Series (Base : 1999-2000) |
1979-80 |
8.0 |
- |
2.7 |
- |
10.6 |
- |
21.2 |
- |
1980-81 |
7.0 |
- |
2.7 |
- |
8.9 |
- |
18.5 |
- |
1981-82 |
5.9 |
- |
5.7 |
- |
10.6 |
- |
22.2 |
- |
1982-83 |
4.4 |
- |
5.7 |
- |
11.3 |
- |
21.4 |
- |
1983-84 |
5.8 |
- |
3.5 |
- |
10.3 |
- |
19.5 |
- |
1984-85 |
5.9 |
- |
4.4 |
- |
11.0 |
- |
21.4 |
- |
1985-86 |
6.5 |
- |
5.5 |
- |
11.4 |
- |
23.5 |
- |
1986-87 |
5.8 |
- |
5.4 |
- |
11.8 |
- |
23.0 |
- |
1987-88 |
8.1 |
- |
3.7 |
- |
10.2 |
- |
22.0 |
- |
1988-89 |
9.4 |
- |
4.1 |
- |
10.2 |
- |
23.6 |
- |
1989-90 |
9.2 |
- |
4.4 |
- |
10.2 |
- |
23.7 |
- |
1990-91 |
9.7 |
- |
4.5 |
- |
10.0 |
- |
24.2 |
- |
1991-92 |
6.3 |
- |
6.2 |
- |
9.5 |
- |
22.0 |
- |
1992-93 |
7.7 |
- |
7.0 |
- |
9.1 |
- |
23.8 |
- |
1993-94 |
6.3 |
- |
6.1 |
- |
8.8 |
- |
21.2 |
- |
1994-95 |
6.7 |
- |
7.5 |
- |
9.3 |
- |
23.5 |
- |
1995-96 |
8.0 |
- |
10.4 |
- |
8.2 |
- |
26.6 |
- |
1996-97 |
5.8 |
- |
8.9 |
- |
7.5 |
- |
22.1 |
- |
1997-98 |
8.0 |
- |
8.8 |
- |
7.1 |
- |
23.9 |
- |
1998-99 |
8.5 |
- |
7.1 |
- |
7.0 |
- |
22.6 |
- |
1999-00 |
10.5 |
10.5 |
7.4 |
7.4 |
7.4 |
7.4 |
26.1 |
26.1 |
2000-01 |
11.4 |
11.2 |
5.2 |
5.1 |
6.9 |
6.9 |
24.2 |
23.9 |
2001-02 |
11.3 |
10.9 |
5.4 |
5.2 |
6.9 |
6.8 |
24.2 |
23.5 |
2002-03 |
12.9 |
12.7 |
5.7 |
5.7 |
6.1 |
6.1 |
25.2 |
25.0 |
2003-04 |
13.0 |
12.9 |
6.6 |
6.5 |
6.3 |
6.1 |
26.8 |
26.3 |
2004-05 |
12.9 |
12.0 |
10.5 |
10.3 |
6.9 |
6.4 |
31.6 |
30.0 |
2005-06 P |
12.5 |
11.4 |
13.3 |
12.8 |
7.6 |
7.1 |
34.5 |
32.5 |
| 2006-07 QE |
12.5 |
11.3 |
14.5 |
14.1 |
7.8 |
7.3 |
36.0 |
33.9 |
P : Provisional. QE : Quick Estimates. – : Not available. Sources : Central Statistical Organisation. |
SA 4 : Household Savings by Instruments (at current prices) |
(Rupees in crore) |
Year |
Currency |
Net Deposits |
Shares and Debentures |
Net claims on govt. |
life insurance funds |
provident & pension funds |
Household Financial Saving |
Saving in physical Assets |
Total Household Saving |
1 |
2 |
3 |
4 |
5 |
6 |
7 |
8 |
9 |
10 |
1950-51 |
81 |
-26 |
52 |
-84 |
20 |
19 |
62 |
516 |
578 |
1951-52 |
-116 |
-45 |
49 |
93 |
13 |
20 |
14 |
532 |
546 |
1952-53 |
-17 |
43 |
23 |
-22 |
18 |
27 |
72 |
527 |
599 |
1953-54 |
26 |
21 |
27 |
-2 |
25 |
45 |
142 |
474 |
616 |
1954-55 |
67 |
38 |
11 |
91 |
28 |
47 |
282 |
389 |
671 |
1955-56 |
203 |
24 |
41 |
76 |
31 |
54 |
429 |
562 |
991 |
1956-57 |
48 |
-19 |
71 |
141 |
30 |
62 |
333 |
775 |
1108 |
1957-58 |
50 |
76 |
36 |
19 |
29 |
81 |
291 |
629 |
920 |
1958-59 |
111 |
42 |
34 |
71 |
32 |
72 |
362 |
572 |
934 |
1959-60 |
133 |
68 |
61 |
39 |
46 |
86 |
433 |
772 |
1205 |
1960-61 |
145 |
11 |
67 |
57 |
50 |
126 |
456 |
680 |
1136 |
1961-62 |
94 |
103 |
112 |
-12 |
65 |
127 |
489 |
654 |
1143 |
1962-63 |
175 |
70 |
45 |
-20 |
82 |
147 |
499 |
895 |
1394 |
1963-64 |
211 |
118 |
119 |
42 |
78 |
175 |
743 |
696 |
1439 |
1964-65 |
135 |
253 |
64 |
-32 |
88 |
206 |
714 |
970 |
1684 |
1965-66 |
285 |
309 |
175 |
-9 |
96 |
216 |
1072 |
1337 |
2409 |
1966-67 |
118 |
337 |
114 |
-48 |
104 |
239 |
864 |
2155 |
3019 |
1967-68 |
145 |
268 |
78 |
-59 |
122 |
311 |
865 |
2128 |
2993 |
1968-69 |
263 |
72 |
84 |
-84 |
139 |
321 |
795 |
2327 |
3122 |
1969-70 |
334 |
85 |
65 |
-139 |
160 |
414 |
919 |
3292 |
4211 |
1970-71 |
345 |
265 |
94 |
-12 |
189 |
490 |
1371 |
3000 |
4371 |
1971-72 |
381 |
574 |
61 |
-243 |
216 |
566 |
1555 |
3362 |
4917 |
1972-73 |
616 |
773 |
26 |
-196 |
262 |
647 |
2128 |
3135 |
5263 |
1973-74 |
812 |
1260 |
44 |
434 |
326 |
736 |
3612 |
3978 |
7590 |
1974-75 |
17 |
1017 |
137 |
-95 |
322 |
976 |
2374 |
5294 |
7668 |
1975-76 |
321 |
1131 |
115 |
742 |
385 |
1224 |
3918 |
5245 |
9163 |
1976-77 |
1130 |
1902 |
87 |
95 |
480 |
1158 |
4852 |
6371 |
11223 |
1977-78 |
705 |
2780 |
325 |
180 |
559 |
1304 |
5853 |
7766 |
13619 |
1978-79 |
1482 |
2742 |
175 |
31 |
648 |
1580 |
6658 |
9642 |
16300 |
SA 4 : Household Savings by Instruments (at current prices) (Concld.) |
(Rupees in crore) |
Year |
Currency |
Net Deposits |
Shares and Debentures |
Net claims on govt. |
life insurance funds |
provident & pension funds |
Household Financial Saving |
Saving in physical Assets |
Total Household Saving |
1 |
2 |
3 |
4 |
5 |
6 |
7 |
8 |
9 |
10 |
1979-80 |
1338 |
1650 |
214 |
465 |
739 |
1675 |
6081 |
9747 |
15828 |
1980-81 |
1625 |
2985 |
443 |
576 |
859 |
2122 |
8610 |
10114 |
18724 |
1981-82 |
955 |
3022 |
513 |
1656 |
982 |
2486 |
9614 |
10045 |
19659 |
1982-83 |
2026 |
4623 |
867 |
1211 |
1149 |
2863 |
12739 |
8491 |
21230 |
1983-84 |
2776 |
3684 |
720 |
1777 |
1283 |
3054 |
13294 |
12828 |
26122 |
1984-85 |
2854 |
5646 |
1320 |
2920 |
1453 |
3686 |
17879 |
14810 |
32689 |
1985-86 |
2220 |
5295 |
1980 |
3223 |
1676 |
4144 |
18538 |
18404 |
36942 |
1986-87 |
3090 |
7805 |
2711 |
2670 |
2005 |
5055 |
23336 |
18317 |
41653 |
1987-88 |
4815 |
7684 |
2009 |
3350 |
2453 |
6509 |
26820 |
29087 |
55907 |
1988-89 |
4256 |
4469 |
2563 |
5032 |
3311 |
7552 |
27183 |
39724 |
66907 |
1989-90 |
7655 |
5794 |
4834 |
6055 |
4152 |
9508 |
37998 |
44767 |
82765 |
1990-91 |
6251 |
11186 |
8410 |
7300 |
5338 |
11155 |
49640 |
55149 |
104789 |
1991-92 |
8157 |
14514 |
15887 |
4398 |
6623 |
12522 |
62101 |
41394 |
103495 |
1992-93 |
6562 |
19899 |
13824 |
3466 |
6766 |
14850 |
65367 |
57948 |
123315 |
1993-94 |
13367 |
32846 |
14772 |
6233 |
9197 |
18323 |
94738 |
54796 |
149534 |
1994-95 |
15916 |
42225 |
17381 |
12781 |
11016 |
21414 |
120733 |
68057 |
188790 |
1995-96 |
16525 |
34880 |
9101 |
9346 |
13523 |
22344 |
105719 |
95296 |
201015 |
1996-97 |
13643 |
60068 |
10407 |
11580 |
15574 |
30389 |
141661 |
79312 |
220973 |
1997-98 |
12780 |
56259 |
5060 |
21674 |
18737 |
32267 |
146777 |
123531 |
270308 |
1998-99 |
21822 |
55181 |
6993 |
27354 |
22572 |
46424 |
180346 |
149414 |
329760 |
1999-00 |
20845 |
51732 |
24550 |
27859 |
27684 |
53932 |
206602 |
205914 |
412516 |
2000-01 |
15632 |
72369 |
8847 |
37778 |
32679 |
47914 |
215219 |
239634 |
454853 |
2001-02 |
28156 |
71030 |
4475 |
51085 |
46104 |
46626 |
247476 |
256689 |
504165 |
2002-03 |
28632 |
73455 |
5929 |
55878 |
41351 |
48010 |
253255 |
315879 |
569134 |
2003-04 |
42675 |
77675 |
3973 |
87618 |
49775 |
51544 |
313260 |
357516 |
670776 |
2004-05 |
36977 |
42846 |
8841 |
106927 |
66437 |
56236 |
318264 |
406846 |
725110 |
2005-06 P |
51954 |
100561 |
33679 |
87649 |
84359 |
62638 |
420841 |
445915 |
866756 |
2006-07 QE |
65452 |
143257 |
49963 |
39697 |
104024 |
65592 |
467985 |
517837 |
985822 |
P : Provisional. QE : Quick Estimates. Sources : Central Statistical Organisation |
SA 5 : Structure of Household Saving (at current prices) |
(Percentage distribution) |
Year |
Currency |
Net Deposits |
Shares and Debentures |
Net claims on govt. |
life insurance funds |
provident & pension funds |
Household Financial Saving |
Saving in physical Assets |
Total Household Saving |
1 |
2 |
3 |
4 |
5 |
6 |
7 |
8 |
9 |
10 |
1950-51 |
14.0 |
-4.5 |
9.0 |
-14.5 |
3.5 |
3.3 |
10.7 |
89.3 |
100.0 |
1951-52 |
-21.2 |
-8.2 |
9.0 |
17.0 |
2.4 |
3.7 |
2.6 |
97.4 |
100.0 |
1952-53 |
-2.8 |
7.2 |
3.8 |
-3.7 |
3.0 |
4.5 |
12.0 |
88.0 |
100.0 |
1953-54 |
4.2 |
3.4 |
4.4 |
-0.3 |
4.1 |
7.3 |
23.1 |
76.9 |
100.0 |
1954-55 |
10.0 |
5.7 |
1.6 |
13.6 |
4.2 |
7.0 |
42.0 |
58.0 |
100.0 |
1955-56 |
20.5 |
2.4 |
4.1 |
7.7 |
3.1 |
5.4 |
43.3 |
56.7 |
100.0 |
1956-57 |
4.3 |
-1.7 |
6.4 |
12.7 |
2.7 |
5.6 |
30.1 |
69.9 |
100.0 |
1957-58 |
5.4 |
8.3 |
3.9 |
2.1 |
3.2 |
8.8 |
31.6 |
68.4 |
100.0 |
1958-59 |
11.9 |
4.5 |
3.6 |
7.6 |
3.4 |
7.7 |
38.8 |
61.2 |
100.0 |
1959-60 |
11.0 |
5.6 |
5.1 |
3.2 |
3.8 |
7.1 |
35.9 |
64.1 |
100.0 |
1960-61 |
12.8 |
1.0 |
5.9 |
5.0 |
4.4 |
11.1 |
40.1 |
59.9 |
100.0 |
1961-62 |
8.2 |
9.0 |
9.8 |
-1.0 |
5.7 |
11.1 |
42.8 |
57.2 |
100.0 |
1962-63 |
12.6 |
5.0 |
3.2 |
-1.4 |
5.9 |
10.5 |
35.8 |
64.2 |
100.0 |
1963-64 |
14.7 |
8.2 |
8.3 |
2.9 |
5.4 |
12.2 |
51.6 |
48.4 |
100.0 |
1964-65 |
8.0 |
15.0 |
3.8 |
-1.9 |
5.2 |
12.2 |
42.4 |
57.6 |
100.0 |
1965-66 |
11.8 |
12.8 |
7.3 |
-0.4 |
4.0 |
9.0 |
44.5 |
55.5 |
100.0 |
1966-67 |
3.9 |
11.2 |
3.8 |
-1.6 |
3.4 |
7.9 |
28.6 |
71.4 |
100.0 |
1967-68 |
4.8 |
9.0 |
2.6 |
-2.0 |
4.1 |
10.4 |
28.9 |
71.1 |
100.0 |
1968-69 |
8.4 |
2.3 |
2.7 |
-2.7 |
4.5 |
10.3 |
25.5 |
74.5 |
100.0 |
1969-70 |
7.9 |
2.0 |
1.5 |
-3.3 |
3.8 |
9.8 |
21.8 |
78.2 |
100.0 |
1970-71 |
7.9 |
6.1 |
2.2 |
-0.3 |
4.3 |
11.2 |
31.4 |
68.6 |
100.0 |
1971-72 |
7.7 |
11.7 |
1.2 |
-4.9 |
4.4 |
11.5 |
31.6 |
68.4 |
100.0 |
1972-73 |
11.7 |
14.7 |
0.5 |
-3.7 |
5.0 |
12.3 |
40.4 |
59.6 |
100.0 |
1973-74 |
10.7 |
16.6 |
0.6 |
5.7 |
4.3 |
9.7 |
47.6 |
52.4 |
100.0 |
1974-75 |
0.2 |
13.3 |
1.8 |
-1.2 |
4.2 |
12.7 |
31.0 |
69.0 |
100.0 |
1975-76 |
3.5 |
12.3 |
1.3 |
8.1 |
4.2 |
13.4 |
42.8 |
57.2 |
100.0 |
1976-77 |
10.1 |
16.9 |
0.8 |
0.8 |
4.3 |
10.3 |
43.2 |
56.8 |
100.0 |
1977-78 |
5.2 |
20.4 |
2.4 |
1.3 |
4.1 |
9.6 |
43.0 |
57.0 |
100.0 |
1978-79 |
9.1 |
16.8 |
1.1 |
0.2 |
4.0 |
9.7 |
40.8 |
59.2 |
100.0 |
SA 5 : Structure of Household Saving (at current prices) (Concld.) |
(Percentage distribution) |
Year |
Currency |
Net Deposits |
Shares and Debentures |
Net claims on govt. |
life insurance funds |
provident & pension funds |
Household Financial Saving |
Saving in physical Assets |
Total Household Saving |
1 |
2 |
3 |
4 |
5 |
6 |
7 |
8 |
9 |
10 |
1979-80 |
8.5 |
10.4 |
1.4 |
2.9 |
4.7 |
10.6 |
38.4 |
61.6 |
100.0 |
1980-81 |
8.7 |
15.9 |
2.4 |
3.1 |
4.6 |
11.3 |
46.0 |
54.0 |
100.0 |
1981-82 |
4.9 |
15.4 |
2.6 |
8.4 |
5.0 |
12.6 |
48.9 |
51.1 |
100.0 |
1982-83 |
9.5 |
21.8 |
4.1 |
5.7 |
5.4 |
13.5 |
60.0 |
40.0 |
100.0 |
1983-84 |
10.6 |
14.1 |
2.8 |
6.8 |
4.9 |
11.7 |
50.9 |
49.1 |
100.0 |
1984-85 |
8.7 |
17.3 |
4.0 |
8.9 |
4.4 |
11.3 |
54.7 |
45.3 |
100.0 |
1985-86 |
6.0 |
14.3 |
5.4 |
8.7 |
4.5 |
11.2 |
50.2 |
49.8 |
100.0 |
1986-87 |
7.4 |
18.7 |
6.5 |
6.4 |
4.8 |
12.1 |
56.0 |
44.0 |
100.0 |
1987-88 |
8.6 |
13.7 |
3.6 |
6.0 |
4.4 |
11.6 |
48.0 |
52.0 |
100.0 |
1988-89 |
6.4 |
6.7 |
3.8 |
7.5 |
4.9 |
11.3 |
40.6 |
59.4 |
100.0 |
1989-90 |
9.2 |
7.0 |
5.8 |
7.3 |
5.0 |
11.5 |
45.9 |
54.1 |
100.0 |
1990-91 |
6.0 |
10.7 |
8.0 |
7.0 |
5.1 |
10.6 |
47.4 |
52.6 |
100.0 |
1991-92 |
7.9 |
14.0 |
15.4 |
4.2 |
6.4 |
12.1 |
60.0 |
40.0 |
100.0 |
1992-93 |
5.3 |
16.1 |
11.2 |
2.8 |
5.5 |
12.0 |
53.0 |
47.0 |
100.0 |
1993-94 |
8.9 |
22.0 |
9.9 |
4.2 |
6.2 |
12.3 |
63.4 |
36.6 |
100.0 |
1994-95 |
8.4 |
22.4 |
9.2 |
6.8 |
5.8 |
11.3 |
64.0 |
36.0 |
100.0 |
1995-96 |
8.2 |
17.4 |
4.5 |
4.6 |
6.7 |
11.1 |
52.6 |
47.4 |
100.0 |
1996-97 |
6.2 |
27.2 |
4.7 |
5.2 |
7.0 |
13.8 |
64.1 |
35.9 |
100.0 |
1997-98 |
4.7 |
20.8 |
1.9 |
8.0 |
6.9 |
11.9 |
54.3 |
45.7 |
100.0 |
1998-99 |
6.6 |
16.7 |
2.1 |
8.3 |
6.8 |
14.1 |
54.7 |
45.3 |
100.0 |
1999-00 |
5.1 |
12.5 |
6.0 |
6.8 |
6.7 |
13.1 |
50.1 |
49.9 |
100.0 |
2000-01 |
3.4 |
15.9 |
1.9 |
8.3 |
7.2 |
10.5 |
47.3 |
52.7 |
100.0 |
2001-02 |
5.6 |
14.1 |
0.9 |
10.1 |
9.1 |
9.2 |
49.1 |
50.9 |
100.0 |
2002-03 |
5.0 |
12.9 |
1.0 |
9.8 |
7.3 |
8.4 |
44.5 |
55.5 |
100.0 |
2003-04 |
6.4 |
11.6 |
0.6 |
13.1 |
7.4 |
7.7 |
46.7 |
53.3 |
100.0 |
2004-05 |
5.1 |
5.9 |
1.2 |
14.7 |
9.2 |
7.8 |
43.9 |
56.1 |
100.0 |
2005-06 P |
6.0 |
11.6 |
3.9 |
10.1 |
9.7 |
7.2 |
48.6 |
51.4 |
100.0 |
2006-07 QE |
6.6 |
14.5 |
5.1 |
4.0 |
10.6 |
6.7 |
47.5 |
52.5 |
100.0 |
P : Provisional. QE : Quick Estimates. Sources : Central Statistical Organisation |
SA 6 : Capital Formation By Industry Use ( At 1999-2000 Prices) |
(Rupees crore) |
Year |
Agriculture, Forestry & Fishing |
Mining & Quarrying |
Manufacturing |
Electricity, Gas & Water Supply |
Construction |
Trade, Hotels & Restaurants |
Transport , Storage & Commn. |
Financing, Ins., Real Estate & Business services |
Community, social & personal ser |
Total |
1 |
2 |
3 |
4 |
5 |
6 |
7 |
8 |
9 |
10 |
11 |
1950-51 |
7490 |
247 |
4612 |
639 |
165 |
3081 |
4275 |
7879 |
1988 |
30375 |
1951-52 |
8422 |
542 |
5898 |
1139 |
151 |
760 |
4318 |
7550 |
2123 |
30902 |
1952-53 |
7665 |
201 |
4605 |
1103 |
193 |
249 |
3947 |
7266 |
664 |
25892 |
1953-54 |
7859 |
350 |
2799 |
1015 |
245 |
780 |
3965 |
6475 |
1774 |
25262 |
1954-55 |
8121 |
373 |
3117 |
2597 |
753 |
731 |
4581 |
7450 |
3365 |
31088 |
1955-56 |
11105 |
270 |
5310 |
3015 |
1039 |
1004 |
5247 |
7328 |
4391 |
38710 |
1956-57 |
10149 |
143 |
9706 |
3702 |
884 |
1010 |
6323 |
8496 |
6633 |
47047 |
1957-58 |
12233 |
285 |
8927 |
3035 |
362 |
907 |
6729 |
7520 |
8188 |
48186 |
1958-59 |
12892 |
143 |
5434 |
2894 |
339 |
872 |
6320 |
7525 |
7700 |
44120 |
1959-60 |
8551 |
263 |
12482 |
2522 |
450 |
1046 |
5567 |
7452 |
9467 |
47800 |
1960-61 |
10051 |
1046 |
12854 |
2441 |
1357 |
1406 |
6032 |
7156 |
11901 |
54244 |
1961-62 |
11708 |
587 |
13023 |
4705 |
586 |
943 |
7159 |
9294 |
10329 |
58335 |
1962-63 |
10570 |
840 |
13231 |
6269 |
839 |
1560 |
8083 |
8460 |
12795 |
62647 |
1963-64 |
12518 |
1434 |
13508 |
6930 |
1710 |
2206 |
8660 |
9079 |
14660 |
70704 |
1964-65 |
12700 |
1485 |
18122 |
6528 |
1277 |
1901 |
8892 |
9839 |
16532 |
77276 |
1965-66 |
12685 |
791 |
20249 |
7837 |
1305 |
1790 |
8916 |
9620 |
16165 |
79358 |
1966-67 |
14568 |
1573 |
24744 |
7530 |
1313 |
1972 |
8697 |
10788 |
12514 |
83699 |
1967-68 |
17137 |
1281 |
21603 |
7815 |
1398 |
2611 |
8197 |
12757 |
13458 |
86257 |
1968-69 |
18819 |
1068 |
20220 |
7213 |
1524 |
2451 |
8592 |
14061 |
10894 |
84843 |
1969-70 |
18698 |
1876 |
23722 |
7971 |
1574 |
2681 |
8648 |
14520 |
11863 |
91552 |
1970-71 |
18635 |
1240 |
23395 |
8193 |
1195 |
5510 |
9695 |
13185 |
12090 |
93138 |
1971-72 |
19546 |
1927 |
24351 |
8441 |
1515 |
5379 |
10469 |
14250 |
14933 |
100812 |
1972-73 |
22271 |
1545 |
20577 |
7855 |
1385 |
3922 |
11438 |
14041 |
18342 |
101376 |
1973-74 |
21507 |
3458 |
26317 |
7617 |
1494 |
5208 |
10748 |
14147 |
17414 |
107909 |
1974-75 |
18916 |
4020 |
33550 |
7871 |
1491 |
5148 |
11680 |
15730 |
12236 |
110643 |
1975-76 |
23591 |
7602 |
27153 |
10665 |
1225 |
9056 |
11305 |
13397 |
12852 |
116845 |
1976-77 |
29318 |
5755 |
25953 |
11574 |
2109 |
11235 |
11009 |
14785 |
14488 |
126226 |
1977-78 |
25733 |
3850 |
31266 |
13861 |
2849 |
10645 |
11065 |
17247 |
16529 |
133045 |
1978-79 |
32766 |
4431 |
37591 |
14948 |
2025 |
10744 |
11882 |
17414 |
19267 |
151066 |
SA 6 : Capital Formation By Industry Use ( At 1999-2000 Prices) (Concld.) |
(Rupees crore) |
Year |
Agriculture, Forestry & Fishing |
Mining & Quarrying |
Manufacturing |
Electricity, Gas & Water Supply |
Construction |
Trade, Hotels & Restaurants |
Transport , Storage & Commn. |
Financing, Ins., Real Estate & Business services |
Community, social & personal ser |
Total |
1 |
2 |
3 |
4 |
5 |
6 |
7 |
8 |
9 |
10 |
11 |
1979-80 |
33982 |
5452 |
34019 |
16050 |
2444 |
6992 |
11791 |
17563 |
20056 |
148349 |
1980-81 |
28558 |
4491 |
27866 |
16093 |
2387 |
6702 |
15511 |
13886 |
23857 |
139351 |
1981-82 |
24272 |
6833 |
52704 |
18904 |
3953 |
6810 |
14146 |
11795 |
24528 |
163945 |
1982-83 |
26132 |
10919 |
45009 |
19998 |
2688 |
7194 |
11783 |
11397 |
27445 |
162565 |
1983-84 |
27778 |
10508 |
40995 |
20185 |
1478 |
7879 |
12788 |
13227 |
26750 |
161587 |
1984-85 |
25426 |
9766 |
54808 |
19648 |
2181 |
9371 |
15714 |
12850 |
28745 |
178510 |
1985-86 |
24208 |
12348 |
66625 |
22365 |
2547 |
8488 |
16942 |
13673 |
31312 |
198508 |
1986-87 |
23719 |
12831 |
62319 |
27812 |
1815 |
9738 |
19146 |
13057 |
32366 |
202803 |
1987-88 |
28797 |
11550 |
53947 |
30504 |
2774 |
4027 |
20498 |
20708 |
31478 |
204282 |
1988-89 |
25866 |
12549 |
74266 |
30253 |
1925 |
13676 |
24486 |
19938 |
32840 |
235799 |
1989-90 |
26041 |
14731 |
72271 |
28606 |
3058 |
15193 |
28428 |
25653 |
30070 |
244050 |
1990-91 |
38054 |
14201 |
74839 |
31005 |
3624 |
14689 |
27437 |
31966 |
34892 |
270708 |
1991-92 |
24535 |
11751 |
75162 |
35848 |
2244 |
3939 |
30114 |
28167 |
33347 |
245108 |
1992-93 |
31030 |
10930 |
87398 |
32528 |
3427 |
11689 |
29633 |
35863 |
35574 |
278074 |
1993-94 |
28137 |
10480 |
76005 |
34893 |
2887 |
10276 |
32737 |
39106 |
35645 |
270166 |
1994-95 |
26890 |
21230 |
97167 |
32523 |
3817 |
16618 |
37148 |
42272 |
44068 |
321732 |
1995-96 |
27336 |
15312 |
164984 |
31663 |
6215 |
9566 |
39512 |
44941 |
42612 |
382142 |
1996-97 |
29814 |
7493 |
139643 |
35083 |
3773 |
1940 |
40056 |
46001 |
40993 |
344796 |
1997-98 |
32504 |
8888 |
163410 |
36099 |
7692 |
18706 |
36202 |
51286 |
41988 |
396775 |
1998-99 |
32905 |
8985 |
161131 |
40857 |
8419 |
6117 |
39025 |
55298 |
55074 |
407811 |
1999-00 |
50151 |
8636 |
174098 |
37267 |
5504 |
20652 |
58021 |
83934 |
55736 |
493999 |
2000-01 |
45480 |
5810 |
128988 |
39571 |
9074 |
27921 |
76297 |
79976 |
57676 |
470793 |
2001-02 |
56979 |
8384 |
106207 |
43889 |
15846 |
16437 |
60348 |
109135 |
71401 |
488626 |
2002-03 |
55668 |
8393 |
154652 |
40499 |
16947 |
9679 |
74215 |
103662 |
78646 |
542361 |
2003-04 |
53541 |
14193 |
189873 |
49692 |
21564 |
24463 |
72308 |
104441 |
81005 |
611080 |
2004-05 |
57759 |
21848 |
295879 |
45566 |
25818 |
25943 |
83169 |
92524 |
99204 |
747710 |
2005-06 P |
64511 |
27838 |
371702 |
58325 |
31395 |
27902 |
74130 |
108507 |
126378 |
890688 |
2006-07 QE |
71208 |
27269 |
438333 |
62992 |
34604 |
29783 |
84512 |
114094 |
155646 |
1018441 |
P : Provisional. QE : Quick Estimates. Sources : Central Statistical Organisation. |
SA 6a : Capital Formation By Industry Use ( at 1999-2000 Prices) |
(Percentage distribution) |
Year |
Agriulture, Forestry & Fishing |
Mining & Quarrying |
Manufacturing |
Electricity, Gas & Water Supply |
Construc tion |
Trade, Hotels & Restau rants |
Transport , Storage & Commn. |
Financing, Ins., Real Estate & Business services |
Comm unity, social & personal ser |
Total |
1 |
2 |
3 |
4 |
5 |
6 |
7 |
8 |
9 |
10 |
11 |
1950-51 |
24.7 |
0.8 |
15.2 |
2.1 |
0.5 |
10.1 |
14.1 |
25.9 |
6.5 |
100 |
1951-52 |
27.3 |
1.8 |
19.1 |
3.7 |
0.5 |
2.5 |
14.0 |
24.4 |
6.9 |
100 |
1952-53 |
29.6 |
0.8 |
17.8 |
4.3 |
0.7 |
1.0 |
15.2 |
28.1 |
2.6 |
100 |
1953-54 |
31.1 |
1.4 |
11.1 |
4.0 |
1.0 |
3.1 |
15.7 |
25.6 |
7.0 |
100 |
1954-55 |
26.1 |
1.2 |
10.0 |
8.4 |
2.4 |
2.4 |
14.7 |
24.0 |
10.8 |
100 |
1955-56 |
28.7 |
0.7 |
13.7 |
7.8 |
2.7 |
2.6 |
13.6 |
18.9 |
11.3 |
100 |
1956-57 |
21.6 |
0.3 |
20.6 |
7.9 |
1.9 |
2.1 |
13.4 |
18.1 |
14.1 |
100 |
1957-58 |
25.4 |
0.6 |
18.5 |
6.3 |
0.8 |
1.9 |
14.0 |
15.6 |
17.0 |
100 |
1958-59 |
29.2 |
0.3 |
12.3 |
6.6 |
0.8 |
2.0 |
14.3 |
17.1 |
17.5 |
100 |
1959-60 |
17.9 |
0.6 |
26.1 |
5.3 |
0.9 |
2.2 |
11.6 |
15.6 |
19.8 |
100 |
1960-61 |
18.5 |
1.9 |
23.7 |
4.5 |
2.5 |
2.6 |
11.1 |
13.2 |
21.9 |
100 |
1961-62 |
20.1 |
1.0 |
22.3 |
8.1 |
1.0 |
1.6 |
12.3 |
15.9 |
17.7 |
100 |
1962-63 |
16.9 |
1.3 |
21.1 |
10.0 |
1.3 |
2.5 |
12.9 |
13.5 |
20.4 |
100 |
1963-64 |
17.7 |
2.0 |
19.1 |
9.8 |
2.4 |
3.1 |
12.2 |
12.8 |
20.7 |
100 |
1964-65 |
16.4 |
1.9 |
23.5 |
8.4 |
1.7 |
2.5 |
11.5 |
12.7 |
21.4 |
100 |
1965-66 |
16.0 |
1.0 |
25.5 |
9.9 |
1.6 |
2.3 |
11.2 |
12.1 |
20.4 |
100 |
1966-67 |
17.4 |
1.9 |
29.6 |
9.0 |
1.6 |
2.4 |
10.4 |
12.9 |
15.0 |
100 |
1967-68 |
19.9 |
1.5 |
25.0 |
9.1 |
1.6 |
3.0 |
9.5 |
14.8 |
15.6 |
100 |
1968-69 |
22.2 |
1.3 |
23.8 |
8.5 |
1.8 |
2.9 |
10.1 |
16.6 |
12.8 |
100 |
1969-70 |
20.4 |
2.0 |
25.9 |
8.7 |
1.7 |
2.9 |
9.4 |
15.9 |
13.0 |
100 |
1970-71 |
20.0 |
1.3 |
25.1 |
8.8 |
1.3 |
5.9 |
10.4 |
14.2 |
13.0 |
100 |
1971-72 |
19.4 |
1.9 |
24.2 |
8.4 |
1.5 |
5.3 |
10.4 |
14.1 |
14.8 |
100 |
1972-73 |
22.0 |
1.5 |
20.3 |
7.7 |
1.4 |
3.9 |
11.3 |
13.9 |
18.1 |
100 |
1973-74 |
19.9 |
3.2 |
24.4 |
7.1 |
1.4 |
4.8 |
10.0 |
13.1 |
16.1 |
100 |
1974-75 |
17.1 |
3.6 |
30.3 |
7.1 |
1.3 |
4.7 |
10.6 |
14.2 |
11.1 |
100 |
1975-76 |
20.2 |
6.5 |
23.2 |
9.1 |
1.0 |
7.8 |
9.7 |
11.5 |
11.0 |
100 |
1976-77 |
23.2 |
4.6 |
20.6 |
9.2 |
1.7 |
8.9 |
8.7 |
11.7 |
11.5 |
100 |
1977-78 |
19.3 |
2.9 |
23.5 |
10.4 |
2.1 |
8.0 |
8.3 |
13.0 |
12.4 |
100 |
SA 6a : Capital Formation By Industry Use ( at 1999-2000 Prices) (Concld.) |
(Percentage distribution) |
Year |
Agriculture, Forestry & Fishing |
Mining & Quarrying |
Manufacturing |
Electricity, Gas & Water Supply |
Construction |
Trade, Hotels & Restau rants |
Transport , Storage & Commn. |
Financing, Ins., Real Estate & Business services |
Community, social & personal ser |
Total |
1 |
2 |
3 |
4 |
5 |
6 |
7 |
8 |
9 |
10 |
11 |
1978-79 |
21.7 |
2.9 |
24.9 |
9.9 |
1.3 |
7.1 |
7.9 |
11.5 |
12.8 |
100 |
1979-80 |
22.9 |
3.7 |
22.9 |
10.8 |
1.6 |
4.7 |
7.9 |
11.8 |
13.5 |
100 |
1980-81 |
20.5 |
3.2 |
20.0 |
11.5 |
1.7 |
4.8 |
11.1 |
10.0 |
17.1 |
100 |
1981-82 |
14.8 |
4.2 |
32.1 |
11.5 |
2.4 |
4.2 |
8.6 |
7.2 |
15.0 |
100 |
1982-83 |
16.1 |
6.7 |
27.7 |
12.3 |
1.7 |
4.4 |
7.2 |
7.0 |
16.9 |
100 |
1983-84 |
17.2 |
6.5 |
25.4 |
12.5 |
0.9 |
4.9 |
7.9 |
8.2 |
16.6 |
100 |
1984-85 |
14.2 |
5.5 |
30.7 |
11.0 |
1.2 |
5.2 |
8.8 |
7.2 |
16.1 |
100 |
1985-86 |
12.2 |
6.2 |
33.6 |
11.3 |
1.3 |
4.3 |
8.5 |
6.9 |
15.8 |
100 |
1986-87 |
11.7 |
6.3 |
30.7 |
13.7 |
0.9 |
4.8 |
9.4 |
6.4 |
16.0 |
100 |
1987-88 |
14.1 |
5.7 |
26.4 |
14.9 |
1.4 |
2.0 |
10.0 |
10.1 |
15.4 |
100 |
1988-89 |
11.0 |
5.3 |
31.5 |
12.8 |
0.8 |
5.8 |
10.4 |
8.5 |
13.9 |
100 |
1989-90 |
10.7 |
6.0 |
29.6 |
11.7 |
1.3 |
6.2 |
11.6 |
10.5 |
12.3 |
100 |
1990-91 |
14.1 |
5.2 |
27.6 |
11.5 |
1.3 |
5.4 |
10.1 |
11.8 |
12.9 |
100 |
1991-92 |
10.0 |
4.8 |
30.7 |
14.6 |
0.9 |
1.6 |
12.3 |
11.5 |
13.6 |
100 |
1992-93 |
11.2 |
3.9 |
31.4 |
11.7 |
1.2 |
4.2 |
10.7 |
12.9 |
12.8 |
100 |
1993-94 |
10.4 |
3.9 |
28.1 |
12.9 |
1.1 |
3.8 |
12.1 |
14.5 |
13.2 |
100 |
1994-95 |
8.4 |
6.6 |
30.2 |
10.1 |
1.2 |
5.2 |
11.5 |
13.1 |
13.7 |
100 |
1995-96 |
7.2 |
4.0 |
43.2 |
8.3 |
1.6 |
2.5 |
10.3 |
11.8 |
11.2 |
100 |
1996-97 |
8.6 |
2.2 |
40.5 |
10.2 |
1.1 |
0.6 |
11.6 |
13.3 |
11.9 |
100 |
1997-98 |
8.2 |
2.2 |
41.2 |
9.1 |
1.9 |
4.7 |
9.1 |
12.9 |
10.6 |
100 |
1998-99 |
8.1 |
2.2 |
39.5 |
10.0 |
2.1 |
1.5 |
9.6 |
13.6 |
13.5 |
100 |
1999-00 |
10.2 |
1.7 |
35.2 |
7.5 |
1.1 |
4.2 |
11.7 |
17.0 |
11.3 |
100 |
2000-01 |
9.7 |
1.2 |
27.4 |
8.4 |
1.9 |
5.9 |
16.2 |
17.0 |
12.3 |
100 |
2001-02 |
11.7 |
1.7 |
21.7 |
9.0 |
3.2 |
3.4 |
12.4 |
22.3 |
14.6 |
100 |
2002-03 |
10.3 |
1.5 |
28.5 |
7.5 |
3.1 |
1.8 |
13.7 |
19.1 |
14.5 |
100 |
2003-04 |
8.8 |
2.3 |
31.1 |
8.1 |
3.5 |
4.0 |
11.8 |
17.1 |
13.3 |
100 |
2004-05 |
7.7 |
2.9 |
39.6 |
6.1 |
3.5 |
3.5 |
11.1 |
12.4 |
13.3 |
100 |
2005-06 P |
7.2 |
3.1 |
41.7 |
6.5 |
3.5 |
3.1 |
8.3 |
12.2 |
14.2 |
100 |
| 2006-07 QE |
7.0 |
2.7 |
43.0 |
6.2 |
3.4 |
2.9 |
8.3 |
11.2 |
15.3 |
100 |
P : Provisional. QE : Quick Estimates. Sources : Central Statistical Organisation. |
SA 6b: Capital Formation By Industry Use ( at 1999-2000 Prices) |
(As percentage to GDP) |
Year |
Agriculture, Forestry & Fishing |
Mining & Quarrying |
Manufacturing |
Electricity, Gas & Water Supply |
Construction |
Trade, Hotels & Restaurants |
Transport , Storage & Commn. |
Financing, Ins., Real Estate & Business services |
Community, social & personal ser |
Total (2 to 10) |
1 |
2 |
3 |
4 |
5 |
6 |
7 |
8 |
9 |
10 |
11 |
1950-51 |
3.2 |
0.1 |
2.0 |
0.3 |
0.1 |
1.3 |
1.8 |
3.3 |
0.8 |
12.9 |
1951-52 |
3.5 |
0.2 |
2.4 |
0.5 |
0.1 |
0.3 |
1.8 |
3.1 |
0.9 |
12.7 |
1952-53 |
3.1 |
0.1 |
1.8 |
0.4 |
0.1 |
0.1 |
1.6 |
2.9 |
0.3 |
10.4 |
1953-54 |
3.0 |
0.1 |
1.1 |
0.4 |
0.1 |
0.3 |
1.5 |
2.4 |
0.7 |
9.5 |
1954-55 |
2.9 |
0.1 |
1.1 |
0.9 |
0.3 |
0.3 |
1.7 |
2.7 |
1.2 |
11.2 |
1955-56 |
3.9 |
0.1 |
1.9 |
1.1 |
0.4 |
0.4 |
1.8 |
2.6 |
1.5 |
13.5 |
1956-57 |
3.4 |
0.0 |
3.2 |
1.2 |
0.3 |
0.3 |
2.1 |
2.8 |
2.2 |
15.6 |
1957-58 |
4.1 |
0.1 |
3.0 |
1.0 |
0.1 |
0.3 |
2.2 |
2.5 |
2.7 |
16.0 |
1958-59 |
4.0 |
0.0 |
1.7 |
0.9 |
0.1 |
0.3 |
2.0 |
2.3 |
2.4 |
13.6 |
1959-60 |
2.6 |
0.1 |
3.8 |
0.8 |
0.1 |
0.3 |
1.7 |
2.2 |
2.9 |
14.4 |
1960-61 |
2.9 |
0.3 |
3.7 |
0.7 |
0.4 |
0.4 |
1.7 |
2.0 |
3.4 |
15.5 |
1961-62 |
3.2 |
0.2 |
3.6 |
1.3 |
0.2 |
0.3 |
2.0 |
2.6 |
2.8 |
16.1 |
1962-63 |
2.8 |
0.2 |
3.5 |
1.7 |
0.2 |
0.4 |
2.2 |
2.3 |
3.4 |
16.8 |
1963-64 |
3.2 |
0.4 |
3.4 |
1.7 |
0.4 |
0.6 |
2.2 |
2.3 |
3.7 |
17.9 |
1964-65 |
3.0 |
0.3 |
4.3 |
1.5 |
0.3 |
0.4 |
2.1 |
2.3 |
3.9 |
18.2 |
1965-66 |
3.1 |
0.2 |
4.9 |
1.9 |
0.3 |
0.4 |
2.2 |
2.3 |
3.9 |
19.2 |
1966-67 |
3.5 |
0.4 |
6.0 |
1.8 |
0.3 |
0.5 |
2.1 |
2.6 |
3.0 |
20.2 |
1967-68 |
3.8 |
0.3 |
4.8 |
1.8 |
0.3 |
0.6 |
1.8 |
2.9 |
3.0 |
19.3 |
1968-69 |
4.1 |
0.2 |
4.4 |
1.6 |
0.3 |
0.5 |
1.9 |
3.0 |
2.4 |
18.4 |
1969-70 |
3.8 |
0.4 |
4.8 |
1.6 |
0.3 |
0.5 |
1.8 |
3.0 |
2.4 |
18.6 |
1970-71 |
3.6 |
0.2 |
4.5 |
1.6 |
0.2 |
1.1 |
1.9 |
2.5 |
2.3 |
18.0 |
1971-72 |
3.7 |
0.4 |
4.6 |
1.6 |
0.3 |
1.0 |
2.0 |
2.7 |
2.8 |
19.2 |
1972-73 |
4.3 |
0.3 |
3.9 |
1.5 |
0.3 |
0.8 |
2.2 |
2.7 |
3.5 |
19.4 |
1973-74 |
4.0 |
0.6 |
4.9 |
1.4 |
0.3 |
1.0 |
2.0 |
2.6 |
3.2 |
20.0 |
1974-75 |
3.5 |
0.7 |
6.1 |
1.4 |
0.3 |
0.9 |
2.1 |
2.9 |
2.2 |
20.2 |
1975-76 |
4.0 |
1.3 |
4.6 |
1.8 |
0.2 |
1.5 |
1.9 |
2.2 |
2.2 |
19.6 |
1976-77 |
4.8 |
0.9 |
4.3 |
1.9 |
0.3 |
1.9 |
1.8 |
2.4 |
2.4 |
20.8 |
1977-78 |
4.0 |
0.6 |
4.8 |
2.1 |
0.4 |
1.6 |
1.7 |
2.7 |
2.5 |
20.5 |
1978-79 |
4.8 |
0.6 |
5.5 |
2.2 |
0.3 |
1.6 |
1.7 |
2.5 |
2.8 |
22.0 |
SA 6b: Capital Formation By Industry Use (at 1999-2000 Prices) (Concld.) |
(As percentage to GDP) |
Year |
Agriculture, Forestry & Fishing |
Mining & Quarrying |
Manufacturing |
Electricity, Gas & Water Supply |
Construction |
Trade, Hotels & Restaurants |
Transport , Storage & Commn. |
Financing, Ins., Real Estate & Business services |
Community, social & personal ser |
Total (2 to 10) |
1 |
2 |
3 |
4 |
5 |
6 |
7 |
8 |
9 |
10 |
11 |
1979-80 |
5.2 |
0.8 |
5.2 |
2.5 |
0.4 |
1.1 |
1.8 |
2.7 |
3.1 |
22.8 |
1980-81 |
4.1 |
0.6 |
4.0 |
2.3 |
0.3 |
1.0 |
2.2 |
2.0 |
3.4 |
20.0 |
1981-82 |
3.3 |
0.9 |
7.2 |
2.6 |
0.5 |
0.9 |
1.9 |
1.6 |
3.3 |
22.2 |
1982-83 |
3.4 |
1.4 |
5.9 |
2.6 |
0.4 |
0.9 |
1.5 |
1.5 |
3.6 |
21.3 |
1983-84 |
3.4 |
1.3 |
5.0 |
2.5 |
0.2 |
1.0 |
1.6 |
1.6 |
3.3 |
19.7 |
1984-85 |
3.0 |
1.1 |
6.5 |
2.3 |
0.3 |
1.1 |
1.8 |
1.5 |
3.4 |
21.0 |
1985-86 |
2.7 |
1.4 |
7.5 |
2.5 |
0.3 |
0.9 |
1.9 |
1.5 |
3.5 |
22.2 |
1986-87 |
2.5 |
1.4 |
6.7 |
3.0 |
0.2 |
1.0 |
2.0 |
1.4 |
3.5 |
21.7 |
1987-88 |
3.0 |
1.2 |
5.5 |
3.1 |
0.3 |
0.4 |
2.1 |
2.1 |
3.2 |
21.0 |
1988-89 |
2.4 |
1.2 |
7.0 |
2.8 |
0.2 |
1.3 |
2.3 |
1.9 |
3.1 |
22.1 |
1989-90 |
2.3 |
1.3 |
6.4 |
2.5 |
0.3 |
1.3 |
2.5 |
2.3 |
2.7 |
21.6 |
1990-91 |
3.2 |
1.2 |
6.3 |
2.6 |
0.3 |
1.2 |
2.3 |
2.7 |
2.9 |
22.7 |
1991-92 |
2.0 |
1.0 |
6.2 |
3.0 |
0.2 |
0.3 |
2.5 |
2.3 |
2.8 |
20.3 |
1992-93 |
2.4 |
0.9 |
6.9 |
2.6 |
0.3 |
0.9 |
2.3 |
2.8 |
2.8 |
21.9 |
1993-94 |
2.1 |
0.8 |
5.7 |
2.6 |
0.2 |
0.8 |
2.5 |
2.9 |
2.7 |
20.3 |
1994-95 |
1.9 |
1.5 |
6.8 |
2.3 |
0.3 |
1.2 |
2.6 |
3.0 |
3.1 |
22.6 |
1995-96 |
1.8 |
1.0 |
10.8 |
2.1 |
0.4 |
0.6 |
2.6 |
2.9 |
2.8 |
25.0 |
1996-97 |
1.8 |
0.5 |
8.5 |
2.1 |
0.2 |
0.1 |
2.4 |
2.8 |
2.5 |
21.0 |
1997-98 |
1.9 |
0.5 |
9.5 |
2.1 |
0.4 |
1.1 |
2.1 |
3.0 |
2.5 |
23.2 |
1998-99 |
1.8 |
0.5 |
8.9 |
2.2 |
0.5 |
0.3 |
2.1 |
3.0 |
3.0 |
22.4 |
1999-00 |
2.6 |
0.4 |
8.9 |
1.9 |
0.3 |
1.1 |
3.0 |
4.3 |
2.9 |
25.3 |
2000-01 |
2.3 |
0.3 |
6.7 |
2.0 |
0.5 |
1.4 |
3.9 |
4.1 |
3.0 |
24.3 |
2001-02 |
2.8 |
0.4 |
5.3 |
2.2 |
0.8 |
0.8 |
3.0 |
5.4 |
3.6 |
24.3 |
2002-03 |
2.6 |
0.4 |
7.3 |
1.9 |
0.8 |
0.5 |
3.5 |
4.9 |
3.7 |
25.6 |
2003-04 |
2.4 |
0.6 |
8.6 |
2.3 |
1.0 |
1.1 |
3.3 |
4.8 |
3.7 |
27.8 |
2004-05 |
2.4 |
0.9 |
12.4 |
1.9 |
1.1 |
1.1 |
3.5 |
3.9 |
4.2 |
31.4 |
2005-06 P |
2.5 |
1.1 |
14.4 |
2.3 |
1.2 |
1.1 |
2.9 |
4.2 |
4.9 |
34.5 |
| 2006-07 QE |
2.5 |
1.0 |
15.5 |
2.2 |
1.2 |
1.1 |
3.0 |
4.0 |
5.5 |
36.1 |
P : Provisional. QE : Quick Estimates. Sources : Central Statistical Organisation. |
| SA 7 : Capital Formation By Industry of Use (at current prices) |
(Rupees Crore) |
Year |
Agriculture, Forestry & Fishing |
Mining & Quarrying |
Manu facturing |
Electricity, Gas & Water Supply |
Construction |
Trade, Hotels & Restaurants |
Transport , Storage & Commn. |
Financing, Ins., Real Estate & Business services |
Community, social & personal ser |
Total |
1 |
2 |
3 |
4 |
5 |
6 |
7 |
8 |
9 |
10 |
11 |
1950-51 |
184 |
10 |
234 |
27 |
7 |
143 |
158 |
201 |
72 |
1037 |
1951-52 |
220 |
23 |
345 |
37 |
7 |
38 |
183 |
200 |
86 |
1139 |
1952-53 |
197 |
10 |
267 |
33 |
9 |
15 |
168 |
194 |
19 |
912 |
1953-54 |
194 |
14 |
157 |
29 |
13 |
40 |
165 |
170 |
45 |
827 |
1954-55 |
203 |
17 |
165 |
81 |
41 |
35 |
196 |
196 |
122 |
1057 |
1955-56 |
289 |
13 |
292 |
92 |
55 |
50 |
235 |
196 |
136 |
1357 |
1956-57 |
274 |
7 |
566 |
144 |
55 |
55 |
301 |
240 |
235 |
1876 |
1957-58 |
341 |
13 |
558 |
91 |
21 |
54 |
326 |
227 |
329 |
1960 |
1958-59 |
371 |
9 |
325 |
120 |
23 |
56 |
309 |
232 |
289 |
1735 |
1959-60 |
256 |
14 |
753 |
95 |
30 |
67 |
282 |
239 |
360 |
2097 |
1960-61 |
314 |
48 |
819 |
128 |
87 |
77 |
319 |
242 |
476 |
2511 |
1961-62 |
376 |
40 |
833 |
214 |
42 |
57 |
405 |
331 |
421 |
2720 |
1962-63 |
350 |
54 |
877 |
321 |
61 |
89 |
464 |
315 |
533 |
3064 |
1963-64 |
427 |
78 |
907 |
340 |
127 |
125 |
511 |
344 |
622 |
3481 |
1964-65 |
480 |
98 |
1254 |
338 |
100 |
105 |
561 |
383 |
760 |
4080 |
1965-66 |
538 |
53 |
1501 |
426 |
109 |
109 |
613 |
401 |
770 |
4520 |
1966-67 |
679 |
102 |
1973 |
428 |
121 |
141 |
659 |
480 |
609 |
5191 |
1967-68 |
853 |
93 |
1797 |
484 |
137 |
199 |
643 |
600 |
767 |
5572 |
1968-69 |
1007 |
76 |
1705 |
459 |
153 |
181 |
690 |
702 |
598 |
5570 |
1969-70 |
1088 |
135 |
2143 |
552 |
163 |
209 |
726 |
785 |
743 |
6544 |
1970-71 |
1170 |
103 |
2232 |
655 |
139 |
461 |
873 |
755 |
822 |
7211 |
1971-72 |
1327 |
158 |
2478 |
683 |
179 |
480 |
1014 |
868 |
1086 |
8275 |
1972-73 |
1594 |
141 |
2194 |
711 |
178 |
365 |
1194 |
923 |
1420 |
8719 |
1973-74 |
1849 |
327 |
3352 |
724 |
200 |
590 |
1245 |
1086 |
1573 |
10946 |
1974-75 |
1875 |
538 |
5398 |
982 |
246 |
720 |
1632 |
1509 |
1324 |
14226 |
1975-76 |
2453 |
1139 |
4599 |
1494 |
231 |
1250 |
1731 |
1399 |
1528 |
15825 |
1976-77 |
3251 |
887 |
4409 |
1633 |
373 |
1539 |
1684 |
1580 |
1813 |
17169 |
1977-78 |
3044 |
653 |
5481 |
2016 |
505 |
1461 |
1760 |
1902 |
2163 |
18985 |
1978-79 |
4078 |
662 |
7067 |
2313 |
408 |
1507 |
2021 |
2117 |
2678 |
22850 |
SA 7 : Capital Formation By Industry of Use (at current prices) (Concld.) |
(Rupees Crore) |
Year |
Agriculture, Forestry & Fishing |
Mining & Quarrying |
Manufacturing |
Electricity, Gas & Water Supply |
Construction |
Trade, Hotels & Restaurants |
Transport , Storage & Commn. |
Financing, Ins., Real Estate & Business services |
Community, social & personal ser |
Total |
1 |
2 |
3 |
4 |
5 |
6 |
7 |
8 |
9 |
10 |
11 |
1979-80 |
4756 |
1143 |
7345 |
2789 |
537 |
1276 |
2395 |
2516 |
3150 |
25908 |
1980-81 |
4342 |
968 |
6343 |
3205 |
589 |
1560 |
3621 |
2279 |
4057 |
26964 |
1981-82 |
4145 |
1664 |
14293 |
4166 |
1090 |
1830 |
3666 |
2352 |
4691 |
37897 |
1982-83 |
4854 |
2948 |
13561 |
4881 |
863 |
2127 |
3236 |
2645 |
5817 |
40932 |
1983-84 |
5605 |
2896 |
13149 |
5202 |
519 |
2503 |
3731 |
3506 |
6253 |
43365 |
1984-85 |
5841 |
2910 |
18723 |
5604 |
799 |
3184 |
4993 |
3831 |
7339 |
53225 |
1985-86 |
6364 |
3974 |
24869 |
7096 |
1005 |
3124 |
6030 |
4484 |
9068 |
66015 |
1986-87 |
6766 |
4415 |
24582 |
9530 |
765 |
3799 |
7314 |
4878 |
10445 |
72493 |
1987-88 |
9171 |
4245 |
23204 |
11178 |
1235 |
1832 |
8415 |
8334 |
11115 |
78731 |
1988-89 |
9068 |
4974 |
34530 |
12051 |
958 |
6336 |
11107 |
8610 |
12715 |
100348 |
1989-90 |
10216 |
6577 |
37102 |
13152 |
1713 |
7598 |
14460 |
11772 |
13098 |
115689 |
1990-91 |
15839 |
6890 |
42211 |
15348 |
2160 |
8024 |
15152 |
15593 |
16381 |
137598 |
1991-92 |
11891 |
6628 |
48672 |
20066 |
1491 |
2839 |
18666 |
15819 |
17813 |
143885 |
1992-93 |
16637 |
6738 |
62033 |
20948 |
2522 |
8048 |
19589 |
21512 |
20886 |
178912 |
1993-94 |
16230 |
6665 |
56551 |
23761 |
2176 |
7497 |
22656 |
25761 |
22430 |
183728 |
1994-95 |
17392 |
15799 |
77528 |
23474 |
3140 |
13096 |
27989 |
30354 |
30200 |
238971 |
1995-96 |
19838 |
11819 |
143576 |
25003 |
5586 |
8627 |
32473 |
37446 |
32576 |
316944 |
1996-97 |
24107 |
6269 |
128284 |
31027 |
3520 |
2047 |
35402 |
40230 |
34077 |
304961 |
1997-98 |
28701 |
8030 |
152708 |
33329 |
7349 |
17222 |
33522 |
46811 |
37332 |
365005 |
1998-99 |
31021 |
8629 |
158115 |
39705 |
8275 |
6878 |
37778 |
53164 |
52910 |
396384 |
1999-00 |
50151 |
8636 |
174098 |
37267 |
5504 |
20652 |
58021 |
83934 |
55736 |
493999 |
2000-01 |
46734 |
5634 |
136624 |
40945 |
9627 |
29800 |
80030 |
83878 |
60013 |
493285 |
2001-02 |
61638 |
8889 |
117729 |
48015 |
17370 |
18098 |
65500 |
122021 |
77594 |
536854 |
2002-03 |
61882 |
9398 |
171820 |
44961 |
18717 |
10603 |
81557 |
118981 |
87614 |
605533 |
2003-04 |
61467 |
16693 |
222902 |
57532 |
25120 |
29550 |
81514 |
124040 |
94082 |
712900 |
2004-05 |
71693 |
29038 |
379072 |
57475 |
33750 |
34125 |
102096 |
122674 |
124966 |
954889 |
2005-06 P |
83955 |
38883 |
497599 |
77300 |
43018 |
38059 |
96814 |
151976 |
167804 |
1195408 |
| 2006-07 QE |
96608 |
39398 |
623100 |
88846 |
50477 |
43165 |
113974 |
168386 |
218650 |
1442604 |
P : Provisional. QE : Quick Estimates. Sources : Central Statistical Organisation. |
SA 7a : Capital Formation By Industry of Use (at current prices) |
(Percentage distribution) |
Year |
Agriculture, Forestry & Fishing |
Mining & Quarrying |
Manufacturing |
Electricity, Gas & Water Supply |
Construction |
Trade, Hotels & Restaurants |
Transport , Storage & Commn. |
Financing, Ins., Real Estate & Business services |
Community, social & personal ser |
Total |
1 |
2 |
3 |
4 |
5 |
6 |
7 |
8 |
9 |
10 |
11 |
1950-51 |
17.7 |
0.9 |
22.6 |
2.6 |
0.7 |
13.8 |
15.3 |
19.4 |
7.0 |
100 |
1951-52 |
19.3 |
2.0 |
30.3 |
3.3 |
0.6 |
3.3 |
16.1 |
17.6 |
7.5 |
100 |
1952-53 |
21.6 |
1.1 |
29.3 |
3.6 |
1.0 |
1.6 |
18.4 |
21.3 |
2.1 |
100 |
1953-54 |
23.5 |
1.7 |
18.9 |
3.5 |
1.6 |
4.8 |
20.0 |
20.5 |
5.5 |
100 |
1954-55 |
19.2 |
1.6 |
15.6 |
7.7 |
3.9 |
3.4 |
18.5 |
18.5 |
11.6 |
100 |
1955-56 |
21.3 |
0.9 |
21.5 |
6.8 |
4.0 |
3.7 |
17.3 |
14.4 |
10.0 |
100 |
1956-57 |
14.6 |
0.4 |
30.2 |
7.7 |
2.9 |
2.9 |
16.1 |
12.8 |
12.5 |
100 |
1957-58 |
17.4 |
0.6 |
28.5 |
4.7 |
1.1 |
2.7 |
16.6 |
11.6 |
16.8 |
100 |
1958-59 |
21.4 |
0.5 |
18.7 |
6.9 |
1.3 |
3.2 |
17.8 |
13.4 |
16.6 |
100 |
1959-60 |
12.2 |
0.7 |
35.9 |
4.5 |
1.4 |
3.2 |
13.5 |
11.4 |
17.2 |
100 |
1960-61 |
12.5 |
1.9 |
32.6 |
5.1 |
3.5 |
3.1 |
12.7 |
9.7 |
19.0 |
100 |
1961-62 |
13.8 |
1.5 |
30.6 |
7.9 |
1.6 |
2.1 |
14.9 |
12.2 |
15.5 |
100 |
1962-63 |
11.4 |
1.8 |
28.6 |
10.5 |
2.0 |
2.9 |
15.1 |
10.3 |
17.4 |
100 |
1963-64 |
12.3 |
2.2 |
26.1 |
9.8 |
3.7 |
3.6 |
14.7 |
9.9 |
17.9 |
100 |
1964-65 |
11.8 |
2.4 |
30.7 |
8.3 |
2.4 |
2.6 |
13.8 |
9.4 |
18.6 |
100 |
1965-66 |
11.9 |
1.2 |
33.2 |
9.4 |
2.4 |
2.4 |
13.6 |
8.9 |
17.0 |
100 |
1966-67 |
13.1 |
2.0 |
38.0 |
8.2 |
2.3 |
2.7 |
12.7 |
9.2 |
11.7 |
100 |
1967-68 |
15.3 |
1.7 |
32.2 |
8.7 |
2.5 |
3.6 |
11.5 |
10.8 |
13.8 |
100 |
1968-69 |
18.1 |
1.4 |
30.6 |
8.2 |
2.7 |
3.2 |
12.4 |
12.6 |
10.7 |
100 |
1969-70 |
16.6 |
2.1 |
32.8 |
8.4 |
2.5 |
3.2 |
11.1 |
12.0 |
11.4 |
100 |
1970-71 |
16.2 |
1.4 |
31.0 |
9.1 |
1.9 |
6.4 |
12.1 |
10.5 |
11.4 |
100 |
1971-72 |
16.0 |
1.9 |
29.9 |
8.3 |
2.2 |
5.8 |
12.3 |
10.5 |
13.1 |
100 |
1972-73 |
18.3 |
1.6 |
25.2 |
8.2 |
2.0 |
4.2 |
13.7 |
10.6 |
16.3 |
100 |
1973-74 |
16.9 |
3.0 |
30.6 |
6.6 |
1.8 |
5.4 |
11.4 |
9.9 |
14.4 |
100 |
1974-75 |
13.2 |
3.8 |
37.9 |
6.9 |
1.7 |
5.1 |
11.5 |
10.6 |
9.3 |
100 |
1975-76 |
15.5 |
7.2 |
29.1 |
9.4 |
1.5 |
7.9 |
10.9 |
8.8 |
9.7 |
100 |
1976-77 |
18.9 |
5.2 |
25.7 |
9.5 |
2.2 |
9.0 |
9.8 |
9.2 |
10.6 |
100 |
1977-78 |
16.0 |
3.4 |
28.9 |
10.6 |
2.7 |
7.7 |
9.3 |
10.0 |
11.4 |
100 |
1978-79 |
17.8 |
2.9 |
30.9 |
10.1 |
1.8 |
6.6 |
8.8 |
9.3 |
11.7 |
100 |
SA 7a : Capital Formation By Industry of Use (at current prices) (Concld.) |
(Percentage distribution) |
Year |
Agriculture, Forestry & Fishing |
Mining & Quarrying |
Manufacturing |
Electricity, Gas & Water Supply |
Construction |
Trade, Hotels & Restau rants |
Transport , Storage & Commn. |
Financing, Ins., Real Estate & Business services |
Community, social & personal ser |
Total |
1 |
2 |
3 |
4 |
5 |
6 |
7 |
8 |
9 |
10 |
11 |
1979-80 |
18.4 |
4.4 |
28.4 |
10.8 |
2.1 |
4.9 |
9.2 |
9.7 |
12.2 |
100 |
1980-81 |
16.1 |
3.6 |
23.5 |
11.9 |
2.2 |
5.8 |
13.4 |
8.5 |
15.0 |
100 |
1981-82 |
10.9 |
4.4 |
37.7 |
11.0 |
2.9 |
4.8 |
9.7 |
6.2 |
12.4 |
100 |
1982-83 |
11.9 |
7.2 |
33.1 |
11.9 |
2.1 |
5.2 |
7.9 |
6.5 |
14.2 |
100 |
1983-84 |
12.9 |
6.7 |
30.3 |
12.0 |
1.2 |
5.8 |
8.6 |
8.1 |
14.4 |
100 |
1984-85 |
11.0 |
5.5 |
35.2 |
10.5 |
1.5 |
6.0 |
9.4 |
7.2 |
13.8 |
100 |
1985-86 |
9.6 |
6.0 |
37.7 |
10.7 |
1.5 |
4.7 |
9.1 |
6.8 |
13.7 |
100 |
1986-87 |
9.3 |
6.1 |
33.9 |
13.1 |
1.1 |
5.2 |
10.1 |
6.7 |
14.4 |
100 |
1987-88 |
11.6 |
5.4 |
29.5 |
14.2 |
1.6 |
2.3 |
10.7 |
10.6 |
14.1 |
100 |
1988-89 |
9.0 |
5.0 |
34.4 |
12.0 |
1.0 |
6.3 |
11.1 |
8.6 |
12.7 |
100 |
1989-90 |
8.8 |
5.7 |
32.1 |
11.4 |
1.5 |
6.6 |
12.5 |
10.2 |
11.3 |
100 |
1990-91 |
11.5 |
5.0 |
30.7 |
11.2 |
1.6 |
5.8 |
11.0 |
11.3 |
11.9 |
100 |
1991-92 |
8.3 |
4.6 |
33.8 |
13.9 |
1.0 |
2.0 |
13.0 |
11.0 |
12.4 |
100 |
1992-93 |
9.3 |
3.8 |
34.7 |
11.7 |
1.4 |
4.5 |
10.9 |
12.0 |
11.7 |
100 |
1993-94 |
8.8 |
3.6 |
30.8 |
12.9 |
1.2 |
4.1 |
12.3 |
14.0 |
12.2 |
100 |
1994-95 |
7.3 |
6.6 |
32.4 |
9.8 |
1.3 |
5.5 |
11.7 |
12.7 |
12.6 |
100 |
1995-96 |
6.3 |
3.7 |
45.3 |
7.9 |
1.8 |
2.7 |
10.2 |
11.8 |
10.3 |
100 |
1996-97 |
7.9 |
2.1 |
42.1 |
10.2 |
1.2 |
0.7 |
11.6 |
13.2 |
11.2 |
100 |
1997-98 |
7.9 |
2.2 |
41.8 |
9.1 |
2.0 |
4.7 |
9.2 |
12.8 |
10.2 |
100 |
1998-99 |
7.8 |
2.2 |
39.9 |
10.0 |
2.1 |
1.7 |
9.5 |
13.4 |
13.3 |
100 |
1999-00 |
10.2 |
1.7 |
35.2 |
7.5 |
1.1 |
4.2 |
11.7 |
17.0 |
11.3 |
100 |
2000-01 |
9.5 |
1.1 |
27.7 |
8.3 |
2.0 |
6.0 |
16.2 |
17.0 |
12.2 |
100 |
2001-02 |
11.5 |
1.7 |
21.9 |
8.9 |
3.2 |
3.4 |
12.2 |
22.7 |
14.5 |
100 |
2002-03 |
10.2 |
1.6 |
28.4 |
7.4 |
3.1 |
1.8 |
13.5 |
19.6 |
14.5 |
100 |
2003-04 |
8.6 |
2.3 |
31.3 |
8.1 |
3.5 |
4.1 |
11.4 |
17.4 |
13.2 |
100 |
2004-05 |
7.5 |
3.0 |
39.7 |
6.0 |
3.5 |
3.6 |
10.7 |
12.8 |
13.1 |
100 |
2005-06 P |
7.0 |
3.3 |
41.6 |
6.5 |
3.6 |
3.2 |
8.1 |
12.7 |
14.0 |
100 |
| 2006-07 QE |
6.7 |
2.7 |
43.2 |
6.2 |
3.5 |
3.0 |
7.9 |
11.7 |
15.2 |
100 |
P : Provisional. QE : Quick Estimates. Sources : Central Statistical Organisation. |
SA 7b: Capital Formation By Industry Of Use (at current prices) |
(As percentage to GDP) |
Year |
Agriculture, Forestry & Fishing |
Mining & Quarrying |
Manu facturing |
Electricity, Gas & Water Supply |
Construction |
Trade, Hotels & Restaurants |
Trans port , Storage & Commn. |
Financing, Ins., Real Estate & Business services |
Community, social & personal ser |
Total |
1 |
2 |
3 |
4 |
5 |
6 |
7 |
8 |
9 |
10 |
11 |
1950-51 |
1.8 |
0.1 |
2.3 |
0.3 |
0.1 |
1.4 |
1.6 |
2.0 |
0.7 |
10.3 |
1951-52 |
2.0 |
0.2 |
3.2 |
0.3 |
0.1 |
0.4 |
1.7 |
1.9 |
0.8 |
10.6 |
1952-53 |
1.9 |
0.1 |
2.5 |
0.3 |
0.1 |
0.1 |
1.6 |
1.8 |
0.2 |
8.7 |
1953-54 |
1.7 |
0.1 |
1.4 |
0.3 |
0.1 |
0.3 |
1.4 |
1.5 |
0.4 |
7.2 |
1954-55 |
1.9 |
0.2 |
1.5 |
0.8 |
0.4 |
0.3 |
1.8 |
1.8 |
1.1 |
9.8 |
1955-56 |
2.6 |
0.1 |
2.6 |
0.8 |
0.5 |
0.4 |
2.1 |
1.8 |
1.2 |
12.3 |
1956-57 |
2.1 |
0.1 |
4.3 |
1.1 |
0.4 |
0.4 |
2.3 |
1.8 |
1.8 |
14.3 |
1957-58 |
2.5 |
0.1 |
4.1 |
0.7 |
0.2 |
0.4 |
2.4 |
1.7 |
2.4 |
14.5 |
1958-59 |
2.5 |
0.1 |
2.2 |
0.8 |
0.2 |
0.4 |
2.1 |
1.5 |
1.9 |
11.5 |
1959-60 |
1.6 |
0.1 |
4.7 |
0.6 |
0.2 |
0.4 |
1.8 |
1.5 |
2.3 |
13.2 |
1960-61 |
1.8 |
0.3 |
4.7 |
0.7 |
0.5 |
0.4 |
1.8 |
1.4 |
2.7 |
14.4 |
1961-62 |
2.0 |
0.2 |
4.5 |
1.2 |
0.2 |
0.3 |
2.2 |
1.8 |
2.3 |
14.7 |
1962-63 |
1.8 |
0.3 |
4.4 |
1.6 |
0.3 |
0.4 |
2.3 |
1.6 |
2.7 |
155 |
1963-64 |
1.9 |
0.3 |
4.0 |
1.5 |
0.6 |
0.5 |
2.2 |
1.5 |
2.7 |
15.3 |
1964-65 |
1.8 |
0.4 |
4.7 |
1.3 |
0.4 |
0.4 |
2.1 |
1.4 |
2.9 |
15.4 |
1965-66 |
1.9 |
0.2 |
5.4 |
1.5 |
0.4 |
0.4 |
2.2 |
1.4 |
2.7 |
16.1 |
1966-67 |
2.1 |
0.3 |
6.2 |
1.3 |
0.4 |
0.4 |
2.1 |
1.5 |
1.9 |
16.4 |
1967-68 |
2.3 |
0.2 |
4.8 |
1.3 |
0.4 |
0.5 |
1.7 |
1.6 |
2.1 |
15.0 |
1968-69 |
2.6 |
0.2 |
4.3 |
1.2 |
0.4 |
0.5 |
1.8 |
1.8 |
1.5 |
14.2 |
1969-70 |
2.5 |
0.3 |
5.0 |
1.3 |
0.4 |
0.5 |
1.7 |
1.8 |
1.7 |
15.1 |
1970-71 |
2.5 |
0.2 |
4.8 |
1.4 |
0.3 |
1.0 |
1.9 |
1.6 |
1.8 |
15.6 |
1971-72 |
2.7 |
0.3 |
5.0 |
1.4 |
0.4 |
1.0 |
2.0 |
1.8 |
2.2 |
16.7 |
1972-73 |
2.9 |
0.3 |
4.0 |
1.3 |
0.3 |
0.7 |
2.2 |
1.7 |
2.6 |
16.0 |
1973-74 |
2.8 |
0.5 |
5.0 |
1.1 |
0.3 |
0.9 |
1.9 |
1.6 |
2.4 |
16.5 |
1974-75 |
2.4 |
0.7 |
6.9 |
1.3 |
0.3 |
0.9 |
2.1 |
1.9 |
1.7 |
18.1 |
1975-76 |
2.9 |
1.4 |
5.5 |
1.8 |
0.3 |
1.5 |
2.1 |
1.7 |
1.8 |
18.8 |
1976-77 |
3.6 |
1.0 |
4.9 |
1.8 |
0.4 |
1.7 |
1.9 |
1.7 |
2.0 |
18.9 |
1977-78 |
3.0 |
0.6 |
5.3 |
2.0 |
0.5 |
1.4 |
1.7 |
1.8 |
2.1 |
18.5 |
1978-79 |
3.7 |
0.6 |
6.3 |
2.1 |
0.4 |
1.4 |
1.8 |
1.9 |
2.4 |
20.5 |
SA 7b: Capital Formation By Industry Of Use (at current prices) (Concld.) |
(As percentage to GDP) |
Year |
Agriculture, Forestry & Fishing |
Mining & Quarrying |
Manu facturing |
Electricity, Gas & Water Supply |
Construction |
Trade, Hotels & Restaurants |
Transport , Storage & Commn. |
Financing, Ins., Real Estate & Business services |
Community, social & personal ser |
Total |
1 |
2 |
3 |
4 |
5 |
6 |
7 |
8 |
9 |
10 |
11 |
1979-80 |
3.9 |
0.9 |
6.0 |
2.3 |
0.4 |
1.0 |
2.0 |
2.1 |
2.6 |
21.2 |
1980-81 |
3.0 |
0.7 |
4.4 |
2.2 |
0.4 |
1.1 |
2.5 |
1.6 |
2.8 |
18.5 |
1981-82 |
2.4 |
1.0 |
8.4 |
2.4 |
0.6 |
1.1 |
2.1 |
1.4 |
2.7 |
22.2 |
1982-83 |
2.5 |
1.5 |
7.1 |
2.6 |
0.5 |
1.1 |
1.7 |
1.4 |
3.0 |
21.4 |
1983-84 |
2.5 |
1.3 |
5.9 |
2.3 |
0.2 |
1.1 |
1.7 |
1.6 |
2.8 |
19.5 |
1984-85 |
2.3 |
1.2 |
7.5 |
2.2 |
0.3 |
1.3 |
2.0 |
1.5 |
2.9 |
21.4 |
1985-86 |
2.3 |
1.4 |
8.8 |
2.5 |
0.4 |
1.1 |
2.1 |
1.6 |
3.2 |
23.5 |
1986-87 |
2.1 |
1.4 |
7.8 |
3.0 |
0.2 |
1.2 |
2.3 |
1.5 |
3.3 |
23.0 |
1987-88 |
2.6 |
1.2 |
6.5 |
3.1 |
0.3 |
0.5 |
2.4 |
2.3 |
3.1 |
22.0 |
1988-89 |
2.1 |
1.2 |
8.1 |
2.8 |
0.2 |
1.5 |
2.6 |
2.0 |
3.0 |
23.6 |
1989-90 |
2.1 |
1.3 |
7.6 |
2.7 |
0.4 |
1.6 |
3.0 |
2.4 |
2.7 |
23.7 |
1990-91 |
2.8 |
1.2 |
7.4 |
2.7 |
0.4 |
1.4 |
2.7 |
2.7 |
2.9 |
24.2 |
1991-92 |
1.8 |
1.0 |
7.4 |
3.1 |
0.2 |
0.4 |
2.9 |
2.4 |
2.7 |
22.0 |
1992-93 |
2.2 |
0.9 |
8.2 |
2.8 |
0.3 |
1.1 |
2.6 |
2.9 |
2.8 |
23.8 |
1993-94 |
1.9 |
0.8 |
6.5 |
2.7 |
0.3 |
0.9 |
2.6 |
3.0 |
2.6 |
21.2 |
1994-95 |
1.7 |
1.6 |
7.6 |
2.3 |
0.3 |
1.3 |
2.8 |
3.0 |
3.0 |
23.5 |
1995-96 |
1.7 |
1.0 |
12.0 |
2.1 |
0.5 |
0.7 |
2.7 |
3.1 |
2.7 |
26.6 |
1996-97 |
1.7 |
0.5 |
9.3 |
2.3 |
0.3 |
0.1 |
2.6 |
2.9 |
2.5 |
22.1 |
1997-98 |
1.9 |
0.5 |
10.0 |
2.2 |
0.5 |
1.1 |
2.2 |
3.1 |
2.4 |
23.9 |
1998-99 |
1.8 |
0.5 |
9.0 |
2.3 |
0.5 |
0.4 |
2.2 |
3.0 |
3.0 |
22.6 |
1999-00 |
2.6 |
0.4 |
8.9 |
1.9 |
0.3 |
1.1 |
3.0 |
4.3 |
2.9 |
25.3 |
2000-01 |
2.2 |
0.3 |
6.5 |
1.9 |
0.5 |
1.4 |
3.8 |
4.0 |
2.9 |
23.5 |
2001-02 |
2.7 |
0.4 |
5.2 |
2.1 |
0.8 |
0.8 |
2.9 |
5.4 |
3.4 |
23.6 |
2002-03 |
2.5 |
0.4 |
7.0 |
1.8 |
0.8 |
0.4 |
3.3 |
4.8 |
3.6 |
24.7 |
2003-04 |
2.2 |
0.6 |
8.1 |
2.1 |
0.9 |
1.1 |
3.0 |
4.5 |
3.4 |
25.9 |
2004-05 |
2.3 |
0.9 |
12.0 |
1.8 |
1.1 |
1.1 |
3.2 |
3.9 |
4.0 |
30.3 |
2005-06 P |
2.3 |
1.1 |
13.9 |
2.2 |
1.2 |
1.1 |
2.7 |
4.2 |
4.7 |
33.4 |
| 2006-07 QE |
2.3 |
1.0 |
15.0 |
2.1 |
1.2 |
1.0 |
2.7 |
4.1 |
5.3 |
34.8 |
P : Provisional. QE : Quick Estimates. Sources : Central Statistical Organisation. |
List of Abbreviations used |
ACNI |
Advisory Committee on National Accounts |
AMFI |
Association of Mutual Funds in India |
ASI |
Annual Survey of Industry |
ASNME |
Annual Survey of Non-Manufacturing Enterprises |
APRA |
Australian Prudential Regulation Authority |
AIDIS |
All India Debt and Investment Survey |
ASSOCHAM |
Association of Chambers of Industry |
BMTPC |
Building Materials and Technology Promotion Council |
BSR |
Basic Statistical Returns |
BPO |
Business Process Outsourcing |
BoP |
Balance of Payments |
BSE |
Bombay Stock Exchange |
CAD |
Current Account Deficit |
CF |
Company Finance |
CFA |
Commodity Flow Approach |
CII |
Confederation of Indian Industry |
CIN |
Corporate Identification Number |
CIS |
Change in Stocks |
CMIE |
Centre for Monitoring Indian Economy |
CSO |
Central Statistical Organisation |
CMD |
Capital Market Division |
CFC |
Consumption of Fixed Capital |
CFRAs |
Combined Finance and Revenue Accounts |
CPWD |
Central Public Work Department |
CPFC |
Central Provident Fund Commissioner |
DCA |
Department of Corporate Affairs |
DEAP |
Department of Economic Analysis and Policy |
DEPR |
Depreciation |
DSIM |
Department of Statistics and Information Management |
DIF |
Division of International Finance |
DMB |
Division of Money and Banking |
DGBA |
Department of Government Budget and Account |
DNBS |
Department of Non-Banking Supervision |
DSLF |
Division of State and Local Finance |
DCA |
Department of Company Affairs |
DCU |
Department of Commercial Undertaking |
EAC |
Economic Advisory Council |
EDI |
Electronic Data Interchange |
EPWRF |
Economic and Political Weekly Research Foundation |
EPFO |
Employees Provident Fund Organisation |
ESRI |
Economic and Social Research Institution |
ESIC |
Employees’ State Insurance Corporation |
FCRN |
Foreign Company Registration Number |
FoF |
Flow of Funds Accounts |
FDI |
Foreign Direct Investment |
FISIM |
Financial Intermediation Services Indirectly Measured |
FRB |
Federal Reserve Board |
FRBM |
Fiscal Responsibility and Budget Management |
GAAP |
Generally Accepted Accounting Principles |
GDP |
Gross Domestic Product |
GDPCMP |
Gross Domestic Product at Current Market Price |
GDS |
Gross Domestic Savings |
GFA |
Gross Financial Assets |
GS |
Gross Savings |
GIC |
General Insurance Corporation of India |
GDCF |
Gross Domestic Capital Formation |
GFCF |
Gross Fixed Capital Formation |
GNS |
Gross National Savings |
HDFC |
Housing Development Finance Corporation |
HIOA |
Household Income Outlay Account |
HES |
Household Economic Survey |
HTML |
Hypertext Markup Language |
HUF |
Hindu Undivided family |
HLC |
High Level Committee |
HUDCO |
Housing and Urban Development Corporation |
ICICI |
Industrial Credit and Investment Corporation of India |
ILC |
Indian Livestock Census |
IOTT |
Input-Output Transaction Table |
ICAI |
Institute of Chartered Accountants of India |
IFRS |
International Financial Reporting Standards |
IRDA |
Insurance Regulatory & Development Authority |
IDBI |
Industrial Development Bank of India |
IFCI |
Industrial Finance Corporation of India |
IVA |
Inventory Valuation Adjustment |
IIMS |
Invest India Market Solution |
LCH |
Life Cycle Hypothesis |
LIC |
Life Insurance Corporation |
MCA |
Ministry of Corporate Affairs |
MCA21 |
Online Corporate Database Maintained by MCA |
MOSPI |
Ministry of Statistics & Programme Implementation |
MTNL |
Mahanagar Telephone Nigam Limited |
NSC |
National Statistical Commission |
NAD |
National Accounts Division |
NABARD |
National Bank for Agriculture and Rural Development |
NAFCOB |
National Federation of State Cooperative Banks |
NGNBFC |
Non-Government Non-Banking Financial Companies |
NIPA |
National Income and Product Accounts |
NGNFC |
Non-Government non-financial companies |
NOP |
Non-Operating |
NS |
Net Savings |
NPISH |
Non-Profit Institutions Serving Households |
NSSO |
National Sample Survey Organisation |
NAS |
National Accounts Statistics |
NAD |
National Accounts Division |
NCAER |
National Council of Applied Economic Research |
NCUI |
National Cooperative Union of India |
NBFCs |
Non-Banking Financial Companies |
NHB |
National Housing Bank |
NDCU |
Non-Departmental Commercial Undertakings |
NBO |
National Buildings Organisation |
NWS |
National Wealth Survey |
NGO |
Non-Government al Organisation |
NRD |
Non Resident Deposit |
OECD |
Organisation for Economic Co-operation and Development |
ONS |
Office of National Statistics |
OFI |
Other Financial Institutions |
PIM |
Perpetual Inventory Method |
PF |
Provident Fund |
PFRDA |
Provident Fund Regulatory and Development Authority |
PPP |
Public Private Partnership |
PUC |
Paid-up Capital |
QG |
Quasi-Government |
RBI |
Reserve Bank of India |
RLBs |
Rural Local Boards |
ROC |
Registrar of Companies |
SAS |
Situation Assessment Survey |
SAYE |
Save As You Earn |
SPV |
Special Purpose Vehicle |
SNA |
System of National Accounts |
SEBI |
Securities and Exchange Board of India |
SCARDBs |
State Cooperative Agriculture and Rural Development Banks |
SIDCs |
State Industrial Development Corporations |
SFCs |
State Financial Corporations |
SHG |
Self Help Group |
SCBs |
Scheduled Commercial Banks |
SCF |
Survey of Consumer Finance |
ToR |
Terms of Reference |
UNSNA |
United Nations System of National Accounts |
UTIMF |
Unit Trust of India Mutual Fund |
ULBs |
Urban Local Bodies |
XBRL |
Extensible Business Reporting Language |
XML |
Extensible Markup Language |
Select References
-
Aghion Philippe, Diego Comin and Peter Howitt (2006), When Does Domestic Savings Matter for Economic Growth?, www.econ.brown.edu.
-
Anoruo E., and Ahmad, Y. (2001), “Causal Relationship between Domestic Savings and Economic Growth: Evidence from Seven African Countries”, African Development Bank, Blackwell Publishers, Oxford.
-
Athukorala, Premachandra and Kunal Sen (1995), ‘Economic Reforms and Rate of Savings in India’, Economic and Political Weekly, Vol.XXX, No.35, September.
-
Athukorala, P. and Sen, K. (2001), “The Determinants of Private Savings in India”, Economic Development and Cultural Change, December.
-
Akitoby, Bernadin, et al (2007): Public Investment and Public-Private Partnerships”, Economic Issue No.40, International Monetary Fund.
-
André, C, S. Guichard, M. Kennedy, D. Turner (2007) “Corporate net lending: a review of recent trends”, OECD Economics Department Working Papers, No. 583.
-
Auerbach, Alan, 1982, “Issues in the Measurement and Determinants of Business Savings,” NBER Working Paper No. 1024 (Cambridge, Massachusetts: National Bureau of Economic Research).
-
Bacha, E.L. (1990), “A Three-Gap Model of Foreign Transfers and the GDP Growth Rate in Developing Countries”, Journal of Development Economics, Vol. 32, 279-96.
-
Bernanke, B. (2005), “The Global Savings Glut and the U.S. Current Account Deficit”, Remarks at the Sandridge Lecture, Virginia Association of Economics, Richmond, Virginia, March.
-
Bunn, P. and K. Trivedi (2005), “Corporate Expenditures and Pension Contributions: Evidence from UK Company Accounts”, Bank of England Working Paper, No. 276.
-
Broadbent John, Giuseppe Grande, Chris Thompson and Francesco Zollino (2006), Working Group on Institutional Investors, Global Savings and Asset Allocation, Main Structural Drivers of Private Savings: A Review of the Available Evidence, Committee on the Global Financial System.
-
Caroll, C.D., Overland, J. and Weil, D.N. (2000), “Savings and Growth with Habit Formation”, American Economic Review, Vol. 90, 3:351-55.
-
Chowdhury, Anis and Iyanatul Islam (1993), ‘The Newly Industrialising Economies of East Asia’, Routledge, London.
-
Chamberlin Graeme and Sumit Dey-Chowdhury (2008), “Household savings ratio”, Economic and Labour Market Review, Vol. 2, No.3, March.
-
Chaturvedi, Vaibhav, Dholakia, Ravindra H. and Kumar, Brajesh (August 8, 2008), “InterRelationship between Economic Growth, Savings and Inflation in Asia”. Available at SSRN: http://ssrn.com.
-
Chaudhuri Saumitra (2005), “A Note on Investment and Savings”, ICRA Bulletin, Money and Finance, Jan-June.
-
CSO (1989), National Accounts Statistics: Sources and Methods, Central Statistical Organisation, Department of Statistics, Ministry of Planning, Government of India, October.
-
CSO (2007), National Accounts Statistics: Sources and Methods, Central Statistical Organisation, Department of Statistics, Ministry of Planning, Government of India, March.
-
Deaton, Angus (1989), “Savings in developing countries: Theory and review”, Proceedings of the World Bank Annual Conference on Development Economics, Supplement tithe World Bank Economic Review, 61-96.
-
Department of Statistics (1996), “Savings and Capital Formation in India: 1950-51 to 1994-95”, Report of the Expert Group on Savings and Capital Formation (Chairman: Raja J. Chelliah), December.
-
D.R. Khatkhate (1966), “Propensity to Save in the Indian Economy”, Published in NCAER (1965): Savings in India 1950-51 to 1961-62, NCAER New Delhi, July.
-
DeGregorio, J. (1992), “Economic Growth in Latin America”, Journal of Development Economics, Vol. 39: 59-84.
-
European Commission (2003): Guidelines for Successful Public-Private Partnerships.
-
Eurostat News Release (2004): “Treatment of Public-Private Partnerships”, 18/2004, February 11.
-
Ellis, L. and K. Smith (2007), “The Global Upward Trend in the Profit Share” BIS Working Papers, No 231, July.
-
EPWRF (1995), “Economic Reform and Rate of Savings”, Economic and Political Weekly, May 6-13.
-
EPWRF (1996), “Economic Reform and Rate of Savings”, Special Number, Economic and Political Weekly, September.
-
EPWRF and NCAER (2003), “Household Savings and Investment Behaviour in India”, September.
-
EPW (2005), ‘The Socialist State in Making’, [The Economic Weekly (1955), No.8, February 1955], Issue No.8, February 19.
-
F. Warman and A.P. Thirlwall (1994), “Interest Rates, Savings, Investment and Growth in Mexico 1960-90: Tests of the Financial Liberalisation Hypothesis”, The Journal of Development Studies, July.
-
Government of India, CSO, Ministry of Statistics and Programme Implementation.
-
Gene Amromin and Sujit Chakravorti (2007), Debit Card and Cash Usage: “A Cross-Country Analysis”, Federal Reserve Bank of Chicago, WP 2007-04, March.
-
Government of India (2006): “Report of the Working Group on Savings for the Eleventh Five Year Plan (2007-08 to 2011-12)”, Planning Commission, New Delhi.
-
Government of India (1996), Expert Group on Savings and Capital Formation (Chairman: Raja j. Chelliah), Savings and Capital Formation in India 1950-51 to 1994-95.
-
Government of India (1981), Working Group on “Capital Formation and Savings in India 1950-51 to 1979-80” (Chairman: K. N. Raj).
-
Gothoskar and Venkatachalam (1979), “Household Savings and Investment in India”, Margin, Volume 12 No. 1, October.
-
Hemming Richard (2006): “Public Private Partnerships”, Paper presented at the High-Level Seminar: Realizing the Potential for Profitable Investments in Africa, Tunisia, February 28 - March 1.
-
Hagino, Satoru, (2007), Japan’s Approach to capturing the household sector, IFC Bulletin No. 25.
-
Himmelberg, C., P. Mahoney, A. Bang, and B. Chernoff (2004), “Recent Revisions to Corporate Profits: What We Know and When We Knew It”, Current Issues in Economics and Finance, Vol. 10, No. 3, March.
-
Hiroko Oura (2007), “Wild or Tamed? India’s Potential Growth” IMF Working Paper, September 2007.
-
International Monetary Fund (2004): Public-Private Partnerships.
-
IMF (International Monetary Fund) (2006), “Awash with Cash: Why Are Corporate Savings so High?” Chapter IV in World Economic Outlook, April.
-
International Monetary Fund (2007): “Public-Private Partnerships and Fiscal Risks”, SM/07/138, April 23.
-
Japelli, T., and Pagano, M. (1994), “Savings, Growth and Liquidity Constraints”, Quarterly Journal of Economics, 109: 83-109.
-
Krieckhaus, J. (2002), “Reconceptualizing the Developmental State: Public Savings and Economic Growth”, World Development, Vol. 30, No. 10:1697-1712.
-
Kuijs Louis (2006), “How will China’s savings-investment balance evolve?” World Bank Policy Research Working Paper 3958, July 2006
-
King and Levine (1993), “Finance and Growth: Schumpeter might be right” JSTOR, The Quarterly Journal of Economics, Vol. 108, No. 3
-
Loayza, Norman, Klaus Schmidt-Hebbel, and Luis Servén, “What Drives Private Savings cross the World?” Review of Economics and Statistics, May 2000.
-
Mead, C., B. Moulton and K. Petrick (2004), “NIPA Corporate Profits and Reported Earnings: A Comparison and Measurement Issues”, Working Paper, US Department of Commerce, Bureau of Economic Analysis, Washington, DC.
-
Masson, Paul R , Bayoumi, Tamim and Samiei, Hossein, (1998), “International Evidence on the Determinants of Private Savings,” World Bank Economic Review
-
Mohan, Rakesh (2008), “The Growth Record of the Indian Economy, 1950-2008: A Story of Sustained Savings and Investment”, RBI Bulletin, March.
-
Mohan, Ramesh (2006), “Casual Relationship between Savings and Economic Growth in Countries with Different Income Levels”, Economics Bulletin, Vol. 5, No. 3 pp. 1-12.
-
NSC (2001), Report of the National Statistical Commission – Chapters Relevant to “The High Level Committee on Estimation of Savings and Investments, August.
-
NSSO, Government of India (1993), Report on the Pilot Survey of Income, Consumption and Savings – Part I: Income (September 1983-December 1984), Methodological Study, Department of Statistics, Report No. 390, August.
-
NSSO (1995), Report on the Pilot Survey of Income, Consumption and Savings – Part II: Methodological Study (September 1983-December 1984), Department of Statistics, Report No. 398, September.
-
Organisation for Economic Co-operation and Development (2007): OECD Principles for Private Sector Participation in Infrastructure.
-
OECD (2007), “Corporate savings and investment: recent trends and prospects”, OECD Economic Outlook, No. 82.
-
Opler, Tim, Lee Pinkowitz, René Stulz, and Rohan Williamson, 1999, “The Determinants and Implications of Corporate Cash Holdings,” Journal of Financial Economics, Vol. 52 (April), pp. 3–46.
-
Poddar, Tushar, and Eva Yi, 2007, “India’s Rising Growth Potential,” Global Economics Paper No. 152 (New York: Goldman Sachs Global Research Centre)
-
Price Water House Coopers (2204): Developing Public Partnerships in New Europe.
-
Rakshit, Mihir (1983), “On Assessment and Interpretation of Savings-Investment Estimates in India”, Economic and Political Weekly, Annual Number, May.
-
Rakshit, Mihir (1982), “Income, Savings and Capital Formation in India”: Economic and Political Weekly, Annual Number, April.
-
Rougemont, de Philippe (2007): “Accounting for PPP”, Paper presented at the International Seminar on Strengthening Public Investment and Managing Fiscal Risks from Public-Private Partnerships, Budapest, Hungary, March 7-8.
-
Rao, V K R V (1980), “Savings, Capital Formation and National Income”, Economic and Political Weekly, May 31.
-
Rath, D.P. (2007), “Direct Estimation of Savings – An Overview of Issues”, Journal of Income and Wealth, Vo. 2, No.29, July-December.
-
RBI (1982), “Capital Formation and Savings in India 1950-51 to 1979-80”: Report of the Working Group on Savings (Chairman: K N Raj), February.
-
RBI (2006), “Invisibles in India’s Balance of Payments”, Monthly Bulletin, November.
-
RBI (2007), Report of the Working Group on Savings for the Eleventh Five Year Plan (2007-08 to 2011-12) (Chairman: Dr. Rakesh Mohan), Monthly Bulletin, May.
-
RBI (2007), “Non-Banking Financial Companies” Manual on Financial and Banking Statistics, March.
-
RBI (2007), “Flow of Funds Accounts of the Indian Economy 1994-95 to 2000-01”, Monthly Bulletin, September.
-
Reserve Bank of India (1982) ‘Report of the Working Group on Savings’ (Chairman: K.N. Raj)
-
–––(2007), ‘The Report of the Working Group on Savings for the Eleventh Five Year Plan
(Chairman: Dr. Rakesh Mohan).
-
Srinivasan, T N (1994), ‘Data Base for Development Analysis: An overview’, Journal of Development Economics, ELSEVIER, Vol. 44(1): 3-27.
-
Report of the Expert Group on Savings and Capital Formation (1996), Government of India, December.
-
Report of the National Statistical Commission (2001), Government of India, Volumes I and II, September 5.
-
Reserve Bank of India (2006), Annual Report, 2005-06.
-
–––(2007), “Quick Estimates of National Income, 2005-06 and Revised Estimates of National
Income, 2006-07: A Review”, RBI Bulletin, July.
-
Rodrik, Dani and Arvind Subramanian, 2004, “Why India Can Grow at 7 Per cent a Year or More: Projections and Reflections,” IMF Working Paper, International Monetary Fund.
-
S. L. Shetty (2001), “Report of National Statistical Commission - A Comment”, Economic and Political Weekly, December 1.
-
–––(2005), “Savings and Investment Estimates: Time to Take a Fresh Look”, Economic and Political Weekly, February 12.
-
–––(2006), “Revision of National Accounts Statistics: A Welcome Step, Good in Parts” Economic and Political Weekly, June 10.
-
Salz, I. S. (1999), “An Examination of the Causal Relationship between Savings and Growth in the Third World”, Journal of Economics and Finance, Vol. 23: No. 1, 90-98.
-
Stiglitz J, (1998), “Towards a New Paradigm for Development: Strategies, Policies and Processes”, Development Economics, World Bank.
-
Sinha, D. and T Sinha (1998), “Cart Before Horse? The Savings-Growth Nexus in Mexico”, Economics Letter, 61: 43-47.
-
Srinivasan, T. N. (2003), “India’s Statistical System Critiquing the Report of the National Statistical Commission”, Economic and Political Weekly, January 25.
-
UNESCAP (2007): Public-Private Partnership in Infrastructure Development – An introduction to issues from different perspectives.
-
Wray L.R. (1990) ‘Money and Credit in Capitalistic Economy: The Endogenous Money Approach’, Brookfield.
-
–––(1998) ‘Understanding Modern Money: The Key to Full Employment and Price Stability,
Edward Elgar.
-
Yan X. (2002), “Alternative Measures of Household Savings in France”, Paper presented for the
27th Conference of the International Association for Research in Income and Wealth, Stockholm,
Sweden, August 18-24.
|
 IST,
IST,