Indrani Manna*
The industrial slowdown phases are believed to be highly taxing for micro and small enterprises (MSEs), which have limited access to finance and discontinuous cash flows to tide over sales downturn. Further, with rising competition, most of the MSEs have been operating on thin margins which in turn delimits their capacity to absorb demand shocks. However, due to lack of high frequency data, any such analysis of the performance of small enterprises is constrained. This paper attempts to look at the trends in MSE production in a few identified items for which monthly data is more consistently available from the Index of Industrial Production. The paper observes that the cyclical slowdown periods of 2000-01 and 2007-09 so far have retarded the growth of both MSEs and Non-MSEs, with the Non-MSEs experiencing a steeper fall than MSEs in these select commodities. The relative resilience of MSEs during periods of slowdown shows that MSEs are currently operating in that segment where income elasticity is low. A trend analysis of the MSE production during 2001-2009 revealed that while MSEs recovered pretty fast from the industrial slump of the 2000-02, they recorded subdued growth post mid-2004, when the overall industry was at its crest. Econometric evidence confirmed that both domestic and external demand exert a strong positive influence on MSE output, with domestic demand being relatively more important. Credit, although statistically significant was found to have negative relationship with growth. Despite being counter-intuitive, the result was in conformity with the credit view literature. The paper finds evidence that small firms are forced to access bank credit during lower business activity.
INTRODUCTION
The importance of small scale industries in a labour abundant developing economy like India need not be overemphasized. After years of neglect, the industry became the cynosure of policy attention and has witnessed cataclysmic changes in production structure, composition and quality of output and competitive strategies post 1991 (Table 1).
Table 1: Performance of Micro and Small Enterprises (at 2001-02 prices) |
|
2002-03 |
2003-04 |
2004-05 |
2005-06 |
2006-07 |
2007-08 * |
Number of Units (Lakh numbers) |
109.49 |
113.95 |
118.59 |
123.42 |
128.44 |
133.68 |
Employment (Lakh persons) |
260.21 |
271.42 |
282.57 |
299.85 |
312.52 |
322.28 |
Fixed Investment (Rupees crore) |
1,62,317 |
1,70,219 |
1,78,699 |
1,88,113 |
2,13,219 |
2,38,975 |
Production (at constant prices) (1993-94)
(Rupees crore) |
3,06,771 |
3,36,344 |
3,72,938 |
4,18,884 |
4,71,663 |
5,32,979 |
Exports from MSMEs (Rupees crore) |
86,013 |
97,644 |
1,24,417 |
1,50,242 |
1,77,600 |
- |
Growth Rate of the MSE sector (Per cent) |
8.68 |
9.64 |
10.88 |
12.32 |
12.60 |
13.00 |
Percentage Contribution of MSE to
GDP at 1999-2000 prices |
5.91 |
5.79 |
5.84 |
5.83 |
5.94 |
- |
*: Projected.
Source: Annual Report, 2008-09, Ministry of Micro, Small and Medium Enterprises, Government of India. |
In fact, since 2003-04, the value of output in un-registered sector, which mostly consists of micro and small enterprises has surpassed that of the registered sector (Table 2).
However, in order to capture these changing trends in production in micro and small industries, elaborate data and information on production, investment, employment and exports in micro and small industries is a sin qua non. At present, Development Commissioner (Micro, Small and Medium Enterprises) compiles annual data on production and employment in registered micro and small industries. However, it is available with a considerable lag. The Economic Census of non-agricultural enterprises and the follow-up surveys by the National Sample Survey Organisation (NSSO) on unorganized sector are made available only once in five years. In other words, there is hardly any provision to capture high frequency developments in the small industry in the extant data collection system so as to track the impact of changes in domestic macro economic and external factors on the small industry and more particularly the un-registered small scale sector. The index of industrial production (IIP), although provides monthly data on the performance of the Indian industry, it covers only limited items of production in small scale sector and suffers from intense non-response. The handicaps of data hamper the analysis and flow of useful information for an employment intensive sector like small scale industry which is characterized by several forward and backward linkages. The paucity of data/information on MSEs is all the more impinging during periods of industrial slowdown such as the current one, as the slowdown is expected to be better resonated in the performance of MSEs which mostly specialize in the production of low value products.
Table 2: Value of Output in Registered and Un-Registered Sectors |
(Per cent) |
|
Value of Output |
Registered |
Un-Registered |
2001-02 |
3.3 |
3.4 |
2002-03 |
7.4 |
2.2 |
2003-04 |
7.6 |
9.3 |
2004-05 |
9.0 |
12.1 |
2005-06 |
8.7 |
9.3 |
2006-07 |
12.4 |
13.0 |
Source: National Accounts Statistics. |
This paper attempts to circumvent the data handicaps and gauge the trends in small scale production during the slowdown period of 2007-09 by analysing the monthly production figures of the 10 items of industrial production out of the 18 small scale items included in IIP for which monthly data is relatively more consistently available for the period April 2000 to February 2009. The focus will be on creating an MSE production index on the lines of the constituent IIP indices such as the basic goods, intermediate goods, capital goods and consumer goods and their comparison with the corresponding non-MSE production. The major determinants explaining the variations in MSE production is also ascertained through ordinary least square regression analysis.
The paper is arranged into seven sections. Section I elaborates the different sources of data on Micro and Small Enterprises (MSE) and the methodology adopted in this paper to analyse the performance of the sector. Section II presents the comparative trends in MSE and Non-MSEs since 2001. Section III discusses building up of the OLS model. Section IV presents the outcome of the OLS regression analysis. Section V presents the impact of the industrial slowdown on employment in MSEs. Section VI summarises, Section VII gives some policy suggestions and Section VIII gives concluding remarks.
I. Data and Methodology
There is no periodic collection and publication of statistics for the unorganised sector as a whole on an all-India basis. In order to remove the data gaps in the un-organised sector of the non-agriculture economy, the Central Statistical Organisation took a major step in 1976 by launching the Economic Census. The Economic Census provides the frame of establishments for follow-up surveys by National Sample Survey Organisation (NSSO). The NSSO survey on un-organised manufacturing is undertaken once in five years and is designed to collect detailed industry-wise information on the nature of activity, employment, emoluments, inputs, output, inventory of fixed assets, working capital and outstanding loans of the un-organised sector. The Development Commissioner (MSME) publishes annual data on key parameters like number of units, production and employment at the All-India level. However, this data is not very reliable as it is based on 2 per cent of the sample of working units (Saluja, 2004). Noticeably, all these sources provide annual data on organized and un-organised small scale manufacturing with a lag. The only source of high frequency data on the industry available in India is the Index of Industrial Production (IIP) compiled by Central Statistical Organisation (CSO). However, it has always been debated that IIP is non-representative for a broader measure of industrial output in the sense that it does not fully cover the data on unorganised sector. The allegation is not unfounded. Although, the weighting diagram in the latest series of IIP (base 1993-94) has taken into account the contribution of unorganised sector alongwith the organised manufacturing sector, the performance of this sector, which is growing significantly, could not be adequately captured due to non-availability of monthly production data in respect of sufficient number of items of this sector. The production data on the basis of which IIP is calculated contains only 18 items of mostly the registered small scale industry namely, ‘pipes and tubes’ and ‘steel castings’ under basic goods; ‘diesel engines’, ‘air and gas compressor’, ‘machine tools’, ‘power distribution transformers’ and ‘electric motors’ under capital goods sector; ‘cotton yarn’, ‘paints, enamels and varnishes’, ‘optical whitening agent’ and ‘zip fasteners’ under intermediate goods; ‘electric fans’ under consumer durables; and ‘biscuits’, ‘paper and paper board’, ‘leather footwear (Indian type)’, ‘soaps’ (all kinds), ‘matches’ and ‘pencils’ under the consumer non-durables. To make matters worse, the bulk of the available data suffer from non-response. In fact, out of these 18 items, regular monthly data is forthcoming only in case of ten items. Thus any attempt to assess the impact of industrial slowdown on registered micro and small industries can confine to the available data in these 10 items.
In pursuance of this, each of the 10 items for MSE and Non-MSEs, respectively, was converted into monthly production indices with March 2000 as the base year. The weights assigned to these products in IIP have been used in this aggregation. These products together constitute 36.1 per cent by weight of IIP. The individual product indices were then linked together and converted into a composite index using a geometric mean so that we have a comparative composite index for MSE (MII) and Non-MSE (NMII) industrial production in the available 10 items. Although it may be argued that MSEs may not be compared across the different time periods because of the definitional changes that has mostly led to inclusion of certain segments from time to time which were erstwhile excluded, it is important to remember that the policy environment in which the sector has functioned for the most part remained unchanged during the period under review.
A least square regression analysis is then performed to assess the causal factors behind variations in the composite MSE industrial index (MII) with quarterly data on exports in US dollar terms, real domestic demand which was calculated by adding private final consumption expenditure and government final consumption expenditure and deflating by the GDP deflator and real credit outstanding to MSEs as at end-period by deflating nominal credit by GDP deflator as independent variables to determine the impact of domestic and global developments on MII reported in Section III and IV of the paper.
II. Comparison of Production Trends in MSEs and Non-MSEs w.r.t Ten Items
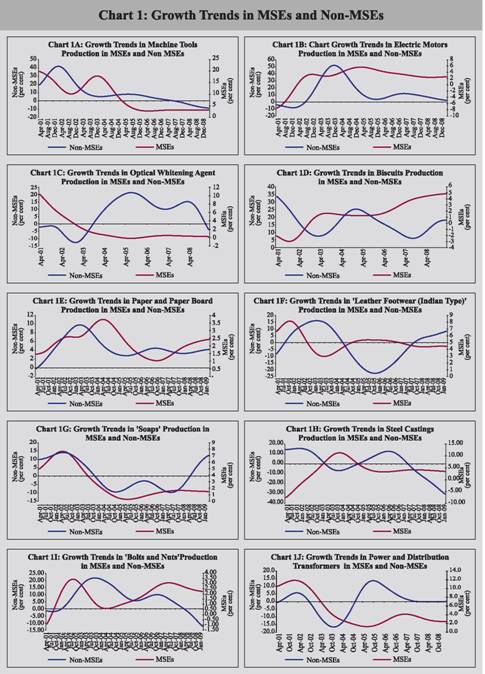
Trends in MSE and Non-MSE production in the above-mentioned ten items is tracked since April 2001. The trends show that MSE production generally follows the business cycles in the Non-MSEs given the fact that a number of MSEs serve as ancillaries to large industries. However, it is observed that in most cases where MSEs possess a dominating market share - which could be policy facilitated such as reservation of the particular item for MSE - they tend to define the leads in business cycles. Thus, in products like ‘electric motors’, ‘biscuits’, ‘leather footwear (Indian type)’, ‘bolts and nuts’ and ‘power and distribution transformers’, MSEs have recorded leads in cycles (Chart 1A to 1J).
MSEs producing ‘Optical Whitening Agent’, ‘Soaps’, ‘Leather footwear (Indian Type)’ and ‘Power and Distribution Transformers’ have recorded almost flat growth since 2006 (2004 in case of ‘Optical Whitening Agent’). On the other hand, ‘biscuits’, ‘electric motors’, ‘paper and paper board’ and ‘bolts and nuts’ production in MSEs has in general registered higher growth than the corresponding Non-MSE units.
As against the industrial downturn of 2000-01 where production in ‘electric motors’, ‘leather footwear’, ‘soaps’ and ‘power and distribution transformers’ accelerated or showed early revival, during the current economic slowdown, production declined sharply in almost all the ten items in both MSEs and Non-MSEs. In MSEs, the decline was sharper in ‘optical whitening agent’, ‘soaps’, ‘paper and paper board’ and ‘bolts and nuts’. However, except for ‘bolts and nuts’, MSEs do not have a major market share in any of these items. However, the decline in Non-MSEs was relatively sharper than MSEs (Table 3). Among the Non-MSEs, the fall was comparatively steeper in case of ‘steel castings’, ‘machine tools’, ‘bolts and nuts’ and ‘power and distribution transformers’.
Table 3: Growth Rate in Select MSE and Non-MSE Industries |
(Per cent) |
|
MSEs |
Non-MSEs |
Industry Groups |
2007-08
over
2006-07 |
2008-09
over
2007-08 |
2007-08
over 2006-07 |
2008-09
over 2007-08 |
Steel Castings |
4.1 |
-5.1 |
-8.1 |
-29.1 |
Machine Tools |
3.2 |
-5.5 |
-1.4 |
-14.6 |
Electric Motors |
2.7 |
-6.2 |
9.8 |
-4.5 |
Optical Whitening Agent |
0.4 |
-8.1 |
13.1 |
-3.1 |
Biscuits |
4.1 |
-4.2 |
7.4 |
5.7 |
Paper and Paper Board |
1.7 |
-6.3 |
3.4 |
-4.9 |
Leather Footwear (Indian Type) |
4.5 |
-4.4 |
0.6 |
-2.6 |
Soaps |
1.6 |
-7.0 |
-7.0 |
-1.9 |
Bolts and Nuts |
2.9 |
-6.2 |
4.0 |
-14.1 |
Power and Distribution Transformers |
3.6 |
-6.1 |
0.4 |
-8.4 |
In the absence of complete data on the registered and un-registered small scale sector and in order to assess the comparative performance of MSEs (MII) and Non-MSEs (NMII), an attempt has been made to create a composite production index on MSEs and Non-MSEs as outlined earlier.
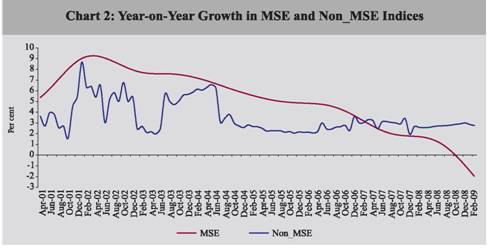
The trends in the index suggest that MSEs recorded a quick recovery in growth from the economic slowdown in 2001-02 but lost the momentum after 2004:M06, when economy was on the path of a broad based recovery (Chart 2,
Table 4). Non-MSE production growth for the similar products has been declining secularly over the period under analysis. Therefore, it appears that the sample of 10 companies, where MSEs are present, could not take the benefit of the robust demand undergone through by the economy during 2004-06. This suggests that the MSEs (at least for the ten items under review) are currently present in the segment of the economy that has low income elasticity.
Table 4: Annual Growth Rates in MSE and Non_MSE Indices |
(Per cent) |
|
MSE |
Non MSE |
2001-02 |
4.4 |
7.6 |
2002-03 |
4.6 |
8.4 |
2003-04 |
4.7 |
7.4 |
2004-05 |
3.8 |
6.2 |
2005-06 |
2.2 |
5.0 |
2006-07 |
2.8 |
4.1 |
2007-08 |
2.8 |
2.0 |
2008-09 |
2.6 |
0.1 |
The subdued growth in MSEs post mid-2004 may be attributed to increased competition. Within the overall declining growth, the MSEs have recorded poor performance than the Non-MSEs between 2004Q1 and 2006Q4. However, since 2007Q1, when industrial growth is sluggish, MSEs have been registering higher growth than Non-MSEs. During 2008-09, production declined substantially in all the ten items in both MSEs and Non-MSEs, but the fall was sharper in case of Non-MSEs, showing relative resilience of MSEs in the event of external shocks. Relative resilience of MSEs during early pickup and fast reduction in demand could be due to the fact that MSEs generally remained outside the existing labour laws and are willing to operate on thin margins vis-à-vis their larger counterparts. Another probable reason could be that during the downturns in industrial growth cycle, government expenditure on social workfare programs like the ‘Gram Swarozgar Yojana’ or the ‘National Rural Employment Guarantee Scheme’ increases which may help to sustain demand for low valued consumer non-durables.
III. The Model and Estimation
Next, we estimate the impact of different factors, domestic and global on MSE production by fitting a least squares regression model. Each of the variables were seasonally adjusted and made difference stationary. Cross correlations suggest that there is a strong contemporaneous relationship between the variables suggesting in turn that the following simple linear regression may be used.
We estimate the following equation
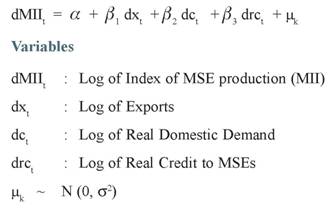 |
IV. Results
The least square regression results indicate that on the demand side, exports and domestic demand exert a positive influence on MSE production (Table 5). The coefficient on domestic demand is almost 8 times the coefficient on exports indicating the significance of domestic market as a source of demand for small scale industry. The significance of exports is a pointer to the fact that the small scale sector is not immune from global shocks (such as the US financial crisis) which trickle into the economy through moderation of export demand. In many cases, micro and small enterprises serve as ancillaries to large industries and hence when the latter is affected due to wider exposure to global markets, the demand for small industry is also impacted.
Table 5: Results of the Least Squares Regression |
Dependent Variable : DMII |
Method : Least Squares |
Sample (adjusted) : 2001Q1 2008Q3 |
Included observations : 26 after adjustments |
Variable |
Coefficient |
Std. Error |
t-Statistic |
Prob. |
Constant |
-0.01 |
0.00 |
-3.53 |
0.00 |
DRC |
-0.16 |
0.04 |
-4.46 |
0.00 |
DC |
0.17 |
0.06 |
2.85 |
0.01 |
DX |
0.02 |
0.02 |
1.06 |
0.03 |
R-squared |
0.579 |
Mean dependent var |
- |
0.008 |
Adjusted R-squared |
0.522 |
S.D. dependent var |
|
0.007 |
S.E. of regression |
0.005 |
Akaike info criterion |
-7.47 |
|
Sum squared resid |
0.001 |
Schwarz criterion |
|
-7.279 |
Log likelihood |
101.146 |
F-statistic |
|
10.114 |
Durbin-Watson stat |
1.916 |
Prob(F-statistic) |
|
0.000 |
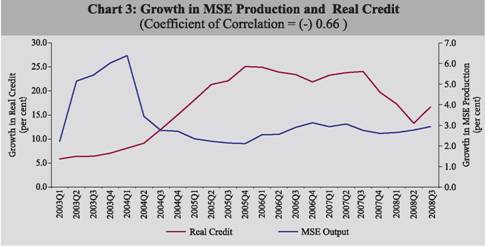
Surprisingly, credit to MSEs has been found to be very significant, although the sign on the coefficient has been contrary to expectations. The growth in MSE output also shows a significant negative correlation with real credit (nominal credit to MSEs deflated by GDP deflator). This phenomenon may be explained by the fact that during buoyant business climate, MSEs generally manage their working capital requirements from their internal cash flows with reduced dependence on bank credit as was the case in India till 2004:Q1. Chart 3 confirms this relationship. Credit to MSEs has taken off from 2004Q3 onwards which coincides with the time when MSE output started sagging. The slowdown in growth in MSE output after 2004:Q1 forced them to access bank credit on drying up of internal cash generation to sustain productive activities. This behavior was quite consistent with the credit view literature, where lower levels of business activity force small firms to access credit market. It is also important to point out that the demand for credit during this period (2004-2006) was accommodated by adequate supply as financial market conditions eased by that time and prime lending rates had relaxed (Table 6). Credit flows to MSEs have fallen again since Q3:2007 following the monetary tightening cycle (Chart 3). During this period, interest rates have diverged for small firms and other businesses. Between March 2006 and 2008, while the BPLR, the rate at which credit is lent to MSEs, had gone up by over 200 basis points, the average lending rate had just gone up by 15 basis points. This implies that along with availability of finance, MSEs are also sensitive about the price of credit.
Table 6: Lending Rates |
(Per cent) |
|
SBI_PLR |
Average Lending Rate |
2002 |
11.50 |
13.66 |
2003 |
10.75 |
13.31 |
2004 |
10.25 |
12.96 |
2005 |
10.25 |
12.57 |
2006 |
10.25 |
11.97 |
2007 |
12.25 |
12.57 |
2008 |
12.25 |
12.12 |
In order to assert the importance of price of credit for MSEs, another least squares regression1 was run with real credit as dependant variable and risk premia as independent variable.
Table 7: OLS estimates with Real Credit as Dependant variable |
Dependent Variable: DRC |
Method: Least Squares |
Sample (adjusted): 2002Q1 2007Q2 |
Included observations: 22 after adjustments |
Convergence achieved after 33 iterations |
Backcast: 2001Q3 2001Q4 |
Variable |
Coefficient |
Std. Error |
t-Statistic |
Prob. |
C |
-0.0475 |
0.0053 |
-8.9216 |
8.0222 |
DDRP |
-0.0024 |
0.0061 |
-0.3933 |
0.6989 |
AR(2) |
-0.3026 |
0.1499 |
-2.0184 |
0.0596 |
SAR(2) |
0.5765 |
0.0935 |
6.1645 |
1.0387 |
MA(2) |
-0.2558 |
0.2684 |
-0.9529 |
0.3539 |
R-squared |
0.4741 |
Mean dependent var |
|
-0.0391 |
Adjusted R-squared |
0.3503 |
S.D. dependent var |
|
0.0161 |
S.E. of regression |
0.0129 |
Akaike info criterion |
|
-5.6548 |
Sum squared resid |
0.0029 |
Schwarz criterion |
|
-5.4069 |
Log likelihood |
67.2032 |
F-statistic |
|
3.8316 |
Durbin-Watson stat |
1.7670 |
Prob(F-statistic) |
|
0.0213 |
The coefficient on credit risk had a negative sign indicating that as risk premium (DDRP) goes up, MSEs demand less credit (Table 7). Truly, credit offtake by MSEs started off post 2004 when risk premia in the market had softened from 5.9 per cent in 2003 to 5.3 per cent in 2004. However, the coefficient was not statistically significant.
V. Slowdown and Impact on Employment in MSE
Given the non-availability and lags in data in case of MSEs, it is very difficult to judge the impact of industrial slowdown on employment and social welfare. As per the latest available information from the Ministry of MSME, employment growth in MSMEs has decelerated drastically from 4.3 per cent in 2006-07 to 2.9 per cent in 2007-08, despite over 18.0 per cent rise in value of output during the year (17.5 growth in 2006-07). The corresponding rise in growth in labour productivity works out to be 15.5 per cent in 2007-08 as compared to a growth of 12.6 per cent in the previous year. Thus prima facie, it appears that MSMEs responded to the crisis by downsizing labour cost and adopting more capital intensive production techniques which became relatively cheaper with the easing monetary conditions. Given that MSE business cycles generally lag behind Non-MSEs, it may be conjectured that MSEs are yet to face the worst.
The industry-wise intensity of the impact can be assessed to some extent from the past experiences such as the industrial slowdown of 2001-02. On comparison of data generated from NSSO 51st (1994-95) and 55th (2000-01) survey rounds of un-organised sector enterprises, it has been found that employment in MSEs declined by 1.1 per cent to 2,96,610 in 2000-01 over 1994-95. Employment suffered heavily in ‘leather and leather industries’ (-20.9 per cent), ‘paper and paper products’ (-54.7 per cent) and ‘wood and wood products’ (-3.2 per cent) between the two survey periods (Table 8). Noticeably, during the industrial downturn of 2001-02, ‘leather and leather products’ and ‘wood and wood products’ were the worst performers in terms of growth. Hence, it may be seen that the experience at the overall industry level is resonated at the small industry level too.
Table 8: Growth in Employment between 51st and 55th Round Surveys |
(in ’00 of persons employed) |
|
NIC Code |
2000-01 |
1994-95 |
Growth : 2000-01 over 1994-95 |
Manufacture of food and
beverages |
15 |
68,420 |
66,085 |
3.5 |
Manufacture of textiles |
17 |
61,813 |
36,491 |
69.4 |
Manufacture of Textile Products |
18 |
45,730 |
30,491 |
50.0 |
Leather and Leather Products |
19 |
3,991 |
5,047 |
-20.9 |
Wood and Wood Products |
20 |
52,217 |
53,927 |
-3.2 |
Paper and Paper Products |
21 |
2,519 |
5,564 |
-54.7 |
Chemicals and Chemical Products |
24 |
5,679 |
3,514 |
61.6 |
Rubber, Plastics and Petroleum
Products |
25 |
3,334 |
3,272 |
1.9 |
Non-metallic Mineral Products |
26 |
30,503 |
25,949 |
17.5 |
Basic metals and Alloys |
27 |
1,322 |
1,235 |
7.0 |
Metal products and Parts |
28 |
15,858 |
12,865 |
23.3 |
Machinery and Equipment |
29 |
4,920 |
4,317 |
14.0 |
Source: National Sample Survey Organisation. |
However while drawing these conclusions, it is important to remember that this drastic decline in employment in these sectors during the five year period from 1995 and 2000 may show the cumulative effect of loss of competitiveness and gradual sickening of enterprises. Since the survey was conducted as at end period of the industrial slowdown of 2000-01, this would also carry the effect of industrial slowdown to some extent.
During the current spate of industrial slowdown, growth has been affected in ‘food products’, ‘non-metallic mineral products’, ‘chemical and chemical products’, ‘wood and wood products’ and ‘leather and leather products. As in the previous slowdown periods, the downturn in the Non-MSEs may be spilling over to MSEs, more particularly in these few industries. According to the NSSO 62nd round survey on un-organised manufacturing, 2005-06, these industrial sectors accounted for 17.4 per cent, 6.4 per cent, 2.4 per cent, 11.1 per cent and 1.3 per cent of total employment in the un-organised sector, respectively. Going by the earlier experience, employment may suffer in all these sectors in MSEs, and more particularly the ‘food products’ and ‘wood and wood products’ which employ the bulk of the unskilled un-organised labour with no social security.
The extent of the social and economic deprivation among MSEs, particularly during an industrial slowdown like the current one may be gauged from the fact that over 92 per cent of the MSEs do not have access to any kind of assistance such as institutional and non-institutional loans, subsidy, machinery and equipment, marketing and training (NSSO, 62nd Round Survey, 2005-06). The impact of the crisis may percolate not only in terms of job cut but also in terms of wage cuts. According to Global Wage Report 2008/09, the global crisis is likely to lead to painful cuts in wages of millions of workers. It predicts that the slow or negative economic growth, combined with highly volatile food prices will erode the real wages of the world’s 15 billion wage earners. The possible effects on wages in the current crisis may be gauged from the fact that between the years 1995 and 2007, for each one percent decline in GDP per capita, wages fell by 1.55 percentage point.
According to the official estimates (Ministry of Labour), the global economic crisis has claimed 0.5 million jobs in India in the 2008-09 Q3. The most affected have been the export oriented units where employment has declined on the average by 1.13 per cent. However, given that the un-organised sector has no access to social security schemes like the Employees State Insurance (ESI), the impact may be wider than the official estimates.
The analysis enumerated above has to be read together with some unavoidable caveat. The trends in small scale versus large scale production as obtained from the current analysis is restricted to the ten identified items and may not be representative of the small scale or un-organised sector as a whole. Further, many of these items may be enjoying reservation status and hence may have considerable impact on the analysis. Small enterprises may be tapping several non-bank sources (such as NBFCs) for their working capital and the bank credit may not be exhaustive reflection of the source of finance for these enterprises.
VI. Summary
-
The cyclical slowdown in the industry which began in 2007-08Q1, retarded the pace of growth of both MSEs and Non-MSEs.
-
However, MSEs have recorded relatively better performance than Non-MSEs during the current slowdown period at least in the ten items under review suggesting that these products are mostly of low value.
-
Trend analysis shows that MSEs recorded a fast recovery from the industrial slowdown of 2000-02 but receeded post mid-2004 primarily due to rise in competition.
-
Least squares regression analysis shows that both domestic and external demand bear a statistically significant influence on MSE output. The impact of domestic demand is comparatively stronger.
-
Credit to MSEs has a significant impact on the industry. However, the sign was opposite to theoretical expectations. This may be because MSEs depend on bank credit during periods of business stress when sales and output have been affected and there is no sufficient internal resource generation.
-
Alongwith availability of finance, the MSEs are sensitive towards the price of credit.
-
The moderation in growth in MSEs is likely to have a dampening impact on employment in MSEs as documented in the past. NSSO 56th Round (July 2000 – June 2001) survey on the un-organised sector has shown that employment suffered heavily in ‘leather and leather industries’ (-20.9 per cent), ‘paper and paper products’ (-54.7 per cent) and ‘wood and wood products’ (-3.2 per cent) during the five year period spanning 1996-2001 which includes the industrial slowdown period of 2000-01.
-
During the current slowdown period, employment may suffer in the ‘food products’ and ‘wood and wood products’ which have recorded substantial decline in output and employ the bulk of the unskilled un-organised labour with no social security.
VII. Policy Suggestions
It has been observed from the current analysis that the crest and trough of MSE business cycle may not always coincide with the overall industry. Hence, policies on MSEs’ credit and technology needs to be customized by the nature of the MSE business cycle, nature of its product and markets it caters to.
The significance of credit at appropriate rates for the industry, as has already been illustrated, is beyond debate. In recent times, the Reserve Bank of India has taken adequate steps not only to induce banks to lend to small enterprises but also to address the bias between different scales of enterprises among the group. But while the Central Bank can induce banks to lend, actual lending of resources by banks would be subject to commercial principles. So what is important is to make such small business propositions commercially attractive. Venture capital and private equity funds have been traditionally known to finance such new business ideas. Financial support and propitious investment climate to encourage the growth of such institutions may go a long way in aiding the growth of small enterprises.
Further, more innovative policy making is needed in order to tide over the risk averse behaviour of lending by banks and non-bank institutions towards MSEs during periods of crisis such as the current one. In this connection, it is appropriate to mention the policy approach of US Federal Reserve. As a part of its three-pronged approach to infuse liquidity into the financial markets and alleviate risk averseness in the aftermath of the US financial crisis, the US Federal Reserve in a joint effort with the US Treasury has agreed to provide three-year term loans to investors against AAA-rated securities backed by recently originated consumers and small business loans. In other words, loans to small businesses were backed by sovereign guarantees. This policy measure assumes importance in the light of the fact that small industries in the US constitute over 95 per cent of the total number
of firms2 .
Some thought should also be commandeered into evolving alternative resource mobilization avenues such as the separate stock exchange for small industries on the lines of London based Alternative Investment Market. More competitive export oriented small industries may be encouraged to list initially.
Last but not the least, given the dependence of such a large number of employees on the sector, adequate attention needs to be channeled into social security cover for the employees. However, this requires extensive cost-benefit analysis from the point of view of the small firm. Any new policy towards social security should not come down heavily on the cost of the firm which may otherwise induce it to cut down labour employed and adopt capital intensive technology.
VIII. Conclusions
The Micro and Small enterprises have recorded considerable progress post liberalization as the growth of the economy moved into a higher trajectory. Innovative policies like cluster wise benefits and export incentives have enabled some of these enterprises to capitalize on the opportunities extended by the gradual opening up of the economy. However, it has to be accepted that many of the policies meant to facilitate its growth are still largely in their preamble. And this is partly traceable to the particular characterization of the small enterprise including the information asymmetries which deters its access to finance, lack of faith in their business models, non-access to discounts on raw material purchases which is available to large enterprises on bulk purchases and so on. However, if the sector has to build resilience to global shocks and economic slowdown like the current one, such impediments have to be addressed on a war footing. The Micro and Small enterprises constitute the largest private sector in India after agriculture which is providing social succor and empowerment to the weaker sections of the society like women and backward classes. Given these attributes, adequate attention needs to be channeled into areas of finance, social security and marketing of goods for small industries.
References
-
Bernanke, B.S., (2009): ‘The Crisis and the Policy Response’, Speech at Stamp Lectures, London School of Economics, London, January.
-
National Sample Survey Organisation (2002): ‘Un-organised Manufacturing Sector in India – Input, Output and Value Added, 56th Round, 2000-01’, November.
-
National Sample Survey Organisation (2007): ‘Operational Characteristics of Un-organised Manufacturing Enterprises in India, 62nd Round, 2005-06’, December.
-
Saluja, M. R. (2004): ‘Industrial Statistics in India, Sources, Limitations and Data Gaps, India Development Foundation.
* Kum. Indrani Manna is Research Officer with the Financial Markets and Monitoring Unit, Department of Economic Analysis and Policy. Views are personal and not of the institution she belongs to.
The author is thankful to Shri Rajib Das, Director, Division of Industrial and Services Studies for his valuable suggestions.
1 It would be appropriate to see the long run co-integrating relationship between MSE output, MSE credit growth and risk premia. However, such analysis is taboo due to non-uniformity in the order of these variables, While MSE output and MSE credit growth are I(1), risk premia is I(2). Hence, only the short run relationship is tested here with simple OLS using order adjusted variables.
2 In US definition, a small industry is one which employs less than 500 employees. |
 IST,
IST,