 IST,
IST,
VI. Price Situation
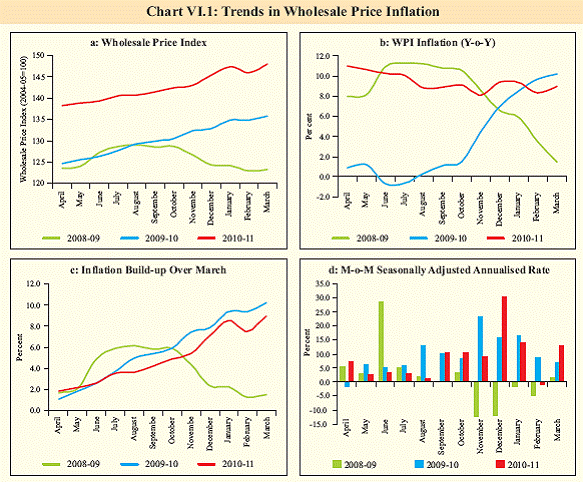
The pick-up in inflation in March 2011 was contrary to general expectations of a gradual softening, as conditioned by decelerating industrial growth as well as sustained anti-inflationary monetary actions. Inflation in 2011-12 is likely to moderate slowly but remain above comfort levels reflecting strong persistence. The transmission of rising international commodity prices and spillover from past food and some wage price inflation in some sectors has been visible in recent months. Despite moderating food inflation, headline inflation remained firm in Q4 of 2010-11 as generalised price pressures emerged with rising input costs feeding into manufactured products inflation. Risks to inflation in 2011-12 have amplified from an uncertain outlook on international commodity prices, incomplete pass-through to domestic prices and possibility of prices of food, fuel, minerals and metals staying firm. Policy interventions are necessary to address near-term and structural imbalances to bring down inflation on an enduring basis. Inflation stays elevated, while underlying drivers change VI.1 Inflation remained elevated during 2010- 11 driven by both supply shocks as well as gradual generalisation of price pressures. Though food inflation moderated during Q4 of 2010-11, increase in prices of a number of manufactured products and freely priced fuel items kept headline inflation firm at above the comfort level. Growing uncertainties in international commodity markets, continuing pressure on global commodity prices from newer shocks like the geo political tensions in MENA region and supply disruptions in primary commodity producing countries suggest increasing risks to the expected moderation in inflation. These developments necessitated continuation of the anti-inflationary monetary policy stance to control inflation and anchor inflationary expectations. VI.2 One notable feature of inflation path during 2010-11 has been the repeated occurrence of a number of supply shocks which kept headline inflation stubbornly high. Subsequently, price pressures have passed through to other sectors in terms of significant increases in input prices. This was manifested in the secular increase in the Wholesale Price Index (WPI), prominently in the second half. The financial year build-up in inflation, however, has been lower than what was experienced during the previous year while month over month seasonally adjusted changes remained significantly positive indicating continued price pressures (Chart VI.1). Return of global inflation adds to spillover risks VI.3 The global inflation environment exhibited some turnaround in recent months as increase in commodity prices spilled over to headline inflation. Most inflation targeting countries currently have headline inflation above the target zone. In the case of advanced economies, core inflation remains subdued indicating absence of significant pressures from domestic demand. The rise in inflation, however, has been more pronounced in the EMEs. The higher share of food and fuel in total consumption basket explains a relatively larger influence of upward movement of international commodity prices on inflation in the EMEs.
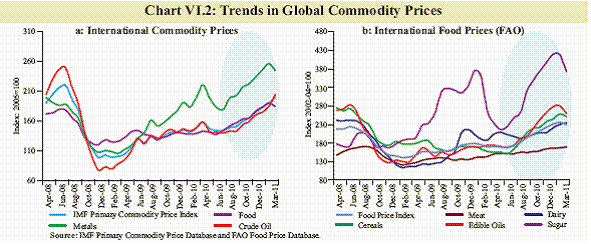
VI.4 Most advanced economies continue to pursue accommodative monetary policies as core inflation remains subdued along with high unemployment levels and sluggish recovery in economic growth. However, as commodity price inflation feeds into inflation expectations and generalised inflation, advanced economies could face the policy challenge of containing inflation, even when recovery remains fragile. Even though the policy rates in most advanced economies remain very low, central banks have started to recognise the risks from commodity price spikes to inflation. The European Central Bank, on April 07, 2011, increased its policy rate by 25 basis points to 1.25 per cent after keeping it unchanged at historically low levels for almost two years (Table VI.1). Emerging market economies have continued with hikes in key policy rates as the balance of policy focus needed to be shifted towards controlling inflation. Given the recent increase in global commodity prices and its potential impact on generalised inflation going forward, EMEs are likely to persist with anti-inflationary monetary policy stance. Among the major EMEs, most central banks raised their key policy rates during the last quarter of 2010-11. Risks from increase in global commodity prices to domestic inflation have increased significantly VI.5 Global commodity prices have exhibited uptrend since mid-2010 fuelled by fresh concerns over supply prospects (Chart VI.2). Political tensions in the MENA region significantly impacted crude oil prices and average crude oil prices were at US$ 114.4 per barrel for UK Brent category and US$ 108.6 per barrel for Dubai Fateh category during March 2011. Accordingly, the Indian basket crude oil price averaged US$110.4 per barrel in March 2011 given the composition of the Indian basket. Despite ample spare capacity with some OPEC member countries, crude oil prices are likely to remain at higher levels during 2011-12 as compared with 2010-11 given the political uncertainties and tight demand-supply balance.
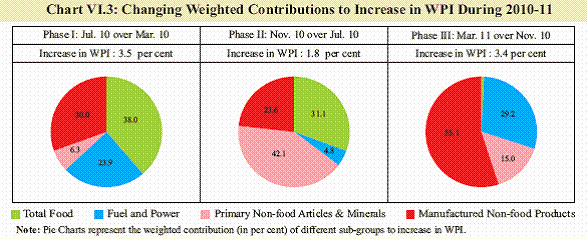
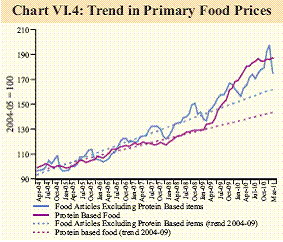
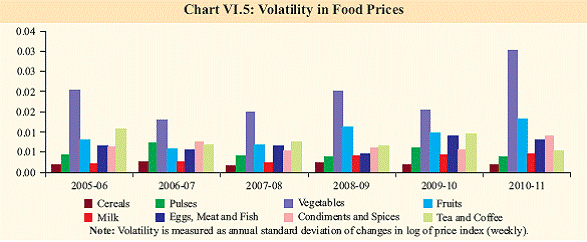
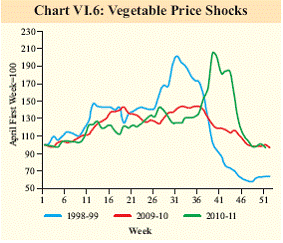
VI.6 The FAO food price index, which in March 2011 recorded its historical peak since inception in 1990, showed some moderation in April 2011. However, the FAO, in its latest World Food Outlook, indicated that increasing diversion to cash crops could limit the production capacity of individual food crops to respond to high prices adequately to levels that could be sufficient to alleviate market tightness. Against this backdrop, the FAO has warned that “…consumers may have little choice but to pay higher prices for their food. With the pressure on world prices of most commodities not abating, the international community must remain vigilant against further supply shocks in 2011 and be prepared”. Apart from oil and food, metals and other primary products have also exhibited considerable increase in prices. VI.7 The earthquake in Japan in March 2011 led to a temporary decline in commodity prices reflecting fears of a slowdown in demand from Japan. However, prices have rebounded since then and are likely to witness further pressure, especially in the case of metals and industrial raw materials as reconstruction efforts could lead to increased demand. Pass-through of global inflation has been divergent and incomplete VI.8 The impact of changes in global commodity prices on domestic inflation is dependent on a number of factors. In the case of fuel, where India is highly import dependent, any increase in global prices has a significant impact on domestic inflation. In the case of food items, the magnitude of the spillover impact of rising global food prices has been minimal, especially in the case of cereals (Table VI.2). This is mostly because prices of most food items in India are predominantly affected by domestic supply conditions as well as government’s pricing policy rather than global trends. However, increasing global prices rule out the possibility of using imports as a measure for food price control. In the case of primary input commodities like cotton and rubber, global price changes have been largely reflected in Indian prices too, adding cost pressure on manufactured products. Thus, global price increases have both direct and indirect impact on domestic inflation conditions. Sources of price pressures shift over three distinct phases VI.9 The nature of the inflation during 2010-11, in terms of contribution of specific groups items in the WPI basket, changed over three phases (Chart VI.3). In the first phase (between March and July 2010), food group had the highest contribution to the increase in WPI. In the second phase (between July and November 2010), primary non-food articles, particularly fibres like raw cotton, raw jute and raw silk had the dominant contribution. The major source of price pressures in the third phase (between November 2010 and March 2011) came from manufactured non-food products reflecting generalisation of inflation. Food inflation declines but price levels remain firm reflecting structural imbalances VI.10 The decline in primary food articles inflation on the expected lines with the arrival of fresh crops in the market and government interventions in the market has been one comfort factor during Q4 of 2010-11. The government has announced a number of measures in the Union Budget for 2011-12 to address the structural imbalances, especially in the case of protein-rich food items. These measures, however, could yield results only in the medium term. VI.11 The decline in food inflation has not brought about significant decline in price levels as the prices are ruling at higher levels above the past trend, more so in the case of protein-rich items (Chart VI.4). These point towards weak supply response to both growing demand and increasing prices, leading to growing imbalances. Supply-augmenting measures as well as policies to create more efficient markets are critical to contain inflation at moderate levels. Such structural rigidities, unless addressed adequately, could lead to a situation of persistent high level of inflation which could constrain the efficacy of monetary policy. Volatility in food prices has increased VI.12 Along with increase in inflation in food articles in recent months, there has also been increase in volatility in food prices, especially in the case of vegetables, fruits and condiments and spices (Chart VI.5). Increased volatility in prices can influence inflation expectations adversely and also lead to inefficiencies in resource allocation as economic agents would find it difficult to distinguish between absolute and relative price changes. Also, the spike in vegetable prices during 2010-11 has been almost of the same magnitude as the previous shock of 1998-99 (Chart VI.6). However, the decline in prices following the spike has been lower during the current spike.
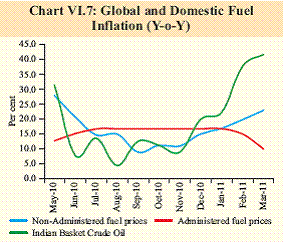
Partial pass-through of global fuel inflation increases medium-term risks VI.13 Recent significant increases in international crude oil and coal prices have added further pressure on domestic inflation. In recent period, the full impact of increase in global oil price increases has been muted by the administered price intervention as the passthrough of increase in crude prices has been low in the items under administered prices (Chart VI.7). Empirical estimates show that every 10 per cent increase in global crude prices, if fully passed through to domestic prices, could have a direct impact of 1 percentage point increase in overall WPI inflation and the total impact could be about 2 percentage points over time as input cost increases translate to higher output prices across sectors.
VI.14 Administered price interventions could keep inflation low in the near-term, but with significant risks to medium-term inflation through the impact on higher fiscal deficit apart from its impact on efficiency concerns. Even in the case of freely priced products, the passthrough remains incomplete. As against an increase of 42 per cent y-o-y in March 2011 in the Indian basket crude oil price, the domestic price of non-administered fuels increased by only 23 per cent. This indicates that prices could increase going forward as domestic inflation catch up with global trends. It is also important to make further progress in deregulation of fuel prices, particularly diesel. This would enable demand to adjust appropriately to price signals, reduce fiscal deficit and make the inflation number more representative of underlying inflation conditions.
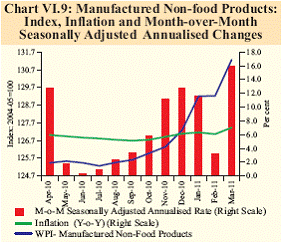
Contribution of non-food manufactured products to overall inflation increased with rising input cost pressures VI.15 The underlying contributors to inflation have changed in recent months. The non-food manufactured products group, broadly seen as an indicator of demand-side and generalised pressures on inflation, has contributed to much of the high inflation in recent months even as the contribution of food inflation declined (Chart VI. 8). Fuel group and non-food primary articles also continue to contribute significantly to overall inflation, pointing towards persisting and generalised inflationary pressures. VI.16 After exhibiting a near stable path up to the third quarter of 2010-11, manufactured nonfood products inflation rose significantly in the last quarter with both the price index and monthover- month seasonally adjusted changes indicating significant build-up in price pressures (Chart VI.9). Currently, the y-o-y inflation in this group is at 7.0 per cent (March 2011), much above the medium term trend. The increasing price pressures in this category, is important consideration in the conduct of monetary policy. It indicates the spillover of supply shocks to generalised inflation through the input cost channel as well as the inflation expectations. It can also impact the core inflation through wage price spiral.
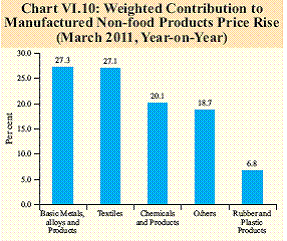
VI.17 The rise in non-food manufacturing prices reflects the presence of significant pricing power. In terms of the contribution to increase in non-food manufactured prices during 2010-11, about three fourth of the increase was driven by three major groups, viz., textiles, chemicals and metals (Chart VI.10). Significant input cost pressures were visible in these groups as the global prices of cotton, petroleum products and metals had increased. The producers’ ability to pass on these increases to output prices point towards prevalence of favourable demand conditions. VI.18 During the last quarter of 2010-11, a number of product groups under the manufactured products group witnessed increase in prices (Table VI.3). As a result, the increase in price level during Q4 of 2010-11 was predominantly driven by non-food manufacturing, reflecting rise in input costs feeding into product prices.
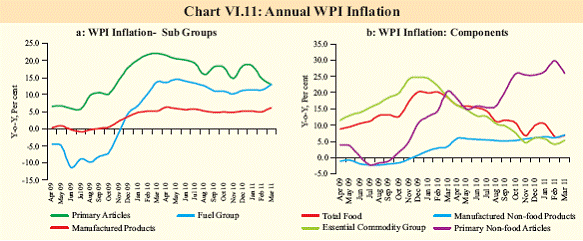
VI.19 The divergence in inflation between major sub-groups in WPI continues to be large with primary articles and ‘fuel and power’ group exhibiting significantly high inflation as compared to manufactured products group (Chart VI.11.a). Manufactured products inflation, however, increased in recent months. Within the fuel group, coal prices increased significantly in March 2011, while increase in freely priced petroleum products prices led to higher inflation for mineral oils. Electricity price increases remained moderate during 2010-11 but given the increases in coal and mineral oils prices, electricity prices are likely to rise in the near-term. Among the major components, non-food primary articles inflation remained high driving input cost prices for manufactured products. Decline in food inflation has, however, been reflected in significant moderation in essential commodities inflation (Chart VI.11b).
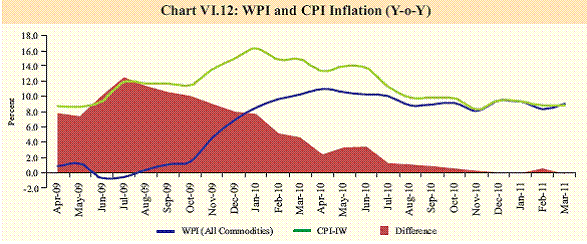
CPI and WPI inflation converge, but elevated levels point to generalised price pressures VI.20 Inflation, as measured by various consumer price indices, moderated from the double digit levels, reaching single digit after more than a year, but still remain high. Various measures of inflation remained in the range of 8.8-9.1 per cent in March 2011. While the extent of divergence between WPI and CPI inflation narrowed significantly as food prices moderated, both remained elevated indicating generalisation of price pressures (Chart VI.12). Inflation path remains sticky and risks abound VI.21 With the likelihood of spillovers from past inflation and sustained impulses transmitting from rising global commodity prices, the inflation path for 2011-12 looks sticky, characterised by nominal rigidities. Nominal rigidities mean that nominal prices of goods and wages are temporarily rigid due to price-setting behaviour and may not decline immediately after a rise in inflation. Headline inflation could remain elevated in the first half of 2011-12 before declining gradually in the second half but remain above the Reserve Bank’s comfort level.
VI.22 Even as food inflation moderated, it has not led price levels returning to the trend, suggesting that even if the transient shocks abate price pressures may remain. The measures of the Government announced in the Union Budget, in terms of supply augmentation in key protein rich items can only be expected to yield results in the medium term. The impact of global price spurts in the case of crude oil on domestic inflation has so far been partial on account of incomplete pass-through reflecting administrative price interventions. However, if global prices remain firm at high levels, such measures could lead to a significant fiscal burden and thereby feed into medium term inflation. Allowing further pass-through especially for coal, where global prices have increased significantly, and electricity, where input costs have escalated, while raising inflation in the near term will help in mediumterm inflation management through the impact on both demand adjustment and a favourable impact on the fiscal position. VI.23 The spillover of supply-side led inflation on to generalised inflation appears to have been faster in recent months through input cost escalation. Given the risk that high and persistent inflation in itself could jeopardize the growth momentum and inclusive growth, policy has to focus on anchoring inflationary expectations as well as limiting the secondround impact of supply shocks. |
||||||||||||||||||||||||||||||||||||||||||||||||||||||||||||||||||||||||||||||||||||||||||||||||||||||||||||||||||||||||||||||||||||||||||||||||||||||||||||||||||||||||||||||||||||||||||||||||||||||||||||||||||||
পৃষ্ঠাটো শেহতীয়া আপডেট কৰা তাৰিখ:


