
Determinants of Household Saving Portfolio in India: Evidence from Survey Data - আরবিআই - Reserve Bank of India


Determinants of Household Saving Portfolio in India: Evidence from Survey Data
| Chaitali Bhowmick, Sapna Goel, Amit Kumar, Rekha Misra, Preetika and Satyananda Sahoo* Received: January 4, 2024 Faced with a large and growing compendium of saving and investment alternatives, the household portfolio rebalancing is underway in India. Contributing to the contemporary literature, the paper explores the role of both household-specific and time-varying macroeconomic factors in the diversification of household portfolios. Based on the ‘Aspirational India’ database of the Consumer Pyramids Household Survey (CPHS), the analysis using multinomial logit model finds that the likelihood of owning financial assets and maintaining a well-diversified portfolio rises with an increase in household income. The paper underscores the significant role played by financial inclusion presented in terms of bank branch penetration, especially in rural areas. The results also suggest that lower unemployment rate increases the likelihood of household savings across all financial asset categories. As the CPHS data is qualitative and does not comprise any quantitative information on asset allocation, the paper’s scope is limited to studying the decision-making process related to households’ saving portfolio in a binary choice regression framework. JEL Classification: C13, C25, D14, G11 Keywords: Household, financial savings, portfolio choice, socio-economic attributes, logit regression Introduction Saving is a key macroeconomic variable as it is a source of finance for the productive sectors in an economy. In India, households are the largest net savers and financiers for the rest of the economic sectors, contributing more than three-fifths of the gross savings. The COVID-19 pandemic provided a transient impetus to household savings in India, due to a combination of curtailed consumption expenditure and precautionary motive of saving and households have drawn upon these accumulated savings in the subsequent period with the normalisation of economic activity. The net household financial savings in India rose from 7.7 per cent of GDP in 2019-20 to 11.7 per cent in 2020-21 (the pandemic year) and then moderated to 5.3 per cent of GDP in 2022-231. These dynamics warrant a closer look at household’s savings and investment behaviour. This also assumes significance as faced with a large and growing compendium of saving and investment alternatives, the household portfolio rebalancing is underway in India along with a growing formalisation of household finance. This has implications at the micro level for wealth creation, post-retirement safety and precautionary needs, and at the macro level, for facilitating an effective transmission of the monetary policy by integrating the population under the ambit of the formal financial system. The household saving behaviour and portfolio choice in the context of emerging market and developing economies (EMDEs) has drawn the attention of researchers in recent years, with a number of studies appearing in the context of India, China, and few other developing countries from the middle and eastern Europe (Agarwal et al., 2022; Rampal and Biswas, 2022; Yang, 2022; Li et al, 2020; Badarinza et al., 2019; RBI, 2017; Chu et al, 2017; Beckmann, 2013; and Temel, 2013). Household savings in the context of the pandemic was also analysed by some studies (Ren and Zheng, 2023; Zeng et al., 2022; Zhang et al., 2022; and Yue et al., 2020). The existing body of literature on household savings primarily includes cross-sectional analysis which may not appropriately capture the influence of macroeconomic factors on household portfolio choices. This paper seeks to fill this gap and contribute to the literature with reference to India in various ways. The study analyses the determinants of household savings in India for the period – 2014 to 2022 using ‘Aspirational India’ database of Consumer Pyramids Household Survey data from the Centre for Monitoring Indian Economy (CPHS-CMIE). The CPHS-CMIE database provides granular and detailed information regarding various aspects of income, consumption, saving and socio-economic characteristics of more than 2 lakh and 5 lakh households, respectively, in the rural and urban areas. The large panel of households from CPHS allows for an analysis encompassing household-specific determinants, such as age, gender, occupation as well as various time-varying macroeconomic factors, such as inflation, interest rate and unemployment rate enabling us to draw robust inferences on the subject. The paper focuses on assessing both the stock of financial assets in households’ portfolios and saving/investment in financial assets. To identify the characteristics relevant for a household to own financial assets in its portfolio, multinomial logit regressions are estimated to understand the household-level determinants. The findings highlight the positive role played by household income, age-dependency ratio and access to financial services. The analysis of the effects of various macroeconomic variables on household saving in financial assets suggests that higher inflation and lower unemployment increase the likelihood of savings by the households across all financial asset categories. Furthermore, the analysis propounds the role of financial inclusion to encourage households towards disciplined saving habits and prudent portfolio choices. The paper is organised as follows: Section II presents a review of the relevant literature with an emphasis on identifying the literature gap and incremental contribution of our paper. Section III highlights the stylised facts relating to household savings in India. Section IV outlines the characteristics of the CPHS Aspirational India database and discusses regrouping of variables to render them suitable for our empirical analysis. Section V discusses the methodology used in the study followed by a detailed account of summary statistics and findings from the econometric analysis in sections VI and VII, respectively. Section VIII concludes the paper. The contemporary understanding of saving and consumption behaviour is rooted in a combination of two pioneering theories – Milton Friedman’s Permanent Income Hypothesis (Friedman, 1957) and Modigliani’s Life-Cycle Hypothesis (LCH) (Ando and Modigliani, 1963). This framework examines savings behaviour across an individual’s lifetime as a utility-maximising choice of consumers to smoothen consumption over their lifespan. The LCH suggests that individuals tend to save more during their working years to secure their retirement, resulting in the emergence of a hump-shaped curve in savings pattern over one’s lifetime. With regard to household portfolio choice, seminal theories were propounded by Markowitz (1952), Merton (1969) and Samuelson (1969). The classical theory of households’ portfolio selection posits that households’ optimal proportion of risky assets is determined by excess return on risky assets, variance of return on risky assets, and relative risk aversion, implying that a household would own some risky assets whenever there are positive excess returns. In practice, however, households tend to allocate only a nominal portion of their overall portfolio to riskier assets because they face fixed costs of participation (Vissing-Jørgensen, 2003). Even in advanced economies (AEs), a significantly large proportion of population does not invest in risky assets at all (Mankiw and Zeldes, 1991; Bertaut and Starr, 2000; Arrondel et al., 2016; and Gurugai et al., 2018). Furthermore, households, while holding risky assets tend to have undiversified portfolios, and could be slow learners (Campbell, 2006, 2018). Many researchers have tried to explain this puzzle, incorporating additional factors including labour income (Heaton and Lucas, 2000; and Elmendorf and Kimball, 2000), entry costs to hold risky assets (Haliassos and Bertaut, 1995), liquidity constraints (Cocco, 2005; and Yao and Zhang, 2005), structural factors, such as financial literacy (Guiso and Jappeli, 2005; and Van Rooij et al., 2011) and tax system (Dammon et al., 2004; and Gomes and Michaelides, 2004). Additionally, both theory and empirics show significant variations in the household savings pattern across countries, time, and portfolio allocations because of unique constraints and circumstances related to demographics, income levels, financial literacy, behavioural aspects, risks and uncertainties (Deaton, 1989; Badarinza et al., 2019; and Lu et al., 2020). II.1 Household Characteristics Numerous studies have delved empirically into the saving and investment decisions of households drawing from the existing theories emphasising on various micro and macro aspects (Beckmann et al., 2013; and Duasa and Yusof, 2013). One of the consistent findings has been that age exerts a significant positive influence on savings rate albeit at the older age the savings start retreating. While younger people are likely to save more in riskier assets, several studies also present contradictory findings which show that people do not tend to reduce their equity holding with age (Bertaut and Starr, 2000; and Ameriks and Zeldes, 2004). Higher income levels are associated with a greater inclination to save albeit with diminishing marginal propensity to save beyond a certain level (Becker, 2014). Notably, there is a positive correlation between income and investment choices, with higher income households displaying a greater likelihood to allocate a larger part of their wealth to riskier financial assets (Bertaut and Starr, 2000; and Beckmann et al., 2013). There exists some ambiguity with respect to the relationship of wealth with household savings. A strand of literature suggests an inverse relationship between the two positing that an increase in wealth is perceived as a rise in the permanent income by households, and hence, would lead to a rise in the consumption expenditure and a fall in savings (Alves and Cardoso, 2010). Conversely, Rampal and Biswas (2022) and Badarinza et al. (2019) assert that wealthier households are associated with a consistent participation in financial markets. Another key variable is the size of the households. Size of the households displays a negative relationship with savings in financial assets. Also, highly leveraged households tend to allocate less savings to financial assets (Ögren, 2018). The effect of gender is, however, mixed in the literature. While Rampal and Biswas (2022) render that female-headed households are less likely to hold more assets, Temel (2013) claims the said variable to be insignificant. Besides, while some studies infer that a female-dominated household is more likely to save and invest in riskier assets (Bertaut and Starr, 2000), a few research studies conclude that females are more risk-averse in nature (Jianakoplos and Bernasek, 1998; and Becker, 2014). The availability, accessibility and affordability of financial services and digital penetration are expected to play a crucial role in fostering saving habits among households by facilitating increased access to banking services, especially in the EMDEs. With a higher penetration of bank branches, bank deposits by households are expected to increase (Kumar, 2013; and Behera and Raut, 2019). Internet use and proximity to banks in rural areas are seen to enhance household savings in rural China (Zeng et al., 2023). In contrast, mobile payment adoption, resulting in improved risk sharing and lowering of credit constraint, led to a dampening impact on household savings in China (Zhao and Zhao, 2022). II.2 Macroeconomic Characteristics The role of macroeconomic factors affecting household’s saving decision is also probed in the literature. The impact of inflation on savings is found to be ambiguous. Jongwanich (2010) and Coulibaly and Diaby (2013) establish a positive relationship between the two; under their hypothesis – households increase their savings at times of uncertainty, particularly the precautionary savings. Yang (2023) finds that households with a higher vulnerability to inflation initially increase their holdings of risky assets, particularly equity assets, in pursuit of higher gains. An India-specific study by Agarwal et al. (2021) concludes that a decrease in inflationary expectations steers portfolio rebalancing of households with high liquid savings and a move away from risky investment towards bank deposits. On the other hand, a negative relation between inflation and savings has been seen for Indian households by Iyer (2018) and for Pakistan by Al Oshaibat and Majali (2016). Similarly, the impact of unemployment on saving decisions is inconclusive. Han (2009) asserts that unemployment leads to dissavings, because then households finance their expenses out of their savings. Mody et al. (2012) in dissonance suggest that increasing unemployment rate, a proxy for labour income uncertainty for a household, is significantly associated with the higher savings rate. In accordance with this positive relationship, a recent study finds that in the US, an increase in COVID-19 vaccination led to a fall in unemployment rate, and hence, a lowering of household savings (Zheng and Ren, 2023). The effect of housing prices is contentious. While Sheiner (1995) and Moriizumi (2003) conclude that an increase in the housing prices leads to an acceleration in savings, especially among the young, Li et al. (2013) establish a negative relationship between these two variables. An increase in interest rate raises the opportunity cost of consumption, thereby leading to substitution of consumption with household savings (Abou, 2014; Khan et al., 2014; and Chinyere, 2015). Similarly, a positive relationship is established between saving rate and the size and liquidity of stock market (Enisan and Olufisayo, 2009). However, Ganguly (2014) establishes that for emerging economies, the factors relating to stock market do not have a significant impact on the savings in the economy. The existing literature on household savings and portfolio choices primarily includes cross-sectional studies focusing on the socio-economic and behavioural factors. However, there is a dearth of literature in the Indian context examining the impact of macroeconomic factors on household portfolio choices. This paper aims to fill the gap and provides an understanding of the household saving and investment behaviour by studying both household-specific determinants as well as time-varying macroeconomic factors in unison. Drawing from the discussion in economic theory regarding the household portfolio choice, the objectives of the paper are twofold – (i) examining the micro factors determining household’s ownership of financial assets to gauge the increasing financialisation of their savings along with their attitude towards riskiness in their portfolios; and (ii) studying the influence of macro factors on households’ financial assets savings behaviour. We examine household-specific factors by pooling data from multiple years which adds to the robustness of the findings. Section III Households contribute more than three-fifths of the gross savings in India (Chart 1a). Although households save predominantly in physical assets2, over time, there has been a slow and gradual shift towards financial assets though with some reversal since the pandemic (Chart 1b). Households can hold their financial savings in assorted instruments, such as currency, bank deposits, debt securities, stocks, mutual funds, insurance and pension funds. A compositional shift has been observed in the Indian households’ portfolio of financial savings. The share of deposits with banks has declined over time, with a concomitant increase in insurance and mutual fund products, pointing to a growing appetite for alternative financial instruments (Prakash et al., 2020). Furthermore, pandemic induced risks, such as precariousness, scarcity in employment opportunities and health-related exigencies, were hedged by holding surplus financial funds (Prakash et al., 2023). 
A cross-country comparison reveals widely divergent household saving behaviour. In the US, close to two-thirds of the household savings are in the form of financial assets which got accentuated during the pandemic. In contrast, a major proportion of saving is invested in physical assets in the UK and Canada. A shift towards financial savings was observed during the pandemic as households turned from being net borrowers to net lenders of financial funds in both the countries. Specifically, in Canada, there was a massive build-up of pandemic savings which was used by the households to pay off some of their non-mortgage debt3. In Turkey, households show a preference for non-financial assets, as the share of their physical savings is substantially high, which remained unaffected even during the pandemic (Chart 2). 
In the case of India, despite an increase in annual savings (i.e., flow) in financial assets, outstanding asset holding (i.e., stock) observed from various rounds of the All-India Debt and Investment Survey (AIDIS) exhibits preponderance of physical assets, as a disproportionately higher share of households’ wealth is still allocated towards physical assets such as land and buildings4. As per the latest round of the survey conducted in 2018-19, about 91.5 per cent and 86.9 per cent of total assets were held in real estate in rural and urban areas, respectively. Financial assets (like deposits, shares), on the other hand, account for only 4.5 per cent of the overall assets in rural areas and 9.2 per cent in urban areas (Chart 3). Taken together, non-financial assets account for around 90 per cent of the total assets of the Indian households, which is similar to that of the average household asset allocation pattern observed in EMDEs5. Households’ wealth allocation choices are different in AEs with a share of real estate and durable assets being on average 20 percentage points lower than EMDEs. In economies like the US and Germany, the holding of real estate by households at 44 per cent and 37 per cent, respectively, account for much lower fractions of the total wealth (Badarinza et al., 2016; and 2019). 
On the liabilities side, India has made significant progress towards formalisation of the credit market as the share of credit from non-institutional sources in total outstanding credit has declined significantly over the decades (Chart 4). The COVID-19 pandemic prompted a massive accumulation of household savings across countries due to a combination of factors, such as restriction on spending, precautionary motive of saving, and fiscal stimuli. The stock of excess savings which is the cumulative sum of these flows during a given episode generated during the pandemic started to decline since 2022 (IMF, 2023). This is evident in the low print of net household financial savings in India at 5.3 per cent of GDP in 2022-23. 
The ‘Aspirational India’ subset of CPHS-CMIE survey for the period from 2014 to 2022 have been used for the study. The data provide information on household perceptions, decisions, and sentiments regarding ownership of assets, investments and borrowings. The survey data are presented in intervals of four month referred to as waves with each household being surveyed every sixteen weeks. The structure, therefore, translates to three waves per year – January-April, May-August, and September-December and the same has been retained for the study period. Notwithstanding the widespread coverage of the CPHS-CMIE survey making it apt for an econometric study at micro level, concerns have been expressed over the surveys’ urban bias and affluence bias which in turn may influence empirical findings by over-emphasising financialisation among households than reality (Desai, 2020; Pais et al., 2021; and Somanchi, 2021) and these concerns may apply to the present study as well. The analysis presented in this study centres around three broad categories, namely, possession of financial assets and liabilities by households; household’s socioeconomic, regional and demographic attributes; and macroeconomic variables expected to affect household saving and portfolio decisions. Akin to the heuristic approach of classification in CPHS-CMIE, the groups have been condensed further for brevity and compactness. IV.1 Asset Classification The ‘Aspirational India’ data report qualitative responses in binary form for each household regarding whether it possesses, has purchased recently or plans to purchase a particular type of asset. For our objectives of the study, the exhaustive list of financial assets available to a household (Table A1) has been segregated into various financial asset categories, to classify households with holding of at least one of those asset categories vis-à-vis those with no financial asset ownership. Households invest in a diversified set of instruments to achieve wealth creation and maximisation of gains. There is no ubiquitous metric to define and classify the choice of instruments by the households. Therefore, households are classified on the basis of assets using a combination of standard market risk-return definition, involving interest rate market sensitivity, and volatility in returns as well as behavioural aspects, such as loss aversion, consensus bias, and familiarity tendencies (Campbell, 2006; Gomes, 2020; and Peon and Antelo, 2021). Deposits are still the most preferred instrument of saving among households (Suraj et al., 2024) and form Category 1 of financial assets. Provident funds, National Saving Certificate (NSC) bonds, Kisan Vikas Patra (KVP) are primarily long-term investments and less-liquid as compared to bank deposits. These have been clubbed together to form Category 2 for our analysis. Category 3 assets include risky assets such as equity and mutual funds which are subject to market fluctuations (Table 1). A household possessing at least one of the assets mentioned in, say Safe but Less Liquid category apart from Safe and Traditional instruments will accordingly be counted under Safe but Less Liquid asset type and not under Safe and Traditional category. Similarly, a household holding both Safe and Traditional and Safe but Less Liquid assets will be labelled Risky if it owns one or more risky assets. In this way, diversification and preference for riskiness has been measured across categories and not within categories. IV.2 Socio-economic Groupings from CPHS In CPHS, households are classified in various groups based on their socioeconomic attributes such as age, gender, education, etc. The detailed groups across diverse household characteristics so created, have been presented in the Annex (Tables A2 to A4) with a brief overview in this sub-section. The categorisation according to age distribution of the household members has been simplified based on the nature of dependency; the gender distribution groups have been consolidated into three main heads, and occupations sharing similar skill sets and comparable remuneration scales, have been bunched together (Table 2).
In addition, a proxy variable related to household’s access to financial services – Bank Branch Penetration – capturing a household’s proximity to bank branches has been constructed with a view that it is likely to affect the saving behaviour of a household as discussed in the extant literature. It has been computed using the quarterly Basic Statistical Returns (BSR) of the Reserve Bank of India. IV.3 Variables for Macroeconomic Analysis The impact of several macroeconomic factors has also been examined on household financial savings and investment practices using the enlisted variables (Table 3). All the monthly and/or quarterly macro variables have been suitably aligned with the survey’s timeframe. The consumer price index (CPI), separately for rural and urban areas, has been used as the measure of inflation. Furthermore, it is assumed that households’ expectation regarding future inflation7 is guided by the principle of adaptive expectations and, accordingly, two-period lagged inflation is used as a proxy for inflation expectations. Average interest rate on term deposits offered by five major banks in India is used as a representative deposit rate. The month-over-month change in the daily closing values of the Bombay Stock Exchange (BSE) Sensex has been used as a representative of stock market returns. The deposit rate and stock market returns are available only at the national level. To encapsulate the returns from physical assets which might affect a household’s decision of investing in financial assets, the house price index (HPI), reflecting the quarterly price fluctuations in the real estate sector for major cities across the country, has been considered. Values for individual states have been obtained by averaging the data pertaining to cities within each respective state. Additionally, a household’s assessment of their current financial situation compared to a year ago has been captured through ‘Family Perception’ variable from the CPHS survey. The question signifies whether the household perceives an improvement or deterioration in their current financial condition as compared to the previous year. Accordingly, the variable takes values ‘0’, ‘1’ and ‘2’ for gauging worsening, no change or an improvement in own financial conditions, respectively. This household-specific variable has been categorically included in the macro model to ascertain whether one’s own financial well-being could be instrumental in affecting the decision to choose portfolio in that particular period as against the overall ownership of assets. Given a host of attributes affecting household’s investment choices, the data are first examined using the non-parametric approach of cluster analysis by employing hierarchical clustering technique, a powerful unsupervised data-mining tool, to group unlabelled datasets into clusters. With the limited knowledge available from the binary responses, the cluster analysis has been preferred over discriminant analysis8 to give a structure to the data and identify the groups to which a household can belong to on the basis of the known features of each household. We demonstrate simple descriptive statistics regarding the distribution of household portfolios across various attributes, such as age, gender and income identified in the clustering exercise. The proportion of households belonging to each type of asset group, classified in the previous section, has been mapped against each of these attributes, which offers an overview of the dynamics of portfolio diversification. Furthering the insights drawn from the summary statistics, causal relationships have been established through coherent econometric analysis. The qualitative nature of the dependent variable restricts the econometric framework to binary choice models. To gauge the factors determining household’s ownership of any financial instrument along with the riskiness in their portfolio choices, based on their intrinsic attributes, the dependent variable assumes four alternatives classified in ascending order of riskiness associated with the corresponding portfolio. To accommodate multiple categories, a multinomial logit model – a generalised linear model for estimating the probabilities for the m categories of a qualitative dependent variable – is used for the purpose of estimation for the period 2014 to 2019 as specified below:. 
where Yk refers to the asset category classified as the following: households with No ownership of any financial asset assume value 0; holdings in only Category 1 financial assets are considered as the base category9 which takes value 1; holdings in at least one of the Category 2 financial assets assume value 2; and holding in at least one Category 3 financial asset assumes value 3; Xi denote the vector of independent variables comprising the range of attributes determining the decision (described in Section IV.2). A household may shift from one category to another during five years, say, within occupation, gender or age groups because of the changing family structure. Therefore, to maintain consistency and to minimise such category transitions by a household, the third wave of each of the pre-pandemic years from 2014 to 2019 has been considered for this model. The robustness of the results is ensured with similar model using the first wave data. Finally, the effects of macroeconomic variables on household financial saving decision are studied using the categories as defined in Table 1. A random effects multinomial panel logit regression for the period spanning 2016 to 2022 has been estimated where macroeconomic variables of monthly and quarterly frequency are mapped with their overlapping waves. While macroeconomic variables are of primary interest in this regression (Table 3), we suitably control for a few important household-specific characteristics, such as age and income level, along with time fixed effects. The results of the regression remain robust in an alternative ordered panel logit specification. VI.1 Clustering Analysis The pre-pandemic year of 2019 has been considered for the clustering analysis. The three corresponding waves have been converted into annual frequency and households with non-response in any wave have been filtered out. The resultant pooled data set of 12,784 households for 2019 have then been categorised as discussed in Section IV and converted into a binary matrix. Using hierarchical clustering technique on the created matrix, the iterative process of knowledge discovery was used to classify discrete groups based on behavioural aspects, such that there is maximum homogeneity within a cluster and maximum heterogeneity between clusters. Consequently, the exercise ensued six clusters of which three were dominated by rural region (Clusters 1, 4 and 6), while the remaining three had a majority share of urban households (Clusters 2, 3 and 5) (Table 4). For instance, Cluster 1 was a group of rural households with income below ₹2.5 lakh with smaller family size and education level of less than matriculation, particularly engaged as daily wage earners or as farmers. This group had savings in Category 1 and Category 2 assets and primarily used borrowings for non-productive purposes. In contrast, families from urban region dominated cohort 2 with relatively higher proportion of households in the income bracket of ₹2.5 lakh to ₹5 lakh, bigger family size, better education levels and belonging primarily to entrepreneurial and salaried class. Despite majority investing in Category 2 assets, their risk appetite was the highest among all groups with 20 per cent of the households investing in Category 3 assets. In totality, all the households in each cluster invested in physical assets (either gold or real estate) and had majorly gender-balanced composition. Rural households in general, had invested in Category 1 assets and borrowed to finance their non-productive needs. Urban households, on the other hand, with a large proportion in the income bracket of ₹5 lakh and above, higher educational qualifications and steady earnings too had a higher share in Category 1 and Category 2 assets, but they preferred diversifying their portfolio towards market-oriented Category 3 options as well. VI.2 Descriptive Analysis This sub-section delves deeper into the descriptive trends from the survey data, incorporating the element of time dimension across various distinguishing features of the households discussed earlier. As already elucidated, household portfolio can range from not investing in any instrument at all to incorporating a diverse mix of various instruments. In this regard, the transition in financial savings behaviour of households over time has been summarised in Table 5. Using a balanced panel comprising 794 and 3,054 households in rural and urban regions, respectively, Table 5 reports how many of these households have shifted their investment categories – None, Category 1, Category 2 and Category 3, on average, during 2016 to 2022. In both rural and urban regions, majority of the households did not invest in any asset in the period under consideration. In rural segment, of the households investing in Category 2 assets, on average, while 15.4 per cent did not change their investment away from the category, 6.0 per cent reverted to no investment at all. Across categories, only a negligible proportion of households moved towards the market-oriented Category 3. In urban areas, while the transition pattern was like their rural contemporaries, an increased proportion of households expanded to the relatively volatile Category 3 assets over time. Shifting focus towards the stock of financial assets of the households, the Venn diagram underscores the growing risk appetite among households with 17.8 per cent households investing in at least one of the risky assets in 2022 as compared to 15.7 per cent in 2019. Furthermore, a slightly higher proportion of households diversified their portfolio towards all the three categories of financial instruments in 2022 (Chart 5). By truncating the nine possible portfolio choices into three – only Category 1; at least one asset in Category 2; and at least one asset in Category 3, we discuss the trends about investment preferences and risk strategies among various household groupings, based on only those households that own any financial asset in 2014, 2019 and 2022 (Charts 6 and 7). The three chosen years encapsulate both the pre- and post-COVID-19 behaviour11. 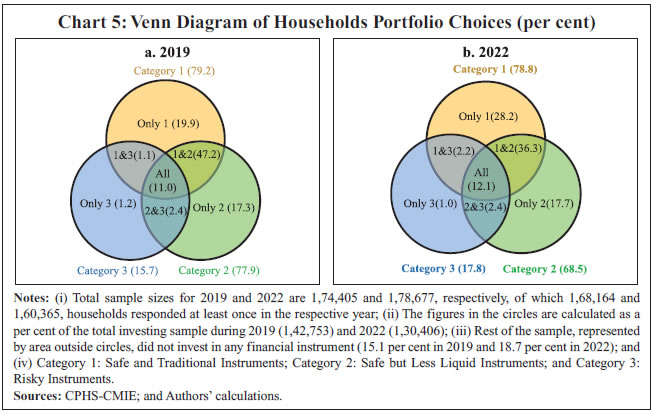

Based on the age-group classification, the CPHS sample exhibits the prevalence of the LCH proposition mentioned earlier as most of the households characterised as Grown-ups and Balanced households with no seniors have been the major investors in any asset. The two groups chiefly comprise individuals aged between 26 and 60 years. Conversely, investment is lower when households are dominated either by young or old. Furthermore, delving into the risk appetites, Balanced and Non-dependent households held varied financial assets relative to Dependent households which chose safer options (Chart 6). 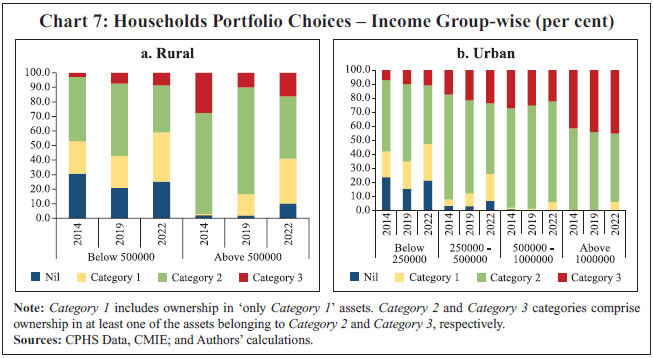
One of the key factors influencing saving/investing choices is the income of the household. Low-income households with income below ₹2.5 lakh consistently favoured Category 1 and Category 2 instruments. On the other hand, higher income groups with income above ₹2.5 lakh had proclivity towards more diversified investment strategies. Expectedly, the proportion of households with investment in all the three asset classes was the highest in case of households with income above ₹10 lakh (above ₹5 lakh in rural areas) (Chart 7). Despite the heterogeneity, households revealed several common patterns. First, there was a noticeable decline in households choosing not to invest (Nil) except during the pandemic-induced vagaries, suggesting an increasing proclivity towards financial instruments. This could possibly be driven by rising income levels, increased financial literacy due to educational initiatives12, technological advancements, such as proliferation of smartphones and improved internet connectivity, fintech innovations and regulatory reforms aimed at safeguarding investors’ interests. Second, households showed transition towards diversified financial portfolios in 2022 with an increase in the share of riskier investments as compared to 2019. Third, urban households displayed a greater inclination to adapt their investment choices in response to dynamic economic conditions, whereas rural households maintained a relatively conservative approach. Section VII In view of the discrete characteristics, urban and rural households are studied separately in the paper. The regression (specified in Section V) is estimated using three different specifications. The first model includes household-specific attributes directly available from the CPHS data. The second model controls for the impact of bank branch penetration, while the third model considers all the variables together. In addition, state fixed effects and time fixed effects have been controlled in all the models. The objective of the analysis is to scrutinise the factors determining household’s decision of owning financial instruments according to their risk bearing abilities, based on their intrinsic attributes (described in Sections IV.1 and IV.2). The dependent variable assumes four alternatives classified in an ascending order of riskiness associated with the corresponding portfolio (None, Category 1, Category 2, and Category 3) as elaborated in Section IV.1. The base category is the ownership in Category 1 financial assets, and all the coefficients are reported as relative risk ratios (RRR)13. Although the results in the case of urban and rural regions present a largely similar picture, a few variables stand out (Tables 6a and 6b). To illustrate, with an increase in the household income, there is a shift towards owning Categories 2 and 3 financial assets. Male dominated households are significantly less likely to own Categories 2 and 3 financial assets vis-à-vis gender balanced households. Relative to the age balanced households, dependent households are less likely to own Categories 2 and 3 financial instruments and probably limit to Category 1 options. Regarding household size, while larger rural households appear to prefer assets in both Category 2 and Category 3, their urban counterparts prefer Category 2 instruments only. The nature of occupation is suggestive of the income certainty and, therefore has statistically significant influence on households’ decision on their financial portfolios. Business and Salaried Class, Entrepreneurial Class, White-collar Salaried Workers and Retired/Aged typically belonging to higher income classes show proclivity towards risky Category 3 financial assets in both rural and urban areas. Furthermore, leveraged households have the highest probability of owning Category 3 financial assets. Bank branch penetration has a significant role in increasing financial savings in both the regions with the impact being more pronounced in rural areas. It is observed that bank branch penetration increases the probability of investment in both Category 2 and Category 3 assets in rural areas and only in Category 3 assets in the urban areas. The results remained robust across the model specification using the first wave data (Tables A6a and A6b). Our second empirical analysis centres around the impact of macroeconomic factors on the trajectory of household’s financial savings and portfolio decisions. Investment in financial assets can be influenced by various yardsticks, including riskiness, desired frequency of instalments pertaining to certain instruments, extant habits and norms. Multinomial panel logit regression model has been estimated with not saved in any financial instrument (None) during the period as the reference category. The integration of the additional household-specific controls, such as age category and income level enhance the overall fit of the model as reflected in the higher loglikelihood value. The impact of COVID-19 on household’s savings behaviour has been controlled for in the model. Additionally, time dummies have been included in all the models to account for the impact of other time-varying factors not explicitly controlled for in our models (Table 7). The odds of a household investing in any financial asset increases with an increase in inflation. The returns in the stock market, represented by BSE Sensex returns, do not exhibit any statistically significant relationship with Category 3 assets comprising listed shares and mutual fund investment. Extant literature posits that the relationship between stock market return and stock market investment is not straightforward (Campbell, 2006; and Ganguly, 2014). BSE returns, however, significantly induce investments away from assets in Category 1 in urban areas highlighting that some substitution may be underway. The interest rate on term deposits exhibits a strong positive relation with assets falling under Category 1 consisting of term deposits in bank and post office. Akin to the findings in Han (2009), with an increase in unemployment rate, households are likely to drain their existing savings pool broadly across all asset categories to smoothen consumption in times of stress. Similarly, with a decrease in unemployment rate, the likelihood of households investing across all asset categories increases. The significant coefficient of the Family Perception variable points to the household’s optimism of an improved financial position which leads to increasing probability of investment across all the asset categories during a given period, particularly the riskier avenues. The statistical significance of COVID-19 dummy highlights that during the pandemic, households are likely to have shifted towards safer assets belonging to Category 1 and Category 2 from no investment in any financial instrument. The findings remained consistent in the alternative ordered logit model specification (Table A5). Household saving – the mainstay of overall gross savings in India – is the primary source of finance for the rest of the economy. Amid an expanding array of portfolio options, the paper seeks to contribute to the contemporary literature by exploring the role of both household-specific and time-varying macroeconomic factors in diversification of household portfolios towards riskier financial instruments. The ‘Aspirational India’ data of CPHS-CMIE survey, which includes detailed socioeconomic attributes of a large household sample, have been condensed into various overlapping asset categories. Portfolio diversification is examined across these asset groupings than within individual categories. The empirical findings suggest that as the household income rises, the likelihood of owning financial assets and maintaining a well-diversified portfolio also rises. Additionally, the analysis reveals that occupation groups associated with higher job security and regular income streams tend to have higher saving propensity and a greater proportion of risky financial assets in their portfolios. The paper also underscores the significant role played by financial inclusion presented in terms of bank branch penetration, especially in the rural areas. Regarding macroeconomic factors, savings in all the financial asset categories are likely to increase during the period of lower unemployment due to increased household income. Of the three types of returns on instruments considered in the paper, interest rate on term deposits positively influences saving decision in assets like fixed deposits and post office savings, while house prices have a mixed impact across rural and urban areas on savings in financial assets. Stock market returns have a statistically insignificant relationship with the investment decisions in equity and mutual funds. Despite the insightful findings that the paper offers, it may be noted that the underlying survey data only provide qualitative information regarding ownership of assets. In the absence of any quantitative information on amounts held in a particular asset, the empirical analysis is restricted to only studying the decision-making process related to households’ saving portfolio in the binary choice regression framework. References Abou El-Seoud, M. S. (2014). The Effect of Interest Rate, Inflation Rate, and GDP on National Savings Rate. Global Journal of Economics and Management Perspective, 3(3), 1-7. Agarwal, S., Chua, Y. H., Ghosh, P., & Song, C. (2022). Inflation Expectations of Households and Portfolio Rebalancing: Evidence from Inflation Targeting in India. SSRN Working Paper. Agarwal, S., Driscoll, J. C., Gabaix, X., & Laibson, D. (2007). The Age of Reason: Financial Decisions Over the Lifecycle. Al Oshaibat, S., & Majali, A. (2016). The Relationship between Stock Returns and Each of Inflation, Interest Rates, Share Liquidity and Remittances of Workers in the Amman Stock Exchange. Journal of Internet Banking and Commerce, 21(2), 1. Alves, N., & Cardoso, F. (2010). Household Saving In Portugal: Micro and Macroeconomic Evidence. Economic Bulletin. Banco de Portugal (Winter), 47-67. Ameriks, J., & Zeldes, S. P. (2004). How Do Portfolio Shares Vary with Age. GSB Columbia University and the NBER. Ando, A., & Modigliani, F. (1963). The “Life Cycle” Hypothesis of Saving: Aggregate Implications and Tests. The American Economic Review, 53(1), 55-84. Arrondel, L., Bartiloro, L., Fessler, P., Lindner, P., Mathä, T., Rampazzi, C., Savignac, F., Schmidt T., Schürz, M., & Vermeulen, P. (2016). How do Households Allocate their Assets? Stylised Facts from the Eurosystem Household Finance and Consumption Survey. International Journal of Central Banking, vol. 12(2), pages 129-220, June. Badarinza, C., Balasubramaniam, V., & Ramadorai, T. (2019). The Household Finance Landscape in Emerging Economies. Annual Review of Financial Economics, 11, 109-129. Badarinza, C., Campbell, J. Y., & Ramadorai, T. (2016). International Comparative Household Finance. Annual Review of Economics, 8, 111-144. Becker, G. (2014). The Portfolio Structure of German Households: A Multinomial Fractional Response Approach with Unobserved Heterogeneity (no. 74). University of Tübingen Working Papers in Economics and Finance. Beckmann, E., Hake, M., & Urvova, J. (2013). Determinants of Households’ Savings in Central, Eastern and Southeastern Europe. Focus on European Economic Integration Q, 3(13), 8-29. Behera, H., & Raut, D. (2019). Bank Deposits: Underlying Dynamics. Reserve Bank of India, May 2019. Bertaut, C. C., & Starr, M. (2000). Household Portfolios in the United States. SSRN Working Paper. Bertaut, C. C., & Haliassos, M. (1995). Why Do So Few Hold Stocks? The Economic Journal, 105(432). Campbell, J.Y. (2018). Financial Decisions and Markets: A Course in Asset Pricing. Princeton University Press, 2018. Campbell, J. Y. (2006). Household Finance. The Journal of Finance, 61(4), 1553-1604. Centre for Monitoring Indian Economy. (2014-2022). Consumer Pyramids Household Survey. Retrieved from https://consumerpyramidsdx.cmie.com/kommon/bin/sr.php?kall=wchangeserv&rrurl=aspirationalindiadx. Chinyere, U. C. (2015). Impact of Interest Rate on Savings on the Nigeria’s Economy (1981-2013). Journal of Policy and Development Studies, 9(3), 73-82. Cocco, J. F. (2005). Portfolio Choice in the Presence Of Housing. The Review of Financial Studies, 18(2), 535-567. Coulibaly, S., & Diaby, M. (2013). Solow in Transition: Macro and Micro Determinants of Savings in Armenia. World Bank Policy Research Working Paper. Dammon, R. M., Spatt, C. S., & Zhang, H. H. (2004). Optimal Asset Location and Allocation with Taxable and Tax‐Deferred Investing. The Journal of Finance, 59(3), 999-1037. Deaton, A. (1989). Saving In Developing Countries: Theory and Review. The World Bank Economic Review, 3(suppl_1), 61-96. Duasa, J., & Yusof, S. A. (2013). Determinants of Risk Tolerance on Financial Asset Ownership: A Case of Malaysia. International Journal of Business and Society, 14(1), 1. Elmendorf, D. W., & Kimball, M. S. (2000). Taxation of Labour Income and the Demand for Risky Assets. International Economic Review, 41(3), 801-832. Enisan, A. A., & Olufisayo, A. O. (2009). Stock Market Development and Economic Growth: Evidence from Seven Sub-Sahara African Countries. Journal of Economics and Business, 61(2), 162-171. Ganguly, S. (2014). Does Stock Market Development affect The Savings Rate? An Econometric Analysis with Cross-Country Data. Garlappi, L., Uppal, R., & Wang, T. (2007). Portfolio Selection with Parameter and Model Uncertainty: A Multi-Prior Approach. The Review of Financial Studies, 20(1), 41-81. Gomes, F. (2020). Portfolio Choice over the Life Cycle: A Survey. Annual Review of Financial Economics, 12, 277-304. Gomes, F., & Michaelides, A. (2004). A Human Capital Explanation for an Asset Allocation Puzzle? Guiso, L., & Jappelli, T. (2005). Awareness and Stock Market Participation. Review of Finance, 9(4), 537-567. Han, C. K. (2009). Unemployment, Financial Hardship, and Savings in Individual Development Accounts. Journal of Poverty, 13(1), 74-95. Heaton, J., & Lucas, D. (2000). Portfolio Choice in the Presence of Background Risk. The Economic Journal, 110(460), 1-26. Horioka, C. Y., & Wan, J. (2007). The Determinants of Household Saving In China: A Dynamic Panel Analysis of Provincial Data. Journal of Money, Credit and Banking, 39(8), 2077-2096. IMF (2023). World Economic Outlook, October 2023: Navigating Global Divergences. International Monetary Fund. Iyer, M. (2018). Nature of Relationship between Inflation and Savings: Evidence from India. NMIMS Journal of Economics and Public Policy, 46-60. Jianakoplos, N. A., & Bernasek, A. (1998). Are Women More Risk Averse? Economic Inquiry, 36(4), 620-630. Jongwanich, J. (2010). The Determinants of Household and Private Savings in Thailand. Applied Economics, 42(8), 965-976. Khan, I. H., Khilji, B. A., & Abbas, G. (2014). Relationship between Interest Rate and Household’s Savings in Pakistan. International Journal of Innovation and Scientific Research, 12(1), 295-308. Kumar, N. (2013). Financial Inclusion and Its Determinants: Evidence from India. Journal of Financial Economic Policy, 5(1), 4-19. Li, J., Li, Q., & Wei, X. (2020). Financial Literacy, Household Portfolio Choice and Investment Return. Pacific-Basin Finance Journal, 62, 101370. Li, S., Whalley, J., & Zhao, X. (2013). Housing Price and Household Savings Rates: Evidence from China. Journal of Chinese Economic and Business Studies, 11(3), 197-217. Lu, X., Guo, J., & Gan, L. (2020). International Comparison of Household Asset Allocation: Micro-Evidence from Cross-Country Comparisons. Emerging Markets Review, Elsevier, Vol. 43(C). Mankiw, N. G., & Zeldes, S. P. (1991). The Consumption of Stockholders and Nonstockholders. Journal of Financial Economics, 29(1), 97-112. Markowitz, H. (1952). The Utility of Wealth. Journal of Political Economy, 60(2), 151-158. Merton, R. C. (1969). Lifetime Portfolio Selection under Uncertainty: The Continuous-Time Case. The Review of Economics and Statistics, 247-257. Mody, A., Ohnsorge, F., & Sandri, D. (2012). Precautionary Savings in the Great Recession. IMF Economic Review, 60(1), 114-138. Moriizumi, Y. (2003). Targeted Saving by Renters for Housing Purchase in Japan. Journal of Urban Economics, 53(3), 494-509. Ögren, A. (2018). Determinants behind Household Saving Behaviour – Empirical Analysis on 15 OECD countries. Pais, J., & Rawal, V. (2021). CMIE’s Consumer Pyramids Household Surveys: An Assessment. The Indian Forum. Peón, D., & Antelo, M. (2021). The Effect of Behavioral Biases on Financial Decisions. Revista Estrategia Organizational, 10 (2), 1-63. Prakash, A., Sarkar, K., Thakur, I., & Goel, S. (2023). Financial Stocks and Flow of Funds of the Indian Economy 2020-21. Reserve Bank of India Bulletin, March 2023. Prakash, A., Ekka, A., Priyadarshi, K., Bhowmick, C., & Thakur, I. (2020). Financial Stocks and Flow of Funds of the Indian Economy 2016-17 to 2018-19. Reserve Bank of India Bulletin, July 2020. Rampal, P., & Biswas, S. (2022). Socioeconomic Determinants of Household Investment Portfolio in India. Journal of Emerging Market Finance, 21(3), 265-290. Ren, H., & Zheng, Y. (2023). COVID-19 Vaccination and Household Savings: An Economic Recovery Channel. Finance Research Letters, 54, 103711. Samuelson, P. A. (1969). Lifetime Portfolio Selection by Dynamic Stochastic Programming. The Review of Economics and Statistics, 51(3), 239–246. Sheiner, L. (1995). Housing Prices and the Savings of Renters. Journal of Urban Economics, 38(1), 94-125. Somanchi, A. (2021). Missing The Poor, Big Time: A Critical Assessment of The Consumer Pyramids Household Survey. SocArXiv. August 11. Suraj, S., Thakur, I., & Priyadarshini, M. (2024). Financial Stocks and Flow of Funds of the Indian Economy 2021-22. Reserve Bank of India Bulletin, March 2024. Temel Nalın, H. (2013). Determinants of Household Saving and Portfolio Choice Behaviour in Turkey. Acta Oeconomica, 63(3), 309-331. Van Rooij, M., Lusardi, A., & Alessie, R. (2011). Financial Literacy and Stock Market Participation. Journal of Financial Economics, 101(2), 449-472. Vissing-Jørgensen, Annette, & Orazio P. Attanasio. 2003. Stock-Market Participation, Intertemporal Substitution, and Risk-Aversion. American Economic Review, 93 (2): 383-391. Vyas, Mahesh. (2020). CPHS Execution During the Lockdown of 2020. Centre for Monitoring Indian Economy, August. Yang, Q. (2023). Inflation Exposure Heterogeneity and Households’ Portfolio Choices. Yao, R., & Zhang, H. H. (2005). Optimal Consumption and Portfolio Choices with Risky Housing and Borrowing Constraints. The Review of Financial Studies, 18(1), 197-239. Yue, P., Korkmaz, A. G., & Zhou, H. (2020). Household Financial Decision Making amidst the Covid-19 Pandemic. Emerging Markets Finance and Trade. Taylor & Francis Journals, Vol. 56(10), pages 2363-2377, August. Zeng, M., Du, J., Zhu, X., & Deng, X. (2023). Does Internet Use Drive Rural Household Savings? Evidence from 7825 Farmer Households in Rural China. Finance Research Letters, 57, 104275. Zhao, J., & Zhao, L. (2022). Mobile Payment Adoption and the Decline in China’s Household Savings Rate. Empirical Economics, 63(5), 2513-2537. Annex In accordance with the socioeconomic classification in the CPHS, the groups across diverse household characteristics have been re-classified. Regarding age, households comprising self-sufficient individuals, with some or no dependents, are grouped as Non-Dependents. Conversely, households predominant in children or elderly members are categorised as Dependents. The remaining households with roughly equal proportion of the two are labelled Balanced (Table A2). With respect to gender, households with double the number of males/females compared to the females/males, or those with no females/males, have been designated as Male dominated/ female dominated households, respectively. Households where the number of males or females is more than their counterparts, but not twice as much; or if the number of males and females are equal, have been categorised as Gender balanced (Table A3). Occupations sharing similar skill sets and comparable remuneration scales, have been bunched in accordance with the broad specifications in the CPHS (Table A4). * Chaitali Bhowmick, Sapna Goel and Amit Kumar are Managers, Rekha Misra is Adviser and Satyananda Sahoo (ssahoo@rbi.org.in) is Director in the Department of Economic and Policy Research (DEPR), Reserve Bank of India, Mumbai. Preetika was a Research Intern in DEPR. The authors are thankful to the external reviewer, and participants of the DEPR Study Circle, particularly S. Suraj and Satyam Kumar, for their valuable comments and suggestions. The views expressed in this article are those of the authors and do not represent views of the Reserve Bank of India. 1 First revised estimates of national income, consumption expenditure, saving and capital formation for 2022-23, released by the National Statistical Office (NSO) on February 29, 2024. 2 Household’s savings in physical assets comprise investment in fixed assets of construction including land improvements, machinery and equipment, and inventories. 3 https://thoughtleadership.rbc.com/the-great-canadian-savings-puzzle/. 4 Land and buildings include residential buildings, buildings used for farm and non-farm activities, construction such as recreational facilities, and rural and urban land. 5 The sample EMDEs in Badarinza et al., (2019) includes household data from China, India, Bangladesh, Philippines, Thailand and South Africa. 6 For clustering analysis, based on the purpose of borrowings, households have been classified in three sets – Never Borrowed; Borrowed for productive purposes (viz., for investments, business, housing, education, etc.); and Borrowed for non-productive purposes (viz., for wedding, consumption expenditure, repayment of dues, etc.). The latter two categories are not mutually exclusive and are taken to account for any distinct behaviour in borrowing pattern of the households which borrow across rural and urban regions. 7 In the existing literature, the standard proxy for inflation expectations is either taken from surveys on household inflation expectations or professional forecasters or market variables, such as treasury bill rate (assuming short-term interest rates reflect agents’ changing perceptions of future inflation). However, the specificity of our sample dataset made it difficult for us to use these variables as proxies for inflation expectations. 8 Discriminant analysis is a supervised algorithm where group memberships are known, and data are accordingly trained to know the best way in which groups can be separated. 9 Considering No ownership as the base category resulted in the estimation problems for the multinomial logit model. 10 See “CPHS execution during the lockdown of 2020”, Mahesh Vyas, August 2020. 11 Following the pandemic-induced mobility restrictions for a brief period, the field operations of the CPHS were restored in mid-June 2020. The response rate, however, was severely affected in the lockdown period (Vyas, 2020). Despite an increase in sample size in 2022 over 2019, the non-response rate increased to 10.2 per cent over 3.6 per cent in the pre-pandemic year. 12 The Reserve Bank of India (RBI) has launched initiatives such as National Centre for Financial Education (NCFE) and Financial Literacy Centres (FLCs) to improve financial awareness and empower individuals across all demographics to manage money effectively. The RBI Kehta Hai initiative educates the public on banking services, while a dedicated Financial Education Microsite provides resources in 13 languages. Additionally, financial literacy modules have been integrated into school curricula and regular awareness campaigns are conducted by the RBI. Furthermore, governmental initiatives such as the Pradhan Mantri Jan Dhan Yojana (PMJDY) have increased banking penetration. 13 The RRR compares the odds of an outcome for one category of a categorical dependent variable with the odds of a reference category, based on changes in independent variables. An RRR greater (less) than one indicates that the odds of the choosing an outcome increases (decreases) relative to the reference group as the independent variable changes. An RRR equal to one indicates that the independent variable does not affect the likelihood of the outcome compared to the reference category. |
||||||||||||||||||||||||||||||||||||

এই পেজটি শেয়ার করুন:


রিজার্ভ ব্যাঙ্ক অফ ইন্ডিয়া মোবাইল অ্যাপ্লিকেশন ইনস্টল করুন এবং সাম্প্রতিক সংবাদগুলিতে দ্রুত অ্যাক্সেস পান!


