 IST,
IST,


In Search of a Better Estimator of InterestRate Risk of Bonds: Convexity Adjusted Exponential Duration Method
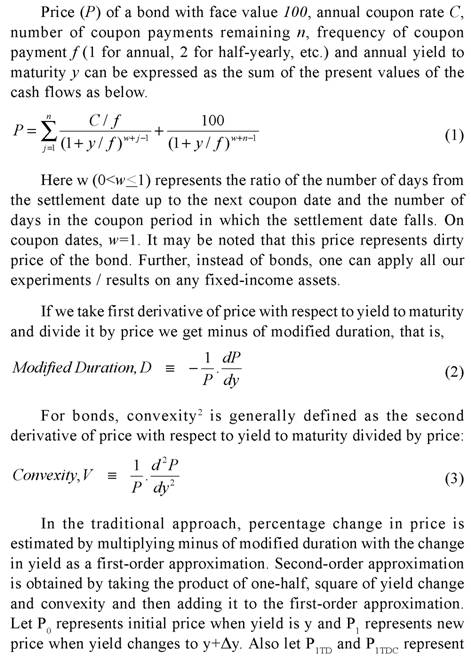
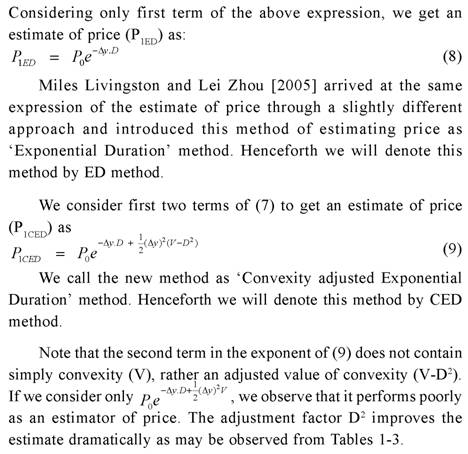
A. K. Srimany and Sneharthi Gayen* We have proposed a new method, using modified duration and convexity, to estimate the interest rate risk of bonds which can be considered as a conceptual improvement over the ‘Exponential Duration’ method proposed by Miles Livingston and Lei Zhou [2005]. We have analytically and experimentally proved that this new method is better than traditional method based on modified duration and also the ‘Exponential Duration’ method, at least for the international market covering bonds of major economies. However, a pertinent question will be the performance of this proposed method vis-à-vis the traditional method based on modified duration and convexity. Indication based on sample cases reveals that the performance of this proposed method is better than all the above methods. A rigorous analysis of the performance of our proposed method as compared to the traditional method based on modified duration and convexity will be our next attempt in this direction. JEL Classification : G10 Introduction With the introduction of the concept of bond duration in 1938 by Macaulay, it has been used by financial analysts as a measure of the sensitivity of bond prices to changes in interest rate. A commonly used measure of duration is modified duration which is Macaulay’s duration divided by one plus bond’s yield to maturity per period. Modified duration provides a good approximation of the actual change in price of bond if the change in interest rate is small. For larger changes in interest rate, modified duration based estimate is less accurate. To improve the accuracy, the concept of convexity was introduced subsequently. Now modified duration and convexity are widely used by financial analysts to measure the interest rate sensitivity of a bond. Subsequent to the introduction of duration and convexity, many researchers wanted to introduce different measures of interest rate risk, e.g. M-absolute, M-square (Nawalkha S K, Soto G M and Beliaeva N A, 2005), Garbade’s convexity1 (Louis D’Antonio and Thomas J. Cook, 2004), etc. M-absolute model immunizes risk caused by the shifts in the slope, curvature, and all other term structure shape parameters by selecting a minimum M-absolute bond portfolio with cash flows clustered around its planning horizon date, though the model immunizes only partially against the height shifts. The M-absolute of a bond portfolio is given as the weighted average of the absolute distances between cash flow maturities and the planning horizon of the portfolio. A bond portfolio selected with minimum M-square has cash flows clustered around its planning horizon date and hence protects the portfolio from immunization risk resulting from nonparallel yield curve shifts. The M-square of a bond portfolio is given as the weighted average of the squares of the distance between cash flow maturities and the planning horizon of the portfolio. Garbade defines convexity as the “weighted average of the squared difference between (1) the time remaining to a future payment and (2) the duration of the bond.” However, these measures are slightly more complicated and are not very popular at present. Market preference is also mostly towards the twin measures of modified duration and convexity. Many database providers like Bloomberg, Datastream provide information on these twin measures of interest rate risk for each outstanding bond issue. Utilizing the concept of modified duration, Miles Livingston and Lei Zhou [2005] introduced the method of ‘exponential duration’ which, they proved, is uniformly better than the traditional duration method of estimating price movements under different yield movement scenarios. However, they observed that traditional duration plus convexity method gives smaller errors than the ‘exponential duration’ method in most cases, though the differences are small. In this article, we introduce ‘convexity adjusted exponential duration’ method and compare the performance of the proposed method as against traditional duration method, ‘exponential duration’ method as well as traditional duration plus convexity method in measuring interest rate sensitivity of bonds. The outline of the paper is as follows. We first review in Section I the traditional approach to estimate the interest rate risk using duration and convexity. We then present in Section II our estimation procedure of interest rate risk named as ‘convexity adjusted exponential duration’ method. In the process, we have derived the ‘exponential duration’ method as suggested by Miles Livingston and Lei Zhou [2005], as the first level approximation. This is followed by mathematical analysis in Section III, where we prove that our method is more accurate than the traditional duration based method and ‘exponential duration’ method for decrease in yield level, in case of zero coupon bonds and perpetual bonds. As we are unable to prove mathematically the dominance of our methodology over traditional duration method and ‘exponential duration’ method for nominal bonds and for increase in yield level in case of zero coupon bonds and perpetual bonds, we have presented in Section IV the results of our experiments through grid search covering major types of bonds available in international market for a wide range of residual maturity and increase / decrease in yield level up to the magnitude of 300 basis points; change in yield beyond this level in a short time span is a very unlikely situation in the international market covering bonds of major developed economies. We have observed therein empirically that our method provides far more accuracy in price movement as compared to the traditional duration and ‘exponential duration’ methods in almost all cases. In Section V, we have presented some initial results comparing our method and traditional duration plus convexity method. In Section VI, we conclude with the findings of the paper. Traditional Approach: Duration plus Convexity Performance of CED method: To understand prima facie the performance behavior of CED method, we have presented here price behavior of three types of bonds as used by Miles Livingston and Lei Zhou [2005] for the purpose of illustration.
In Table 2, we present comparative position of different methods for estimating the price of 30-year zero coupon bond. Here also it may be observed that CED method gives superior estimate than TD, TDC and ED methods. For example, if yield increases by 3% from the present level of 5%, actual price reduces to 9.94. TD method estimates the new price at 3.31, ED method at 9.82 and TDC method at 12.09, whereas CED method estimates almost precisely at 9.94.
In Table 3, we present comparative position of different methods for a perpetual bond with 5% annual coupon rate. It may be observed that CED method gives superior estimate than TD, TDC and ED methods. For example, if yield increases by 3% from its present level of 5%, actual price goes down to 62.50; TD method estimate price at 40.00, ED method at 54.88 and TDC method at 76.00, whereas CED method gives closest estimate at 65.70.
Thus we have observed that CED method, as proposed by us, is superior to TD, TDC and ED methods, in these cases. Section III In this section we have analyzed the performance of CED method as compared to traditional duration method and exponential duration method for different types of bond. As may be observed from the analytical and experimental evidences here, CED method is better than TD and ED methods, except for certain exceptional situations. 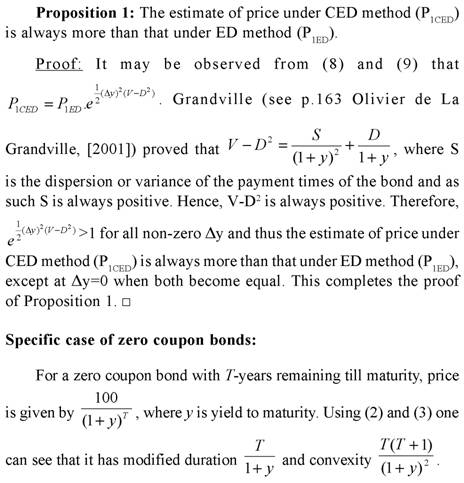 Proposition 2: CED method provides better estimate of price than TD and ED methods for zero coupon bonds, when yield decreases. 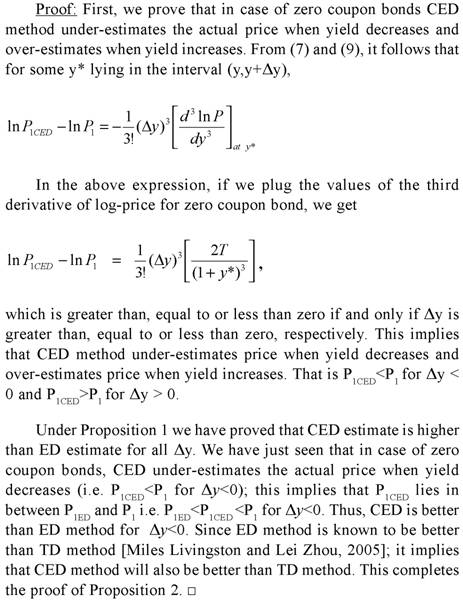 Further, empirically through grid search, it is observed that for zero coupon bonds CED method provides better estimate of price than TD and ED methods, when yield increases (empirical evidence through grid search is presented in Section IV under Grid Search Result 1). Specific case of perpetual bonds: 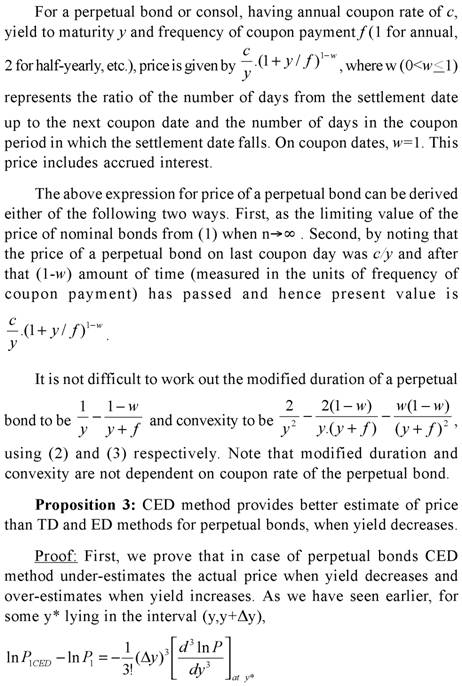 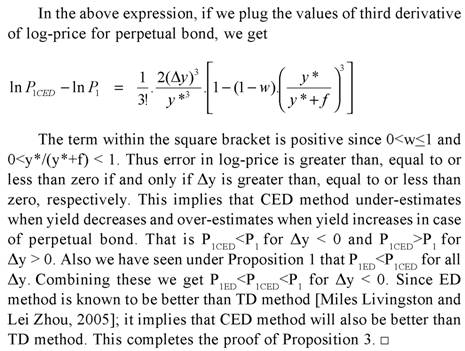 Further, empirically through grid search, it is observed that in case of perpetual bonds CED method provides better estimate of price than TD and ED methods almost always, when yield increases. Empirical evidence through grid search is presented in Section IV under Grid Search Result 2. Specific case of nominal bonds: Unlike TD, TDC and ED methods, it is difficult to say analytically whether CED will under-estimate or over-estimate the actual price in case of nominal bonds when yield decreases or increases; rather it will depend on various characteristics of the bond like time to maturity, coupon, frequency, yield, etc. It is also difficult to prove the performance of CED as compared to TD and ED analytically for nominal bonds. We have tried to gauge its performance through empirical grid search method and presented in Section IV under Grid Search Result 3. It is observed that CED performs better than TD and ED always. Section IV Grid Search Result 1 (Zero Coupon Bonds): For the purpose of checking performance of CED method against ED and TD methods in case of zero coupon bonds when yield increases, we employed a grid search by varying time to maturity from 1 month to 30 year incrementing by 1 month and yield from 0.01% to 25% incrementing by 1 basis point and increase in yield from 0.01% to 3% incrementing by 1 basis point. Observations from the grid search are as follows: (i) Absolute error of CED method is less than those of TD and ED methods. (ii) Maximum absolute percentage error observed under TD, ED and CED methods are 75.71%, 1.31% and 0.03%, respectively. Grid Search Result 2 (Perpetual Bonds): For the purpose of checking performance of CED method against other methods in case of perpetual bonds when yield increases, we used grid search by varying frequency of coupon payment to be annual and half-yearly, yield from 0.01% to 25% incrementing by 1 basis point, w from 0.01 to 1 incrementing by 0.01. For low level of initial yield, when extent of increase in yield is higher than the initial yield level, absolute errors of all the methods are very high and do not give any meaningful estimate. Hence, in the grid we considered increase in yield from 0.01% to min{initial yield, 3%} incrementing by 1 basis point. Coupon rate is not required to be varied in the grid, since percentage errors in price under various methods are independent of coupon rate. Observations from the grid search are as follows: (i) Absolute error of CED method is less than that of TD method. (ii) Absolute error of CED method is less than that of ED method when initial yield level is higher than 0.03% i.e. practically always. (iii) Maximum absolute percentage error observed under TD, ED and CED methods are 100%, 26.42% and 21.31%, respectively. Grid Search Result 3 (Nominal Bonds): We experimented with different nominal bonds by employing grid search. We varied time to maturity of the bonds from 3 months to 360 months with an increment of 3 months, coupon rate from 0.5% to 20% with an increment of 50 basis points, yield to maturity from 0.5% to 20% with an increment of 50 basis points, frequency of coupon payment half-yearly and annual, yield change from -3% to 3% (to be precise from max{-initial yield,-3%} to 3%) with an increment of 5 basis points. The grid covers the commonly observed scenarios in the major markets of the world. Observations from the grid search are as follows: (i) Absolute error of CED method is less than those of TD and ED methods. (ii) Maximum absolute percentage error observed under TD, ED and CED methods are 62.93%, 5.94% and 0.47% respectively. (iii) As a by-product of the empirical exercise, we have observed that (a) for annual bonds with time to maturity up to 10 years or bearing 9.5% or higher coupon, (b) for semi-annual bonds with time to maturity up to 5 years, (c) for par annual bond with time to maturity up to 10 years or bearing 5.5% or higher coupon, (d) for par half-yearly bond with time to maturity up to 5 years or bearing 10% or higher coupon, CED under-estimates (overestimates) price when yield decreases (increases). In view of the Proposition 1 also, we can infer that CED will be superior to ED in all these cases, when yield falls. Section V In the earlier section, we have observed the superiority of CED over TD and ED methods under prevailing international bond market conditions. As regards its performance vis-à-vis TDC method, we have checked some sample cases covering different aspects of bonds and the results are presented visually in this section. We have presented estimation errors (in percent) under different methods pictorially for nominal bonds in figures I to XII, for zero coupon bonds in figures XIII to XV and for perpetual bonds in figures XVI to XVIII. As may be observed visually therefrom the estimation errors under CED method are significantly less as compared to other methods (in particular TDC method), for all types of bonds. We have presented comparative position of absolute values of percentage errors under CED method with those under ED and TDC methods for different time to maturity and change in yield in three-dimensional graphs, for 5% and 10% annual par bonds. Difference of absolute values of percentage errors are plotted in figures XIX to XXII and ratio of absolute values of percentage errors in figures XXIII to XXVI. In figures XIX to XXII, negative (positive) difference in absolute values of percentage errors will mean that CED is better (worse) than ED/ TDC method, depending on which competing method is used. It may be observed that the difference is negative implying that CED is better. Further, as time to maturity or the amount of change in yield increases, difference also increases in magnitude implying thereby degree of superiority of CED method compared with ED/ TDC methods increases with these parameters. In figures XXIII to XXVI, a ratio of absolute values of percentage errors being less (greater) than unity here will mean that CED is better (worse) than ED/ TDC method, depending on which competing method is used. Ratio of absolute percentage error of CED to that of ED (figures XXIII and XXV) first decreases and then increases with time to maturity; it increases as the amount of yield change increases. From figures XXIV and XXVI, it may be observed that in case of CED versus TDC this ratio is less than unity and falls rapidly (implying thereby that performance of CED becomes farther better than TDC) as time to maturity increases and it does not depend much on the amount of yield change. It may also be observed that for 5% (10%) annual par bonds, CED error is lower than 1/20th (1/10th) of ED error. Further, ratio is much lower in case of CED versus ED than CED versus TDC errors, indicating far superior performance of CED relative to ED than relative to TDC. Thus, based on these sample cases, we find that CED is better than TDC in all the cases. However, more rigorous exercise is required to be done in this direction. We have introduced Convexity adjusted Exponential Duration (CED) method for estimating price movements under different yield movement scenarios. We have proved empirically that CED method performs better than TD and ED methods in case of zero coupon bonds and perpetual bonds, when yield decreases. We have verified empirically that CED method provides better precision in price movements as compared to TD and ED methods for zero coupon bonds when yield increases. Further, through empirical exercise, we have observed that CED method performs better than TD and ED methods for nominal bonds for increase/decrease in yield up to the magnitude of 300 basis points; change in yield beyond this level is a very unlikely situation in the international market covering bonds of major developed economies. For perpetual bonds, CED method performs better than TD always, and it performs better than ED method almost always (i.e. when initial yield level is higher than 0.03%). Considering all these aspects we feel that the use of ‘Convexity adjusted Exponential Duration’ method, as proposed by us, will help in better estimation of interest rate risk as compared to Traditional Duration method and ‘Exponential Duration’ method as proposed by Miles Livingston and Lei Zhou [2005] at least for international market covering bonds of major developed economies. Further, some sample exercises indicate that our proposed method performs better than Traditional Duration plus Convexity method. However, more rigorous analysis of the performance of our proposed method as compared to Traditional Duration plus Convexity method is required to be done to establish the superiority of our proposed method. Notes: 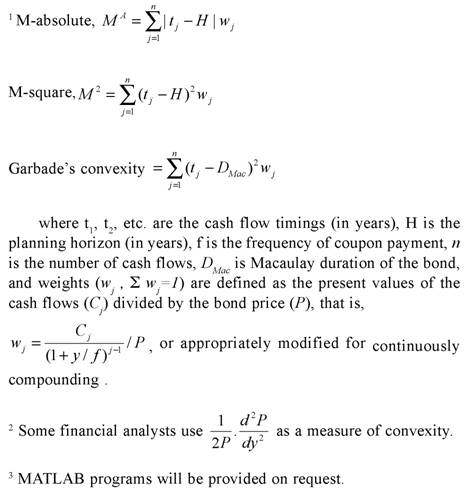 References: Louis D’Antonio and Thomas J. Cook (2004), ‘Convexity: A comparison and reconciliation of its different forms’, The Journal of Financial Research, Vol. XXVII, No.2, 251-272 Miles Livingston and Lei Zhou (2005), ‘Exponential Duration: A more accurate estimation of interest rate risk’, The Journal of Financial Research, Vol. XXVIII, No.3, 343-361 Nawalkha S K, Soto G M and Beliaeva N A (2005), ‘Interest Rate Risk Modeling: Fixed Income Valuation Course’, John Wiley & Sons, New Jersey Olivier de La Grandville (2001), ‘Bond Pricing and Portfolio Analysis – Protecting Investors in the Long Run’, The MIT Press, Cambridge, MA. 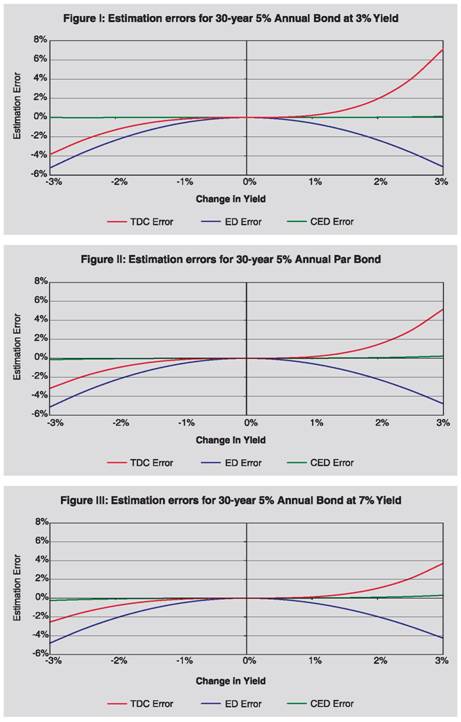 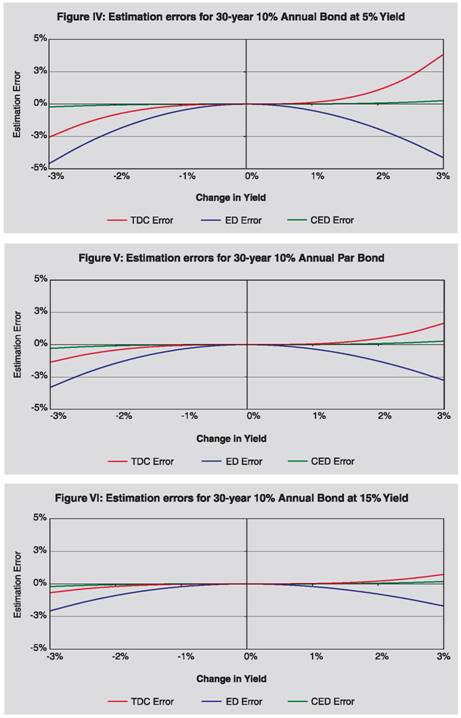 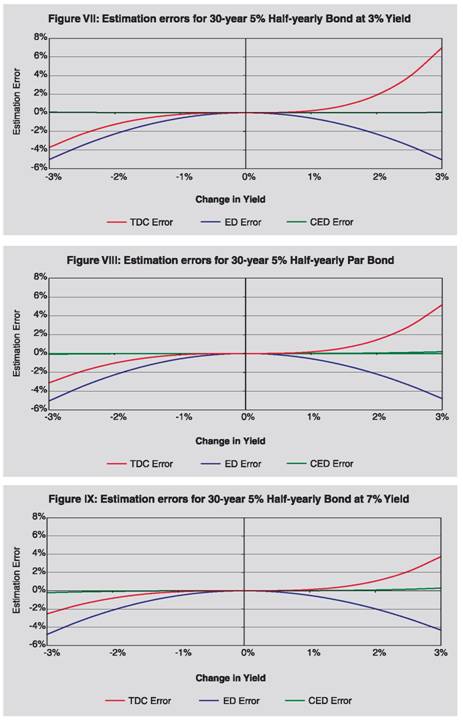 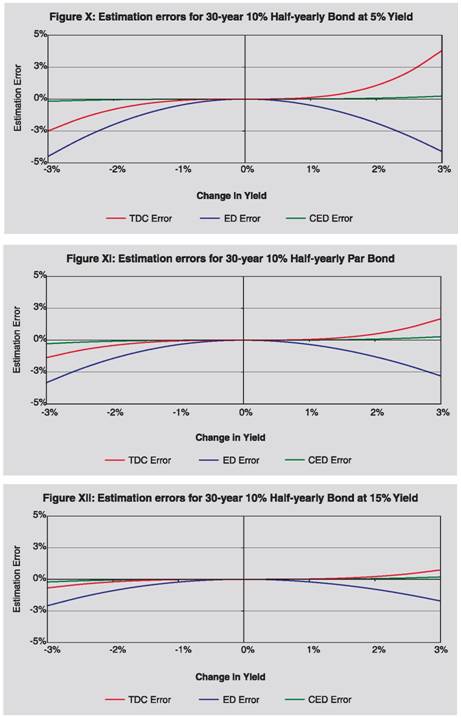 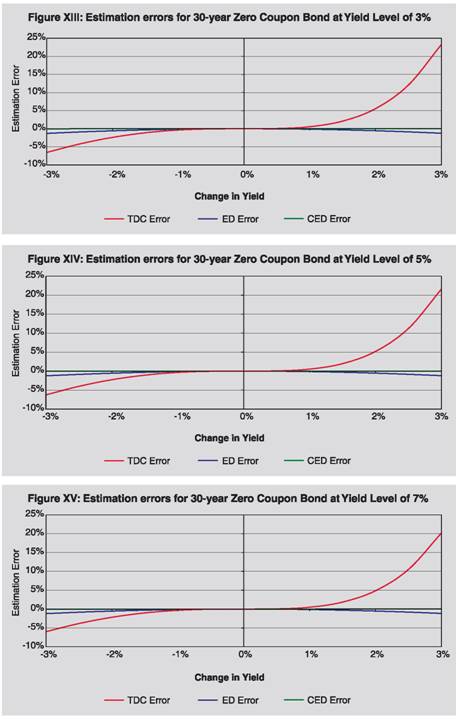 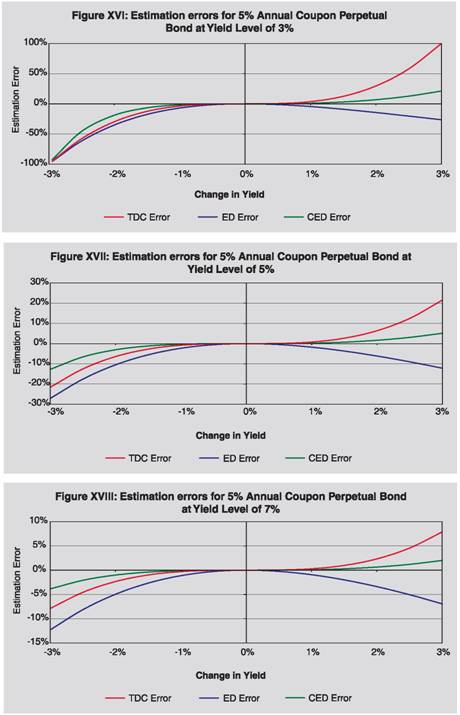 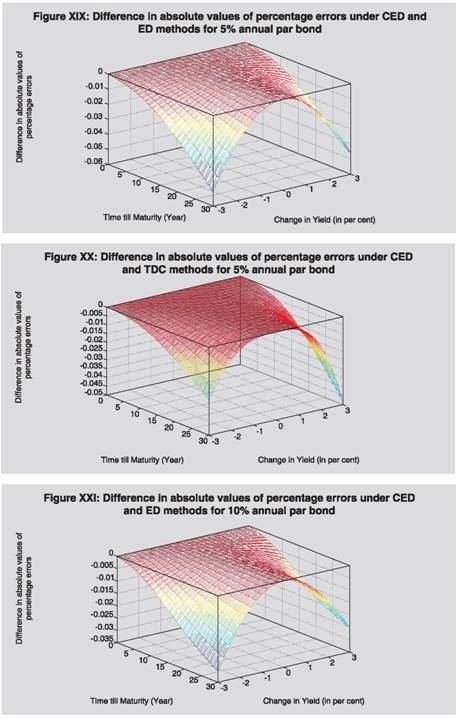   * Dr. A. K. Srimany is General Manager and Shri Sneharthi Gayen is Assistant General Manager in the Department of External Investments and Operations, Reserve Bank of India. The views expressed in this paper are those of the authors and not necessarily of Reserve Bank of India. The authors are thankful to Smt. Meena Hemchandra, Chief General Manager-in-Charge and Shri Shyam Sundar, Chief General Manager for their encouragement and support. The authors are also thankful to the anonymous referees for their useful comments which helped them to better the exposition of the paper. |
|||||||||||||||||||||||||||||||||||||||||||||||||||||||||||||||||||||||||||||||||||||||||||||||||||||||||||||||||||||||||||||||||||||||||||||||||||||||||||||||||||||||||||||||||||||||||||||||||||||||||||||||||||||||||||||||||||||||||||||||||||||||||||||||||||||||||||||||||||||||||||||||||||||||||||||||||||||||||||||||||||||||||||||||||||||||||||||||||||||

এই পেজটি শেয়ার করুন:


রিজার্ভ ব্যাঙ্ক অফ ইন্ডিয়া মোবাইল অ্যাপ্লিকেশন ইনস্টল করুন এবং সাম্প্রতিক সংবাদগুলিতে দ্রুত অ্যাক্সেস পান!
আমাদের অ্যাপটি ইনস্টল করতে QR কোডটি স্ক্যান করুন


পেজের শেষ আপডেট করা তারিখ:


