 IST,
IST,


Bank Lending Survey for Q3:2023-24
| Today, the Reserve Bank released the results of 26th round of its quarterly Bank Lending Survey[1], which captures qualitative assessment and expectations of major scheduled commercial banks on credit parameters (viz., loan demand as well as terms and conditions of loans) for major economic sectors[2]. The latest round of the survey, which was conducted during Q3:2023-24, collected senior loan officers’ assessment of credit parameters for Q3:2023-24 and their expectations for Q4 of 2023-24 and Q1 and Q2 of 2024-25[3]. Highlights:
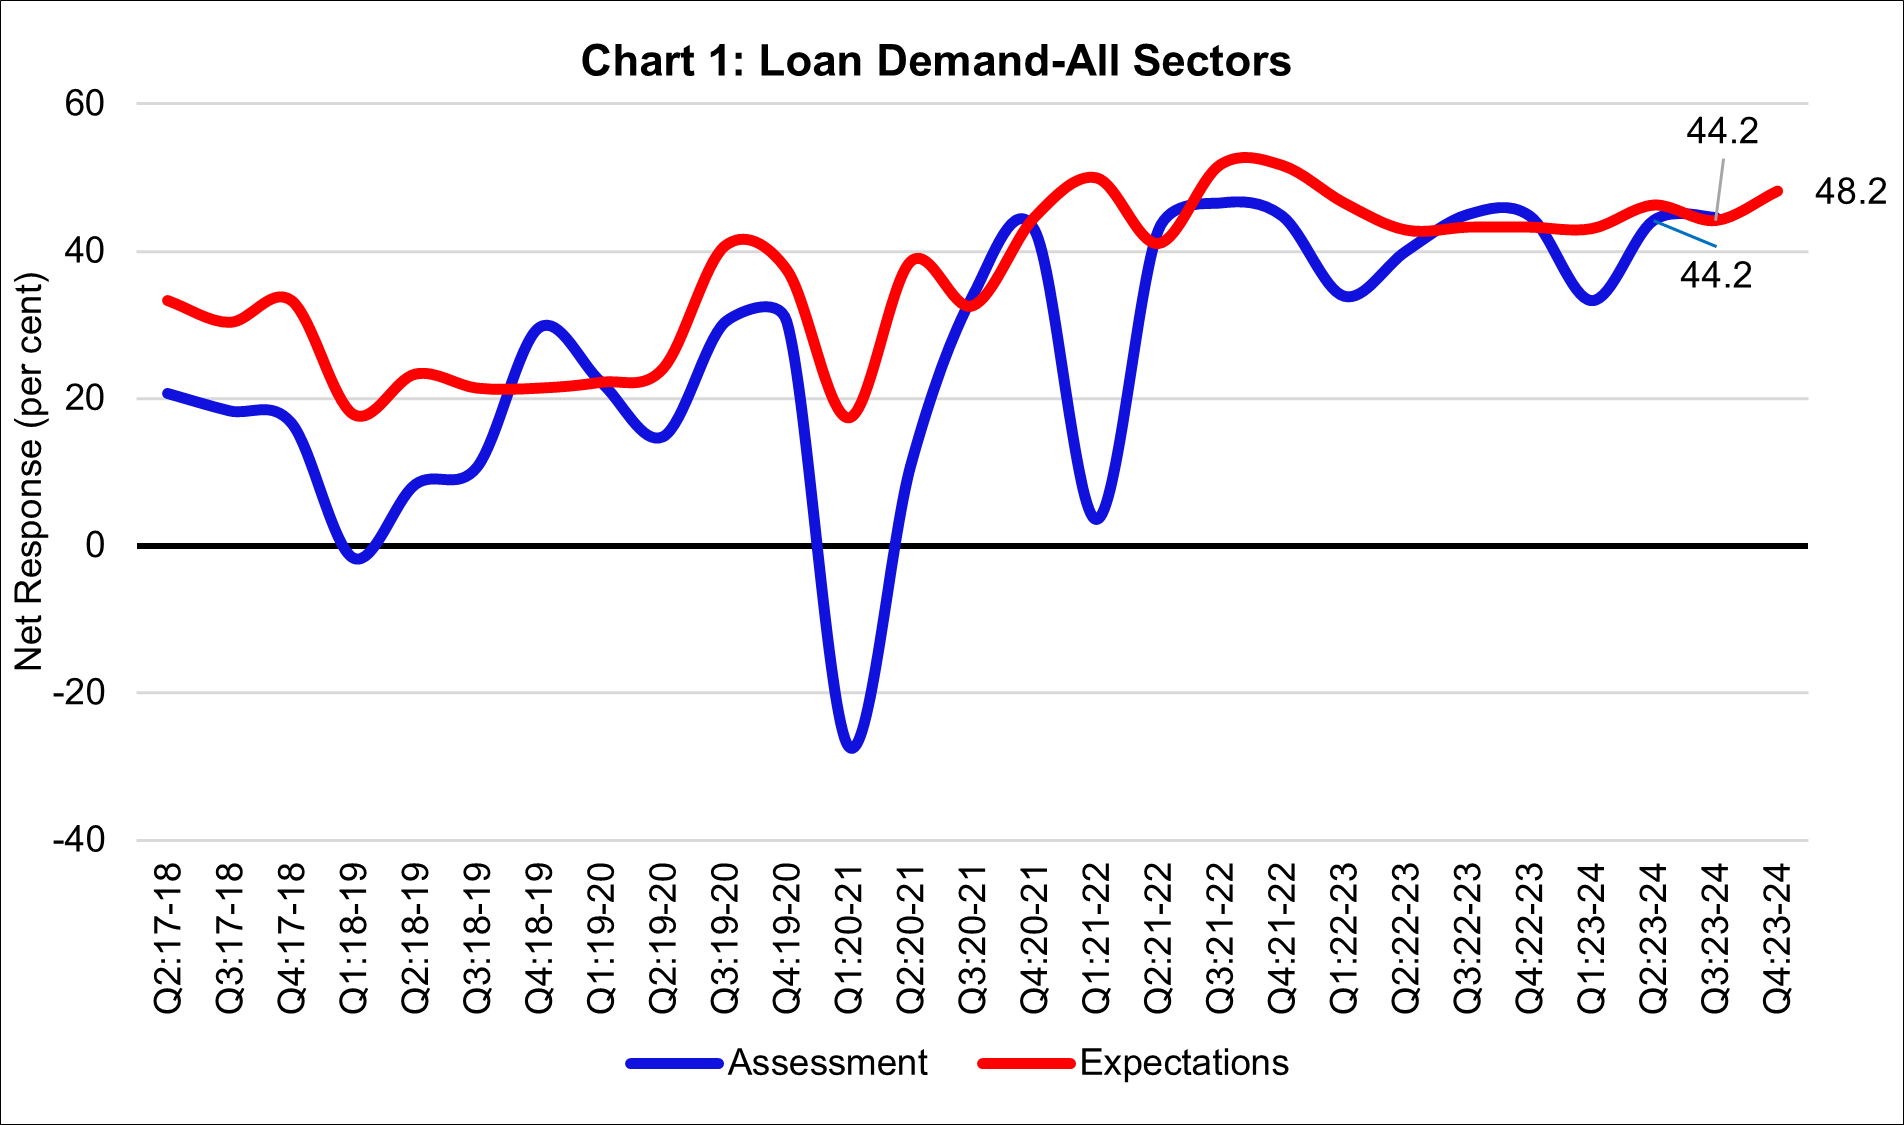
Table 1: Sector-wise Loan Demand - Net response[4]
Table 2: Sector-wise Loan Terms and Conditions - Net response
Table 3: Sector-wise Expectations for Extended Period - Net Response
Note: Please see the attached excel file for detailed time series data.
[1] The results of 25th round of the BLS with reference period as July-September 2023 were released on the RBI website on October 6, 2023. The survey results reflect the views of the respondents, which are not necessarily shared by the Reserve Bank. [2] The survey questionnaire is canvassed among major 30 SCBs, which together account for over 90 per cent of credit by SCBs in India. [3] In this data release, we have used the responses received after the RBI’s announcement on regulatory measures towards consumer credit and bank credit to NBFCs dated November 16, 2023. [4] Net Response (NR) is computed as the difference of percentage of banks reporting increase/optimism and those reporting decrease/pessimism in respective parameter. The weights of +1.0, 0.5, 0, -0.5 and -1.0 are assigned for computing NR from aggregate per cent responses on 5-point scale, i.e., substantial increase/ considerable easing, moderate increase/ somewhat easing, no change, moderate decrease/ somewhat tightening, substantial decrease/ considerable tightening for loan demand/loan terms and conditions parameters respectively. NR ranges between -100 to 100. Any value greater than zero indicates expansion/optimism and any value less than zero indicates contraction/pessimism. Increase in loan demand is considered optimism (Tables 1), while for loan terms and conditions, a positive value of net response indicates easy terms and conditions (Table 2).
|
|||||||||||||||||||||||||||||||||||||||||||||||||||||||||||||||||||||||||||||||||||||||||||||||||||||||||||||||||||||||||||||||||||||||||||||||||||||

এই পেজটি শেয়ার করুন:


রিজার্ভ ব্যাঙ্ক অফ ইন্ডিয়া মোবাইল অ্যাপ্লিকেশন ইনস্টল করুন এবং সাম্প্রতিক সংবাদগুলিতে দ্রুত অ্যাক্সেস পান!
আমাদের অ্যাপটি ইনস্টল করতে QR কোডটি স্ক্যান করুন


পেজের শেষ আপডেট করা তারিখ:


