|
Today, the Reserve Bank released the results of May 2024 round of its bi-monthly consumer confidence survey (CCS)[1]. The survey collects current perceptions (vis-à-vis a year ago) and one year ahead expectations of households on general economic situation, employment scenario, overall price situation, own income and spending across 19 major cities. The latest round of the survey was conducted during May 2-11, 2024, covering 6,083 respondents. Female respondents accounted for 52.7 per cent of this sample.
Highlights:
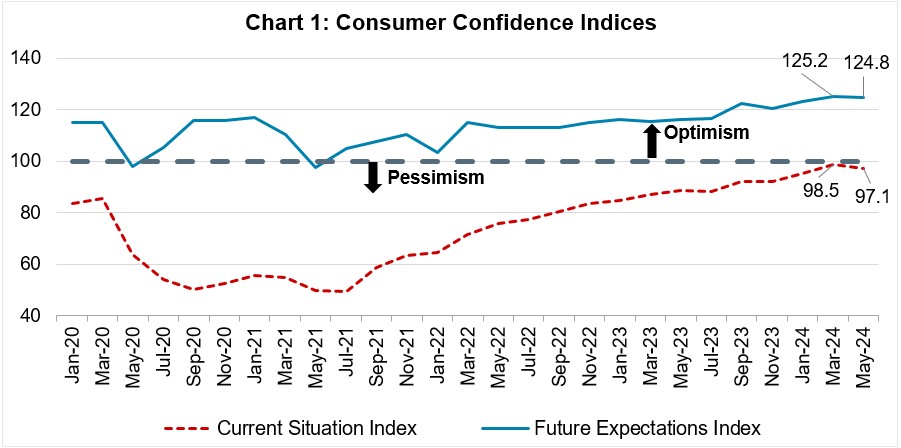
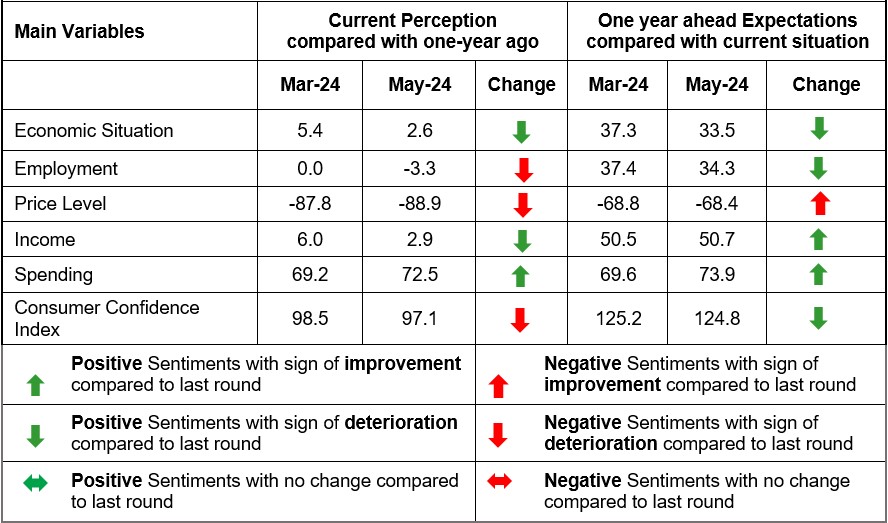
- Consumer confidence for the current period paused on its uptrend as sentiments on all parameters, except spending, recorded some moderations in the latest survey round; the current situation index (CSI)[2] moderated to 97.1 in May 2024 from 98.5 two months ago (Chart 1; Tables 1, 2, 3, 5 and 6).
- For the year ahead, consumer confidence remained at elevated level in the optimistic terrain though it declined, albeit marginally, due to relatively tempered sentiments on the general economic situation and employment prospects (Tables 1 and 2).
- The future expectations index (FEI) stood at 124.8 in May 2024 (125.2 in the previous survey round) (Chart 1).
- Consumers expect higher rise in overall spending over the next one year vis-à-vis the previous survey round; more respondents expect an increase in both essential and non-essential spending (Tables 6, 7 and 8).
Note: Please see the excel file for time series data[3]
| Summary based on Net Responses[4] |
|
|
|
Table 1: Perceptions and Expectations on the General Economic Situation
|
|
(Percentage responses)
|
|
Survey Round
|
Current Perception
|
One year ahead Expectation
|
|
Increased
|
Remained Same
|
Decreased
|
Net Response
|
Will Increase
|
Will Remain Same
|
Will Decrease
|
Net Response
|
|
May-23
|
32.1
|
19.0
|
48.9
|
-16.8
|
51.0
|
15.8
|
33.2
|
17.8
|
|
Jul-23
|
30.4
|
18.5
|
51.1
|
-20.7
|
51.1
|
15.1
|
33.8
|
17.2
|
|
Sep-23
|
36.1
|
19.9
|
44.0
|
-7.9
|
56.8
|
15.1
|
28.1
|
28.6
|
|
Nov-23
|
33.1
|
22.5
|
44.4
|
-11.3
|
54.3
|
17.2
|
28.5
|
25.7
|
|
Jan-24
|
37.5
|
22.3
|
40.2
|
-2.7
|
59.2
|
15.3
|
25.5
|
33.7
|
|
Mar-24
|
41.2
|
23.1
|
35.8
|
5.4
|
60.7
|
15.8
|
23.4
|
37.3
|
|
May-24
|
40.0
|
22.6
|
37.4
|
2.6
|
59.0
|
15.6
|
25.4
|
33.5
|
|
Table 2: Perceptions and Expectations on Employment
|
|
(Percentage responses)
|
|
Survey Round
|
Current Perception
|
One year ahead Expectation
|
|
Increased
|
Remained Same
|
Decreased
|
Net Response
|
Will Increase
|
Will Remain Same
|
Will Decrease
|
Net Response
|
|
May-23
|
32.1
|
20.2
|
47.7
|
-15.6
|
52.1
|
18.7
|
29.2
|
22.9
|
|
Jul-23
|
30.8
|
21.0
|
48.2
|
-17.5
|
51.4
|
18.3
|
30.3
|
21.1
|
|
Sep-23
|
34.0
|
21.8
|
44.2
|
-10.2
|
55.8
|
18.1
|
26.2
|
29.6
|
|
Nov-23
|
32.3
|
23.0
|
44.7
|
-12.4
|
53.6
|
19.7
|
26.8
|
26.9
|
|
Jan-24
|
35.3
|
23.4
|
41.3
|
-6.0
|
58.7
|
17.4
|
24.0
|
34.7
|
|
Mar-24
|
38.1
|
23.8
|
38.1
|
0.0
|
60.0
|
17.4
|
22.6
|
37.4
|
|
May-24
|
36.8
|
23.0
|
40.2
|
-3.3
|
58.0
|
18.3
|
23.7
|
34.3
|
|
Table 3: Perceptions and Expectations on Price Level
|
|
(Percentage responses)
|
|
Survey Round
|
Current Perception
|
One year ahead Expectation
|
|
Increased
|
Remained Same
|
Decreased
|
Net Response
|
Will Increase
|
Will Remain Same
|
Will Decrease
|
Net Response
|
|
May-23
|
92.2
|
6.4
|
1.4
|
-90.8
|
82.7
|
10.0
|
7.3
|
-75.4
|
|
Jul-23
|
92.7
|
6.0
|
1.3
|
-91.4
|
80.9
|
10.2
|
8.9
|
-72.0
|
|
Sep-23
|
91.8
|
6.4
|
1.8
|
-90.0
|
78.4
|
9.9
|
11.7
|
-66.8
|
|
Nov-23
|
91.3
|
7.3
|
1.4
|
-89.9
|
81.0
|
10.2
|
8.8
|
-72.3
|
|
Jan-24
|
90.8
|
7.2
|
2.0
|
-88.9
|
80.5
|
10.4
|
9.1
|
-71.4
|
|
Mar-24
|
89.2
|
9.3
|
1.4
|
-87.8
|
78.2
|
12.5
|
9.4
|
-68.8
|
|
May-24
|
90.5
|
7.8
|
1.6
|
-88.9
|
79.0
|
10.4
|
10.6
|
-68.4
|
|
Table 4: Perceptions and Expectations on Rate of Change in Price Level (Inflation)*
|
|
(Percentage responses)
|
|
Survey Round
|
Current Perception
|
One year ahead Expectation
|
|
Increased
|
Remained Same
|
Decreased
|
Net Response
|
Will Increase
|
Will Remain Same
|
Will Decrease
|
Net Response
|
|
May-23
|
84.0
|
12.5
|
3.4
|
-80.6
|
81.8
|
14.1
|
4.1
|
-77.8
|
|
Jul-23
|
84.5
|
11.8
|
3.7
|
-80.8
|
80.8
|
14.8
|
4.4
|
-76.4
|
|
Sep-23
|
82.5
|
13.4
|
4.2
|
-78.3
|
79.4
|
15.8
|
4.8
|
-74.6
|
|
Nov-23
|
81.8
|
13.6
|
4.6
|
-77.2
|
80.1
|
14.7
|
5.2
|
-75.0
|
|
Jan-24
|
79.5
|
15.7
|
4.8
|
-74.7
|
77.2
|
17.8
|
5.0
|
-72.2
|
|
Mar-24
|
77.0
|
17.6
|
5.4
|
-71.6
|
76.7
|
18.3
|
5.0
|
-71.7
|
|
May-24
|
77.8
|
15.1
|
7.1
|
-70.6
|
79.1
|
16.0
|
4.9
|
-74.3
|
|
*Applicable only for those respondents who felt price has increased/price will increase.
|
|
Table 5: Perceptions and Expectations on Income
|
|
(Percentage responses)
|
|
Survey Round
|
Current Perception
|
One year ahead Expectation
|
|
Increased
|
Remained Same
|
Decreased
|
Net Response
|
Will Increase
|
Will Remain Same
|
Will Decrease
|
Net Response
|
|
May-23
|
23.9
|
49.7
|
26.3
|
-2.4
|
53.8
|
39.4
|
6.9
|
46.9
|
|
Jul-23
|
25.4
|
49.9
|
24.8
|
0.6
|
54.7
|
38.6
|
6.7
|
48.0
|
|
Sep-23
|
25.0
|
49.8
|
25.2
|
-0.3
|
55.7
|
37.8
|
6.5
|
49.2
|
|
Nov-23
|
27.2
|
50.1
|
22.7
|
4.5
|
57.9
|
36.0
|
6.1
|
51.8
|
|
Jan-24
|
26.4
|
51.5
|
22.1
|
4.2
|
56.3
|
36.9
|
6.8
|
49.4
|
|
Mar-24
|
27.7
|
50.6
|
21.7
|
6.0
|
56.7
|
37.2
|
6.1
|
50.5
|
|
May-24
|
25.3
|
52.3
|
22.4
|
2.9
|
56.9
|
36.9
|
6.2
|
50.7
|
|
Table 6: Perceptions and Expectations on Spending
|
|
(Percentage responses)
|
|
Survey Round
|
Current Perception
|
One year ahead Expectation
|
|
Increased
|
Remained Same
|
Decreased
|
Net Response
|
Will Increase
|
Will Remain Same
|
Will Decrease
|
Net Response
|
|
May-23
|
73.4
|
21.3
|
5.3
|
68.1
|
73.8
|
21.7
|
4.6
|
69.2
|
|
Jul-23
|
74.5
|
20.5
|
5.0
|
69.6
|
73.8
|
21.3
|
4.8
|
69.0
|
|
Sep-23
|
74.6
|
20.2
|
5.2
|
69.4
|
75.2
|
20.3
|
4.6
|
70.6
|
|
Nov-23
|
74.8
|
20.6
|
4.6
|
70.1
|
75.0
|
21.0
|
4.1
|
70.9
|
|
Jan-24
|
73.2
|
22.3
|
4.5
|
68.6
|
74.2
|
20.9
|
5.0
|
69.2
|
|
Mar-24
|
73.1
|
23.1
|
3.8
|
69.2
|
73.9
|
21.7
|
4.3
|
69.6
|
|
May-24
|
76.2
|
20.1
|
3.8
|
72.5
|
77.9
|
18.1
|
4.0
|
73.9
|
|
Table 7: Perceptions and Expectations on Spending- Essential Items
|
|
(Percentage responses)
|
|
Survey Round
|
Current Perception
|
One year ahead Expectation
|
|
Increased
|
Remained Same
|
Decreased
|
Net Response
|
Will Increase
|
Will Remain Same
|
Will Decrease
|
Net Response
|
|
May-23
|
84.0
|
12.8
|
3.2
|
80.8
|
81.3
|
15.2
|
3.5
|
77.8
|
|
Jul-23
|
85.3
|
11.8
|
3.0
|
82.3
|
81.0
|
15.5
|
3.5
|
77.5
|
|
Sep-23
|
84.9
|
11.9
|
3.2
|
81.7
|
82.0
|
14.4
|
3.6
|
78.4
|
|
Nov-23
|
85.7
|
11.4
|
2.9
|
82.7
|
82.3
|
14.4
|
3.4
|
78.9
|
|
Jan-24
|
84.1
|
12.9
|
3.0
|
81.1
|
81.8
|
14.6
|
3.6
|
78.2
|
|
Mar-24
|
84.5
|
13.0
|
2.5
|
82.0
|
82.5
|
14.5
|
3.0
|
79.5
|
|
May-24
|
85.6
|
11.8
|
2.7
|
82.9
|
84.7
|
12.3
|
3.1
|
81.6
|
|
Table 8: Perceptions and Expectations on Spending- Non-Essential Items
|
|
(Percentage responses)
|
|
Survey Round
|
Current Perception
|
One year ahead Expectation
|
|
Increased
|
Remained Same
|
Decreased
|
Net Response
|
Will Increase
|
Will Remain Same
|
Will Decrease
|
Net Response
|
|
May-23
|
25.8
|
38.2
|
36.1
|
-10.3
|
35.3
|
37.5
|
27.2
|
8.2
|
|
Jul-23
|
26.6
|
36.9
|
36.5
|
-10.0
|
34.8
|
37.6
|
27.6
|
7.3
|
|
Sep-23
|
23.4
|
38.5
|
38.2
|
-14.8
|
33.0
|
38.2
|
28.8
|
4.2
|
|
Nov-23
|
25.2
|
36.6
|
38.2
|
-13.0
|
34.1
|
36.8
|
29.0
|
5.1
|
|
Jan-24
|
27.2
|
36.2
|
36.6
|
-9.4
|
34.6
|
36.4
|
29.0
|
5.5
|
|
Mar-24
|
29.2
|
37.6
|
33.2
|
-4.1
|
35.7
|
37.6
|
26.7
|
9.0
|
|
May-24
|
30.5
|
35.4
|
34.1
|
-3.7
|
37.4
|
35.2
|
27.4
|
9.9
|
[1] The survey results reflect the respondents’ views, which are not necessarily shared by the Reserve Bank. Results of the previous survey round were released on the Bank’s website on April 05, 2024.
[2] CSI and FEI are compiled on the basis of net responses on the economic situation, income, spending, employment and the price level for the current period (as compared with one year ago) and a year ahead, respectively. CSI and FEI = 100 + Average of Net Responses of the above parameters.
[3] Unit-level data for previous rounds of the survey are available on the Bank’s ‘Database on Indian Economy’ (DBIE) portal (weblink: https://dbie.rbi.org.in/#/dbie/home) under the head ‘Unit-level Data’.
[4] ‘Net response’ is the difference between the percentage of respondents reporting optimism and those reporting pessimisms. It ranges between -100 and 100. Any value greater than zero indicates expansion/ optimism and values less than zero indicate contraction/ pessimism.
|
 IST,
IST,