RbiSearchHeader

Press escape key to go back

Past Searches

Theme
Theme
Text Size
Text Size
S3

RbiAnnouncementWeb

RBI Announcements
RBI Announcements

Asset Publisher

83686835

Consumer Confidence Survey: September 2015

The Consumer Confidence Survey provides an assessment of perceptions of respondents on general economic conditions and their own situation during the current period and a year ahead. The survey captures qualitative perceptions on a three-point scale i.e., improve, remain same or worsen, from respondents spread across six metropolitan cities viz. Bengaluru, Chennai, Hyderabad, Kolkata, Mumbai and New Delhi. The information so collected is analysed in two parts – current situation as compared with a year ago and the expectations for a year ahead. The salient findings of the survey, based on the responses of around 5,200 respondents are presented below.

Highlights:

I. Both Current Situation Index (CSI) and Future Expectations Index (FEI) moderated further in the current round as compared to June 2015 round with lower level of optimism in all the parameters, with the exception of perceptions on price level.
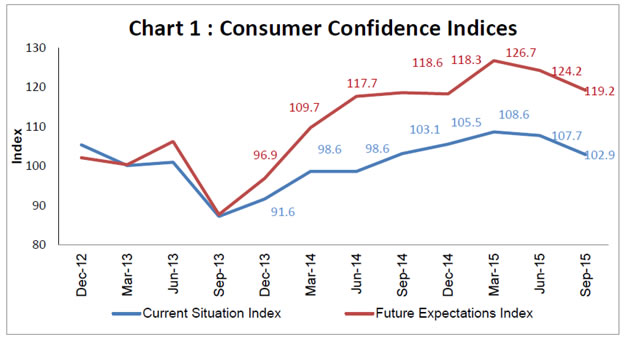
II. Net responses on current as well as future economic conditions decreased as compared to June 2015 round. Moreover, the proportion of respondents reporting improvement in current as well as future economic conditions, which depicted an upward movement since December 2014, declined in September 2015. This was on account of higher proportion of respondents reporting their views on current as well as future economic conditions remaining the same (Table 1).

III. The positive perceptions regarding income, for current and one year ahead periods, exhibited a fall of about 5 percentage points in September 2015, continuing the declining trend seen since September 2014 (Table 2).

IV. The net responses on current as well as future spending, which were above 80 per cent in June 2015, reached a lower level of about 73 per cent in September 2015 (Table 3).

V. As regards perceptions relating to spending on essential items, more than 80 per cent respondents reported increase for the current as well as future period. Further, the proportion of respondents who reported increase in spending on non-essential items declined as compared to June 2015 for both current and one year ahead periods (Tables 4 and 5).

VI. Employment outlook worsened in this round as compared to previous round of the survey and net response for the current period reached negative zone albeit marginally. However, about one-half (47 per cent) respondents expected improvement in employment situation one year ahead (Table 6).

VII. As regards price levels and inflation, current sentiments and future expectations showed improvement in this round of survey (Tables 7 and 8).


Table 1: Perceptions on Economic Conditions
(Percentage responses)
  Compared with 1-year ago 1-year ahead
Dec-14 Mar-15 Jun-15 Sep-15 Dec-14 Mar-15 Jun-15 Sep-15
Improve 30.2 41.7 43.1 36.5 50.9 56.8 57.6 47.7
Remain same 41.2 32.4 27.8 32.7 32.3 26.8 22.3 32.1
Worsen 28.6 25.9 29.1 30.9 16.8 16.4 20.2 20.3
Net Response 1.6 15.8 14.0 5.6 34.1 40.4 37.4 27.4

Table 2: Perceptions on Income
(Percentage responses)
  Compared with 1-year ago 1-year ahead
Dec-14 Mar-15 Jun-15 Sep-15 Dec-14 Mar-15 Jun-15 Sep-15
Increase 38.7 35.4 34.9 29.1 59.8 55.4 52.7 47.1
Remain same 48.0 46.1 43.7 50.4 35.1 35.5 35.6 42.4
Decrease 13.2 18.5 21.4 20.5 5.1 9.1 11.6 10.5
Net Response 25.5 16.9 13.6 8.6 54.7 46.3 41.1 36.6

Table 3: Perceptions on Spending
(Percentage responses)
  Compared with 1-year ago 1-year ahead
Dec-14 Mar-15 Jun-15 Sep-15 Dec-14 Mar-15 Jun-15 Sep-15
Increase 75.7 80.0 87.4 81.0 35.6 78.3 86.2 80.9
Remain same 20.0 13.7 9.5 10.7 35.3 15.8 9.6 11.2
Decrease 4.3 6.3 3.1 8.2 29.2 6.0 4.2 7.9
Net Response 71.4 73.7 84.4 72.8 6.4 72.3 82.0 73.0

Table 4: Perceptions on Spending-Essential Items
(Percentage responses)
  Compared with 1-year ago 1-year ahead
  Mar-15 Jun-15 Sep-15 Mar-15 Jun-15 Sep-15
Increase 85.7 91.8 82.0 80.5 87.0 80.1
Remain same 10.9 6.1 9.7 14.4 8.8 11.6
Decrease 3.4 2.1 8.4 5.2 4.2 8.3
Net Response 82.3 89.7 73.6 75.3 82.8 71.9

Table 5: Perceptions on Spending-Non-Essential Items
(Percentage responses)
  Compared with 1-year ago 1-year ahead
  Mar-15 Jun-15 Sep-15 Mar-15 Jun-15 Sep-15
Increase 41.9 46.9 41.2 43.6 52.3 44.0
Remain same 28.4 25.5 35.0 28.7 24.3 34.2
Decrease 29.7 27.6 23.8 27.7 23.4 21.8
Net Response 12.2 19.3 17.4 15.9 28.9 22.2

Table 6: Perceptions on Employment
(Percentage responses)
  Compared with 1-year ago 1-year ahead
  Dec-14 Mar-15 Jun-15 Sep-15 Dec-14 Mar-15 Jun-15 Sep-15
Improve 36.1 37.6 36.0 31.9 61.1 55.8 53.7 47.1
Remain Same 39.7 35.3 32.2 34.8 29.7 28.7 26.9 33.4
Worsen 24.1 27.2 31.8 33.3 9.3 15.5 19.4 19.5
Net Response 12.0 10.4 4.2 -1.4 51.8 40.3 34.4 27.6

Table 7: Perceptions on Price Level
(Percentage responses)
Compared with 1-year ago 1-year ahead
Dec-14 Mar-15 Jun-15 Sep-15 Dec-14 Mar-15 Jun-15 Sep-15
Increase 85.1 78.8 84.3 80.9 66.7 73.9 82.3 78.0
Remain same 12.6 16.0 9.1 9.4 22.2 17.7 9.1 12.4
Decrease 2.3 5.2 6.6 9.8 11.1 8.4 8.5 9.5
Net Response -82.8 -73.6 -77.6 -71.1 -55.6 -65.5 -73.8 -68.5
Note: Perceptions of increase in prices and inflation are considered to be negative sentiments and decrease in pricesand inflation are considered to be positive sentiments. The net responses are therefore, negative.

Table 8: Perceptions on rate of change in Price Levels (Inflation)
(Percentage responses)
Compared with 1-year ago 1-year ahead
Dec-14 Mar-15 Jun-15 Sep-15 Dec-14 Mar-15 Jun-15 Sep-15
Increase 81.9 82.5 87.9 82.7 81.0 83.5 83.8 81.1
Remain Same 15.9 13.7 9.7 14.6 16.9 12.7 12.9 16.3
Decrease 2.2 3.8 2.4 2.7 2.1 3.7 3.3 2.6
Net Response -79.8 -78.7 -85.5 -80.0 -78.8 -79.8 -80.5 -78.5

1 The June 2015 round of the survey data was published on August 04, 2015 on RBI website. The survey results are based on the views of the respondents and are not necessarily shared by the Reserve Bank of India.

RbiTtsCommonUtility

प्ले हो रहा है
শুনুন

Related Assets

RBI-Install-RBI-Content-Global

RbiSocialMediaUtility

রিজার্ভ ব্যাঙ্ক অফ ইন্ডিয়া মোবাইল অ্যাপ্লিকেশন ইনস্টল করুন এবং সাম্প্রতিক সংবাদগুলিতে দ্রুত অ্যাক্সেস পান!

Scan Your QR code to Install our app

RbiWasItHelpfulUtility

এই পেজটি কি সহায়ক ছিল?