 IST,
IST,
Demand Condition in Manufacturing sector subdued: RBI’s OBICUS Survey for Q1:2016-17
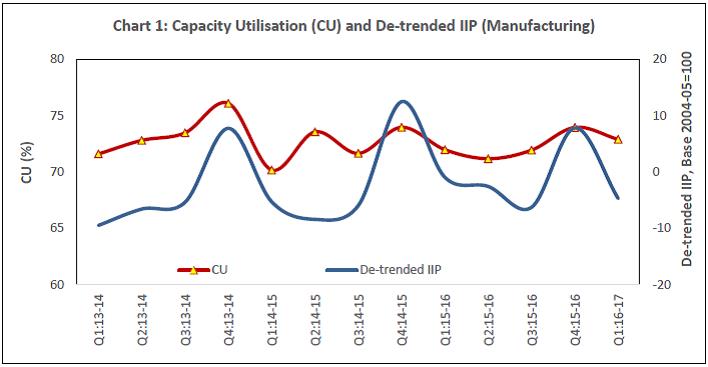
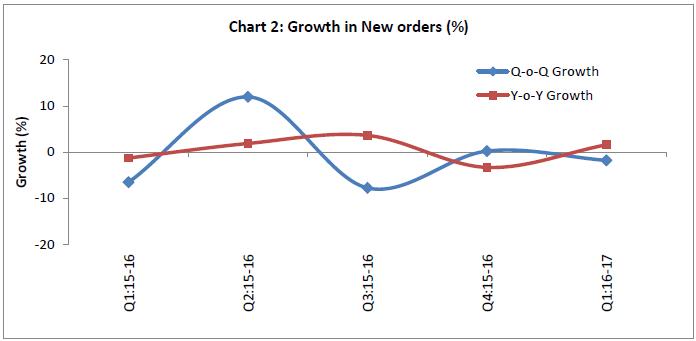
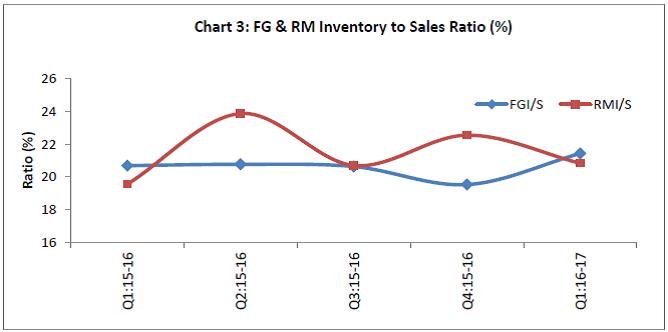
The Reserve Bank of India’s Order Books, Inventories and Capacity Utilisation Survey (OBICUS) for April - June 2016 quarter revealed that recovery in demand condition in the manufacturing sector is yet to gather steam. The OBICUS captures actual data on order books, inventory levels for raw materials and finished goods, and capacity utilisation from companies in the manufacturing sector. The latest 34th round of OBICUS, covers data for Q1:2016-17. In all, 903 manufacturing sector companies responded to the survey. The analysis is based on the data received from a common set of reporting companies for each of these parameters (Tables 1 - 3). The 33rd round (Q4:2015-16) survey results covering 926 manufacturing companies were released on August 9, 2016 on the RBI website. The survey responses are those of the respondents and are not necessarily shared by the Reserve Bank of India Highlights: 1) Capacity Utilisation (CU): At the aggregate level, CU recorded seasonal drop in Q1:2016-17 over the previous quarter and stood at 72.9 per cent. The level, however, was higher than those recorded in the same quarter of previous three years. There was a broad co-movement between capacity utilisation and de-trended Index of Industrial Production1 (IIP) manufacturing, except for some quarters including Q3:2015-16 (Chart 1). 2) Order Books: The new orders growth bounced back to positive territory on a y-o-y basis. However, on a q-o-q basis, it recorded a marginal decline in Q1:2016-17 (Chart 2). 3) Inventory to Sales Ratio: The raw material inventory to sales ratio (RMI/S) was lower in Q1:2016-17 as compared to the previous quarter but was marginally higher than the level recorded in the same quarter a year ago. The finished goods inventory to sales ratio (FGI/S) increased in Q1:2016-17 and was higher as compared to the previous quarter and the same quarter a year ago (Chart 3). ANNEX
1 IIP is calculated on a fixed base (currently, 2004-05=100) whereas the denominator (viz. installed capacity) in CU is updated every quarter. For comparison, trend component of IIP is removed. | |||||||||||||||||||||||||||||||||||||||||||||||||||||||||||||||||||||||||||||||||||||||||||||||||||||||||||||||||||||||||||||||||||||||||||||||||||||||||||||||||||||||||
পেজের শেষ আপডেট করা তারিখ:


