Chapter VII
Financial
Stability Introduction
7.1
Financial stability has emerged as a major objective of public policy in developed
and emerging economies in recent years, and particularly in recent months. Several
factors, such as the increased frequency and high cost of financial crises, emergence
of complex and new exotic financial instruments and significant growth in the
volume of financial transactions, have led to this greater focus on financial
stability. During the past year and a half, financial stability has occupied a
centre stage in policy circles in the wake of the current global financial crises
with wide ramifications. It is widely agreed that recurrence of systemic financial
crises, viz., banking, corporate, currency and sovereign debt crises,
have negative effects on economic growth and lead to significant losses to investors.
A vast body of literature, both empirical and analytical, suggests that in addition
to many other important factors, the performance and long-run economic growth
and welfare of a country are related to its degree of financial development measured
by factors such as size, depth, access, efficiency and stability of a financial
system, including its markets, intermediaries, range of assets, institutions and
regulations.
7.2 As there is no general agreement on the definition of
financial stability and systemic risk, both the terms tend to acquire a contextual
meaning, and the recent developments in the international financial markets have
highlighted new challenges leading to a deeper examination of issues causing instability
as well as crisis management tools. Financial stability does not mean absence
or avoidance of crisis, but presence of conditions conducive to efficient functioning
of the financial system without serious disruption1. Financial stability involves
smooth functioning of the financial system as a whole, both in normal conditions
and in periods of stress. While under normal conditions, the financial system
can be considered to be stable if it is generally free from imbalances, in periods
of stress, financial stability would depend on the ability of financial markets
(in terms of infrastructure and organisation) and participants in these markets
(intermediaries, investors, financial providers) not only to absorb shocks, but
also to work properly (i.e., without major/lasting disruptions) when
confronted with an unexpected shock of any nature (such as burst, bubble or terrorist
attacks). Under this approach to understanding financial stability, there are
two dimensions involved: ex ante, that of preventing the building up
of imbalances in financial markets, and ex post, that of ensuring the
ability of financial markets to accommodate the correction of these imbalances.
Furthermore, in a stable financial system, money is expected to carry out its
function as a means of payment and as a unit of account properly, while at the
same time, the financial system can properly perform its role of mobilising savings,
diversifying risks and allocating resources2.
7.3 Different central banks
have set out some working definitions of financial stability in their publications.
Further, for maintaining financial stability, central banks across countries have
a wide range of legal, institutional and policy frameworks, and policy instruments
at their disposal, which differ from country to country. Nevertheless, the major
common elements that contribute to financial stability are the oversight of the
financial infrastructure, in particular payments systems; regulation and supervision
of financial institutions and markets; crisis management and provision of liquidity;
and macrofinancial stability encompassing monitoring not only the behaviour of
all important players in the financial sector but also non-financial sector balance
sheets as well as those of the governments.
7.4 The financial turmoil
that began to unfold in August 2007 - widely known as the sub-prime crisis - has
brought financial stability issues to the forefront of policy discussions. The
turmoil was a fallout of an exceptional credit boom and leverage in the financial
system. On a hindsight, the present crisis appears to be a result of a macroeconomic
environment with a prolonged period of low interest rates, high liquidity and
low volatility, which led financial institutions to underestimate risks, a breakdown
of credit and risk management practices in many financial institutions, and shortcomings
in financial regulation and supervision3. A slowdown in the US real estate market
triggered a series of defaults and this snowballed into accumulated losses, especially
in the case of complex structured securities. The US subprime crisis has led to
both the strained conditions of financial markets and the slowdown of the broader
economy. The US economy continues to confront substantial challenges, including
stresses in financial markets, a weakening labour market and deteriorating economic
activity. The problems intensified significantly around mid-September 2008, when
major losses led to failure of major financial institutions. The recent troubles
at Lehman Brothers, Merrill Lynch, and Fannie Mae and Freddie Mac suggest the
deep rooted problem in the global financial markets that the authorities have
to address.
7.5 The ongoing financial turmoil took a serious turn when
major financial institutions started experiencing extreme degrees of difficulty.
Bear Stearns was the big first wall street investment banks of the five to collapse
in March 2008, followed by the filing of chapter 11 bankruptcy petition by Lehman
Brothers Holdings inc. and the sale of Merrill Lynch to Bank of America in September
2008. The remaining two, Goldman Sachs and Morgan Stanley, have abandoned their
once-cherished investment bank business model to become bank holding companies
to secure greater Fed protection and to soothe negative market sentiments. This
was soon followed by the takeover of the sixth largest bank, Wachovia, by the
CitiGroup. The recent turn of events prompted the US Government to come out with
a $700 billion bail out package for banks to buy the distressed assets. Full prudential
supervision and regulation at the hands of the central bank and the Federal Deposit
Insurance Corporation would provide them access to permanent liquidity and funding
by the Fed. Though the Fed had allowed investment banks to access discount window
financing since Bear Stearns crumbled, this source was set to close at an unspecified
point in 2009. The Securities and Exchanges Commission (SEC) was previously responsible
for the supervision of the investment banks under the voluntary consolidated supervised
enterprises regime. Lighter regulation of investment banks had enabled the industry
reap greater rewards than their commercial banks counterparts in the boom preceding
the credit crisis. But the crunch has revealed the drawbacks of the industry's
high-risk strategy. The shocks in the US financial system have reverberated in
some European countries as well such as the UK, Switzerland and Germany. Though
the direct impact on India and other Asian emerging market economies (EMEs) was
muted, the indirect impact has been significant.
7.6
The initial impact of global financial contagion in India, however, has been limited
for a variety of reasons. India's growth process has been largely domestic demand
driven and its reliance on foreign savings has remained around 1.5 per cent of
GDP in the recent period. It also has a comfortable level of forex reserves. The
credit derivatives market is in an embryonic stage; the originate-to-distribute
model in India is not comparable to the ones prevailing in advanced markets and
there are restrictions on investments by residents in such products issued abroad.
Regulatory guidelines on securitisation do not permit immediate profit recognition.
However, some impact has been felt through the credit, equity and the foreign
exchange markets. Risk aversion, deleveraging and frozen money markets have not
only raised the cost of funds for Indian corporates, but also its availability
in the international markets. This additional demand for funds spilled over to
the domestic credit market. Reduced investor interest in emerging economies has
led to reversal of portfolio flows affecting the equity and the foreign exchange
markets. The impending recession in the US and other advanced economies would
also impact Indian exports and the growth momentum. Several measures have been
initiated to mitigate the impact of global financial crisis on the domestic financial
markets and its spillover impact on the real economy. 7.7 The global financial
turmoil has reinforced the importance of putting special emphasis on preserving
financial stability. Financial stability in India has been achieved through perseverance
of prudential policies which prevent institutions from excessive risk taking,
and financial markets from becoming extremely volatile and turbulent4. With increasing
priority being given to financial stability, the central task for the conduct
of monetary policy has become more complex and challenging than before. The current
challenge is to strike an optimal balance between preserving financial stability,
maintaining price stability, anchoring inflation expectations, and sustaining
the growth momentum5. The relative emphasis between these objectives has varied
from time to time, depending on the underlying macroeconomic conditions.
7.8 The recent developments in the global financial markets have been closely
followed by market participants, central bankers, supervisors, multilateral institutions,
political leaders, analysts, academicians, and also the general public. The ongoing
debates cover several stability issues in the areas of regulation and supervision
of institutions and markets, risk management strategies and practices of institutions,
safety net and liquidity backstops. Simultaneously, the vexed issue of light versus
tight regulation have also been receiving considerable attention. Financial stability
in the current context is also being viewed in terms of a trade-off between risk
and innovation/return. A financial system that is heavily regulated and supervised
may be very stable and not prone to experiencing financial crises in contrast
to a financial system that is very free and innovative and which is lightly regulated
and supervised. A controlled system to its disadvantage could have lower financial
development and innovation compared with a free and innovative system that increases
returns, diversifies risks, and better allocates resources to the highest-return
investments. The latter, however, may eventually become unstable and trigger credit
booms and asset bubbles that could severely affect growth, returns and welfare.
Though there is some trade-off between the stability of the financial system and
its degree of innovation and sophistication, financial stability remains an important
input in the process of financial development6. While there is a need for regulation
staying ahead of the curve through continuous upgradation of skills and instruments,
it is important to exercise caution so that regulation does not get so stringent
as to stifle innovation.
7.9 Keeping in view the need to enhance the
resilience of the global system, several menus of prescriptions have been proffered
for the consideration of the policymakers, which mostly cover issues such as enhancing
transparency, strengthening risk management frameworks including the governance
arrangements in banks and financial institutions, refining Basel II, reforming
deposit guarantee schemes, regulating rating agencies, and modifying monetary
policymakers' operational frameworks. The policy dilemmas have become more acute
at the current juncture. There are also calls for fundamental rethinking on macroeconomic,
monetary and financial sector policies to meet the new challenges and realities
alongwith inflation and structural shifts in the international financial architecture
involving an enhanced degree of coordination among monetary authorities and regulators.
A review of the policies relating to financial regulation, in a way, needs to
address both the acute policy dilemmas in the short run and a fundamental rethink
on broader frameworks of financial and economic policies over the medium-term. 7.10
The chapter reviews and analyses the developments in the Indian financial system
from a financial stability perspective, particularly during 2007-08 and April-October
2008. The chapter is organised into five sections. Following the introductory
section, section 2 presents an assessment of the performance of the Indian financial
system covering financial institutions, financial markets as well as the payment
and settlement systems. Under financial institutions, the commercial and co-operative
banks, financial institutions, and non-banking financial companies are discussed,
while financial markets cover developments in the money, foreign exchange and
Government securities markets, besides the capital market. Section 3 identifies
and discusses various risks emerging from global and domestic factors that may
have a bearing on maintaining financial stability in India. The recent financial
turbulence, as well as the challenges and issues brought out by the recent experience
are also dealt with in detail in this section. Section 4 presents the ways of
mitigating such risks emerging in the evolving macrofinancial conditions. Section
5 presents an overall assessment of the financial stability conditions in India.
2. An Assessment of the Indian Financial System
7.11 The Indian financial system comprises a wide network of financial institutions,
financial markets and financial infrastructure. The financial institutions in
India mainly consist of commercial banks (including regional rural banks - RRBs),
urban cooperative banks, rural co-operative banks, (which, in turn, comprise short-term
cooperative credit structure (state co-operative banks and district central co-operative
banks) and long-term credit structure (state cooperative agriculture and rural
development banks and primary co-operative agriculture and rural development banks)],
non-banking financial companies, insurance companies and mutual funds. A major
feature of the financial system is the divergence in regulation and supervision
over different institutions and segments of the financial markets.
7.12
Scheduled commercial banks form the bedrock of the Indian financial system accounting
for around three-fourths of the total assets of all financial institutions, and
their regulation and supervision falls under the ambit of the Reserve Bank as
mandated in the Banking Regulation Act, 1949 and the Reserve Bank of India Act,
1934. The main elements of the regulatory framework, which have evolved from time
to time, comprise, inter alia, prudential and exposure norms, accounting
standards and disclosure norms. The Reserve Bank also regulates primary dealers
(PDs), select all-India financial institutions (AIFIs) and non-banking financial
companies (NBFCs). Urban co-operative banks (UCBs) are regulated by the Reserve
Bank and the respective State Governments/ Central Government. In November 1994,
the Board for Financial Supervision (BFS) was constituted comprising members of
the Reserve Bank Board with a variety of professional expertise to exercise 'undivided
attention to supervision' and ensure an integrated approach to supervision of
commercial banks, AIFIs, NBFCs, UCBs and PDs. As on March 31, 2008, the BFS had
supervisory jurisdiction over 79 scheduled commercial banks (62,099 branches),
4 local area banks, 91 regional rural banks (RRBs), 1,770 urban co-operative banks,
12,834 non-banking financial companies, 4 financial institutions (FIs) and 19
primary dealers. Insurance companies are regulated by the Insurance Regulatory
and Development Authority (IRDA) and mutual funds and securities market by the
Securities and Exchange Board of India (SEBI). In this section, developments in
financial institutions, financial markets and financial infrastructure during
2007-08 and 2008-09 (period for which data are available) are analysed from the
standpoint of financial stability.
Financial Institutions
7.13 The Reserve Bank continued to build a regulatory and supervisory architecture
in line with the international best standards with country-specific adaptations
with the ultimate objective of improving the efficiency and performance of the
Indian financial sector. Various regulatory and supervisory measures were initiated
by the Reserve Bank relating to banks and other financial institutions during
2007-08 (for policy developments in commercial banking, co-operative banking and
non-banking financial institutions refer to Chapter II, IV and VI, respectively).
The year witnessed major progress in the implementation of the New Capital Adequacy
Framework (Basel II). The Pillar II guidelines were issued during the year. Certain
amendments were also carried out in the framework issued earlier. Newer avenues
of raising capital were provided to banks to accord them with greater flexibility
in meeting the Basel II requirement. Special emphasis was laid upon liquidity
and asset-liability management. Significant measures were also undertaken in the
areas of anti-money laundering (AML) and know your customer (KYC) guidelines.
Important initiatives in the area of corporate governance included guidelines
on corporate social responsibility, sustainable development and non-financial
reporting and guidelines on 'fit and proper' criteria for elected directors on
the boards of public sector banks7. Policy initiatives relating to customer service
included guidelines for recovery agents and grievance redressal mechanism. 7.14
UCBs were provided with greater business opportunities and capital raising options.
Of the financial institutions supervised by the Reserve Bank, Industrial Finance
Corporation of India Ltd. (IFCI) and Tourism Finance Corporation of India Ltd.
(TFCI) were restored the NBFC status during the year. Industrial Investment Bank
of India (IIBI) is in the process of being wound up. Important developments relating
to NBFCs included formulation of regulatory framework for mortgage guarantee companies
and various measures in the area of prudential guidelines and customer service.
The efforts to strengthen the NBFCs continued with a focus on systemically important
financial institutions within the sector.
7.15 The Board for Financial
Supervision reviewed the inspection findings in respect of commercial banks/urban
co-operative banks, periodical reports on critical areas of functioning of banks
such as reconciliation of accounts, frauds monitoring, overseas operations, financial
position of banks under monthly monitoring and issued a number of directions with
a view to strengthening the functioning of banks. Future set up of local area
banks, disclosure of supervisory ratings of banks and banks' exposure to the real
estate sector were some other important issues examined by the BFS. A review of
the role and set up of the financial institutions was undertaken with a view to
providing clarity on their regulatory and supervisory architecture and their emerging
role in the financial sector. Small Industries Development Bank of India (SIDBI)
was advised to increase the risk weights on its exposure to State Financial Corporations
(SFCs), make full provisioning in respect of SFCs which had defaulted even after
extension of restructuring/one time settlement (OTS) packages and revise the norms
for asset classification to 'borrowerwise' instead of 'facility wise' in respect
of its exposures to SFCs. Supervisory actions for UCBs were designed on the basis
of Task Force for Urban Co-operative Banks (TAFCUB)'s recommendations. To contain
the systemic risks arising out of the NBFCs sector, a fair practice code was designed,
asset finance company (AFC) was introduced as a new class of NBFC, and the BFS
deliberated upon the future set up of SIDBI and future framework of NHB.
7.16 Owing to the various initiatives taken since the early
1990s, the Indian financial system has become robust over the last few years and
has displayed resilience to withstand the shocks. The commercial banking system
in India has become strong, sound and competitive following the various measures
taken to bring it in line with the global best practices. However, as the RRBs
and the co-operative banks lagged behind in terms of soundness and efficiency
after strengthening the commercial banking segment, the Reserve Bank and the Government
in recent years have been bestowing greater attention to them. The banking and
non-banking institutions are performing in a competitive environment and their
regulatory framework is now aligned with the international best practices. The
biggest achievement was in the case of UCB sector, wherein treading the path suggested
in the vision document for UCBs 2005, the restructuring of the UCB sector succeeded
in bringing about substantial improvement in the performance of the sector.
Scheduled Commercial Banks
7.17 The profitability
of the scheduled commercial banks in India has improved over the years. Despite
upturn in interest rate cycle in the recent period, SCBs have been able to maintain
their return on assets. A significant improvement in the asset quality is reflected
in the decline in gross and net NPA ratios, which are now comparable with the
international standards. The strong capital position of the banking sector, which
is significantly above the regulatory requirement of 9 per cent, has provided
them with the much needed cushion to withstand shocks and other emerging risks.
The performance of SCBs continued to improve during 2007-08 with return on assets
(RoA) of SCBs showing an improvement to 1.0 per cent (from 0.9 per cent), capital
adequacy ratio of SCBs improving further to 13.0 per cent (from 12.3 per cent)
and gross NPA ratio declining to 2.3 per cent (from 2.5 per cent) (refer Chapter
III for details).
Soundness and Efficiency Indicators: India
vis-à-vis Other Countries
7.18 Several balance sheet
and profitability indicators suggest that the Indian banking sector now compares
well with the global benchmarks. The Indian banking system has been assessed in
international perspective by comparing various financial and soundness indicators
such as return on total assets, non-performing loans ratio and capital levels.
The assessment could provide an indication of the areas where the Indian banking
system needs to be strengthened further.
7.19 One of the most widely
used indicators of profitability is RoA, which indicates the commercial soundness
of the banking system. RoA of Indian scheduled commercial banks was at 1.0 per
cent at end-March 2008, which is line with the international standards. Globally,
the range varied from 0.2 per cent to 4.2 per cent in 2008. The RoA in several
advanced countries and some emerging market economies were less than one per cent
(Table VII.1).
Table
VII.1: Benchmarking of Indian Banking Sector-2008 |
(Per
cent) | Country | Return
on | Gross
NPL to | CRAR | Provisions
to | Capital
to |
| Assets | Gross
Adv. |
| NPL | Assets |
1 | 2 | 3 | 4 | 5 | 6 |
India | 1.0 | 2.3 | 13.0 | 52.4 | 6.3 |
Emerging Markets | | | | | |
Argentina | 1.7 | 2.8 | 16.8 | 122.3 | 12.6 |
Brazil | 2.8 | 2.9 | 18.1 | 181.7 | 9.5 |
Mexico | 2.9 | 2.1 | 16.0 | 184.0 | 14.1 |
Korea | 0.9 | 0.8 | 12.0 | 183.8 | 8.8 |
S. Africa | 1.4
* | 1.4 * | 12.8
* | - | 7.9
* | Developed Countries | | | | | |
US | 0.6 | 1.7 | 12.8 | 88.9 | 10.2 |
UK | 0.4
* | 0.9 * | 12.6
* | 54.6 ^ | 8.9
^ | Japan | 0.3 | 1.4 | 12.3 | 26.4 | 4.3 |
Canada | 0.3 | 0.9 | 12.3 | 36.7 | 5.3 |
Australia | 1.0
* | 0.3 | 10.5 | 128.6 | 4.1 |
Memo Item: | | | | | |
Global Range | | | | | |
Minimum | 0.2 | 0.3 | 10.0 | 26.4 | 3.5 |
| (Montenegro) | (Australia) | (Sweden) | (Japan) | (Netherlands) |
Maximum | 4.2 | 13.2 | 28.7 | 187.5 | 22.7 |
| (Moldova) | (Bangladesh) | (Moldova) | (Chile) | (Armenia) |
- : Not available.
* :
Data pertains to 2007.
^ : Data pertains to 2006.
Source : IMF,
Global Financial Stability Report, April 2008. | 7.20 Quality
of assets of banks as reflected in the ratio of non-performing loans (NPLs) to
total advances is also an important banking soundness indicator from the financial
stability perspective. A low level of NPL ratio not only reflects the prudent
business strategy followed by the banking system, but is also indicative of the
conducive recovery climate and the legal framework for recovery of loans. Banks
with adequate credit risk management practices are expected to have lower non-performing
loans. In India, several measures taken by the Government and the Reserve Bank
have enabled SCBs to substantially reduce their level of NPLs from 15.7 per cent
at end-March 1997 to about 11 per cent at end-March 2001 and further to 2.3 per
cent at end-March 2008. The global range for NPLs varied widely between 0.3 per
cent and 13.2 per cent in 2008. The ratio of provisioning to NPLs reflects the
ability of a bank to withstand losses in asset value. A low ratio of provisioning
to NPLs makes the banking system vulnerable to shocks. The provisioning to NPL
ratio of Indian banks was 52.4 per cent at the end-March 2008, as against the
global range of 26 per cent and 187 per cent.
7.21 Bank capital acts
as the ultimate buffer against losses that a bank may suffer. The minimum capital
to risk-weighted asset ratio (CRAR) has been specified at 8 per cent by the Basel
Committee on Banking Supervision (BCBS) under both the Basel I and Basel II frameworks.
In the Indian context, the overall capital adequacy of the SCBs at 13.0 per cent
as at end-March 2008, was well above the Basel norm of 8 per cent and the stipulated
norm of 9 per cent for banks in India. The CRAR of 56 banks was over 12 per cent,
of 21 banks was between 10-12 per cent, while those of the remaining two banks
was between 9 and 10 per cent. The CRAR of Indian banks was comparable with most
emerging markets and developed economies. The global range of CRAR in 2008 varied
between 10.0 per cent and 28.7 per cent. A capital to asset ratio is another simple
measure of soundness of a bank. The lower the ratio, the higher is the leverage
and greater vulnerability of a bank. Globally, the ratio varied between 3.5 per
cent to 22.7 per cent in 2008, while Indian banks' capital to assets ratio at
6.3 per cent suggested a lower degree of leverage and higher stability.
7.22 The financial sector in India is sound and healthy. Indian
banks do not have direct financial exposure to the US sub-prime assets. Foreign
subsidiaries and foreign branches of Indian banks have suffered some mark-to-market
losses on financial instruments due to the general widening of credit spreads.
These losses are modest relative to the size of their business for which adequate
provisioning has been made.
7.23 Consequent upon filling of bankruptcy
under Chapter 11 by Lehman Brothers, all banks were advised to report the details
of their exposures to Lehman Brothers and related entities both in India and abroad.
Out of 77 reporting banks, 14 reported exposures to Lehman Brothers and its related
entities either in India or abroad. An analysis of the information reported by
these banks revealed that most of the exposures reported by the banks pertained
to subsidiaries of Lehman Bros Holdings Inc. which are not covered by the bankruptcy
proceedings. Overall, these banks' exposure especially to Lehman Brothers Holding
Inc. which has filed for bankruptcy is not significant and banks are reported
to have made adequate provisions.
Urban Co-operative Banks
7.24 The UCB sector has witnessed significant improvement as a result of
effective implementation of the suggestions made in the Vision Document released
in March 2005. The first memorandum of understanding signed with Andhra Pradesh
State Government in 2005 marked a new beginning for the co-operative sector. With
the signing of Memoranda of Understanding (MoUs) between the Reserve Bank and
the respective State Governments, a long standing issue of dual control of urban
co-operative banks was attempted to be addressed. Between June 2005 and October
20, 2008, MoUs have been signed with 23 State Governments and with the Central
Government in respect of multi-State UCBs, out of which 6 States signed MoU during
2007-08. In terms of the MoUs, Task Force on Urban Co-operative Banks (TAFCUB)
has been constituted in each of the 23 States and also with the Central Government
in case of multi-State UCBs. In all 1,745 UCBs (98.6 per cent) have been covered
under the MoUs representing 99.2 per cent of deposits of the sector. The mechanism
of TAFCUBs has been able to restore the confidence in the UCB sector and there
has been significant improvement in its operation and financial performance. A
number of measures to strengthen the sector were initiated in the past five years.
The option of merger/amalgamation, wherever necessary, was made available for
revitalising and rehabilitating weak scheduled UCBs; consideration given to requests
for shifting branches from one city to another within the same State, subject
to certain conditions, and further professionalisation of their managements.
7.25 The above mentioned initiatives brought about a turnaround in the performance
of UCBs. The number of Grade III and Grade IV UCBs taken together, implying weakness/
sickness in UCBs, declined from 725 as at end-March 2005 to 496 as at end-March
20088 (refer Chapter IV for details).
7.26 The overall asset quality
of UCBs also improved with the gross NPAs of the UCBs declining from 23.2 per
cent of total advances in 2005 to 16.4 per cent in 2008. The increased public
confidence in the UCB sector is reflected in the growth in their deposits by 14.1
per cent during 2007-08 as compared with the increase of 6.4 per cent during 2006-07
and 8.6 per cent in 2005-06, and against the negative growth of 4.8 per cent in
2004-05.
7.27 The increased comfort of coordinated supervision/regulation
in States that have signed MOUs enabled the Reserve Bank to provide additional
business opportunities to the eligible UCBs in such States and to the multi-State
UCBs. These facilities included permission to set up currency chests, to sell
mutual fund products, conduct insurance business on a non-risk participation basis,
open new automated teller machines (ATMs), convert extension counters into branches
and deal in foreign exchange as authorised dealers in categories I and II. Encouraged
by the performance of the sector, the Reserve Bank decided to issue fresh licences
from July 2008. As announced in the Annual Policy Statement for 2007-08, financially
sound UCBs in such States were also permitted to open new branches, a facility
which was discontinued in 2004. UCBs have been an important segment of Indian
banking, and a healthy UCB sector is expected to play a vital role in strengthening
competition and imparting stability to the Indian financial system (Box
VII.1).
Non-Banking Financial Companies
7.28 NBFCs as an important segment of the financial sector play a crucial
role in enhancing credit delivery to the dispersed, underbanked and underserviced
sections of the economy. Apart from ensuring that the public deposit taking companies
and systemically important non-deposit taking companies were well regulated, the
Reserve Bank also initiated measures to further strengthen their asset base. The
high dependence of NBFCs on banks for sources of funds raises the systemic risk
in the financial system. In recent years, the Reserve Bank has taken measures
to bring the regulatory norms for non-banks closer to those of banks, and also
to make them uniform for deposit taking NBFCs (NBFCs-D) and non-deposit taking
NBFCs (NBFCs-ND) (refer Chapter VI for details). Apart from providing a level
playing field and reducing the 'regulatory arbitrage', these measures would also
help reduce systemic risk in their operations, and thereby promote financial stability. Box
VII.1: Co-operative Banks and Financial Stability Given the significant
role played by urban co-operative banks in providing banking services to the middle
and lower income people of India, their contribution to increasing financial deepening
can hardly be over emphasised. Furthermore, co-operative banks in the Indian financial
system mitigate credit-rationing to certain market segments, particularly SMEs.
They could also be considered to have positive effects on stability by way of
instilling greater competition.
The presence of co-operative banks also
seems to have a positive effect on the solvency of the banking system. Using data
from several banking systems, Hesse and Cihàk (2007) found that: (i) co-operative
banks are more stable than commercial banks due to the lower volatility of their
returns, and that (ii) the overall impact of a higher cooperative presence on
bank stability is positive. In addition co-operative banks have higher capital
ratios.
Hesse and Cihak find, somewhat surprisingly, that co-operative
banks in advanced economies and emerging markets are more stable than commercial
banks, as reflected in their high z-scores. The z-score measures the number of
standard deviations a return realisation has to fall in order to deplete equity,
under the assumption of normality of banks' returns. A higher z-score corresponds
to a lower upper bound of insolvency risk - a higher z-score therefore implies
a lower probability of insolvency risk.
This high z-scores of co-operative
banks is due to much lower volatility of the co-operative banks' returns, which
offsets their relatively lower profitability and capitalisation. This finding
is quite robust with respect to various modifications in the measurement of volatility
and z-scores. This observed lower variability of returns, and therefore the higher
z-scores, are most likely caused by the fact that co-operative banks in normal
times pass on most of their returns to customers, but are able to recoup that
surplus in weaker periods. To some extent, this result could also reflect the
mutual support mechanisms that many co-operative banks have created. Other risk
measurements such as the value at risk concept or bank risk based on stock market
data (distance-to-default) are not feasible since co-operatives are seldom listed
on the stock exchanges (except for demutualised co-operatives).
A greater
presence of co-operative bank could mean less space for commercial banks in the
retail market and, therefore, their greater reliance on less stable revenue sources
such as corporate banking or investment banking. This could have contributed to
lower z-scores for commercial banks. This finding is consistent with Goodhart's
(2004) hypothesis that the presence of nonprofit-maximising entities in a financial
system can weaken its stability. This is a reflection of the fact that the direct
effect of higher z-scores in co-operative banks is largely offset by the negative
impact of a higher co-operative bank presence on z-scores in commercial banks.
The overall impact of a higher presence of co-operative banks on banking sector
stability was thus slightly positive on an average, but insignificant in some
specifications. While interpreting the results, it is important to keep in view
some caveats of the z-score such as its reliance on accounting data and its focus
on capital and profits rather than, say, liquidity or asset quality. Some possible
alternatives to the z-scores, such as ratings of cooperative banks were also not
found to be substantially worse than those for commercial banks.
Co-operatives
typically face corporate governance issues that are larger than, and in some cases
absent from, commercial banks (Caves and Fish, 2006). Among them is the presence
of an owner-less endowment since members of co-operatives are only invested with
the notional value of their shares and have no right to the accumulated capital.
Furthermore, there is a collective action problem which might lead to empire building
by the management. The governance framework of co-operative banks may hamper raising
capital, particularly at time of distress, complicating the bank resolution process
- especially for large banks -and may not provide adequate incentives to control
the banks' management (Gutiérrez, 2008).
Co-operative banks can
derive important benefits by forming networks, as it allows the pursuit of economies
of scale and scope, and the provision of a safety net or mutual support mechanism.
However, the more complex structure could also create new challenges for financial
stability. Desrochers and Fischer (2005), in a cross-country survey on the level
of integration of systems of financial cooperatives, note that lateral contracts
between co-operative partners involve risks that counterparts will behave opportunistically
to appropriate the rent generated by the alliance.
References:
Hesse, Heiko and Martin Cihák. 2007. “Cooperative Banks
and Financial Stability.” IMF Working Paper. WP/07/2. January.
Allen, Franklin. and Douglas Gale. 2004. “Competition and Financial Stability.”
Journal of Money, Credit and Banking. Vol. 36. No. 3. pp. 453–80.
Barth, James R., Gerard Caprio Jr. and Ross Levine. 1999. “Banking
Systems Around the Globe: Do Regulation and Ownership Affect Performance and Stability?”
World Bank Policy Research Working Paper No. 2325. Washington: World
Bank.
Cuevas, Carlos and Klaus Fischer. 2006. “Co-operative Financial
Institutions: Issues in Governance, Regulation, and Supervision.” World
Bank Working Paper No. 82. Washington: World Bank.
Gutiérrez,
Eva. 2008. “The Reform of Italian Co-operative Banks: Discussion of Proposals.”
IMF Working Paper 74. March.
Goodhart, C.A.E. 2004. “Some
New Directions for Financial Stability.” The Per Jacobsson Lecture.
Basel: Bank for International Settlements. 7.29 An analysis of the sources
of funds for NBFCs revealed that a few NBFCs relied heavily on funds from debt-oriented
mutual funds, which subscribed to Commercial papers, non-convertible debentures
and other structured products issued by them, thus creating an unsustainable asset-liability
structure with short-term funds financing long-term assets. As mutual funds faced
redemption pressures since June 2008 with several investors, especially institutional
investors, rollover of maturing short-term instruments of NBFCs became difficult
and fresh subscriptions dried up. Besides, the liquidity crunch faced by some
banks made them reluctant to lend to NBFCs. In view of the liquidity constraints
faced by NBFCs, the Reserve Bank initiated several measures to enhance availability
of liquidity to NBFCs such as permitting NBFCs-ND-SI to augment their capital
funds by issue of perpetual debt instruments (PDI) and as a temporary measure,
permitting NBFCs-ND-SI to raise short-term foreign currency borrowings under the
approval route, subject to certain conditions. The Reserve Bank also permitted
banks, on a temporary basis, to avail liquidity support under the liquidity adjustment
facility (LAF) window through relaxation in the maintenance of statutory liquidity
ratio (SLR) to the extent of up to 1.5 per cent of their NDTL to be used exclusively
for the purpose of meeting the funding requirements of NBFCs and mutual funds.
7.30 In the light of international developments and increasing exposure of
banks to systemically important NBFCs, the regulations in respect of capital adequacy,
liquidity and disclosure norms were reviewed in August 2008. Besides enhancing
the CRAR from March 2009, a reporting mechanism regarding ALM was introduced for
NBFCs-ND SI which would commence from January 2009 (refer Chapter VI for details). Mutual
Funds
7.31 Mutual funds have emerged as an important medium
for directing individual savings to the capital market, thereby facilitating small
retail investors' participation in the capital market. However, over the years,
the corporates also invested heavily in units of mutual funds, partly due to tax
benefits. The share of individuals in the total net asset value of all mutual
funds declined to 37 per cent at end-March 2008 from 42 per cent in the previous
year, while that of corporates/ institutions/others rose to 57 per cent from 50
per cent in the previous year. Net funds mobilised by mutual funds (net of redemptions)
during 2007-08 rose sharply by 63.6 per cent to Rs.1,53,801 crore (Table
VII.2). Accordingly, the net assets under management of mutual funds industry
increased by 54.8 per cent during 2007-08. A significant increase in net mobilisation
of resources by mutual funds was partly due to 'tax arbitrage'. While interest
from bank deposits is taxable at the hand of the depositors at the eligible marginal
rate of taxation, barring long-term deposits of 5 years and above which enjoy
Section 80-C benefits, investments in equity oriented mutual fund schemes are
exempt from long-term capital gains, while short-term capital gains are taxed
at 15 per cent9.
7.32 In line with the recent trend, bulk of the net
resources mobilised by mutual funds during 2007-08 (67.5 per cent) were constituted
by income/debt-oriented schemes, while growth/equity-oriented schemes accounted
for 30.5 per cent (Table VII.3). The net assets under income/debt-oriented
schemes increased sharply by 61.7 per cent during 2007-08 over the previous year,
while net assets under growth/equity-oriented schemes increased by 38.8 per cent
during the same period. While higher interest rates seemed to have made the debt
schemes more attractive to the investors, resource mobilisation through growth/equity-oriented
schemes during the year was supported by the robust performance of the domestic
stock markets.
Table
VII.2: Resource Mobilisation by Mutual Funds |
(Rs.
crore) | Category | 2006-07 | 2007-08 |
| Gross | Net | Net
Assets* | Gross | Net | Net
Assets* |
| Mobilisation | Mobilisation@ |
| Mobilisation | Mobilisation@ |
|
1 | 2 | 3 | 4 | 5 | 6 | 7 |
Private Sector | 15,99,873 | 79,038 | 2,62,079 | 37,80,753 | 1,33,304 | 4,15,621 |
Public Sector | 1,96,340 | 7,621 | 28,725 | 3,37,498 | 9,820 | 41,123 |
UTI Mutual Fund | 1,42,280 | 7,326 | 35,488 | 3,46,126 | 10,677 | 48,408 |
Total | 19,38,493 | 93,985 | 3,26,292 | 44,64,377 | 1,53,801 | 5,05,152 |
@ : Net of redemptions. * :
As at the end of March.
Source: Securities and Exchange Board
of India. | 7.33 During April-October 2008, mutual funds
witnessed net outflow of funds of the order of Rs.44,319 crore. Consequently,
investments of mutual funds in the equity market and money market declined significantly
during the current financial year so far. In the wake of the tight liquidity conditions
since June 2008, mutual funds have faced redemption pressures. Despite the liquidity
measures taken by the Reserve Bank during September-November 2008, most fund managers
adopted a cautious approach and preferred to invest only in non-convertible debentures
having daily put/call options in anticipation of impending third instalment of
advance corporate tax by mid-December 2008. Typically, mutual fund schemes witness
large outflows during advance tax payments.
Table
VII.3: Funds Mobilised by Mutual Funds - Type of Schemes |
(Amount
in Rs. crore) | Scheme | 2006-07 | 2007-08 |
| No.
of | Gross | Net | Net | No.
of | Gross | Net | Net |
| Schemes | Mobilisation | Mobilisation@ | Assets* | Schemes | Mobilisation | Mobilisation@ | Assets* |
1 | 2 | 3 | 4 | 5 | 6 | 7 | 8 | 9 |
A. Income/Debt | | | | | | | | |
Oriented Schemes | 450 | 18,39,669 | 64,067 | 1,93,584 | 593 | 43,17,263 | 1,03,867 | 3,12,997 |
(i) Liquid/Money Market | 55 | 16,26,790 | 4,985 | 72,006 | 58 | 34,32,737 | 14,976 | 89,402 |
(ii) Gilt | 28 | 1,853 | -964 | 2,257 | 30 | 3,180 | 434 | 2,833 |
(iii) Debt (other than | | | | | | | | |
assured return) | 367 | 2,11,026 | 60,046 | 1,19,321 | 505 | 8,81,346 | 88,457 | 2,20,762 |
B. Growth/Equity | | | | | | | | |
Oriented Schemes | 267 | 94,352 | 28,206 | 1,23,598 | 313 | 1,26,287 | 46,933 | 1,72,742 |
(i) ELSS | 40 | 4,669 | 4,453 | 10,212 | 43 | 6,448 | 6,151 | 16,020 |
(ii) Others | 227 | 89,683 | 23,753 | 1,13,386 | 270 | 1,19,839 | 40,782 | 1,56,722 |
C. Balanced Schemes | 38 | 4,473 | 1,711 | 9,110 | 37 | 11,488 | 5,768 | 16,283 |
D. Exchange Traded | | | | | | | | |
Funds | N.A. | N.A. | N.A. | N.A. | 13 | 9,339 | -2,767 | 3,130 |
E. Fund of Funds | | | | | | | | |
Scheme | 33 | 2,854 | 1,164 | 2,215 | 37 | 3,567 | 1,162 | 3,742 |
Total (A+B+C+D) | 755 | 19,38,494 | 93,984 | 3,26,293 | 943 | 44,64,377 | 1,53,801 | 5,05,152 |
@ : Net of redemptions.
* : As at the end of March.
Source: Securities and Exchange
Board of India. | Developments in the Financial
Markets
7.34 The critical role of developed and well-integrated
financial markets can hardly be overemphasised for sustaining high growth, for
the effective conduct of monetary policy, for developing a diversified financial
system, for financial integration and for ensuring financial stability. Financial
markets are becoming increasingly integrated, which has brought with it considerable
benefits by way of increased access to finance, more efficient allocation of capital,
and greater diversification of risk. On the downside, however, the increasing
complexity and integration of financial markets have brought with it new and constantly
evolving challenges for authorities in mitigating financial stability risks as
developments in one market are quickly transmitted to other markets as has been
amply demonstrated during the recent financial market turmoil. Financial markets
today deal with complex and sophisticated products which require clear regulatory
frameworks, and appropriate institutions and human resource skills. Financial
markets are often governed by herd behaviour and contagion that could lead to
a race to the bottom. Excessive fluctuations and volatility in financial markets
can mask the underlying value and give rise to confusing signals, thereby hindering
efficient price discovery.
7.35 Prompted by the crisis in the US sub-prime
mortgage market since August 2007, global financial markets remained turbulent
during the most part of 2007-08 and 2008-09 so far. Equity markets in advanced
economies declined during most part of the year 2007-08, while those in emerging
market economies (EMEs) declined sharply from January 2008. Long-term Government
bond yields in advanced economies softened, reflecting flight to safety by investors
and easing of monetary policy in the US. In the currency markets, the US dollar
depreciated against major currencies. 7.36 Notably, India could pursue its
process of financial deregulation and opening of the economy, while substantially
protecting itself from the turbulence in world financial markets. There has been
a great deal of progress in developing the money market, Government securities
market and the foreign exchange market. As greater market concentration has implications
for stability, the endeavour of the reform process has been to enhance the depth
and efficiency of the market by including more participants and more instruments
so that risks are well diversified (Box VII.2). With a view
to deepening the money market and imparting greater liquidity to the market for
facilitating efficient price discovery, new instruments such as collateralised
lending and borrowing obligation (CBLO) were introduced. Issuance norms and maturity
profiles of other money market instruments such as commercial paper (CP) and certificates
of deposit (CDs) were also modified over time to encourage wider participation.
It is, however, important that while using new financial instruments, the market
players have a proper understanding of the embedded risks in these complex products.
7.37 Domestic financial markets conditions in general
remained orderly during 2007-08, barring a brief spell of volatility in the call
money market and occasional bouts of volatility in the equity market during the
second-half of August 2007, second-half of December 2007 and beginning of the
second week of January 2008. Liquidity conditions in the financial markets were
driven mainly by Government cash balances and capital flows in the economy. Brief
spells of volatility were observed in the money market on account of changes in
capital flows and cash balances of the Central Government with the Reserve Bank.
After the withdrawal of the ceiling on reverse repo acceptances under the LAF
in August 2007, interest rates in money markets moved broadly within the reverse
repo and repo rates corridor for the most part of the year. Interest rates in
the collateralised segments of the money market moved in tandem with, but remained
below, the call money rate. The primary market segment of the capital market,
which had witnessed increased activity till early January 2008, turned subdued
thereafter due to volatility in the secondary market. Yields in the Government
securities market softened during the large part of the year. Box
VII.2: Financial Market Concentration: Implications for Market Stability The
issue of whether concentrated financial markets - in which a relatively small
number of firms hold large market shares - are more likely to be disrupted than
less concentrated ones is important to policymakers as well as other market participants
concerned about potential threats to market stability. Markets can experience
shock to supply and demand from several sources such as changes in regulation
and technological innovations, but one particular type of supply shock, viz.,
the failure or exit of one or more large suppliers could be a cause for market
instability.
In a recent study by the Federal Reserve Bank of New York,
it was found that there is no pervasive pattern in the past decade of high or
increasing concentration in financial markets (Cetorelli et al., 2007).
Consistent with past academic studies, the authors find an ambiguous relationship
between market concentration and market instability. They argue that the risk
of instability should a large player exit the market, depends not just on market
concentration, but also on the speed at which other firms can substitute for the
exiting firm. An analysis of how the US financial market structure has changed
over the last decade finds no pervasive pattern of high and increasing concentration.
Most wholesale credit and capital markets in the United States are only moderately
concentrated, and concentration trends are mixed - rising in some markets, falling
in others. Cetorelli et al., drawing on academic research as well as
introducing new analysis, consider the link between market concentration and the
risk or severity of instability. A complementary line of inquiry into the
link between concentration and the risk or severity of market instability focuses
on substitution by firms; substitution can stabilise markets by dampening the
upward pressure on prices attributable to a large exiting supplier. The departure
of a major supplier would cause less market disruption, the more promptly other
firms can substitute for it. Thus, prompt substitution by other firms is a critical
factor supporting market resiliency. Substitution is a stabilising force because
it can dampen the upward pressure on prices attributable to the failure of a large
firm. The authors' findings can offer some reassurance to policymakers and others
concerned about whether high or rising financial market concentration could suggest
greater market instability.
Monitoring market concentration and turnover
trends and introducing public policies that enhance firm substitution within a
given market is highly recommended to enhance the stability of the markets. Such
policies could include promoting standardisation of products, ensuring rapid clearing
of payments, and monitoring competition to ensure that key players do not become
entrenched, and hence irreplaceable, because of privileged access to trading platforms
or technologies.
Reference:
Cetorelli, Nicola,
Beverly Hirtle, Donald Morgan Stavros Peristiani and Joao Santos. 2007. "Trend
in Financial Market Concentrations and their Implications for Market Stability."
FRBNY Economic Policy Review. March. Money Market
7.38 Responding to the reform measures initiated as a part of the financial
sector reforms initiated in the 1990s, the call money market has generally witnessed
orderly conditions and provided the necessary platform for the Reserve Bank to
conduct its monetary policy. After the adoption of the LAF in June 2000 and consequent
improvement in liquidity management by the Reserve Bank, volatility in call rates
has declined significantly, compared with the earlier periods (Chart
VII.1). Thus, while statutory pre-emptions such as cash reserve ratio (CRR)
and SLR, and reserve maintenance period were the main factors that influenced
call rates in the pre-reform period, it is capital flows, Government's cash balance
with the Reserve Bank along with the Reserve Bank's liquidity management operations
that have been the main drivers of call rates in the post-reform period.
7.39 During 2007-08, money market rates generally remained within the informal
corridor set by reverse repo and repo rates of Liquidity Adjustment Facility (LAF)
(Chart VII.2). The average call rate during 2007-08 was at 6.07 per cent,
115 basis points lower than that of the previous year. Interest rates in the collateralised
segments of the money market moved in tandem with, but remained generally below
the call money rate during the year. 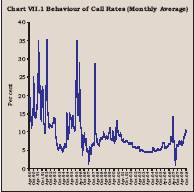

7.40 The money market generally remained stable in 2007-08, barring brief
spells of volatility during April-June 2007, and October 2007. In the call/notice
money market, the weighted average call/notice rates declined in April 2007 from
the elevated levels in the second-half of March 2007, as the liquidity conditions
eased on account of reduction in the cash balances of the Central Government.
Liquidity conditions tightened from the second-half of April 2007 and thereafter,
partly on account of a two-stage hike in the CRR by 25 basis points each, announced
on March 30, 2007. The CRR was raised to 6.25 per cent and 6.50 per cent effective
from the fortnight beginning April 14, 2007 and April 28, 2007, respectively.
Consequently, the call/ notice money market rates edged higher and exceeded the
repo rate during the second-half of April 2007 and some part of May 2007. From
May 28, 2007 onwards, the liquidity conditions eased significantly, reflecting
the reduction in cash balances of the Central Government and the Reserve Bank's
foreign exchange operations. Against the background of excess liquidity and the
cap of Rs.3,000 crore on the reverse repo window of LAF imposed with effect from
March 5, 2007, the call rate remained below the reverse repo rate in June and
July 2007. In fact, the call rate ruled below one per cent on a number of occasions
in June and July 2007 and it reached as low as 0.13 per cent on August 2, 2007.
The volatility in the call money market declined significantly after August 2007,
with the removal of the cap of Rs.3,000 crore on the absorption under the reverse
repo window of LAF. Subsequently, the call money rate generally remained within
the corridor for the rest of 2007-08 (Chart VII.3).
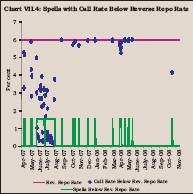
7.41 During April-August 2007, the average call rate remained outside the informal
corridor, set by the repo and reverse repo rates of LAF. Except for the above
period, the call money market remained more or less stable during 2007-08. In
2007-08, it remained below the reverse repo rate on 85 days, while it remained
above the corridor on 70 days10. During 2008-09 (till November 15, 2008), the
call rate remained generally above the repo rate on most of the days. While it
remained within the corridor on 91 days, it remained below the reverse repo rate
on 17 days. The elevated levels of the call rates reflected the deficient liquidity
conditions in the inter-bank markets. The call rate in 2007-08 generally remained
below the corridor during June and July 2007, when the Rs.3,000 crore cap was
operative on reverse repo window (Chart VII.4). 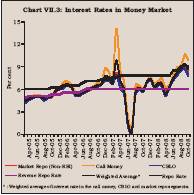
Excluding these two months, call money rates marginally declined below the reverse
repo rate during few discrete spells in the rest of 2007-08 and during the current
financial year so far. On the other hand, a seasonal pattern in money market rates
was observed with respect to the movements above the upper corridor
(Chart VII.5). These upward movements were generally during the end of the
quarter coinciding with the temporary liquidity shortage due to advance tax outflows.
The call rate marginally breached the upper corridor for most of the days in April-May
2007 and October 2008. During the current financial year so far, there have been
spells, when rates in the money market remained above the repo rate. reflecting
temporary lightness in liquidity conditions and global financial turmoil.
7.42 Interest rates in the collateralised segments of the money market -
the market repo (outside the LAF) and the CBLO - moved in tandem with, but remained
below the call rate. The collateralised market is now the predominant segment
of the money market, accounting for nearly 80 per cent of the total volume during
2007-08 (Chart VII.6). 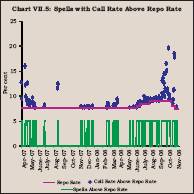

During
2007-08, interest rates averaged 5.20 per cent, 5.50 per cent and 6.07 per cent,
respectively, in the CBLO, market repo and call/notice money market segments (6.24
per cent, 6.34 per cent and 7.22 per cent, respectively, a year ago). The weighted
average rate for all the three money market segments combined together was 5.48
per cent during 2007-08 as compared with 6.57 per cent a year ago. In both the
CBLO and market repo segments, mutual funds remained the major lenders, while
commercial banks and primary dealers were the major borrowers.
7.43 A
screen-based negotiated quote-driven system for all dealings in the call/notice
and term money markets (NDS-CALL) was launched on September 18, 2006. Though the
dealing on the platform is optional, 86 banks and 8 primary dealers have taken
membership of NDS-CALL so far. NDS-CALL now accounts for more than 75 per cent
of total call/notice transactions.
7.44 The outstanding amount of commercial
paper issued by companies increased from Rs.17,863 crore at end-March 2007 to
Rs.32,592 crore by end-March 2008 and further to Rs.48,442 crore by end-October
2008. Even factoring in the seasonality, the increase in CP issuances reflects
the secular rise in credit demands of a growing economy. The weighted average
discount rate (WADR) generally kept pace with the other money market rates. However,
since September 2008, the incremental issuance of CP seems to have slowed down
with the hardening of the WADR as well as increase in tenor of the issuances (Chart
VII.7).
7.45 While non-banking finance companies
are the major CP issuers, mutual funds (MFs) are major investors in CP. The redemption
pressure faced by MFs since September 2008 adversely affected liquidity conditions
in the money market, which had a spill-over impact on the CP market.
7.46 The outstanding amount of certificates of deposit issued by SCBs increased
from Rs.93,272 crore at end-March 2007 to Rs.1,47,792 crore at end-March 2008
and thereafter to Rs.1,58,562 crore at end-October 2008. The SCBs resorted to
higher issuance of CDs to augment their resources till September 2008. However,
the CDs issuances have slowed down since mid-September 2008 following the knock-on
effect of the global financial crises on the Indian financial sector (Chart
VII.8). The maturity period of the most CDs roughly ranges between 181 and
365 days. Major portion of the CDs would mature in the second half of the financial
year. 
7.47 As mutual funds are the major investors in the CDs,
the recent developments seem to have had a direct impact on the CD market. In
view of this, the Reserve Bank has relaxed some restrictions on lending and buy-back
of CDs for 15-day period in October 2008. Further, a term repo facility for an
amount of Rs.60,000 crore has been instituted under the LAF to enable banks to
ease the liquidity stress faced by MFs and non-banking financial companies with
associated SLR exemption of 1.5 per cent of NDTL.
Foreign
Exchange Market
7.48 Following the reform measures taken
since 1992, the foreign exchange market has acquired depth and liquidity. The
continuous improvement in market infrastructure has had its impact in terms of
enhanced depth, liquidity and efficiency of the foreign exchange market. The bid-offer
spreads have declined, reflecting the liquidity and efficiency of the market.
There is a wide menu of products available in the OTC market, which serves a distinct
economic purpose. Several initiatives were undertaken during 2007-08 to simplify
foreign exchange transactions and also to provide greater flexibility to individuals
and corporates in undertaking foreign exchange transactions. Over the years, capital
flows have assumed increased importance in determining exchange rate dynamics. 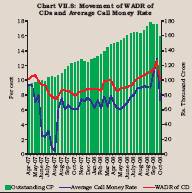
7.49 The Indian rupee exhibited two-way movement and moved
in a broad range of Rs.39.26-43.15 per US dollar during the financial year 2007-08
(Chart VII.9). Large capital inflows resulted in an appreciation of rupee
during most part of the year. However, large FII outflows and heavy dollar demand
by oil companies led the rupee to depreciate during the last quarter of 2007-08.
Amongst major international currencies, between end-March 2007 and end-March 2008,
while the rupee experienced an appreciation of 9.0 per cent against the US dollar
and 7.6 per cent against the pound sterling, the rupee depreciated by 7.8 per
cent against the Euro and 7.6 per cent against the Japanese Yen during the same
period. Reflecting the 
1
Reddy, Y.V., 2006, Financial Sector Reform and Financial Stability, at
the 8th Global Conference of Actuaries held in Mumbai.
2 Oosterloo, S.
and J. de Haan, 2005, 'Arrangements for Financial Stability in OECD and EU Countries',
in: Doug Evanoff & George Kaufman (eds.),Systemic Financial Crises, Resolving
Large Bank Insolvencies, World Scientific Publishing Company. 3
Strauss-Kahn, Dominique, 2008, Lessons from the Financial Market Crisis: Priorities
for the World and for the IMF, at Indian Council for Research on International
Economic Research (ICRIER), New Delhi, India on February 13. 4
Mohan, R., 2008, Global Financial Crisis and Key Risks: Impact on India and
Asia, remarks at the IMF-FSF High-Level Meeting on the Recent Financial Turmoil
and Policy Responses, Washington D.C., October 9.
5 Governor, Dr. D.
Subbarao's Press Statement on Stance of Monetary Policy for the Remaining Period
of 2008-09, October 24, 2008. 6 The Financial Development
Report 2008, World Economic Forum. 7 Fit and
proper criteria for elected directors on boards of nationalised banks were issued
on November 1, 2007, and fit and proper criteria for elected directors on board
of the State Bank of India and its associate banks were issued on November 14,
2007. 8 The system of supervisory grading of UCBs into four
grades - I to IV, introduced during 2005-06 is based on objective criteria defined
in terms of CRAR, net NPA etc. Grade I refers to sound banks having no
supervisory concerns. Banks in grades III and IV broadly correspond to 'weak'
and 'sick' category under the earlier norms. 9 Equity-oriented
funds (with more than 60 per cent of the funds in equity shares of domestic companies)
of mutual funds are exempt from tax on income and dividend distribution and long-term
capital gains. The tax treatment in respect of other than equity-oriented funds
of the mutual funds is as follows: (i) dividend distribution from the money market
and liquid funds is subject to 25 per cent tax plus surcharge. (ii) For schemes
other than money market and liquid schemes, dividend distribution tax is 12.5
per cent plus surcharge for distribution made to individuals or HUF and for any
other person at 20 per cent plus surcharge. (iii) Long-term capital gains to resident
holders in chargeable to 20 per cent after factoring the cost of inflation index
or tax at the rate of 10 per cent without indexation, whichever is lower. 10
As a general practice, all rates for previous days were repeated for the bank
holidays and Sundays. |
 IST,
IST,


