 IST,
IST,
Global Banking Developments
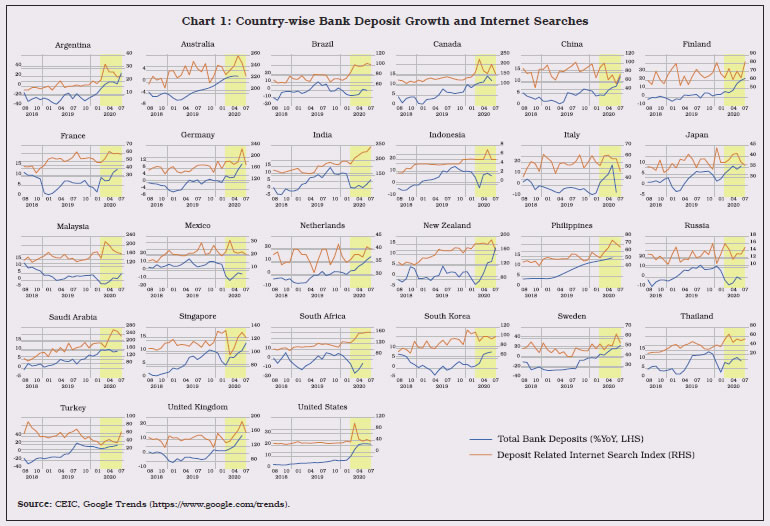
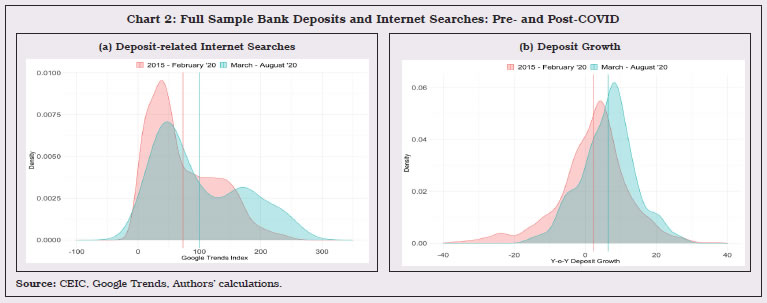
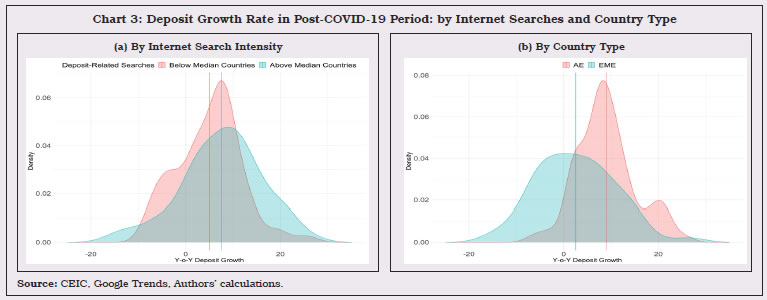
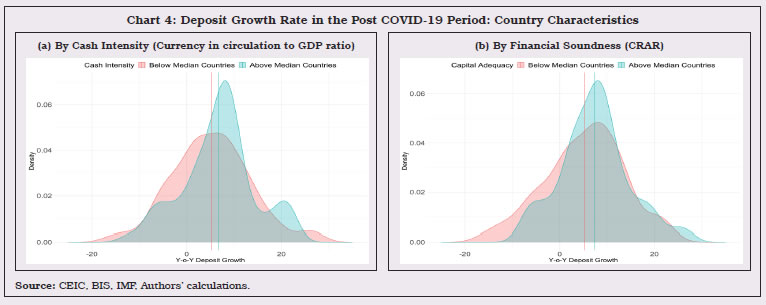
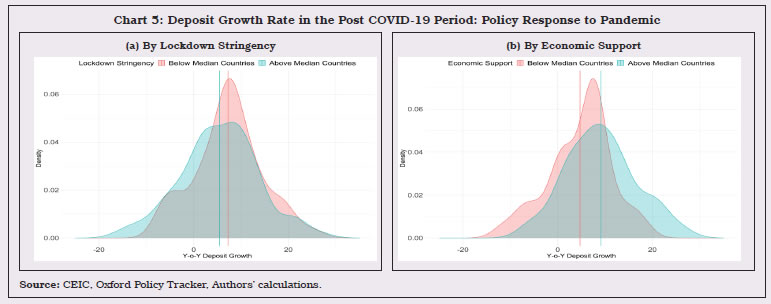
The global banking system, bolstered by the progressive implementation of the Basel III reforms and swift policy measures, successfully withstood the initial impact of COVID-19. The implementation of further reforms was extended by a year to buttress the operational capacity of banks and supervisors to respond to the event. Going forward, the muted credit expansion, the persistence of a low interest rate environment and the impending asset stress on account of the pandemic suggest that profitability of banks is likely to remain subdued. 1. Introduction II.1 The global economy is going through its testing challenge, unparalleled in recent history, as the COVID-19 pandemic takes its toll and a second wave threatens to stall growth, investment and trade. The International Monetary Fund (IMF) forecasts a steep contraction in global output in 2020 on account of the pandemic (Chart II.1a)1. The global financial system, with banks at its core, was acquiring resilience through 2019 primarily driven by the ongoing financial regulatory reforms. Bank credit to the non-financial sector picked up from the second quarter of 2019 in response to the policy measures (Chart II.I b and c). Buffered with higher capital and liquidity ratios, the global banking system successfully withstood the initial impact of the COVID-19 shock, also aided by swift and unprecedented policy actions. With the onset of the COVID-19 pandemic, however, bank credit growth was interrupted abruptly in the first quarter of 2020, particularly in the emerging market economies (EMEs). The policy responses helped to ease financial conditions and bank credit growth to recover in the second quarter. II.2 The outlook for 2021 remains highly uncertain. The high debt overhang of households, non-financial corporates and the (national and sub-national) governments remains a serious concern. The outlook for the global financial system hinges around the abatement of the health crisis and the pace, sustainability and inclusiveness of the recovery. Further, risks to global financial stability remain elevated. II.3 The rest of the Chapter is organised as follows. Section 2 traces the evolution of global banking policy reforms and their implementation. Section 3 reviews the performance of the global banking system during these testing times. A quick preview of the 100 largest global banks is presented in Section 4. Section 5 concludes the chapter. 2. Global Banking Policy Developments II.4 The member jurisdictions of the Basel Committee on Banking Supervision (BCBS) made progress since 2019 in implementing the Basel III standards2. As alluded to earlier, banks used this period to build capital and liquidity buffers while reducing leverage. Recognising exceptional circumstances brought on by the pandemic, however, the implementation dates of the Basel III standards (finalised in December 2017), the revised Pillar 3 disclosure requirements (finalised in December 2018), and the revised market risk framework (finalised in January 2019) have been deferred by one year to January 1, 20233. Nevertheless, the pandemic is expected to leave scars on the capital of banks. 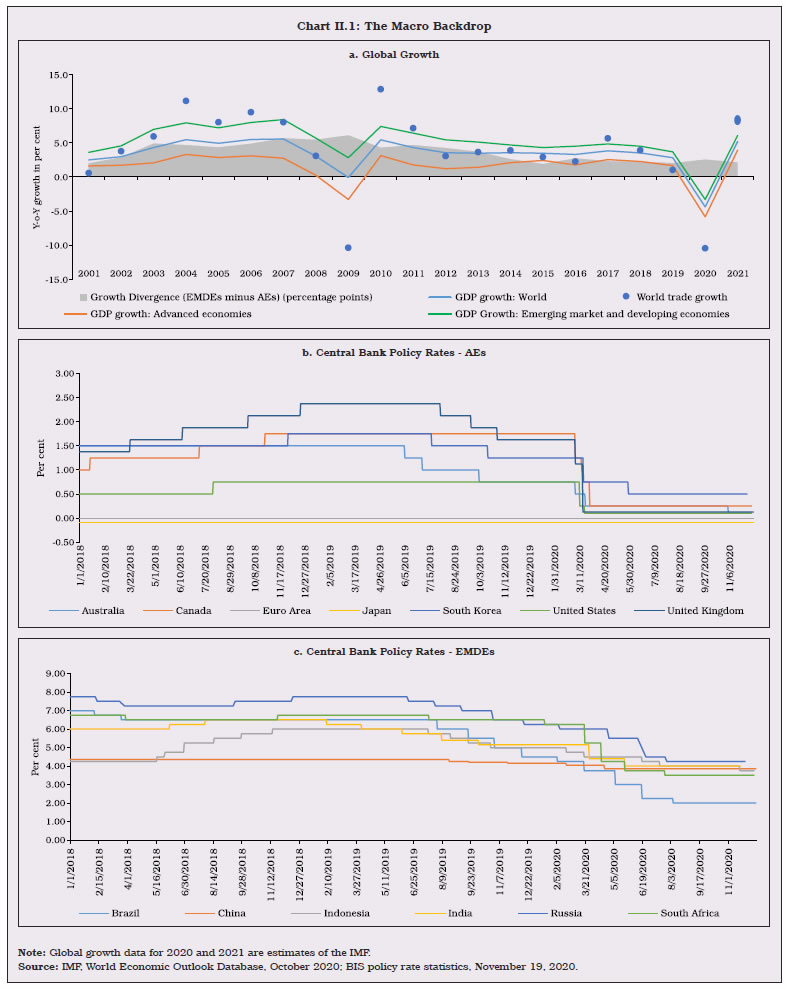 II.5 The Financial Stability Board (FSB) was established as part of a key institutional reform to monitor the implementation of the financial sector reforms. The four core elements of the reforms are: (i) making financial institutions more resilient; (ii) ending the too-big-to-fail (TBTF) phenomenon; (iii) making derivatives markets safer; and (iv) promoting resilient non-bank financial intermediation (NBFI). Work is also underway to strengthen governance standards to reduce misconduct risks; to address the decline in correspondent banking; to analyse implications of FinTech for financial stability; financial innovations; payments systems; cyber resilience; and market fragmentation. 2.1 Building Resilient Financial Institutions II.6 There has been considerable progress in the implementation of the Basel Framework4 for capital, liquidity and global systemically important banks (G-SIBs). All 27 BIS member jurisdictions have enforced final rules for risk-based capital, liquidity coverage ratio (LCR) regulations, capital conservation buffers and the countercyclical capital buffers (CCyB). While all members that are home jurisdictions to G-SIBs have final rules in force for the G-SIBs, twenty six members have final rules in force for domestic systemically important banks (D-SIBs). All members have issued final or draft rules for the Net Stable Funding Ratio (NSFR)5. Further, majority of the members (ranging between 22 and 26) have either enforced final rules or published draft rules for the leverage ratio, the standardised approach for measuring counterparty credit risk (SA-CCR), the supervisory framework for measuring and controlling large exposures (LEX), the monitoring tools for intra-day liquidity management, margin requirements for non-centrally cleared derivatives (NCCDs), the revised securitisation framework, capital requirements for equity investments in funds and the revised Pillar 3 disclosure requirements6. 2.2 Making Derivatives Markets Safer7 II.7 Significant progress has been made in over-the-counter (OTC) derivatives market reforms. As at end-September 2020, comprehensive trade reporting requirements for OTC derivatives transactions and interim capital requirements for NCCDs have been implemented in 23 jurisdictions of FSB (out of 24), although internationally trade reporting remains less than fully effective. The implementation of frameworks for mandatory central clearing (17 jurisdictions), platform trading (13 jurisdictions), margin requirements for non-centrally cleared derivatives (16 jurisdictions), and final capital requirements for NCCDs (8 jurisdictions) are underway. 2.3 Promoting Resilient Non-Bank Financial Intermediation II.8 Over the years, non-bank financial intermediation has been gaining ground in the global financial landscape as an important alternative source of financing. They are also instrumental in fostering competition among financing entities including banks. The total financial assets of the non-bank financial intermediation sector (NBFI)8 grew by 8.9 per cent to US$ 200.2 trillion in 2019 (as against a marginal decline in the previous year). The growth was broad-based mainly due to higher growth rates in investment funds (reflecting mostly valuation effects), pension funds and insurance corporations.9 During the year, the total global financial assets and banks’ financial assets grew by 6.6 per cent and 5.1 per cent, respectively. II.9 The NBFI sector thus accounted for nearly half of the total global financial intermediation in 2019, which is also indicative of growing interconnectedness of the sector across the financial system and implications for systemic risks. II.10 The implementation of policy reforms for non-bank financial intermediaries are progressing, contributing to an open and resilient financial system10. While final implementation measures were yet to be put in force by six out of 24 jurisdictions for valuation, liquidity management and stable net asset value (NAV) for Money Market Funds (MMFs), nine jurisdictions had still to adopt measures for an incentive alignment regime and disclosing requirements for securitization. India has both the implementation measures in force. 2.4 Climate-related Financial Disclosures II.11 The FSB established a Task Force on Climate-related Financial Disclosures (TCFD)11 in 2015 which finalised its recommendations in 2017. The third Status Report on adoption of the recommendations of the TCFD (October 29, 2020) indicated that disclosure of climate-related financial information has steadily increased. It also highlighted the continued need for improving the level of disclosures for greater consistency and comparability. 2.5 Correspondent Banking12 and Remittances II.12 Globally, correspondent banking has been on the decline in recent years due to de-risking. This has adverse consequences on the access to the international financial system, remittances and cross-border payments. Since November 2015, the FSB has undertaken action plans to address the decline in correspondent banking relationships and remittance service providers’ (RSPs) access to banking services13. In March 2018, the FSB recommended a set of measures to address problems faced by the RSPs in obtaining access to banking services and identified factors underlying the termination of banking services to RSPs such as low profitability, the perceived high risk of the remittance sector from the point of view of anti-money laundering/combatting the financing of terrorism (AML/CFT), supervision of the RSPs and compliance with international standards. II.13 Despite various remedial measures, the decline in correspondent banking continued in 2019, though at a slower pace. The number of active correspondent banks worldwide fell by 3 per cent in 2019 and by 22 per cent between 2011 and 201914. Nonetheless, correspondent banking continues to play a pivotal role for cross-border payments. 2.6 Misconduct Risks II.14 The FSB introduced a toolkit of measures in November 2018, which supervisors and firms can use to strengthen the governance frameworks of financial institutions by increasing accountability of senior management for misconduct within their firms. The recommendations identify a core set of data for the effective supervision of compensation practices. The toolkit complements other elements of the FSB’s Misconduct Action Plan, including compensation recommendations that align risk and reward better. From a recent survey of its members, the FSB reports that the use of Supervisory Technology (SupTech) for ‘misconduct analysis’ and ‘microprudential supervision’ has increased in recent years, mainly due to the relatively rule-based nature of assessments in these areas. Whereas, the use of traditional market surveillance mechanisms that were prevalent earlier have reduced somewhat. Further, there has been an increase in the use of supervised Machine Learning (ML) tools to detect mis-selling of financial products and identify financial advisers (consultants) with higher risk of committing misconduct15. 2.7 Central Bank Policy Responses to the COVID-19 Pandemic II.15 Central banks across the world adopted a multi-pronged strategy to cushion the impact of the pandemic and sustain the flow of credit to households and firms16. Capital levels were enhanced either through restrictions on distribution of profits through dividends and share buy-backs or through government loan guarantees, or both. In order to stimulate lending, regulators waived risk weights for loans covered by government guarantees and reduced those on banks’ exposures to targeted borrowers, especially smaller firms. Japan, the United Kingdom, and the United States exempted central bank reserves and government bond holdings from banks’ leverage exposure measures to facilitate large asset purchase programs and to encourage banks to intermediate in government bond markets. In many countries, central banks allowed release of countercyclical capital buffers. Some jurisdictions asked their banks to use capital conservation buffers (CCBs)17 to support lending and gradually rebuild them through retained earnings as conditions improve. Several countries allowed asset quality standstills for loans impacted by the pandemic; this deferment contained provisioning requirements, thus conserving capital. Banks have also been compelled, either by regulation or strong administrative guidance, to cancel capital distributions. 3. Performance of the Global Banking Sector II.16 Having progressively implemented the regulatory reforms in the last decade through 2019, the global banking system stood on strong grounds when the pandemic hit and sustained credit supply to the real sector. 3.1 Bank Credit Growth18 II.17 With the synchronised global slowdown, bank credit growth to the private non-financial sector moderated across most AEs and EMEs through 2018, followed by uneven recovery in 2019 (Chart II.2). In the US, constant credit growth was maintained. On the other hand, bank credit consistently contracted in 2019 in Australia, Greece, Italy, Portugal, Spain and Turkey. 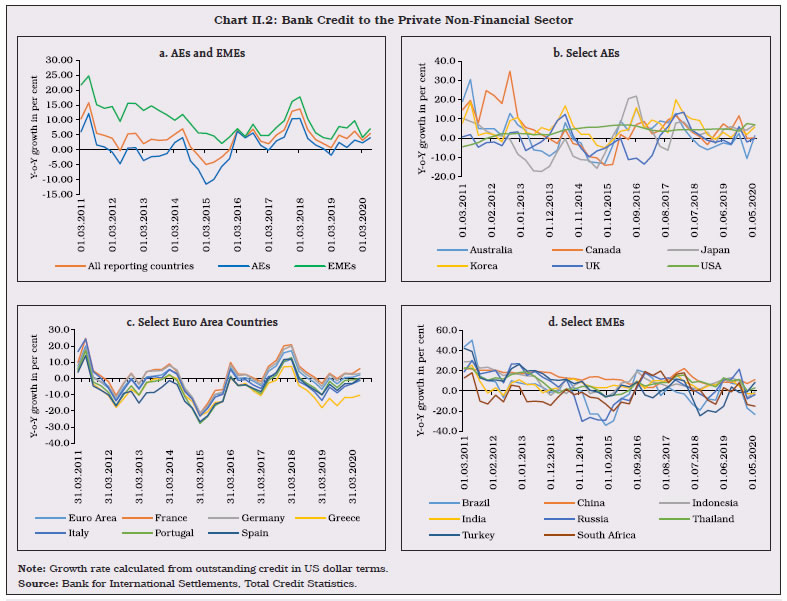 II.18 Country-specific factors induced divergence in bank credit growth in 2020. In the first quarter, bank credit growth dipped across AEs (though to a lesser extent in the Euro Area) but the deceleration was sharper in the EMEs, in the wake of the COVID-19 pandemic. There was a partial recovery in the second quarter. Response of bank deposits to COVID-19, however, differed across countries (Box II.1).
3.2 Asset Quality 21 II.19 Asset quality generally improved across banks in major AEs in 2019 (Chart II.3a)22. Significantly, the non-performing loans (NPL) ratios eased in the two peripheral economies of the Euro-zone, viz., Greece and Portugal mainly through institutional and government intervention. In the wake of pandemic, asset quality deteriorated in Australia, Canada and the United States in the first half of 2020. II.20 The asset quality of the EMEs’ banking system showed a mixed picture (Chart II.3b). The asset quality of Russian banks, for instance, worsened in 2018 and early 2019 due to fragile economic conditions and sanctions, but has improved subsequently. Banks in South Africa and Turkey, however, experienced deterioration in asset quality as financial conditions weakened. In the first half of 2020, Brazil, India and Turkey improved their asset quality. II.21 Going forward, the impact of the pandemic on asset quality of the banks is still unclear, given the recognition standstills, still operational in many countries. While the accumulated capital buffers may help banks in facing pandemic related adversities, it is crucial that stress on the banks’ balance sheet is transparently recognised. 3.3 Return on Assets II.22 Bank profitability, measured by the return on assets (ROA), generally declined across AEs and EMEs in 2019. In an overall environment of low profitability, banks in Canada, Australia, Portugal, Spain and the United Kingdom did better than those in the US and Japan (Chart II.4a). In the Euro area, bank profitability in France and Germany was impacted by weak growth and high NPLs, while for banks in peripheral economies such as Greece, Portugal and Spain, there was a recovery due to declining NPL ratios and consequent lower loan loss provisioning. For the region as a whole, though, structural weaknesses such as low cost-efficiency, limited revenue diversification and high stocks of legacy assets in some jurisdictions pose headwinds to a fuller revival. II.23 Among the EMEs too, the profitability of banks was lower in 2019 than in the preceding year. Although the ROA of banks in India continued to be the lowest amongst peers, they turned profitable in 2019 after a recent loss-making streak. Banks in Indonesia continued to sustain improvements in performance through the decade on the strength of high interest margins and robust credit growth, followed by banks in Mexico, Brazil and Thailand (Chart II.4b). The profitability of banks in China came under pressure from asset quality issues, ongoing deleveraging, decelerating loan growth and weak balance sheets, especially of small and medium-sized banks. The profitability of Russian banks improved, despite high loan delinquencies, as NPLs were well provisioned for, and both net interest incomes, and fee and commission income increased. II.24 The bank profitability was adversely impacted generally across advanced and emerging economies in the first half of 2020. Going forward, the slowing of credit growth, the likely persistence of a low interest rate environment and the impending asset stress due to the pandemic suggest that the profitability of banks is likely to remain subdued. 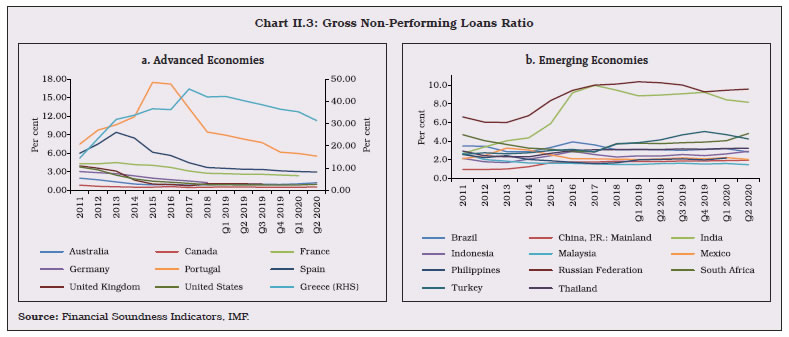 3.4 Capital Adequacy II.25 There has been steady progress in the implementation of Basel III norms across jurisdictions, albeit at varying speeds. Banks across systemic AEs and EMEs remained adequately capitalised (Chart II.5a and b). II.26 Except for Brazil, banks across major EMEs improved their capital adequacy in 2019. Banks in Indonesia continued to maintain the highest CRAR. Chinese banks strengthened their capital positions, particularly the small and medium sized ones. The capital adequacy of Russian banks improved in 2019, though they remained the lowest among EMEs. The CRARs of banks in India improved on the back of capital infusion in public sector banks by the Government and capital raising efforts by private sector banks. II.27 The global banking system weathered the pandemic on the back of stronger capital and liquidity positions than they had when the global financial crisis hit. Banks across advanced and emerging economies improved their capital positions in the second quarter of 2020, after a decline in the previous quarter. Going forward, however, the pandemic is expected to pose pressures on the capital and liquidity buffers. 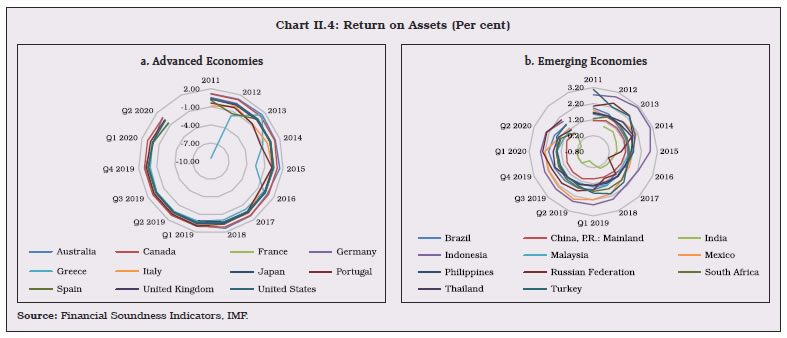 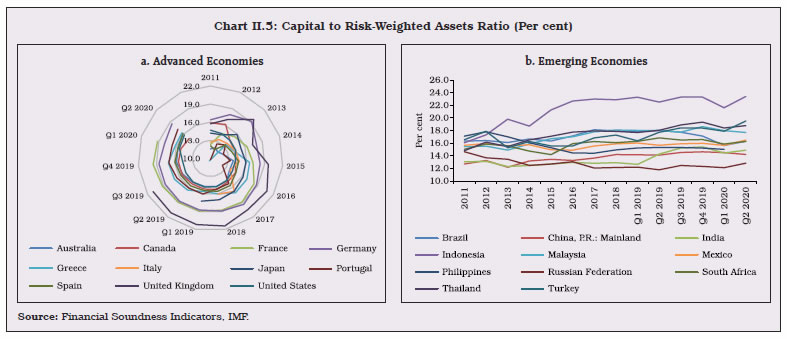 3.5 Leverage Ratio23 II.28 The leverage ratio generally improved across the banking system both in AEs and EMEs in 2019, a phenomenon observed since 2010, driven by the Basel III regulatory requirements. Banks have maintained the leverage ratio well-above the minimum of 3 per cent under the Basel III norms. While banks in the US and Greece maintained the leverage ratio above 11 per cent, banks in Indonesia have sustained it above 15 per cent for the past three years (Chart II.6a and b). Banks’ leverage ratios generally declined across advanced and emerging economies in the first half of 2020. 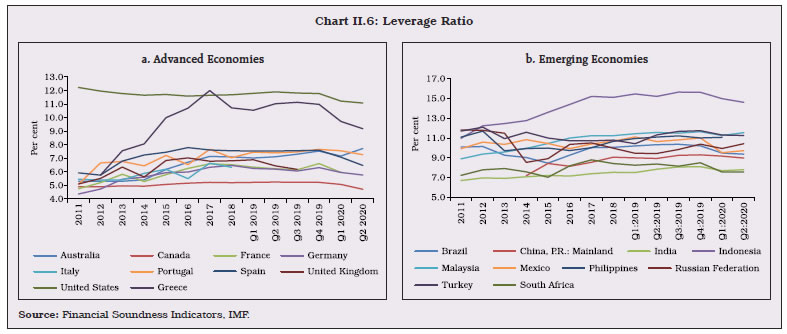 3.6 Financial Market Indicators II.29 Despite slowing bank credit growth in a low profitability environment, bank stock indices generally increased in 2019, reflecting improving asset quality and capital adequacy positions. These indices fell sharply in March 2020 as the pandemic hit, but have recovered since then, though the levels remain less than pre-COVID levels (Chart II.7a). II.30 Credit default swap (CDS) spreads of banks, which began to rise from the second-half of 2018, peaked around the beginning of 2019 and had started to ebb up until March 2020, when the pandemic hit. The CDS spreads of the banks in the UK, North America, and China were low and co-moved closely.24 The CDS spreads of European banks remained slightly higher, perhaps reflecting lower sovereign credit ratings, poorer loan quality and political uncertainties in peripheral economies. CDS spreads shot up again in March 2020 in the wake of the pandemic, but dropped sharply by the month-end, reflecting the timely and unprecedented policy measures (Chart II.7b). 4. World’s Largest Banks25 II.31 The balance sheet of the top 100 banks in the world, ranked by tier-I capital, grew by about 5 per cent in 2019 in terms of total assets, with substantial variations among banks. There was also substantial divergence in the growth of pre-tax profits of these banks during 2019. Both the AEs and EMEs held on to their positions in 2019 in terms of the number of banks and the total value of assets (in US dollar terms) among the top 100 banks (Chart II.8a and b). II.32 There was a marginal improvement in the asset quality amongst the top 100 banks in 2019, with 75 per cent of the banks having NPL ratios less than 2 per cent. However, the median ROAs of the top 100 banks declined for the second year in succession in 2019 (Chart II.9a and b). 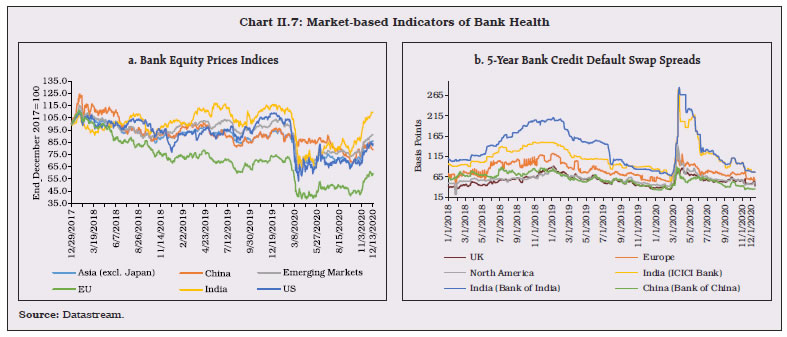  II.33 Capital positions of the top 100 banks remained strong, with more than half of them recording CRARs of more than 16 per cent in 2019. Similarly, there was a marginal improvement in the leverage ratio (capital to assets ratio) with a little over 70 per cent of the banks having leverage ratios in the range of 4 to 8 per cent. Three banks, one each in France, Germany and Japan, had leverage ratios marginally below 4 per cent but above 3 per cent as prescribed under Basel III regulations (Chart II.10a and b).   II.34 With global growth and credit growth slipping in 2019, bank profitability was adversely affected, despite a distinct improvement in asset quality and higher capital and liquidity positions. The restrictions and lockdowns imposed in the wake of COVID-19 pandemic were equivalent to a massive macroeconomic shock that led to an economic downturn unmatched in recent history. Resumption of the implementation of global financial sector reforms initiated after the global financial crisis should stand the global banking system in good stead as they emerge out of the pandemic. Authorities have acted swiftly and decisively to control the pandemic shock. Although, the outlook for the global financial system in 2021 remain uncertain, signs of quicker than anticipated recovery in economic activity in some countries gives hope of return to normalcy in 2021. 1 International Monetary Fund (2020), ‘World Economic Outlook – A Long and Difficult Ascent’, October 7, available at https://www.imf.org/en/Publications/WEO/Issues/2020/09/30/world-economic-outlook-october-2020. The October 2020 update of the WEO showed a less severe contraction than the June 2020 update. 2 Basel Committee on Banking Supervision (2020), Implementation of Basel Standards: A Report to G20 Leaders on implementation of the Basel III regulatory reforms, November 3, available at https://www.bis.org/bcbs/publ/d510.pdf. 3 In March 2020, the Group of Central Bank Governors and Heads of Supervision endorsed a set of measures to provide additional operational capacity for banks and supervisors to respond to the financial stability priorities resulting from the impact of Covid19 on the global banking system. 4 The Basel Framework is the full set of standards of the Basel Committee on Banking Supervision (BCBS). 5 Final guidelines on the NSFR for banks in India were published in May 2018. The guidelines which were to be effective from April 1, 2020 have been deferred to April 1, 2021. 6 The adoption of securitisation framework is yet to commence in India, while the implementation of margin requirement for noncentrally cleared derivatives (NCCDs) is in progress. 7 FSB (2020), OTC Derivatives Market Reforms:2020 Note on Implementation Progress, November 25, available at https://www.fsb.org/2020/11/otc-derivatives-market-reforms-2020-note-on-implementation-progress/. 8 The NBFI sector comprised of all financial institutions that are not central banks, banks or public financial institutions, thus including insurance corporations, pension funds, or financial auxiliaries. The Other Financial Intermediaries (OFIs), a subset of the NBFI sector, comprised of all financial institutions that are not central banks, banks, public financial institutions, insurance corporations, pension funds, or financial auxiliaries. 9 The FSB undertakes an annual exercise to monitor the size, structure and trends in NBFI activities. The latest information about NBFI pertaining to 2019 is from the ‘Global Monitoring Report on Non-Bank Financial Intermediation 2020’ published on December 16, 2020, available at https://www.fsb.org/2020/12/global-monitoring-report-on-non-bank-financial-intermediation-2020/. 10 Financial Stability Board (2020), ‘Implementation and Effects of the G20 Financial Regulatory Reforms: Annual Report’, November 13, available at https://www.fsb.org/2020/11/implementation-and-effects-of-the-g20-financial-regulatory-reforms-2020-annual-report/. 11 The aim of the TCFD was ‘to develop a set of voluntary, consistent disclosure recommendations for use by companies in providing information to investors, lenders and insurance underwriters about their climate-related financial risks.’ 12 FSB defines correspondent banking as the provision of banking services by one bank (the “correspondent bank”) to another bank (the “respondent bank”). 13 FSB (2020), ‘Enhancing Cross-border Payments: Stage 1 report to the G20.’ April 8, available at https://www.fsb.org/wp-content/uploads/P090420-1.pdf. 14 BIS (2020), ‘New correspondent banking data - the decline continues at a slower pace’, August 31, available at https://www.bis.org/cpmi/paysysinfo/corr_bank_data/corr_bank_data_commentary_2008.htm. 15 FSB (2020), ‘The Use of Supervisory and Regulatory Technology by Authorities and Regulated Institutions, October 9, available at https://www.fsb.org/wp-content/uploads/P091020.pdf. 16 IMF (2020), ‘Global Financial Stability Report, October, available at https://www.imf.org/en/Publications/GFSR/Issues/2020/10/13/global-financial-stability-report-october-2020. 17 A buffer of 2.5 per cent of total capital aimed at preventing banks from breaching the minimum regulatory capital adequacy ratio. 18 Data sourced from the Bank for International Settlements’ (BIS) Total Credit Statistics, updated September 14, 2020, available at https://www.bis.org/statistics/totcredit.htm. 19 Following the methodology of Castelnuovo and Tran (2017), country-specific indices were constructed for keywords related to deposit i.e., ‘bank deposit’, ‘deposit’, ‘bank account’ and ‘deposit insurance’ using raw data obtained from Google Trends. For countries where English is not an official spoken language, the searches were supplemented with native language translations of the keywords. 20 Median calculated across countries in the sample. 21 Data for sub-sections 4.2 to 4.5 are sourced from the IMF’s Financial Soundness Indicators (FSI). 22 Asset quality is measured as the ratio of gross non-performing loans (NPLs) to total gross loans. 23 Measured as the ratio of capital to total assets. 24 Credit default swap (CDS) spreads indicate the perceived solvency of banks and their ability to refinance. Banks with lower and more stable CDS spreads pay lower risk premia which in turn enables cheaper and easier financing terms for their customers. 25 Data sourced from the Banker Database of the Financial Times. |
পেজের শেষ আপডেট করা তারিখ:


