 IST,
IST,
II. Aggregate Demand
Aggregate demand weakened further in Q1 of 2012-13, led by patchy investment demand. Corporate sales have moderated significantly On the fiscal front, the deficit indicators have considerably widened. While the slowdown has had an impact on indirect taxes, both excise and customs, public expenditure remained high, particularly on subsidies. Recent initiatives taken by the government, especially those related to its expenditure on fuel subsidies are welcome but are less than adequate to avert fiscal slippage in 2012-13. Further steps will need to be taken soon. Protracted slowdown in private consumption and investment II.1 Expenditure side GDP growth moderated sharply to 3.9 per cent in Q1 of 2012-13 from 9.0 per cent in the corresponding quarter of previous year (Table II.1). Private final consumption expenditure and gross fixed capital formation, which account for around 60 per cent and 30 per cent, respectively, of GDP and which had both decelerated in the previous year, slackened further in Q1 of 2012-13. II.2 The downturn in investment, as explained in previous reports, was led by non-monetary factors, though interest rates also had a material effect. At the same time, government final consumption expenditure (which excludes transfer payments such as subsidies), which accounts for around 11 per cent of GDP, picked up sharply in Ql of 2012-13, partly reflecting a base effect.
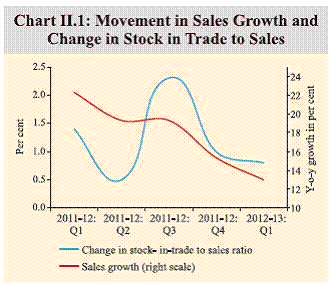
II.3 The decline in the weighted contribution of net exports and valuables in Q1 of 2012-13 is in line with the balance of payments, in contrast to the data for the previous quarter (Table II.2). Significantly, discrepancies continue to vitiate expenditure data. The table shows that the sum of the contribution-weighted growth rates of the different expenditure components works out to only 1.9 per cent in Q1 of 2012-13, which is much lower than the growth rate of 3.9 per cent derived from the production approach GDP (‘supply side’) after adjusting for net indirect taxes. Since the production-approach GDP is considered as the firmer estimate in the National Accounts Statistics, the difference between the expenditure side GDP derived from the supply side and that obtained from the different components of expenditure is reported as a statistical discrepancy. The discrepancy largely arises due to the lack of firm data on the expenditure components and the consequent use of indicator based approach by the CSO. Such large discrepancy complicates the assessment of aggregate demand in the economy for monetary policy. Moderation in sales growth coupled with decline in profits and contraction in margins reflect slack demand II.4 The subdued demand is reflected in the dampened sales of non-government non-financial (NGNF) listed companies. Sales growth decelerated to a 10-quarter low of 13 per cent in Q1 of 2012-13 (Table II.3). Further, due to a higher rate of growth in expenditure compared to sales, net profits declined by 10.7 per cent. The decline in net profits on a q-o-q basis was even sharper at 18 per cent (Table II.4). II.5 Lower growth in profits (EBITDA/EBIT/ net profits) relative to sales led to a decline in profit margins (EBITDA/EBIT/net profits as percentage of sales). A decline in change in stock-in-trade to sales ratio is in line with lower capacity utilisation as observed from OBICUS and indicates a possible moderation in expectation on demand conditions, going forward (Chart II.1).
II.6 Early results of 190 companies for Q2 of 2012-13 indicate that the sales growth continued to slowdown for these companies (Table II.5). There was a marked improvement in growth of net profits. However, the early results are from a small set of companies which are not representative of the overall corporate sector.
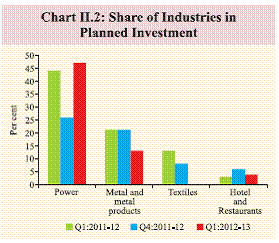
II.7 Moderation in the cost of projects sanctioned by major banks/FIs for new corporate investment persisted during Q1 of 2012-13 (Table II.6). While the number of approvals declined sharply, there was a marginal increase in the envisaged cost of projects during the quarter. Industry-wise analysis of investment intentions reveals that the share of the power sector in the total planned investment was the highest (Chart II.2).
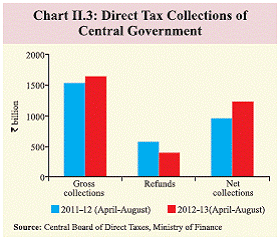
Fiscal slippage likely in 2012-13, in spite of recent measures II.8 The deficit indicators of the central government widened during 2012-13 (April- August) compared with the corresponding period of the previous year (Table II.7). There is a deviation from the projected fiscal consolidation path as the fiscal deficit during the first five months of 2012-13 comprised nearly two-thirds of the budget estimate for the year as a whole. On the current reckoning, the centre’s gross fiscal deficit (GFD/GDP) ratio in 2012-13 is unlikely to see a significant improvement from that in the previous year. This underscores the need for taking further steps soon, in addition to the measures taken since mid-September 2012. II.9 On the revenue side, the net collections under direct taxes improved during April- August 2012, with a growth rate higher than budgeted for the year, mainly reflecting lower refunds than a year ago (Chart II.3). The growth in indirect tax collections, however, has moderated during the period. Deceleration in industrial growth and foreign trade has affected collections under union excise duties and customs duties, respectively. Service tax revenue increased sharply over the period due to an increase in the service tax rates as well as the widening of the services tax base since July 2012. For the year as a whole, the gross tax-GDP ratio, is likely to be much lower than the budget estimates, reflecting the impact of slowdown in economic growth on tax collections.
II.10 Overall, there could be some shortfall in centre’s revenue receipts. With regard to nondebt capital receipts, the government recently approved partial disinvestment of its equity holding in four public sector enterprises. Given the recent buoyancy witnessed in the stock markets, it may be possible to meet the budgetary target for disinvestment proceeds. II.11 Total expenditure growth during 2012-13 (April-August) was higher than in the corresponding period of 2011-12 and the budgeted growth for 2012-13. The expenditure on subsidies was more than two-thirds of the budget estimates. For the year as a whole, a significant slippage in all three major subsidies – food, fertilisers and petroleum – is likely, resulting in higher than budgeted non-plan expenditure. Consequently, a cut-back in plan expenditure is envisaged to restrict the fiscal slippage. II.12 The recent measures such as upward revision in diesel prices, restriction on subsidised LPG and levy of service tax on railway freight and passenger fares are steps in the right direction but further corrective measures are required to contain the fiscal deficit within sustainable limit. In this regard, the Committee on Roadmap for Fiscal Consolidation (Chairman: Dr. Vijay Kelkar) has made recommendations for policy interventions. The report set out the targets as well as the steps for course correction that need to be adhered to. In accordance with the stipulations of the amended Fiscal Responsibility and Budget Management Act, 2003, the government has placed before the Parliament in September 2012, the Medium Term Expenditure Framework Statement which sets out a three-year rolling target for the expenditure indicators, specifying the underlying assumptions and risks involved. Subsidies remain high and likely to overshoot budget estimates II.13 Notwithstanding the recent price revisions and quantitative restrictions in administered petroleum products, the required compensation for under-recoveries of OMCs is estimated to be higher than budget estimates. Though the government had budgeted for an absolute decline in the amount of fertiliser subsidy in 2012-13, these have already crossed the budget estimate for the year as a whole. The food subsidy in 2012-13, as per official sources, is estimated to be `924.9 billion, an increase of around 24 per cent over the budget estimates. II.14 Rationalisation and reprioritisation of government expenditure is imperative for fiscal consolidation. Strategically, overall expenditure on subsidies needs to be restricted, and complemented with better targeting and distribution in accordance with policy priorities. Direct cash transfer of subsidies in food, fertilisers and petroleum will help towards subsidy reduction. Financial restructuring of state distribution companies may have medium to long-term implications for state finances II.15 The consolidated key deficit indicators of states are budgeted to improve in 2012-13 over 2011-12 (RE), reflecting the intent to carry forward fiscal consolidation in line with the recommendations of the Thirteenth Finance Commission (Table II.8). The consolidated revenue surplus for states is budgeted to increase in 2012-13, primarily through an increase in revenue receipts. The improvement in the revenue account is expected to reduce the fiscal deficit and primary deficit by 0.2 percentages points of GDP each and would also provide resources for higher capital outlay. The revenue expenditure-GDP ratio is expected to decline by 0.1 percentage point in 2012-13. This will, however, be on account of lower growth in the development component, both social and economic services.
II.16 The recently announced scheme for financial restructuring of state distribution companies (discoms) proposes a strategy for their financial turnaround. As per the announced scheme, 50 per cent of the outstanding short-term liabilities of the discoms to lending institutions would be converted into bonds issued by the former, backed by state government guarantees. These bonds are to be taken over within 2-5 years and converted into special securities by the state governments. The restructuring/ rescheduling will be subject to state governments and discoms taking certain prior steps to improve the operational performance of the discoms. The financial restructuring plan will hence not have any immediate implications for state finances as there is a moratorium on repayment of the principal for three to five years and even the interest payment would be due only in the next fiscal. This will, however, have a medium- to long-term impact on the state finances. Fiscal consolidation and boost to investment is key to growth revival II.17 High fiscal deficit has impacted the macroeconomic climate and contributed to the investment downturn. A credible fiscal consolidation strategy is now on the anvil but needs to be backed by further measures. Overall demand conditions during 2012-13 have stayed depressed, due mainly to slack in investment. With a number of initiatives to address structural impediments and augment FDI, the investment climate should start improving. As the structural constraints facing investment get removed, there could be some revival in investment demand going forward. * Despite its well-known limitations, expenditure-side GDP data are being used as proxies for components of aggregate demand. |
|||||||||||||||||||||||||||||||||||||||||||||||||||||||||||||||||||||||||||||||||||||||||||||||||||||||||||||||||||||||||||||||||||||||||||||||||||||||||||||||||||||||||||||||||||||||||||||||||||||||||||||||||||||||||||||||||||||||||||||||||||||||||||||||||||||||||||||||||||||||||||||||||||||||||||||||||||||||||||||||||||||||||||||||||||||||||||||||||||||||||||||||||||||||||||||||||||||||||||||||||||||||||||||||||||||||||||||||||||||||||||||||||||||||||||||||||||||||||||||||||||||||||||||||||||||||||||||||||||||||||||||||||||||||||||||||||||||||||||||||||||||||||||||||||||||||||||||
পেজের শেষ আপডেট করা তারিখ:


