 IST,
IST,


II. Aggregate Demand
Aggregate demand in the economy remained sluggish during Q3 of 2012-13 with a prolongation of the investment cycle downturn and some weakness in consumption. Corporate results show that sales continued to decelerate suggesting slack in both inventory and consumption demand. Government consumption expenditure also decelerated in response to the fiscal consolidation plan. Going forward, some improvement in consumption demand is likely if inflation recedes further. Also, investment demand could turnaround if government initiatives to resolve structural bottlenecks that impede investment fructify. A public investment stimulus is needed to revive demand, but it is important to first create the fiscal space for it by cutting current expenditure. Aggregate demand remained sluggish II.1 Expenditure-side GDP data suggest that aggregate demand remained sluggish during Q3 of 2012-13, with weak expansion in private and government consumption expenditure. Corporate results reaffirm this, as sales growth continued to decelerate during Q3 of 2012-13, reflecting investment slack as well as some weakness in consumption demand. Further, planned corporate investments as gleaned from the phasing details of projects receiving financial assistance from banks and other financial institutions suggest that corporate fixed investments dropped in Q3 of 2012-13. II.2 Growth in GDP at market prices remained low with notable deceleration in government consumption expenditure (Table II.1). The contribution to modest growth in Q3 largely came from private consumption and investment (Table II.2).
II.3 Revival of investment has become a major macro-economic challenge at the current juncture. Monetary policy easing in 2012-13 has not succeeded in turning around investment. The logjam associated with structural bottlenecks in the mining and infrastructure space persist and need to be resolved first. Otherwise, the limited available space for monetary policy could get quickly used up without stimulating aggregate demand and real activity. Decline in saving and investment rates a concern II.4 Both saving and investment rates declined in 2011-12 (Table II.3). All three sectors, viz., households, private and public sectors have witnessed a slowdown in saving during this period. Within household saving, while the financial saving rate declined, physical saving rate increased as households turned to physical assets as inflation hedges. The persistence of inflation with average headline inflation of about 9 per cent during 2011-12 withered financial savings, as households attempted to stave off the downward pressure on their real consumption.
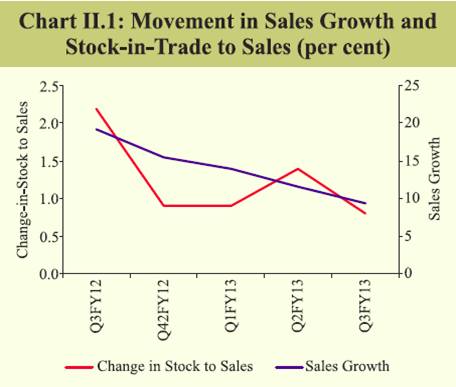
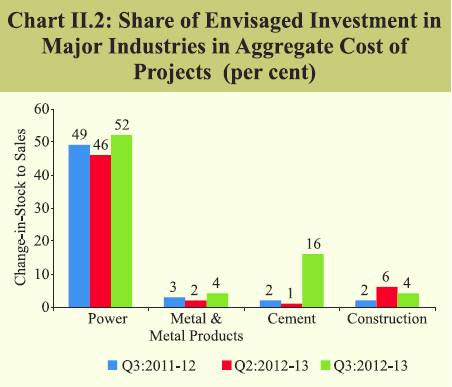
II.5 The decline in the rate of investment in 2011-12 was mainly due to decline in the investment rate of the private corporate sector followed by that of the public sector even as the household investment rate increased. The increase in investment in valuables continued in 2011-12 and exhibited a sharper rise, partly contributing to the high Current Account Deficit (CAD) in 2011-12. Urgency of addressing infrastructural bottlenecks in various sectors to revive growth II.6 As on January 1, 2013, nearly half of the 566 central sector projects (of `1.5 billion and above) are delayed and there have been cost overruns to the tune of 18 per cent. The sectors that have been affected by cost and time overruns are railways, water resources, petro chemicals, road transport & highways and power. Several factors that affect the progress of projects are delays in regulatory approvals, land acquisition, land/site handover, lack of strong rehabilitation and resettlement policies, delays in decision-making, weak/ineffective project planning and monitoring and contractual disputes. II.7 The multiplicity of authorities involved in project clearances continue to constrain investment and, therefore, the numerous government initiatives have had limited benefits. Recognising this, several initiatives have been taken for speedy clearance of projects. These include setting up Standing Committees in the Ministries to fix responsibility for time and cost overruns, regular reviews of infrastructure projects by the concerned administrative Ministries and setting up Central Sector Project Co-ordination Committees in the States under the Chief Secretaries. A Cabinet Committee on Investment was also constituted in December 2012 to examine issues relating to clearances/approvals of major projects to ensure their accelerated and timely implementation. II.8 The roads sector’s progress has recently been tardy due to delays in pre-construction activities such as land acquisition, shifting of utilities and, forest and environment clearances. In fact, during 2012-13 only 1,933 km of road projects (6,491 km in 2011-12) were awarded by the government. Even the Engineering, Procurement and Construction (EPC) contracts, in which the government bears the cost of projects, have faced problems in attracting bids due to delays in procedural approvals. In this context, the Supreme Court judgement of March 2013 on delinking the environment from forest clearances for highway projects should come as a big boost to the sector. The Union Budget 2013-14 has also announced the setting up of a regulatory authority for the roads sector. II.9 The power sector has been largely affected by the shortage of coal and gas, which led to cutbacks in electricity generation. The gap between demand and supply of coal continues to diverge and is likely to widen further during the Twelfth Plan, which in turn, may affect several power projects. On the one hand, more expensive imported coal may erode the profit margins of the producers, and on the other hand, several State Electricity Boards are supplying electricity at less than break-even price. Urgent policy intervention to augment coal supplies is necessary to sustain power sector investments. II.10 Private investments in railways have been low. A renewed focus on PPP could boost investment and help railways in furthering the rather challenging Twelfth Plan investment targets of `1 trillion through this route. Investment in near term can get kicked in from the Eastern Dedicated Freight Corridor. II.11 Telecommunication, another key infrastructure sector, has also been struggling over the past few years due to various issues. The sector, which was growing at an average rate of 24 per cent during the 2000s, slowed to 8 per cent in 2011-12. Issues such as shortage of spectrum, its pricing and the principle underlying the auction process, changes in tax rules have dampened the outlook for the sector. Presently, almost all telecom operators are facing huge debt burden and cash flow issues. Moderation in sales growth continued and profit margins were lower II.12 Sales growth for listed Non-Government Non-Financial (NGNF) companies moderated in Q3 of 2012-13 to its lowest level since Q3 of 2009-10. Deceleration in sales was observed across manufacturing, IT and non-IT services sector, with a few exceptions such as jewellery, real estate, motor vehicles and other transport equipments. However, operating profit (EBITDA) grew at a positive rate for the second consecutive quarter, reversing the trend of the previous four quarters (Table II.4). Inventory accumulation, as reflected in the change in stock-in-trade to sales ratio was lower in Q3 of 2012-13, reversing the pick-up seen in Q2 of 2012-13 (Chart II.1). Net profit declined sharply during Q3 on a q-o-q basis (Table II.5). Analyst guidance for Q4 of 2012-13 suggests flat earnings growth and further deceleration in sales. Fresh investment proposals declined further II.13 Planned corporate investment, based on the total expenditure of projects for which assiatance was sanctioned by major banks/FIs, moderated sharply in Q3 of 2012-13, reversing the increase observed in Q2 of 2012-13 (Table II.6). Most of the planned investements were in the power and cement sectors during Q3 of 2012-13 (Chart II.2). Momentum towards fiscal consolidation continues II.14 Faced with the challenge of twin deficits, the government embarked on a fiscal consolidation plan with mid-year correction in 2012-13. The containment of GFD at 5.2 per cent of GDP in 2012-13 (RE) in the face of shortfalls in tax revenues, telecommunication receipts and disinvestment proceeds was largely brought about by scaling down plan and capital expenditures. There was, however, a slippage in achieving the budgeted revenue deficit-GDP ratio of 3.4 per cent, reflecting the impact of a sharp rise in non-plan revenue expenditure, particularly subsidies, coupled with shortfall in revenue receipts (both tax and non-tax) during the year (Table II.7).
II.15 During 2013-14, the gross fiscal deficit- GDP ratio is budgeted to decline further to 4.8 per cent. Over the medium to long run, the continuation of fiscal consolidation efforts would significantly enhance sustainable growth and better balance the aggregate demand by helping to revive investment. Importantly, the envisaged fiscal correction is expected to be achieved through a reduction of 0.6 percentage points in the revenue deficit-GDP ratio. Notwithstanding the envisaged fiscal correction, the budgeted key fiscal deficits for 2013-14 are higher than the path set out by the Committee on Roadmap for Fiscal Consolidation (Chairman: Dr. Vijay L. Kelkar). As the fiscal consolidation efforts are primarily revenue-led, it is crucial for a revival in investment climate and growth to ensure the achievement of fiscal consolidation objectives without any sharp adjustment in productive public expenditure. Tax-GDP ratio remains low in 2012-13, but expected to go up in 2013-14 II.16 Gross tax revenues in 2012-13 (RE) were lower than the budgeted level by 3.7 per cent because of decline in collection from Union excise duties, customs duties, corporation tax and wealth tax, although income tax and service tax collections showed an improvement. However, with the expected growth of 19.1 per cent in tax revenues, the gross tax-GDP ratio is estimated to improve by 0.5 percentage points to 10.9 per cent during 2013-14. The increase in tax revenues is sought to be achieved through higher excise and custom duties on certain products and the imposition of an additional surcharge on high-income individuals. II.17 The growth in non-tax revenues is budgeted at 32.8 per cent, mainly on account of a substantial increase in dividends and profits from financial public sector undertakings (PSUs) and receipts from the telecommunications sector. Among non-debt capital receipts, disinvestment receipts are budgeted at a substantially higher level compared to the previous year. Non-plan expenditure growth to moderate in 2013-14 II.18 During 2012-13 (RE), the total expenditure grew faster than the previous year (Table II.8). It is budgeted to accelerate further in 2013-14. Total budgeted expenditure at 14.6 per cent of GDP is higher than the Kelkar Committee target of 13.9 per cent. Among the expenditure components, the projected growth in capital expenditure at 36.6 per cent and plan expenditure at 29.4 per cent, if achieved,could help augment aggregate investment in the economy.
II.19 The growth in non-plan revenue expenditure is budgeted to be contained at 8.0 per cent as against a growth of 13.3 per cent in 2012-13. The restraint on non-plan revenue expenditure growth is critical to ensure that the fiscal consolidation is sustainable, and not excessively reliant on revenue augmentation. The expenditure on subsidies is budgeted at 2.0 per cent of GDP in 2013-14 as against 2.6 per cent of GDP in 2012-13 (Table II.9). The phased deregulation of diesel prices as announced by the Government would reduce petroleum subsidies and the softening of fertiliser prices in the international market together with urea price revisions, if any, may help to keep fertiliser subsidy bill under control. However, there could be a risk of slippage in adhering to the budget estimates of food subsidy expenditure.
II.20 Although plan expenditure has decelerated to 4.1 per cent in 2012-13 (RE), it is budgeted to register a significant increase of 29.4 per cent in 2013-14. Planned capital expenditure in 2012-13 was lower by 14.6 per cent over the budgeted amount and registered a 9.1 per cent y-o-y growth. On this low base, it is budgeted to expand by 30.6 per cent in 2013-14. The re-prioritisation of expenditure in favour of capital expenditure is expected to increase the capital outlay-GFD ratio to 38.5 per cent in 2013-14 from 28.1 per cent in 2012-13 (RE). Need to contain centre’s market borrowing in 2013-14 as budgeted II.21 The pattern of financing the fiscal deficit for 2013-14 shows continued reliance on market borrowings, which is budgeted to finance 89 per cent of the gross fiscal deficit (GFD). The recourse to short-term financing through treasury bills is budgeted at 3.7 per cent. If market borrowings are contained within the budgeted amount, it could provide some monetary space. Fiscal prudence may impart confidence in the economy II.22 On the whole, the fiscal consolidation measures announced in the budget for 2013-14 may lay the foundation for a sustainable rebalancing of government finances. If budgetary targets are adhered to, it will enhance the credibility of the fiscal management, impart confidence among investors, lower risk premia on India and support growth revival. However, over the medium-term, the focus on eliminating the effective revenue deficit by 2015-16 would be critical to fiscal policy strategy as it could create space for counter-cyclical policies to support capital formation and growth. * Despite the well known limitations, expenditure-side GDP data are being used as proxies for components of aggregate demand. |
|||||||||||||||||||||||||||||||||||||||||||||||||||||||||||||||||||||||||||||||||||||||||||||||||||||||||||||||||||||||||||||||||||||||||||||||||||||||||||||||||||||||||||||||||||||||||||||||||||||||||||||||||||||||||||||||||||||||||||||||||||||||||||||||||||||||||||||||||||||||||||||||||||||||||||||||||||||||||||||||||||||||||||||||||||||||||||||||||||||||||||||||||||||||||||||||||||||||||||||||||||||||||||||||||||||||||||||||||||||||||||||||||||||||||||||||||||||||||||||||||||||||||||||||||||||||||||||||||||||||||||||||||||||||||||||||||||||||||||||||||||||||||||||||||||||||||||||||||||||||||||||||||||||||||||||||||||||||||||||||||||||||||||||||||||||||||||||||||||||||||||||||||||||||||||||||||||||||||||||||||||||||||||||||||||||||||||||||||||||||||||||||||

এই পেজটি শেয়ার করুন:


রিজার্ভ ব্যাঙ্ক অফ ইন্ডিয়া মোবাইল অ্যাপ্লিকেশন ইনস্টল করুন এবং সাম্প্রতিক সংবাদগুলিতে দ্রুত অ্যাক্সেস পান!
আমাদের অ্যাপটি ইনস্টল করতে QR কোডটি স্ক্যান করুন


পেজের শেষ আপডেট করা তারিখ:


