2.1 The Indian economy continued to exhibit strong performance in 2007-08, although the pace of growth moderated from 2006-07. Despite moderation, the performance of the Indian economy was in line with the average growth of the previous four years. The growth of the industrial sector was also lower in 2007-08 relative to that in 2006-07. The subdued growth of the manufacturing sector, which accounts for more than four-fifths of Index of Industrial Production (IIP), primarily contributed to the slowdown in the industrial growth. On the other hand, the services sector maintained its record of double digit growth, primarily aided by high growth in telecommunications, software exports and IT-enabled services. In 2007, the SouthWest monsoon was above normal. This, combined with an improvement in water storage levels, resulted in the record foodgrains production in 2007-08.
2.2 Headline inflation, based on year-on-year variations in the wholesale price index (WPI), showed a sustained decline in the first two quarters of 2007-08. However, beginning from December 2007, headline inflation began to pick up on account of hardening of prices of primary non-food articles and manufactured products items such as edible oils/ oilcakes and metals. Year-on-year consumer price inflation, which had eased by January 2008, hardened in the subsequent months.
2.3 Global commodity prices firmed up during 2007-08 led by sharp increases in food and crude oil prices. International crude oil prices rose sharply during the year, reflecting tight supply-demand balance, geopolitical tensions, weakening of the US dollar against major currencies and increased market activities of investors and financial market players. Food prices also firmed up during 2007-08,
especially in the second half, led by wheat, rice, and oilseeds/edible oils on account of surge in demand (both consumption demand and demand for non-food uses such as bio-fuels production), low stocks of major crops and weather related disturbances in some major food-producing regions. In recognition of global demand and supply side pressures on food items, the Government reduced the import duty on wheat and edible oil, followed by export ban on a number commodities, viz., non-basmati rice and pulses, and administrative measures related to stock limit on select products. The Reserve Bank also undertook monetary measures in the form of increase in the CRR. The CRR was raised by 150 basis points in four stages during 2007-08. However, inflation hardened further in the first quarter of 2008-09. In response, the Reserve Bank increased the CRR by 150 basis points in six stages and repo rate by 125 basis points in three stages during April-August 2008.
2.4 The Indian financial markets remained largely orderly in 2007-08, barring the equity market which witnessed some bouts of volatility in line with the trends in international markets. Swings in cash balances of the Government and capital flows were the main drivers of liquidity conditions in the financial markets. Interest rates in the collateralised segment of the money market, which at present comprises about 80 per cent of the total volume of the money market, moved in line with but remained below the call rate during the year. In the foreign exchange market, the Indian rupee generally exhibited two-way movements. Yield in the Government securities market softened during the major part of the year.
2.5 The profitability of scheduled commercial banks improved during 2006-07, primarily on account of robust macroeconomic performance of the economy. Bank credit continued to expand at a robust pace, albeit with some moderation. The asset quality of banks improved further during the year.
2.6 Central and State Government finances showed further consolidation; the revised estimates of key deficit indicators of the Central Government for 2007-08 were placed lower than their budgeted levels. In the provisional accounts, the key deficit indicators declined further. The State Governments continued to show commitment to pursue fiscal correction and consolidation under the Fiscal Responsibility Legislation (FRL).
2.7 The external sector continued to witness impressive performance during 2007-08. The exports of goods and services registered strong growth in 2007-08. However, significantly higher growth of imports, especially non-oil imports led to the widening of the trade deficit. The impact of widening of trade deficit on the current account was contained due to surplus in the invisibles account led by higher private remittances and software services exports. Net capital flows to the country were significantly larger than the current account deficit, resulting in overall balance of payments surplus.
2.8 This chapter presents a detailed account of the macroeconomic developments during 2007-08 and 2008-09 (up to the period for which latest data are available). While Section II presents developments in the real sector, Section III sets out a detailed account of Central and State Government finances. Section IV dwells on monetary and credit developments along with the trends in inflation. Section V outlines the major developments in financial markets. Business operations of financial institutions during 2006-07 are covered in Section VI. Section VII sets out developments in the external sector. Overall assessment is presented in Section VIII.
II. REAL SECTOR
National Income
2.9 According to the revised estimates released by the Central Statistical Organisation (CSO) on May 30, 2008, the Indian economy is estimated to have grown by 9.0 per cent in 2007-08 as against 9.6 per cent in 2006-07. Notwithstanding the moderation, the real GDP growth in 2007-08 was above the average growth of 8.7 per cent during the previous four years (2003-04 to 2006-07) (Chart II.1).
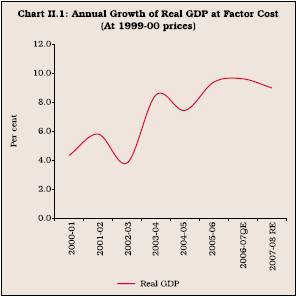
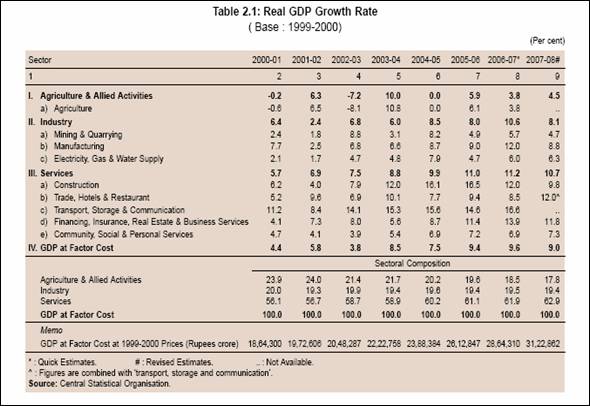
2.10 The moderation in real GDP growth during 2007-08 was due to slowdown in the two major sectors, viz., industry and services sector (Table 2.1 and Table 2.2). The share of agriculture & allied activities GDP declined to 17.8 per cent in 2007-08 from 18.5 per cent in the last year. The share of services sector increased, while that of the industrial sector declined somewhat.

Savings and Investment
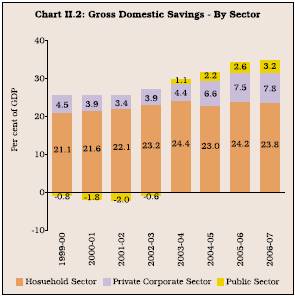
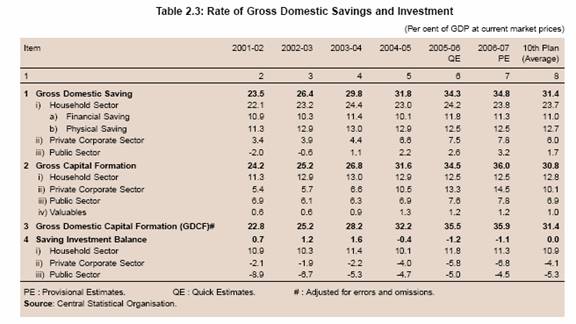
2.11 The rate of gross domestic saving (GDS), as percentage of GDP at current market prices, increased to 34.8 per cent in 2006-07 from 34.3 per cent in 2005-06. The private corporate saving rate improved for the fifth consecutive year from 3.4 per cent in 2001-02 to 7.8 per cent of GDP in 2006-07, reflecting improvement in the performance of the corporate sector leading to higher retained earnings. Savings of the household sector, as percentage of GDP, increased to 23.8 per cent in 2006-07 from 22.1 per cent in 2001-02. Public sector savings, which witnessed a turnaround in 2003-04, continued to improve, largely reflecting the higher savings of non-departmental as well as departmental enterprises (Chart II.2 and Table 2.3).
2.12 As in the past, bulk of investment was financed by domestic saving. The rate of gross domestic capital formation (GDCF) was estimated to be higher at 35.9 per cent in 2006-07 as compared with 35.5 per cent in 2005-06 (Table 2.3 and Chart II.3). Investment activity continued to be driven by the private corporate sector, the rate of which increased to 14.5 per cent of GDP in 2006-07 from 5.4 per cent of GDP in 2001-02. The saving and investment rates for the Tenth Five Year Plan, on an average, were at 31.4 per cent each per annum. The positive saving-investment balance in the first two years of the Plan period was offset by the negative saving-investment balance in the next three years of the Plan period.

Agriculture
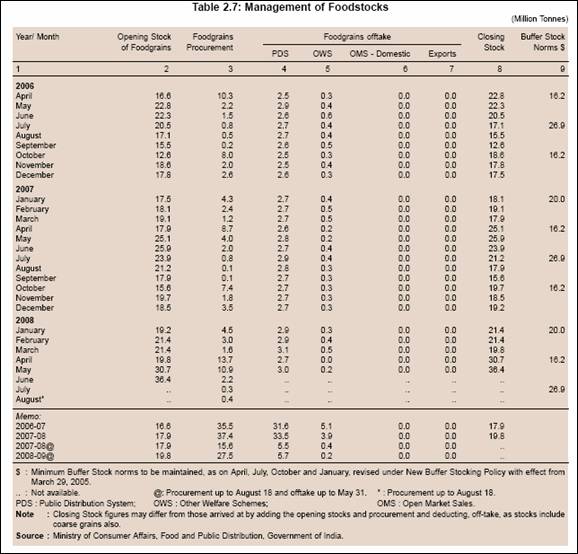
2.13 Agriculture continues to be important to the Indian economy as a large segment of population is dependent on it. According to the Fourth Advance Estimates released by the Ministry of Agriculture, Government of India, the total foodgrains production during 2007-08 was estimated at 230.7 million tonnes (an all-time record), indicating an increase of 6.2 per cent over the previous year (217.3 million tonnes). Accordingly, the growth in agriculture and allied activities was estimated higher at 4.5 per cent for 2007-08 as compared with 3.8 per cent during 2006-07, in the revised estimates of the CSO.
South-West Monsoon 2007
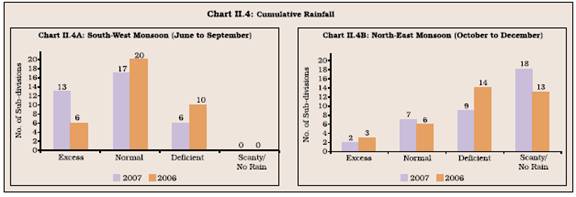
2.14 During the year 2007, the South-West monsoon arrived over Kerala on May 28, four days ahead of the normal date. After a brief spell of hiatus during early June in the advancement of monsoon due to the formation of a Super Cyclone “Gonu” over the East-Central Arabian Sea, the South-West monsoon covered the entire country by July 4, nearly 11 days ahead of the normal schedule. The Long Range Forecast issued by the India Meteorological Department (IMD) on June 29, 2007, placed the South-West monsoon season rainfall at 93 per cent of the long period average (LPA) with a model error of +/- 4 per cent. Actual precipitation during the SouthWest monsoon at 105 per cent of the LPA turned out to be better than the IMD’s forecast. Of the 36 meteorological sub-divisions, cumulative rainfall was excess/normal in 30 sub-divisions (26 sub-divisions during last year) and deficient/scanty/no rain in 6 subdivisions (10 sub-divisions during last year) (Table 2.4 and Chart II.4A).
2.15 Among the four broad homogeneous regions1 , while the South-West monsoon season rainfall was below normal in the North-West India (85 per cent of LPA), it was above normal in the South Peninsula (126 per cent of LPA), Central India (108 per cent of LPA) and North-East India (104 per cent of LPA). In view of the normal performance of the South-West monsoon and improvement in the water storage levels, the Ministry of Agriculture set the target for the total foodgrains production during 2007-08 at around 221.5 million tonnes, marginally higher than the target of 220 million tonnes during the previous year (Table 2.5).

2.16 Five sub-divisions (West Uttar Pradesh, Haryana, Chandigarh and Delhi, Punjab, Himachal Pradesh and East Madhya Pradesh) experienced moderate drought conditions (rainfall deficiency of 26 to 50 per cent) at the end of the season. Monsoon activity was subdued at the beginning of the season. Large rainfall deficiency was observed during the first week of June, third and fourth weeks of July and third week of August. During the rest of the season, rainfall was well-distributed in time. Cumulative rainfall over the country, on the whole, remained always above normal beginning the last week of June. The month-wise distribution showed that rainfall was above normal in June (19 per cent) and September (18 per cent), while it was only marginally below normal during July (3 per cent) and August (1 per cent).
Reservoir Status
2.17 Water stock in the 81 major reservoirs, accounting for around 72 per cent of the total reservoir capacity of the country, was 79 per cent of the full reservoir level (FRL) at the end of the South-West monsoon season (September 27, 2007), lower than 87 per cent during the corresponding period of the previous year, but higher than the average of 67 per cent during the last 10 years.
North-East Monsoon 2007
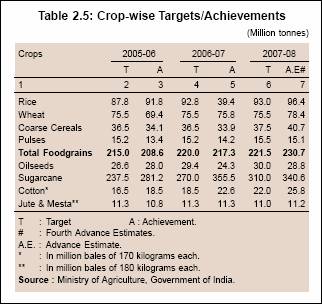
2.18 The rainfall during North-East monsoon commenced over Tamil Nadu and adjoining States of Southern Peninsula on October 22, 2007. The progress of North-East monsoon (October 1 to December 31, 2007) was deficient with cumulative rainfall 32 per cent below normal as compared with 21 per cent below normal during the corresponding period of the previous year. Of the 36 meteorological sub-divisions, cumulative rainfall was excess/normal in 9 sub-divisions (same as previous year) and deficient/scanty/no rains in 27 sub-divisions (same as previous year) (Chart II.4B). At the end of the season, the total reservoir storage as on January 3, 2008 was 61 per cent of the FRL (65 per cent during the previous year and an average of 51 per cent during the last 10 years).
Kharif 2007
2.19 The Four th Advance Estimates placed foodgrains production during 2007-08 at an all-time high of 230.7 million tonnes, indicating an increase of 6.2 per cent over the previous year (217.3 million tonnes). Total kharif foodgrains production was placed at 121.0 million tonnes, an increase of 9.4 per cent over the previous year (110.6 million tonnes). Among foodgrains, while the production of kharif rice (3.3 per cent) witnessed a modest increase, that of coarse cereals (23.8 per cent) and pulses (34.4 per cent) increased significantly. Further, the production of kharif oilseeds recovered strongly with an increase of 41.6 per cent over the previous year.
Rabi 2007-08
2.20 Rabi foodgrains production for 2007-08 was placed at 109.7 million tonnes, a increase of about 2.8 per cent over the previous year. While a decline was observed for pulses (7.9 per cent), crops such as wheat (3.4 per cent), coarse cereals (8.7 per cent) and rice (3.3 per cent) registered an increase. The production of rabi oilseeds declined by 12.6 per cent.
2.21 On the whole, the record foodgrains production during 2007-08 was mainly led by the strong performance of the kharif season production. Among foodgrains, the overall production of pulses for 2007-08 was estimated at 15.1 million tonnes (14.2 million tonnes in 2006-07), rice at 96.4 million tonnes (93.4 million tonnes) and coarse cereals at 40.7 million tonnes (33.9 million tonnes)
(Table 2.6).

Progress of Sowing in 2007-08
2.22 During 2007-08, kharif sowing showed improvement over the previous year. For all crops, the area sown increased by 2.8 per cent over the previous year, which was also 4 per cent above the normal sown area during the kharif season. The area sown in the case of rice, maize, pulses, oilseeds, cotton and sugarcane was higher, while that under jowar and bajra was lower than that in the previous year.
2.23 The area sown under rabi crops was lower by 2.8 per cent compared with the previous year. The sowing under rabi was lower in the case of coarse cereals, pulses and oilseeds, while it was marginally higher in the case of rice and wheat.
Procurement, Offtake and Stocks of Foodgrains
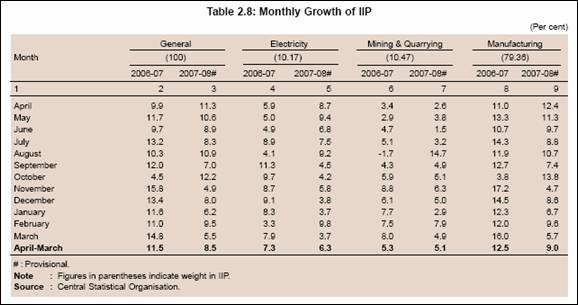
2.24 The procurement of foodgrains (rice and wheat) during 2008-09 (up to August 18, 2008) at 27.5 million tonnes was higher by around 76.0 per cent over the corresponding period of the preceding year (Table 2.7). This was mainly on account of higher procurement of wheat at 22.6 million tonnes during 2008-09 so far (up to August 18, 2008) as against 11.1 million tonnes during the corresponding period of the previous year. Total offtake of rice and wheat during 2008-09 (April 1 to May 31, 2008) at 5.9 million tonnes was marginally higher by 0.1 per cent over the corresponding period of the previous year. While the offtake under the welfare schemes declined significantly by around 55.0 per cent, this was offset by increase in the offtake under Targeted Public Distribution System (TPDS) by around 4.6 per cent. The total stocks of foodgrains with Food Corporation of India and other Government agencies as on June 1, 2008 at 36.4 million tonnes were 40.3 per cent higher as compared with 25.9 million tonnes in the corresponding period of last year. This was mainly due to the increase in the stocks of wheat from 13.3 million tonnes, as on June 1, 2007 to 24.1 million tonnes, as on June 1, 2008.
Industry
2.25 The growth in terms of Index of Industrial Production (IIP) moderated to 8.5 per cent during 2007-08 from 11.5 per cent recorded during 2006-07. The moderation in the growth of the industrial sector was largely on account of subdued performance of the manufacturing sector, which contributes approximately 90 per cent to the IIP growth (weight in IIP 79.36 per cent) (Table 2.8). The growth of the mining and the electricity sectors witnessed some moderation. Slower growth in thermal and hydro-power generation resulted in lower growth in the electricity sector.
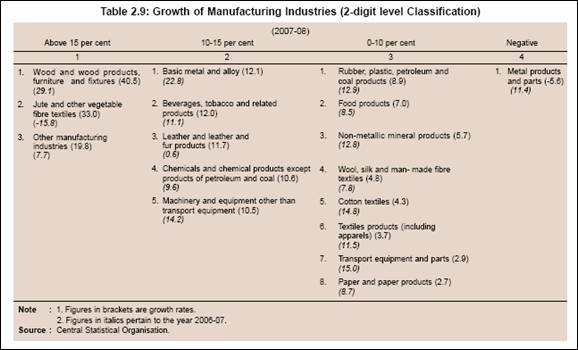
2.26 During 2007-08, six manufacturing industry groups (as per 2-digit level classification) recorded accelerated growth, while eleven recorded decelerated or negative growth (Table 2.9).
2.27 Three industries constituting around 5.9 per cent weight in IIP, viz., ‘wood and wood products’, ‘other manufacturing industries’ and ‘jute and other vegetable fibre textiles’ recorded growth above 15 per cent and contributed 14.3 per cent to manufacturing sector growth during 2007-08. ‘Jute and other vegetable fibre textiles’ made a turnaround, while ‘metal products and parts’ recorded negative growth during the period. The industry groups with relatively higher weight in the IIP, viz., ‘chemicals and chemical products (except products of petroleum and coal)’, ‘machinery and equipment’ and ‘basic metal and alloy industries’ recorded growth in the range of 10-15 per cent during 2007-08.
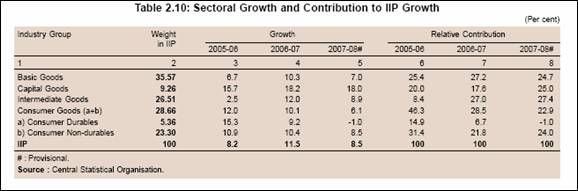
2.28 In terms of the use-based classification, all the key groups decelerated during 2007-08 (Table 2.10). Decline in production in both nitrogenous and phosphatic fertiliser segments, and some steel products such as carbon steel, steel wires, coil and H.R. sheets led to lower growth of the basic goods sector. The decline in production of some chemical dyes, tin metal containers, ball and roller bearings, naptha, polished granite, etc., resulted in deceleration in the intermediate goods sector.
2.29 The capital goods sector, however, continued to exhibit robust growth performance. During 2007-08, the capital goods sector recorded growth of 18.0 per cent as compared with 18.2 per cent during 2006-07. The consumer goods sector recorded lower growth of 6.1 per cent. As a result, its contribution to IIP growth declined to 22.9 per cent during 2007-08 from 28.5 per cent during 2006-07. This was on account of lower growth in consumer non-durables and decline in production of consumer durables. Consumer durables recorded negative growth of 1.0 per cent (9.2 per cent in 2006-07) due to decline in the production of metal utensils, type writers, telephone instruments, tape recorders, motor cycles, alarm time pieces and wrist watches, among others. Further, slowdown in the consumer durables sector appears to be overstated since the product obsolescence in the segment due to changing consumer preferences and availability of technologically superior products in recent years is not adequately captured by the present IIP basket based on 1993-94 series (see RBI Annual Report 2007-08, Box II.6, p.60).
Infrastructure
2.30 The growth of the infrastructure sector decelerated to 5.6 per cent during 2007-08 from 9.3 per cent during 2006-07 (Table 2.11). The lower growth was contributed by all the core infrastructure sectors, barring coal. The electricity sector recorded lower growth of 6.3 per cent and contributed 39.3 per cent to the core sector growth during 2007-08. The cement sector recorded the highest growth of 8.1 per cent during 2007-08.

2.31 The slowdown in steel exports from the country contributed to decelerated growth of steel output, even as the domestic demand continued to be strong. The crude oil sector decelerated sharply to 0.4 per cent on account of decline in production in the Mumbai High unit of ONGC. The growth in the cement sector fluctuated during 2007-08 mainly due to base effect. Moderation in growth of the petroleum refinery sector was attributable to base effect, lower capacity utilisation and decline in production in some public sector refineries.
Services Sector
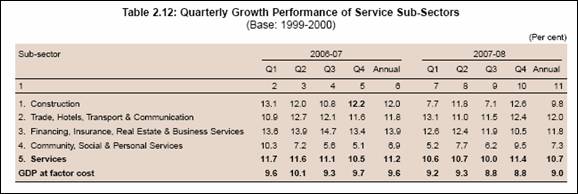
2.32 The services sector grew by 10.7 per cent during 2007-08 over and above 11.2 per cent growth in 2006-07 (Table 2.12). The year 2007-08 was the third year in succession when the services sector posted double digit growth. The sector accounts for 62.9 per cent of domestic output. The ‘trade, hotels, transport and communication’ sector has recorded double digit growth for the last five years and presently accounts for almost half of the services sector growth. The rise in international trade has been remarkable in the last six years with exports and imports averaging annual growth of 24.0 per cent and 29.5 per cent, respectively, during the period 2002-03 to 2007-08. In addition to strong growth in international trade, the domestic retail boom, rapid growth in mobile network connections and aviation uptrend has driven the growth of this sub-sector.
2.33 The ‘community, social and personal services’ recorded improvement in growth during 2007-08 mainly on account higher expenditure on these services by the Central Government. Rise in exports of business process outsourcing and information technology enabled services in conjunction with spread of banking and insurance services sustained the double digit growth of ‘financing, insurance, real estate and business services’ albeit with some moderation due to base effect.
Information Technology Enabled Services and Business Process Outsourcing
2.34 The Indian software and services industry continued its strong performance during 2007-08, with outsourcing remaining the prime growth driver of ITES-BPO industry in India. However, some shift in outsourcing markets was observed with a growing traction in Europe and Asia Pacific offsetting a marginal decline in the share of America. The Indian IT industry has increased its exposure to other geographical regions in the recent times. According to the annual NASSCOM survey, the Indian IT-ITES industry (including domestic market) grew by 33.3 per cent during 2007-08. The software and services exports segment grew by 28.8 per cent to register revenues of US$ 40.3 billion in 2007-08, up from US$ 31.3 billion in 2006-07. While India continues to be the most preferred destination for global IT sourcing due to its talent pool. Nevertheless, in respect of quality management and security, there are certain short to medium term challenges that need to be addressed. These include skill upgradation of the available talent, infrastructure development and sustenance of a positive policy/regulatory environment. These require timely, consistent and continued efforts from all stakeholders including industry and the Government to maintain the competitive edge in this field.
Industrial Outlook
2.35 Despite some moderation in IIP growth, industry, continued to record firm performance during 2007-08, with strong investment demand, reflecting capacity expansions. However, the growth of the consumer goods sector decelerated significantly, primarily on account of decline in the production of consumer durables. The mining sector, which did not perform well in 2005-06, registered improvement in 2006-07 and put up a modest growth in 2007-08. The incentives in terms of excise duty concessions and adjustments in personal income tax slabs in the Union Budget 2008-09 along with the implementation of the award of the Sixth Pay revision of salaries of the Central Government employees are likely to give a fillip to the consumer goods sector in 2008-09. However, there are certain downside risks such as steep rise in industrial input prices, elevated prices of crude oil, turbulence in global financial markets, weakening of growth momentum in advanced economies and domestic inflationary conditions.
2.36 Forecasts of economic growth for 2008-09 by various agencies are set out in Table 2.13.
III. FISCAL SITUATION
Central Government Finances
2.37 The revised estimates (RE) of the finances of the Central Government during 2007-08 placed the key deficit indicators, viz. revenue deficit (RD) and fiscal deficit (GFD) in relation to GDP lower than the budget estimates (BE). In the provisional accounts, these ratios, i.e., RD and GFD as percentage of GDP declined further. Primary surplus in relation to GDP in provisional accounts was also higher than that of RE which, in turn, was higher than the BE. The improvement in revenue receipts mainly accounted for the reduction in the key deficit indicators. The RD and GFD in relation to GDP in the 2008-09 budget estimates were expected to decline further from the revised estimates and provisional accounts for 2007-08. While the FRBM target relating to GFD is set to be achieved as per the mandate, the stipulated target of zero RD by 2008-09 has been rescheduled by one more year to 2009-10 primarily on account of a shift in plan priorities in favour of revenue expenditure-intensive programmes and schemes. The Budget proposed that the ongoing reforms and fiscal correction initiatives would continue to be supportive of raising domestic demand and investment, both of which are main drivers of growth of GDP. Towards this end, the Budget sought to rationalise personal income tax and central excise, broaden the tax base by extending service tax to more ser vices and improve expenditure management with focus on outcome and provision of adequate investment for the social sector. The major thrust of the Budget was to accord priority for sustained, rapid and more inclusive growth with a sharp focus on development of physical and social infrastructure.

2.38 A major proposal in the Budget was the introduction of a scheme of Debt Waiver and Debt Relief for extending help to the distressed farmers, estimated cost of which to the Central Government has been placed at Rs.71,680 crore. This expenditure would be disbursed in phases over four fiscal years albeit with some front loading.
2.39 The focus of the Union Budget 2008-09, the second year of the Eleventh Five Year Plan, was on consolidation, securing the ongoing programmes on a firm financial foundation, close monitoring of implementation and enforcing accountability, and measuring the outcomes in terms of the targets achieved as well as their quality. The Government, therefore, proposed to strengthen evaluation by authorising independent evaluations of the major schemes. A Central Plan Scheme Monitoring System (CPSMS) was also proposed to be put in place to monitor scheme-wise and State-wise releases for the Central Plan and Centrally Sponsored Schemes. The Budget laid special emphasis on schemes for upliftment of women and children.
2.40 The tax policy in recent years has been governed by the overarching objective of increasing the tax-GDP ratio for achieving fiscal consolidation. This is sought to be achieved both through appropriate policy interventions and a steadfast improvement in the quality and effectiveness of tax administration. On the direct taxes front, the main strategy is to further consolidate the achievements made in recent years in terms of (i) minimisation of distortions within the tax structure by expanding the tax base and maintaining the moderate tax rates; (ii) to promote voluntary compliance through tax payer services coupled with enhanced deterrence levels; and (iii) extensive use of information technology to enhance the functional efficiency of Income Tax Department. On the indirect taxes front, the strategy is to integrate the taxes on goods (central excise) and services and finally move on to a goods and services tax. Towards this end, the general CENVAT rate was reduced from 16 per cent to 14 per cent, which is very close to the tax rate on services at 12 per cent. In the case of service tax, the strategy is to expand the tax base, simplification of law and procedure, improved tax administration and increase in tax compliance. In order to broaden the tax base, the scope and coverage of services leviable are further widened by adding more services and expanding the scope of some of the existing services.
Revised Estimates 2007-082
2.41 The revised estimates for 2007-08 carried forward the process of fiscal correction and consolidation under the FRBM framework. Reflecting this, the revenue deficit and fiscal deficit relating to GDP were placed lower than their budgeted levels. Notwithstanding an increase in revenue expenditure on account of higher provision for interest payments and subsidies, the significant increase in tax and non-tax revenue (mainly on account of communication services) resulted in lower revenue deficit. The improvement in revenue deficit coupled with the decline in capital expenditure resulted in lower level of GFD. The primary surplus in the revised estimates improved significantly. Plan expenditure did not diverge much from the budget estimates, though Central assistance for the State and UT plans increased markedly in the revised estimates.
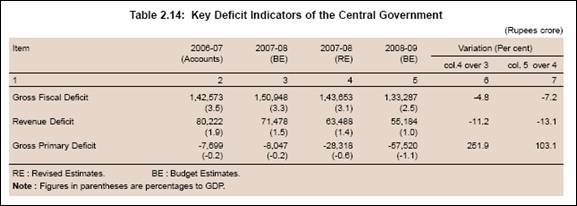
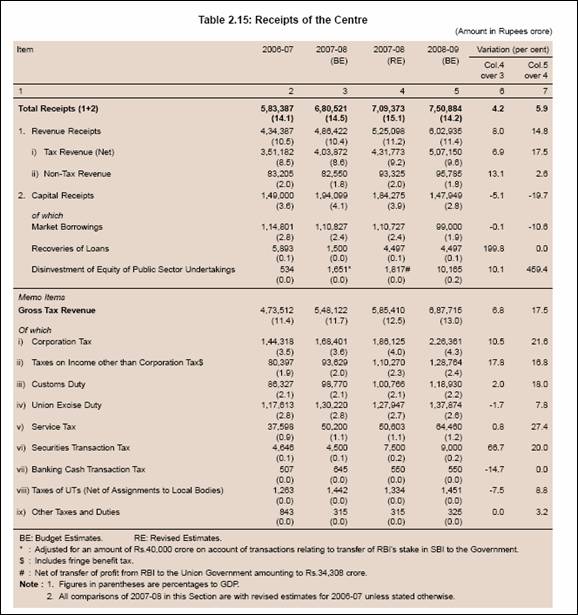
2.42 The revenue deficit in the revised estimates was lower by 11.2 per cent and constituted 1.4 per cent of the GDP in 2007-08 as against the budgeted level of 1.5 per cent. The decline in revenue deficit was on account of a marked improvement in revenue receipts by Rs.38,676 crore (8.0 per cent), which offset the increase in revenue expenditure by Rs.30,686 crore (5.5 per cent). The GFD was lower by Rs.7,295 crore (4.8 per cent). In terms of GDP, it was lower at 3.1 per cent than the budget estimates (3.3 per cent)
(Table 2.14). Primary surplus at 0.6 per cent of GDP in the revised estimates for 2007-08 was about 3.5 times higher than the budget estimates.
2.43 The gross tax revenue in the revised estimates for 2007-08 was higher by Rs.37,288 crore than the budget estimates. The increase in gross tax revenue in the revised estimates was mainly on account of higher collection in corporation and personal income tax than the budgeted level. The increase in corporation tax by Rs.17,724 crore or 10.5 per cent was on account of higher profits backed by sound balance sheet of the corporates. The personal income tax collection increased by Rs.16,641 crore or 17.8 per cent mainly due to improved tax compliance. Among the recently introduced taxes, fringe benefit tax was estimated to yield Rs.6,800 crore in 2007-08, securities transactions tax Rs.7,500 crore and banking cash transaction tax Rs.550 crore. Non-tax revenue was also 13.1 per cent higher than the budget estimates on account of higher receipts from communication services by way of one-time entry fee from dual technology users and new Unified Access Service Licence (UASL) operators (Table 2.15).
2.44 Under non-debt capital receipts, recoveries of loans and advances are budgeted to increase significantly in the revised estimates for 2007-08 over budget estimates. The proceeds from disinvestment of central public sector undertakings are estimated to increase considerably.
2.45 Revenue expenditure in the revised estimates for 2007-08 was higher by 5.5 per cent than the budget estimates, while capital expenditure showed an increase of 3.2 per cent over the budget estimates (Table 2.16). Revenue expenditure was higher mainly on account of interest payments, fertiliser and interest subsidies, grants to States and pensions. Within capital expenditure, loans and advances and non-defence capital outlay were higher than the budget estimates.
Budget Estimates 2008-093
2.46 After achieving the targets in the preceding year, the Union Budget for 2008-09 proposed to further strengthen the fiscal correction process as stipulated in the Fiscal Responsibility and Budget Management (FRBM) Rules, 2004. The key deficit indicators, viz., revenue deficit (RD) and gross fiscal deficit (GFD), as percentage to GDP, in the budget estimates (BE) for 2008-09 were placed lower than those under the revised estimates (RE) for 2007-08. The FRBM roadmap envisages an annual reduction of at least 0.3 percentage point in the fiscal deficit and 0.5 percentage point in the revenue deficit. While the FRBM targets relating to GFD are set to be achieved as per the mandate, the stipulated target of zero revenue deficit by 2008-09 under the FRBM Rules, 2004 was proposed to be rescheduled primarily on account of a shift in plan priorities in favour of revenue expenditure-intensive programmes and schemes. Furthermore, there are systemic rigidities in containing non-plan expenditures in the short-term, particularly arising from committed and obligatory expenditures such as interest payments, pensions and defence. The GFD/GDP ratio, however, would be lower than the FRBM target. Accordingly, the key deficit indicators, viz., revenue deficit, gross fiscal deficit and primary deficit, as per cent of GDP, were budgeted lower at 1.0 per cent, 2.5 per cent and -1.1 per cent, respectively, in 2008-09 as compared with 1.4 per cent, 3.1 per cent and -0.6 per cent, respectively, in the preceding year (Table 2.14). The revenue deficit and GFD are understated to the extent the Government incurs liabilities on account of oil, food and fertiliser bonds which are recorded below the line. Therefore, as a step towards bringing about greater transparency in fiscal accounting, the Budget reported in its revised estimates for 2007-08 the issuance of special securities aggregating Rs.18,757 crore.

2.47 The Government continued the process of fiscal consolidation through better expenditure management. The revenue expenditure in 2008-09 was budgeted to show a lower growth of 11.8 per cent than 14.4 per cent in 2007-08 (Table 2.16). Notably, the growth of total subsidies was budgeted to decelerate to 2.4 per cent as against an increase of 22.1 per cent in 2007-08. Adjusting for Rs.35,531 crore incurred on account of transactions relating to the transfer of the Reserve Bank’s stake in State Bank of India to the Government, the capital expenditure was budgeted to increase by 8.8 per cent as against 24.0 per cent in 2007-08.
2.48 The revenue receipts in 2008-09 were budgeted to increase by 14.8 per cent as compared with 20.9 per cent increase in 2007-08, primarily because of lower budgeted increase of 17.5 per cent in gross tax collections as against an increase of 23.6 per cent in 2007-08. Among the direct taxes, the growth in corporation tax collections was budgeted to decelerate to 21.6 per cent in 2008-09 from a high of 29.0 per cent in 2007-08. The growth of personal income tax was estimated to decelerate to 16.8 per cent from 37.2 per cent in 2007-08. In the case of indirect taxes, the collections under customs duty were budgeted to increase by 18.0 per cent, higher than 16.7 per cent a year ago. Excise duty collections were, however, budgeted to show a lower growth of 7.8 per cent as compared with 8.8 per cent. Non-tax revenues (NTR) were budgeted to increase to Rs.95,785 crore in 2008-09 from Rs.93,325 crore in 2007-08, reflecting higher revenues from dividends and profits. The interest receipts, on the other hand, continued to decline primarily because lending by the Centre to the States is limited only for loans under externally aided projects as recommended by the Twelfth Finance Commission (refer Table 2.15).
2.49 The financing pattern of the gross fiscal deficit indicates that the net market borrowings (excluding allocations budgeted under the MSS) were budgeted to finance 74.3 per cent of the GFD in 2008-09 as against 77.1 per cent in 2007-08. On the other hand, the share of external assistance was budgeted to increase to 8.2 per cent from 6.9 per cent in 2007-08. Investments by the National Small Savings Fund (NSSF) in special Central Government securities were budgeted to finance 7.4 per cent of GFD. During 2008-09, the Budget proposed to drawdown cash balances to finance 5.4 per cent of GFD, as against the built up of cash balances amounting to 12.7 per cent of GFD in the previous year (Table 2.17).
Outlook
2.50 The Budget 2008-09 continued to pursue the path of fiscal correction with emphasis on quality in expenditure in accordance with the FRBM goals. Although the Budget has met the FRBM target of annual reduction of 0.5 per cent of GDP in the revenue deficit, it was still placed at 1.0 per cent of GDP due to increased expenditure on health and education. Finances of the Central Government may come under pressure during 2008-09 on account of implementation of the Sixth Pay Commission (SPC) award, including payment of arrears,higher oil subsidies, increase in fertiliser subsidy due to sharp rise in the price of raw materials and fertiliser in the international market and the expenditure on account of debt waiver of the farmers.

State Finances
2.51 The State Governments have reiterated commitment to carry forward the process of fiscal correction and consolidation in their budgets for 2008-09. As at end-March 2008, all States, barring West Bengal and Sikkim, have enacted Fiscal Responsibility Legislation (FRL). All States have implemented value added tax (VAT) in lieu of sales tax, with the last State Uttar Pradesh implementing VAT with effect from January 1, 2008.
2.52 The State Governments in their budgets for 2008-09 proposed various policy initiatives aimed at augmenting their revenues and directing expenditure towards the priority areas. The budgetary allocations for the productive sectors such as agriculture and water conservation, infrastructure, power, urban development and housing sector are proposed to be raised in 2008-09 in a number of States. The State Governments are also undertaking construction of houses for low and middle income group families as also slum dwellers and below poverty line families under various schemes, including Indira Awas Yojana and Jawaharlal Nehru National Urban Renewal Mission (JNNURM). The State Governments are undertaking computerisation of the treasuries and tax depar tments. Maharashtra State has implemented a computerised budget distribution system aimed at improving the cash flow system. A few more States, including Arunachal Pradesh, introduced gender budgeting for the empowerment of women. Kerala has announced the setting up of a Gender Board. Manipur has proposed to set up Guarantee Redemption Fund and Consolidated Sinking Fund. In terms of Article 280 of the Indian Constitution, the Thirteenth Finance Commission was constituted on November 13, 2007, which will have an award period spanning 2010-15. The Sixth Pay Commission constituted by the Government of India for Central Government Employees submitted its Report on March 24, 2008. While a number of States follow the recommendations of Union Pay Commission, some States constitute separate Pay Commissions for reviewing the salaries and other benefits for their employees.
Budget Estimates – 2008-094
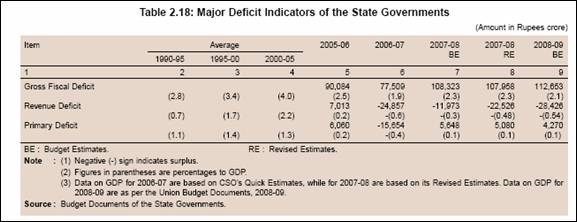
2.53 The consolidated revenue surplus of the States is estimated at Rs.28,426 crore (0.54 per cent of GDP) in 2008-09 (BE) as compared with Rs.22,526 crore (0.48 per cent of GDP) in 2007-08 (RE). Although the GFD is budgeted higher at Rs.1,12,653 crore in 2008-09 (BE) than Rs.1,07,958 crore in 2007-08 (RE), as percentage of GDP, it would come down to 2.1 per cent in 2008-09 (BE) from 2.3 per cent in 2007-08 (RE). The consolidated primary deficit is budgeted at 0.1 per cent of GDP in 2008-09 (BE), the same as in the previous year (Table 2.18).
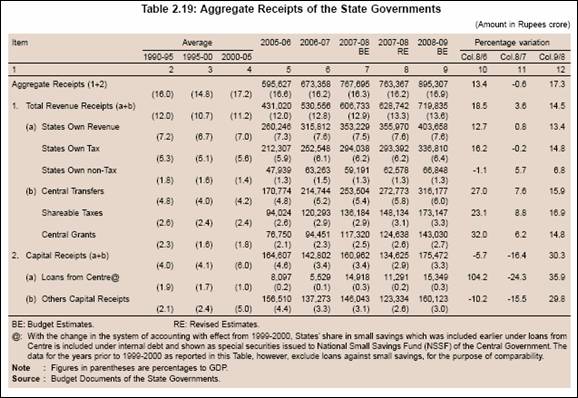
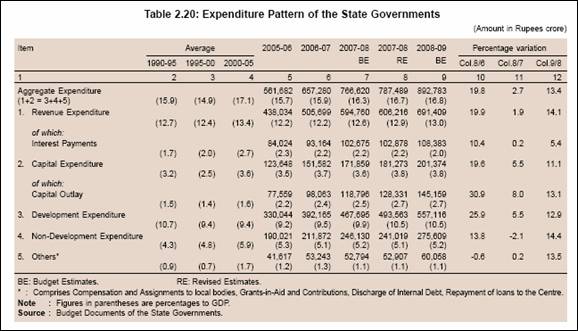
2.54 The improvement in the revenue account during 2008-09 is budgeted to be mainly achieved by increase in revenue receipts, which would emanate from increase in shareable taxes, States’ own tax revenue and grants from the Centre (Table 2.19). The improvement in the revenue account would also be facilitated by deceleration in revenue expenditure, particularly in interest payments and pension. Capital outlay, as percentage to GDP, would be maintained at 2.7 per cent in 2008-09 (BE) as in the previous year. It is important to note that developmental expenditure is budgeted to decelerate in 2008-09 (BE), while non-developmental expenditure is budgeted to accelerate (Table 2.20).
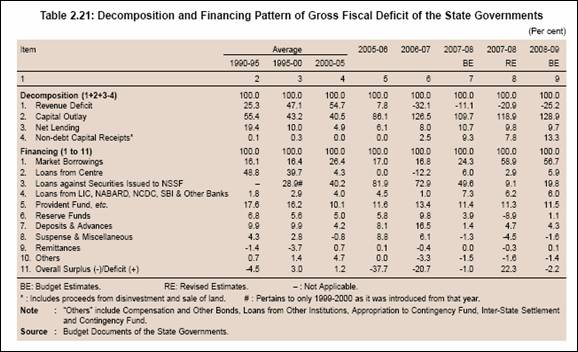
2.55 With the budgeted revenue surplus of 0.5 per cent of GDP in 2008-09 (BE), the revenue surplus would finance capital outlay. Market borrowings would finance the major portion of GFD (56.7 per cent) in 2008-09 (BE), followed by special securities issued to NSSF (19.8 per cent) and provident funds (11.5 per cent) (Table 2.21).
2.56 The provisional net allocation under market borrowing programme of the State Governments for 2008-09 is placed at Rs.47,044 crore. Taking into account repayments of Rs.14,371 crore and additional allocation of Rs.45 crore, the gross market borrowings of State Governments are estimated at Rs.61,460 crore. During the current year so far (up to July 31, 2008), eight State Governments raised Rs.10,812 crore through auctions with a cut-off yield in the range 8.39-9.90 per cent as compared with Rs.8,542 crore by 14 State Governments (cut-off yield ranging from 8.00-8.57 per cent) during the corresponding period of the previous year.
Outlook
2.57 In all, twenty-five State Governments have budgeted revenue surplus during 2008-09, the final year of the TFC target of eliminating revenue deficit. Further, as many as seventeen State Governments have budgeted GFD-GSDP ratio at 3 per cent or less, a year ahead of the TFC target. As the State Governments come closer to meeting the objective of reduction in deficit indicators, the States need to place strong emphasis on sustaining this progress in the post-FRL period. It would be important to generate adequate fiscal space through revenue augmentation that could be utilised for financing developmental expenditure. The generation of revenues through improving efficiency of tax collection and appropriate charges on public services assumes particular significance under the rule-based fiscal framework on account of implicit cap on financing of expenditure by borrowings. States can, however, price the range of services that they provide only by improving the quality of delivery of services.
2.58 The efforts of the States towards reducing fiscal imbalances was aided by larger devolution and transfers from the Centre based on the recommendations. The implementation of VAT by all the States also aided in improving the buoyancy of States’ taxes. On the expenditure side, while States have been able to scale
up capital outlay, there has been some rationalisation of revenue expenditure during the FRL period. The financing pattern of GFD has undergone a compositional shift with a decline in accruals under the NSSF. As a result, the market borrowings have emerged as the major source of financing of GFD. The State Governments have maintained a high level of cash surplus during 2008-09 so far, as reflected in their investments in intermediate and auction Treasury Bills.
2.59 While the fiscal consolidation efforts have enabled a reduction in key deficit indicators, the level of States’ outstanding liabilities continue to remain high as compared with many emerging and developing countries. Although there has been some reduction in the debt-GDP ratio due to debt consolidation and relief measures, the States continue to hold a large chunk of high cost debt. A few States have prepaid high cost debt on account of comfortable cash balance position.
2.60 The States also need to factor in the impact of higher staff remuneration based on the recommendations of the Sixth Pay Commission of the Central Government. The State Governments may incur revenue losses due to lower tax devolution on account of reduction of excise and customs duties on petroleum products by the Centre and reduction of sales tax on these products by some States. In the near future, State finances would be shaped by the recommendations of the Thirteenth Finance Commission that was set up in November 2007 (award period: 2010-15) and the implementation of the Goods and Services Tax (GST) scheduled from April 1, 2010.
Public Debt
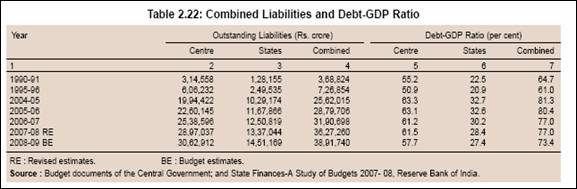
2.61 The combined outstanding liabilities of the Central and State Governments, as percentage to GDP, were budgeted to decline from 77.0 per cent at end-March 2008 to 73.4 per cent by end-March 2009 as a result of the fiscal consolidation process that is underway at the Centre and States as well as strong macroeconomic performance (Table 2.22).
IV. MONETARY AND CREDIT SITUATION
Monetary Condition
2.62 Against the backdrop of emerging inflationary, pressures, the Reserve Bank in its Annual Policy Statement for 2007-08 (April 2007) reaffirmed its resolve to respond swiftly with all possible measures to developments impinging on inflation expectations and the growth momentum. As the overarching policy challenge was to manage the transition to a higher growth path, while containing inflationary pressures, the policy preference for the period ahead was indicated as strongly in favour of price stability and well-anchored inflation expectations with the endeavour to contain inflation close to 5.0 per cent in 2007-08, while reinforcing the medium term objective to condition the policy and perceptions in the range of 4.0-4.5 per cent. Towards this end, it was indicated that the Reserve Bank will continue with its policy of active demand management of liquidity through appropriate use of all the policy instruments at its disposal flexibly as and when the situation warranted.
2.63 Headline inflation turned benign by the First Quarter of the Annual Statement on Monetary Policy for 2007-08, reflecting the combined impact of lagged and cumulative monetary policy actions and fiscal and administrative measures for supply management. These measures also had a salutary effect on inflation expectations. Nevertheless, the First Quarter Review of July 2007 added that monetary management needed to be watchful of movements in commodity prices, particularly oil prices, the elevated levels of asset prices and the re-emergence of pricing power among producers as potential threats to inflation expectations. The outlook for inflation in 2007-08 was, however, left unchanged in the Review.
2.64 The Mid-Term Review continued with the stance set out in the Annual Policy Statement for 2007-08 and the First Quarter Review reinforcing the emphasis on price stability and well-anchored inflation expectations while ensuring a monetary and interest rate environment that supported export and investment demand in the economy so as to enable continuation of the growth momentum. Credit quality and orderly conditions in financial markets for securing macroeconomic and, in particular, financial stability were re-emphasised while simultaneously pursuing greater credit penetration and financial inclusion. While reiterating a readiness to respond swiftly with all possible measures as appropriate to the evolving global and domestic situation impinging on inflation expectations, financial stability and the growth momentum, the Mid-Term Review resolved to take recourse to all possible options for maintainingstability and the growth momentum in the economy in view of the unusually heightened global uncertainties, and the unconventional policy responses to the developments in financial markets.
2.65 The Third Quarter Review (January 2008) of the Annual Statement on Monetary Policy, while continuing to re-emphasise the policy stance of the Mid-Term Review, took note of the developments in global financial markets in the context of the subprime crisis and highlighted the need of more intensified monitoring and swift responses with all available instruments to preserve and maintain macroeconomic and financial stability. While it maintained that there was no visible or immediate threat to financial stability in India from global developments, it underscored the need for continued but heightened vigilance with an emphasis on readiness to take timely, prompt and appropriate measures to mitigate the risks to the extent possible. Accordingly, it emphasised the need to monitor the evolving heightened global uncertainties and domestic situation impinging on inflation expectations, financial stability and growth momentum in order to respond swiftly with both conventional and unconventional measures, as appropriate.
2.66 The Reserve Bank in the Annual Policy Statement for 2008-09 released in April 2008 placed the real GDP growth for 2008-09 at around 8.0 to 8.5 per cent. In view of the prevailing assessment of the economy including the outlook for growth and inflation, the overall stance of monetary policy in the Annual Policy Statement was broadly stated as (i) to ensure a monetary and interest rate environment that accords high priority to price stability, well-anchored inflation expectations and orderly conditions in financial markets while being conductive to continuation of the growth momentum; (ii) to respond swiftly on a continuing basis to the evolving constellation of adverse international developments and to the domestic situation impinging on inflation expectations, financial stability and growth momentum, with both conventional and unconventional measures, as appropriate; and (iii) to emphasise credit quality as well as credit delivery, in particular, for employment-intensive sectors, while pursuing financial inclusion.
2.67 The First Quarter Review of the Annual Statement on Monetary Policy noted that after the announcement of the Annual Policy Statement in April 2008, global as well as domestic developments, on both supply and demand sides pointed to accentuation of inflationary pressures, especially in terms of inflation expectations and perceptions. In an environment of surging global inflation and with domestic inflation also rising to a 13-year high, the Review noted with concern that inflation had emerged as the biggest risk to the global outlook, having risen to very high levels across the world, which had not been generally seen for a couple of decades in the past. As such, bringing down inflation from the high levels and stabilising inflation expectations assumed the highest priority in the stance of monetary policy. It noted that looking forward, the global and, more impor tantly, the domestic factors pose severe challenges to monetary management and warranted reinforced policy actions on several fronts. Accordingly, a realistic policy endeavour would be to bring down inflation from the then prevailing level of about 11.0-12.0 per cent to a level close to 7.0 per cent by March 31, 2009. Taking into account aggregate demand management and supply prospects described above, the projection of real GDP growth of the Indian economy in 2008-09 was placed at around 8.0 per cent, barring domestic or external shocks. Against this backdrop, the stance of monetary policy was retained as stated in the Annual Policy Statement released in April 2008.
2.68 With a view to containing inflation expectations as also the likely impact of prevailing monetary/ liquidity conditions due to large capital inflows, the Reserve Bank announced monetary measures from time to time. Accordingly, beginning March 05, 2007, it was decided to limit the daily reverse repo absorptions to a maximum of Rs.3,000 crore to facilitate the maintenance of appropriate liquidity in the system and active liquidity management through the market stabilisation scheme (MSS). However, in view of the prevailing macroeconomic and overall monetary and liquidity conditions, the ceiling of Rs.3,000 crore on daily reverse repo under the LAF was withdrawn with effect from August 6, 2007. During 2006-07, the cash reserve ratio (CRR) of SCBs was increased by 100 basis points in four stages to 6.00 per cent from 5.00 per cent of NDTL of the scheduled commercial banks. The first round liquidity impact on the banking system due to CRR changes was Rs.27,500 crore in 2006-07. During 2007-08, the CRR was further increased by 150 basis points in four stages to 7.50 per cent and the first round impact on the banking system was Rs.47,000 crore. During 2008-09 so far, the CRR has been increased by another 150 basis points and repo rate by 125 basis points to 9.00 per cent for both. The Government of India, in consultation with the Reserve Bank, revised the ceiling under the MSS for the year 2007-08 from Rs.1,10,000 crore to Rs.1,50,000 crore on August 8, 2007, and further to Rs.2,00,000 crore on October 4, 2007 and Rs.2,50,000 crore from November 7, 2007 to give more manoeuvrability to the Reserve Bank in the conduct of monetary policy.
Reserve Money Survey
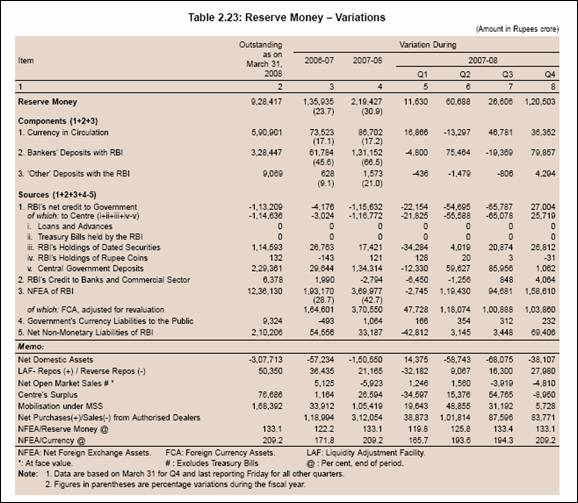
2.69 Expansion in reserve money year-on-year (y-o-y) at 30.9 per cent at end-March 2008 was higher than that of 23.7 per cent a year ago. Adjusted for the impact of the hike in the CRR, reserve money expansion was 25.3 per cent as compared with 18.9 per cent a year ago. Movements in reserve money during 2007-08 exhibited large variations mainly reflecting the fluctuations in bankers' deposits with the Reserve Bank in the wake of hikes in the CRR, sizeable expansion in demand and time liabilities and the Reserve Bank's market operations. Bankers' deposits with the Reserve Bank expanded by 66.5 per cent during 2007-08 as compared with 45.6 per cent during 2006-07. On the sources side, expansion in reserve money was mainly driven by foreign currency assets of the Reserve Bank which (adjusted for revaluation) increased by Rs.3,70,550 crore during 2007-08 as compared with an increase of Rs.1,64,601 crore in the previous year. Movements in the Reserve Bank's net credit to the Central Government during 2007-08 largely reflected the liquidity management operations by the Reserve Bank and movements in Government deposits with the Reserve Bank. The sterilisation operations of the Reserve Bank under the MSS led to an increase in Central Government deposits with the Reserve Bank. Surplus cash balances of the Central Government with the Reserve Bank also increased. The Reserve Bank's holdings of Central Government dated securities increased on account of injection of liquidity under the LAF. Reflecting these developments, the Reserve Bank's net credit to the Centre declined by Rs.1,16,772 crore during 2007-08 as compared with the decline of Rs. 3,024 crore during 2006-07 (Table 2.23).
Developments during 2008-09
2.70 The year-on-year (y-o-y) reserve money growth was 31.1 per cent as on August 15, 2008 as compared with 24.1 per cent, a year ago. Adjusted for the first round effect of the hike in CRR, reserve money growth was 24.3 per cent as compared with 14.2 per cent a year ago. The Reserve Bank's foreign currency assets (adjusted for revaluation), on a y-o-y basis, increased by Rs.2,51,201 crore as compared with an increase of Rs.2,40,618 crore a year ago. The Reserve Bank's net credit to the Centre increased, y-o-y, by Rs.6,125 crore as against a decline of Rs.78,935 crore, a year ago.
Monetary Survey
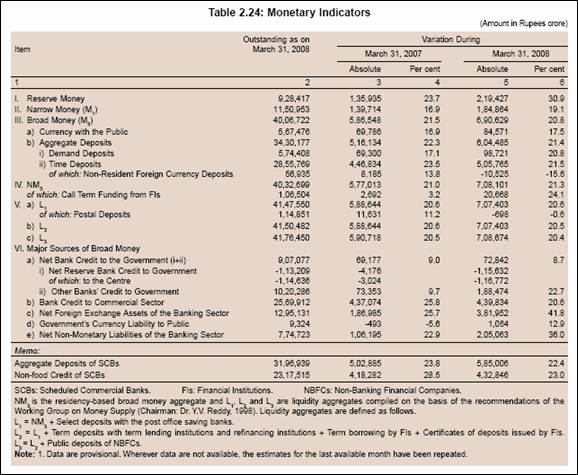
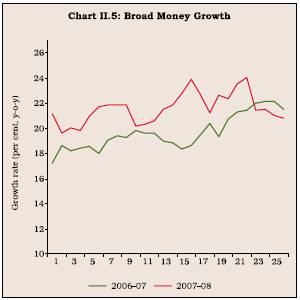
2.71 Broad money (M3) growth was 20.8 per cent, y-o-y, as at end-March 2008 as compared with 21.5 per cent in the previous year (Table 2.24 and Chart II.5). The growth in aggregate deposits of banks
witnessed some moderation. Demand deposits recorded a growth of 20.8 per cent (y-o-y) during 2007-08 as compared with growth of 17.1 per cent a year ago. Time deposits increased by 21.5 per cent (as compared with 23.5 per cent a year ago). Nonetheless growth in time deposits remained strong, benefiting, inter alia, from higher interest rates on bank deposits and tax benefits for deposits with maturity of 5 years and above. During 2007-08, accretion to postal deposits decelerated significantly up to November 2007. Furthermore, in December 2007 there were net outflows from small saving schemes. In order to revive interest in postal deposits, the Government announced in December 2007 some incentives, including tax benefits for certain postal deposits. However, net outflows continued up to June 2008, the latest period for which data are available.
Developments during 2008-09
2.72 On a year-on-year basis, growth in broad money (M3) was 19.6 per cent as on August 1, 2008 as compared with 21.8 per cent a year ago. Amongst the major components, aggregate deposits expanded by 20.0 per cent as compared with 23.1 per cent a year ago. On the sources side, scheduled commercial banks' non-food credit registered a growth of 26.2 per cent as on August 1, 2008 marginally higher than 23.5 per cent in the previous year, while their investment in Government securities expanded by 15.4 per cent as compared with 12.9 per cent a year ago.
Bank Credit
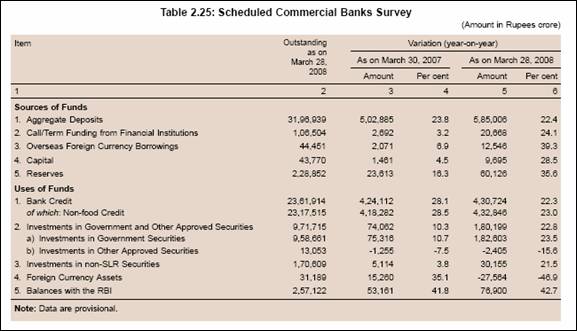
2.73 Demand for bank credit moderated in 2007-08. Non-food credit extended by scheduled commercial banks grew by 23.0 per cent (y-o-y) at end-March 2008, lower than 28.5 per cent a year ago (Table 2.25 and Chart II.6). During 2007-08, commercial banks’ investment in SLR securities increased sharply by 22.8 per cent (y-o-y) as compared with an increase of 10.3 per cent a year ago.
Developments during 2008-09
2.74 Non-food credit as at August 1, 2008 (y-o-y) registered higher growth of 26.2 per cent compared with 23.5 per cent a year ago. Investments in SLR securities by commercial banks’ witnessed a growth of 15.6 per cent as compared with 12.5 per cent in the previous year.
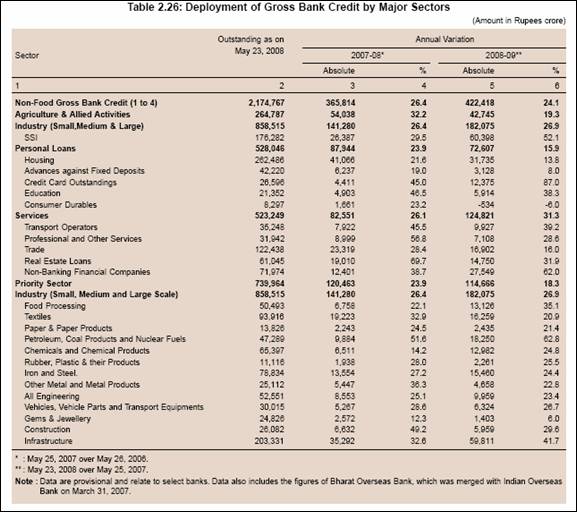
2.75 Information on the sectoral deployment of gross bank credit indicates that, on a year-on-year basis, bank credit to the services sector recorded the highest growth (31.1 per cent) up to March 2008, followed by the industry (25.0 per cent), agricultural sector (18.8 per cent) and personal loans (10.7 per cent). During 2008-09, the year-on-year growth in non-food gross bank credit (up to May 2008) accelerated to 24.1 per cent. Credit to the services sector recorded the highest growth (31.3 per cent), followed by industry (26.9 per cent), agriculture (19.3) and personal loans (15.9 per cent) at end-May 2008. The increase in industrial credit was mainly on account of infrastructure (power, roads, ports, and telecommunication), petroleum, textiles, iron & steel, food processing, chemicals, engineering, vehicles and construction industries.

Credit to the commercial real estate sector moderated significantly, although it was still higher than the credit growth to many other sectors (Table 2.26).
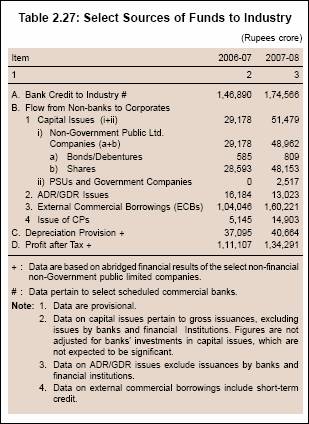
2.76 Apart from credit from banks, the corporate sector continued to meet its funding requirements from a variety of non-bank sources such as capital markets, external commercial borrowings and internal generation of funds. Resources raised through domestic equity issuances during 2007-08 (Rs.48,153 crore) were 68 per cent higher than a year ago. Net mobilisation through external commercial borrowings (ECBs) during 2007-08 increased by 54 per cent over the previous year. Mobilisation through issuances of commercial paper (CPs) during 2007-08 was nearly three times the issuances during the previous year. Internal generation of funds continued to provide support to the funding requirements of the corporate sector, despite the growth in profits after tax of select non-financial non-gover nment companies during 2007-08 witnessing some deceleration as compared with the previous year. Resources raised in the form of equity issuances through American depository receipts (ADRs) and global depository receipts (GDRs) during 2007-08 (Rs.13,023 crore) were 20 per cent lower than a year ago (Table 2.27).
Price Situation
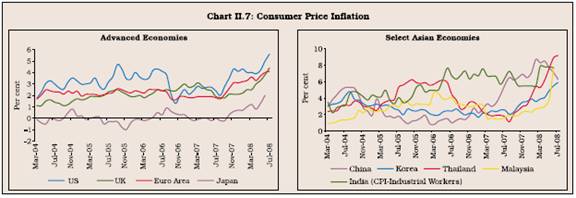
2.77 Headline inflation generally remained firm in major economies during 2007-08, reflecting the combined impact of higher food and fuel prices as well as strong demand conditions, especially in emerging markets. Amongst the major economies, headline inflation in March 2008 was 4.0 per cent in the US, 2.5 per cent in the UK and 3.6 per cent in the euro area as compared with 2.8 per cent, 3.1 per cent and 1.9 per cent, respectively, a year ago. Core inflation also remained firm in major economies. In the US, consumer price inflation (excluding food and energy) was 2.4 per cent in March 2008 as compared with 2.5 per cent a year ago. In the OECD countries, consumer price inflation (excluding food and energy) was 2.1 per cent in March 2008, same as a year ago. Amongst developing economies, headline inflation during March 2008 firmed up to 8.3 per cent in China (3.3 per cent a year ago), 3.9 per cent in Korea (2.2 per cent) and 5.3 per cent in Thailand (2.0 per cent) (Chart II.7). Inflation firmed up further in many developed and developing economies during 2008-09 so far. Among major economies, headline inflation increased to 5.6 per cent in the US, 4.4 per cent in the UK and 4.0 per cent in the euro area in July 2008. Among developing countries, headline inflation was 6.3 per cent in China, 5.9 per cent in Korea and 9.2 per cent in Thailand in July 2008.
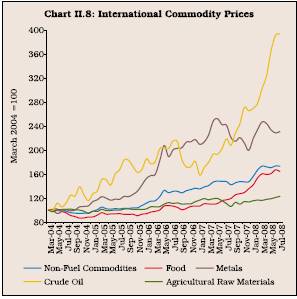
2.78 Global commodity prices firmed up during 2007-08 led by sharp increases in food and crude oil prices (Chart II.8). International crude oil prices rose sharply during the year, reflecting tight supply-demand balance, geo-political tensions, weakening of the US dollar against major currencies and increased interest from investors and financial market players. During 2007-08, the US West Texas Intermediate (WTI) crude oil prices touched a peak of US $ 110.2 a barrel level on March 13, 2008 on the back of a sharp fall in US crude inventories. After easing somewhat thereafter on deepening concerns about slowdown in the US, the biggest consumer of oil, prices rose again to reach a historical peak of US $ 145.3 a barrel level on July 3, 2008 but has moderated to US $ 114.4 by August 19, 2008. Food prices firmed up during 2007-08, especially in the second half, led by wheat, rice, and oilseeds/edible oils on account of surge in demand (both consumption demand and demand for non-food uses such as bio-fuels production) and low stocks of major crops, and partly on account of weather related disturbances on production in some major producing regions. Reflecting these factors, international prices of wheat, rice, soybeans, soybean oil and palm oil increased by 121 per cent, 86 per cent, 79 per cent, 106 per cent and 101 per cent, respectively, year-on-year, in March 2008. International sugar prices remained largely range bound during the year, reflecting higher production in traditional importing countries. Metal prices, which had witnessed some moderation during June-December 2007 reflecting lower import demand and some improvement in supply, rose again during January-March 2008.
2.79 Notwithstanding hardening of inflation, many central banks in advanced economies resorted to monetary easing in order to forestall the adverse impact of the tightening of credit conditions on the broader economy arising out of the US sub-prime crisis (Chart II.9). The US kept the policy rate unchanged during the first half of 2007-08. However, after viewing that the tightening of credit conditions and the deepening of housing contraction were likely to weigh on economic growth over the next few quarters, the Federal Open Market Committee (FOMC) cut its target for the federal funds rate by 25 basis points to 2.00 per cent on April 30, 2008, taking cumulative reduction to 325 basis points beginning September 2007 when it began cutting rates. The discount rate was also cut by 400 basis points beginning August 2007 to a level of 2.25 per cent to improve market liquidity. In its latest meeting held on August 5, 2008, the FOMC noted that inflation has been high, spurred by the earlier increases in the prices of energy and some other commodities, and some indicators of inflation expectations have been elevated. According to the committee, although inflation is expected to moderate later this year and next year, the outlook remains highly uncertain. Against this backdrop, the federal funds rate was left unchanged at 2.0 per cent. In the UK, the Bank of England, which had raised the policy rate by 50 basis points during May-July 2007 in view of upside risks to inflation outlook, cut its policy rate by 75 basis points from December 2007 to 5.0 per cent on April 10, 2008 to balance the upside risks of above-target inflation this year raising inflation expectations with the downside risks of the disruption in financial markets leading to a slowdown in the economy that was sufficiently sharp to pull inflation below the target. Noting that the CPI inflation would peak around the end of the year and then begin to fall back towards the target of 2 per cent within a period of two years, the MPC left the policy rate unchanged thereafter. In the euro area, after raising the policy rates by 25 basis points on June 6, 2007, the European Central Bank (ECB) left the policy rate unchanged thereafter during 2007-08 as it viewed that risks to price stability over the medium term were on the upside, in the context of very vigorous money and credit growth. However, with inflation rates continued to rise and expected to remain well above the level consistent with price stability for a more protracted period than previously thought, the ECB raised its key policy rates by 25 basis points effective July 9, 2008 to prevent broadly based second-round effects and to counteract the increasing upside risks to price stability over the medium term.
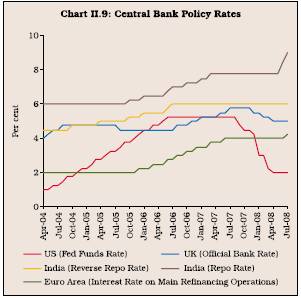
2.80 The Bank of Japan (BoJ) has kept its policy rate unchanged since February 2007, when it raised the uncollateralised overnight call rate (the operating target of monetary policy since March 2006) by 25 basis points to 0.50 per cent. According to the BoJ, inflation is expected to be somewhat higher over the coming months but to moderate gradually thereafter. Economic growth, after remaining sluggish for the time being, is expected to return gradually onto a moderate growth path as commodity prices level out and overseas economies move out of their deceleration phase. Amongst other major advanced economies, the Bank of Canada, which had initially raised its policy rate by 25 basis points in July 2007, eventually cut it by 150 basis points beginning from December 2007 to 3.0 per cent on April 22, 2008, while the Reserve Bank of Australia continued to raise its policy rate – 175 basis points from May 2006 to 7.25 per cent on March 5, 2008.
2.81 Inflation pressures remained firm in major emerging market economies (EMEs) on the back of strong growth and higher oil, food and other commodity prices. Consumer price inflation in China increased to 8.3 per cent in March 2008 from 3.3 per cent a year earlier, mainly due to higher food prices. Subsequently it eased somewhat to 6.3 per cent in July 2008. In order to address the excess liquidity in the banking system and ease pressures on money and credit expansion, the People’s Bank of China (PBC) increased the benchmark 1-year lending rate by 189 basis points beginning April 2006 to 7.47 per cent on December 21, 2007. Apart from continued issuances of its own bills to mop up liquidity, the PBC also raised the cash reserve ratio by 1000 basis points to 17.5 per cent between July 2006 and June 2008 to strengthen liquidity management in the banking system and guide the appropriate growth of money and credit. Amongst other emerging Asian economies, the Bank of Korea, after keeping its policy rate unchanged at 5.0 per cent since August 9, 2007 in view of the uncertainty surrounding future economic developments largely due to the run up in international oil prices, international financial market unrest and the US economic slowdown, raised rate by 25 basis points to 5.25 per cent, on August 7, 2008. According to the latest assessment by the monetary policy committee, consumer price inflation has picked up its pace (it increased to 5.9 per cent in July 2008 from 2.5 per cent a year ago), due to the direct and knock-on effects of high oil prices, and inflation seems likely to remain significantly high for quite some time. In Thailand, the MPC which had kept its policy rate unchanged at 3.25 per cent since July 18, 2007 (when it was last cut by 25 basis points), raised rate by 25 basis points to 3.50 per cent on July 16, 2008. According to the MPC, risks to inflation have risen markedly, which would affect private sector confidence, making it increasingly difficult to ensure economic stability going forward, and impact potential growth as well as the competitiveness of the Thai economy in the long-run.
2.82 In India, headline inflation based on the wholesale price index (WPI) softened from 6.4 per cent at the beginning of the fiscal year to a low of 3.1 per cent by October 13, 2007, partly reflecting moderation in the prices of primary food articles and some manufactured products items as well as base effects. After hovering around 3 per cent in November 2007, inflation began to edge up from early December 2007 and touched 7.7 per cent by March 29, 2008, mainly reflecting the hardening of prices of primary articles such as cereals, vegetables, oilseeds, raw cotton and iron ore, fuel group, and manufactured products items such as edible oils/oil cakes and metals. The annual average WPI inflation rate (average of 52 weeks), after rising up to May 2007, eased from the beginning of June 2007 to reach 4.7 per cent during the week ended March 29, 2008 (5.4 per cent a year ago). Headline inflation moved in a range of 3.1-8.0 per cent during 2007-08 (Chart II.10).

2.83 Amongst major groups, primary articles inflation, y-o-y, eased from 12.2 per cent at the beginning of April 2007 to an intra-year low of 3.7 per cent by end-December 2007, reflecting easing of food articles prices, especially of pulses, fruits and vegetables, and eggs, fish and meat as well as base effects. Subsequently, primary articles inflation increased to 9.7 per cent on March 29, 2008 mainly led by fruits, vegetables, oil seeds, raw cotton and iron ore. Wheat prices increased by 5.1 per cent, year-on-year, as on March 29, 2008 as compared with an increase of 7.3 per cent a year ago, reflecting improved production following the normal monsoon and supply side measures under taken by the Government. Prices of pulses declined by 1.9 per cent as compared with an increase of 12.5 per cent a year ago, reflecting improved production. Rice prices increased by 9.1 per cent, y-o-y, on top of 5.7 per cent a year ago. Prices of oilseeds, y-o-y, increased by 20.3 per cent on top of an increase of 31.6 per cent a year ago, due to higher demand, lower domestic rabi production as well as rising global prices. Raw cotton prices were 14.0 per cent higher, y-o-y, as on March 29, 2008 as compared with an increase of 21.9 per cent a year ago in line with the international price movements (Table 2.28).
2.84 Fuel group inflation, which was negative during June-November 2007, partly reflecting the base effects as well as fuel (petrol and diesel) price cuts last year, turned positive from mid-November 2007 to reach 6.8 per cent on March 29, 2008. The increase beginning November 2007 could be attributed to further increases in the prices of some petroleum products such as naphtha, furnace oil, aviation turbine fuel (ATF) and bitumen as well the upward revision in the domestic prices of petrol and diesel by Rs.2 per litre and by Rs.1 per litre, respectively, effective February 15, 2008 (which came after a gap of almost one year when the prices were cut). International crude oil prices (Indian basket) increased by almost 76 per cent from US $ 56.6 a barrel in February 2007 to US $ 99.3 per barrel level

in March 2008. While domestic petrol and diesel prices have been adjusted par tially, prices of kerosene have not been raised by the Government since April 2002 on grounds of societal concerns while prices of liquefied petroleum gas (LPG), which remained unchanged during 2007-08, have been raised partially in June 2008. In order to contain fuller pass-through of higher international crude prices to domestic prices, the Government, however, has extended the subsidy schemes for these products, available through the public distribution system (PDS) upto March 2010.
2.85 Manufactured products inflation, y-o-y, eased from 6.4 per cent at the beginning of the year to 3.5 per cent by November 24, 2007 (5.3 per cent a year ago) led by decline in the prices of sugar, textiles and non-ferrous metals as well as base effects. Subsequently, manufactured products inflation increased to 7.3 per cent by March 29, 2008, mainly reflecting the continued rise in the prices of edible oils/oil cakes, basic heavy inorganic chemicals, and basic metals and alloys. These commodities together contributed almost 41 per cent to the overall WPI inflation on March 29, 2008. Within the manufactured products group, prices of edible oils (20.0 per cent), oil cakes (27.2 per cent), chemicals and chemical products (6.0 per cent), cement (5.1 per cent), iron and steel (34.2 per cent) and electrical machinery (4.8 per cent) increased, on a year-on-year basis, on March 29, 2008. Domestic non-ferrous metals prices declined during 2007-08, although international prices, which had eased up to December 2007, firmed up during January-March 2008. Iron and steel prices increased in line with the recent hardening of international prices. Domestic cement prices, however, increased largely due to the strong demand from the construction sector and high capacity utilisation rates in the cement industry. The firming up of domestic edible oil and oil cakes prices reflected stagnant domestic production, increased demand and rise in international prices.
2.86 In order to contain inflationary pressures, the Government initiated a number of fiscal and supply augmenting measures during 2007-08. On April 3, 2007, the Government decided to exempt import of portland cement from countervailing duty and special additional customs duty; it was earlier exempted from basic customs duty in Januar y 2007. The Government also took several measures with the aim of containing food price inflation. The Government reduced customs duty on palm oils by 10 percentage points across the board in April 2007 and import duty on various edible oils in a range of 5-10 percentage points in July 2007. It also withdrew the 4 per cent additional countervailing duty on all edible oils. Import of wheat at zero duty, which was available up to end-December 2006, was extended further to end-December 2007. Customs duty on import of pulses was reduced to zero on June 8, 2006 and the period of validity of import of pulses at zero duty, which was initially available up to March 2007, was first extended to August 2007 and further to March 2009. A ban was imposed on export of pulses with effect from June 22, 2006 and the period of validity of prohibition on exports of pulses, which was initially applied up to end-March 2007, was further extended up to end-March 2008. In March 2008, the customs duty on rice was reduced from 70 per cent to zero per cent up to March 2009; customs duties on crude and refined edible oil were reduced from a range of 40-75 per cent to 20.0-27.5 per cent; and export of all edible oils were prohibited with immediate effect from April 1, 2008. These measures were expected to help in containing inflation and inflationary expectations.
2.87 Headline WPI inflation was 12.6 per cent, y-o-y, as on August 9, 2008 as compared with 7.7 per cent at end-March 2008 and 4.2 per cent a year ago. Primary articles group, fuel group, and manufactured products group inflation hardened to 11.8 per cent (9.5 per cent), 18.0 per cent (-2.0 per cent), and 10.9 per cent (4.7 per cent), respectively, on August 9, 2008. The average WPI inflation rate increased to 6.6 per cent as on August 9, 2008 from 5.5 per cent a year ago.
2.88 Inflation, based on year-on-year variation in consumer price indices, eased up to January 2008, mainly reflecting the deceleration in food price inflation. Subsequently, consumer price inflation hardened due to rise in food and fuel prices. However, various measures of consumer price inflation were still placed lower in the range of 6.0-7.9 per cent during March 2008 as compared with 6.7-9.5 per cent in March 2007. Disaggregated data show that food group inflation in various consumer price index measures eased to a range of 7.8-9.3 per cent in March 2008 from 10.9-12.2 per cent in March 2007. The increase in fuel group inflation from a range 3.2-6.9 per cent in March 2007 to a range of 4.6-8.0 per cent in March 2008 also contributed to the rise in consumer price inflation. Services prices, proxied by the “miscellaneous group” generally remained firm during 2007-08 (Table 2.29). CPI inflation ranged between 7.3-8.8 per cent in June 2008.

V. FINANCIAL MARKETS
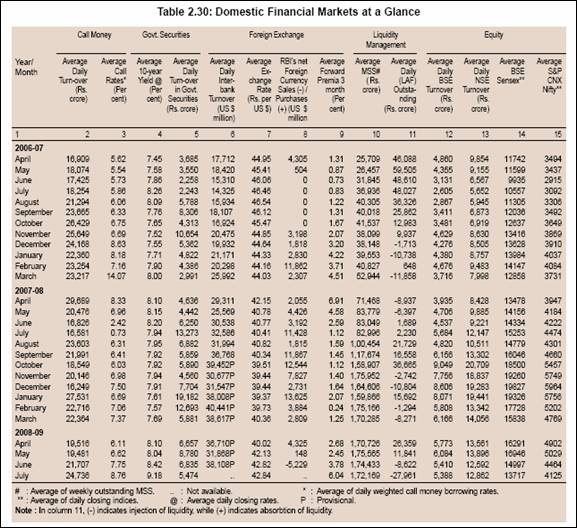
2.89 Indian financial markets remained largely orderly during the year 2007-08, barring some bouts of volatility in the call money market and the equity market. Swings in the cash balances of the Government and capital flows were the main drivers of liquidity conditions in the financial markets. Interest rates in the collateralised segment of the money market moved in line with but remained below the call rate during the year (Table 2.30).
Liquidity Management - 2007-08
2.90 The Reserve Bank continued with its policy of active management of liquidity during 2007-08 through appropriate use of the CRR and open market operations (OMO), including LAF, MSS, and other policy instruments at its disposal flexibly to maintain appropriate liquidity in the system so that all the legitimate requirements of credit, particularly for productive purposes were met consistent with the objective of price and financial stability. In operational terms, this translated into modulating liquidity conditions such that the overnight rates in the money market remained more or less within the informal LAF corridor set by the policy rates.
2.91 Liquidity management operations during 2007-08 had to contend with greater variations in market liquidity not only due to variations in the cash
balances of the Central Government but also on account of large and volatile capital inflows during the greater part of the year. The upsurge in capital flows reflected, inter-alia, the strong fundamentals of the Indian economy, the accommodative monetary policy followed by central banks in recent years as well as the large injection of liquidity by central banks in advanced countries in response to the sub-prime turmoil. In general, challenges to liquidity management emanating from changes in the cash balances of the Central Government and large and volatile capital flows have accentuated in recent years on account of a number of factors. First, direct tax collections have increased substantially on account of sustained improvement in corporate profitability and income growth, thereby increasing the share of direct taxes in total tax revenue. As a result, larger amounts of liquidity move out from the banking system every quarter as advance tax. The liquidity impact of these advance tax inflows is large, but temporary. While the timing of such liquidity outflows is generally predictable, the sheer magnitude could cause unexpected volatility on a day to day basis. Second, on the expenditure side, the pattern of the Government spending is much less predictable all through the year. The position is exacerbated around the financial year-end; it is not unusual to see huge unwinding of cash balances towards end-March/first half of April every year, after a build-up in the last quarter of the year. Third, the timing of capital flows is unpredictable as they are driven by a combination of domestic and external factors. Fourth, the magnitude of liquidity shocks and concomitantly, the scale of requisite policy/ operational responses get magnified whenever changes in Government cash balances and capital flows occur concurrently and in the same direction, as was observed in the recent past.
2.92 In the above backdrop, liquidity management continued to assume priority in the conduct of monetary policy during 2007-08. Surplus liquidity conditions persisted during the major part of the year mainly reflecting forex market operations of the Reserve Bank in the face of strong capital inflows as well as the drawdown of Government cash balances, which were interspersed with spells of liquidity shortages when causative factors reversed. The Reserve Bank judiciously used the CRR, LAF and MSS to manage such swings in liquidity conditions. The CRR was hiked in stages (in April, August and November) by 150 basis points to 7.5 per cent during the year5 , while the ceiling on outstanding balances under the MSS was enhanced progressively from Rs.80,000 crore to Rs.2,50,000 crore. Issuances under the MSS were modulated over the year in terms of size and type of instrument to reflect the magnitude and volatility of capital flows. While the rupee equivalent of the cumulative amount of net forex market purchases by the Reser ve Bank was Rs.3,12,054 crore during 2007-08, the net increase in balances under MSS was Rs.1,05,691 crore over the same period.
2.93 During 2007-08, with the gradual easing of liquidity pressures from April 4, 2007 till mid-April 2007, partly on account of a reduction in cash balances of the Central Government, liquidity injection through LAF declined from Rs.29,185 crore at end-March 2007 to Rs.1,455 crore by April 5, 2007 which was followed by liquidity absorption during April 9-15, 2007. As liquidity absorption through reverse repo was capped at Rs.3,000 crore with effect from March 5, 2007 in accordance with the modified arrangements under LAF, liquidity was predominantly managed by a two-stage hike in CRR of 25 basis points each in April 2007 and increased issuances of Government securities under the MSS. The annual ceiling of MSS outstandings for 2007-08 was raised to Rs.1,10,000 crore on April 27, 2007. The system shifted into a phase of large surplus liquidity from May 28, 2007, reflecting increase in Government expenditure and the Reserve Bank’s forex market operations. The LAF window, accordingly, turned into an absorption mode and remained so, barring a few occasions, during June-July 2007.
2.94 In view of the macroeconomic and overall monetary and liquidity conditions, the ceiling of Rs.3,000 crore on the daily reverse repo window of LAF was withdrawn with effect from August 6, 2007. The Second LAF, which was introduced from November 28, 2005, was also withdrawn with effect from August 6, 2007. Call rates, which fell below the lower bound of the corridor in June and July 2007, remained mostly within the informal corridor of the reverse repo and repo rates dur ing August, September and October 2007 (Chart II.11) (see next section for details).
2.95 The average absorptions under LAF during August and September 2007 were Rs.21,729 crore and Rs.16,558 crore, respectively. The moderation in the amount absorbed under LAF reflected the cumulative impact of the hike in CRR by 50 basis points to 7.0 per cent in August 2007 and the market operations under the MSS. In view of large and continuous capital flows, the ceiling of the MSS was again raised to Rs.1,50,000 crore in August 2007.
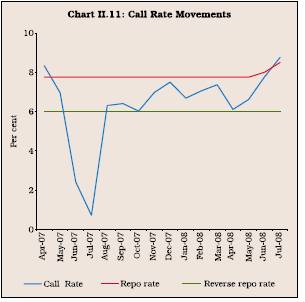
2.96 Liquidity conditions eased in the beginning of the third quarter on account of a decline in surplus balances of the Central Government and Reserve Bank’s foreign exchange operations. In October 2007, the daily average absorption under LAF was at Rs.36,665 crore. Notwithstanding brief periods of tightness on account of festive season currency demand, liquidity conditions remained easy up to second week of November 2007, reflecting continued inflows of foreign capital. This necessitated upward revisions in the ceiling for outstandings under the MSS to Rs.2,00,000 crore on October 4, 2007 and further to Rs.2,50,000 crore on November 7, 2007. The CRR was also raised by 50 basis points to 7.5 per cent in November 2007. However, as the surplus cash balances of the Central Government increased and the CRR hike came into effect, liquidity conditions tightened from the middle of the month. The tightness in liquidity conditions persisted in December 2007 largely on account of quarterly advance tax outflows. This necessitated temporary injection of liquidity by the Reserve Bank through LAF.
2.97 Some easing of liquidity conditions was observed in the beginning of the fourth quarter on account of reduction in the surplus cash balances of the Central Government and foreign exchange operations by the Reserve Bank in the wake of large capital flows over the period. Keeping in view the evolving liquidity conditions, auction of dated securities under the MSS was resumed in January 2008. However, in the second-half of January 2008, surplus liquidity declined with the increase in the Centre’s cash balances with the Reserve Bank. The average daily net outstanding liquidity absorption through LAF was Rs.15,692 crore during January 2008. During February 2008, the LAF window shifted from absorption to injection mode as the surplus cash balances of the Central Government with the Reserve Bank increased in the second-half of the month. The average daily net outstanding liquidity injection was Rs.1,294 crore in February 2008. In view of the prevailing liquidity conditions, no auction under the MSS was conducted from the middle of the month. Liquidity conditions eased in the beginning of March 2008 due to reduction in the surplus cash balances of the Centre and purchase of securities under the OMO by the Reserve Bank. Liquidity conditions, however, again tightened from March 17, 2008 mainly because of advance tax outflows. In view of the schedule of advance tax payments in mid-March 2008 and the subsequent bank holidays (March 20 - 22, 2008), the Reserve Bank decided, at the request of a number of banks, to make additional LAF arrangements for smoothening the liquidity and conducted (i) three-day repo/reverse repo auctions under additional LAF on March 14, 2008; (ii) seven-day repo auction under additional LAF on March 17, 2008; and (iii) two-day repo/ reverse repo auctions under additional LAF on March 31, 2008.
2.98 For the year as a whole, there was net absorption of liquidity on 171 days and net injection of liquidity on 75 days during 2007-08 (197 days and 48 days, respectively, in 2006-07). During the year, the average daily net outstanding balances under LAF varied between injection of Rs.10,804 crore (December 2007) to absorption of Rs.36,665 crore (October 2007).
2.99 During the course of 2007-08, the stock of Government securities in the Reserve Bank’s portfolio declined, mainly on account of periodic redemptions. In order to replenish its stock of Government securities, the Reserve Bank resorted to purchases of government securities through open market operations, beginning December 2007. Such operations are liquidity neutral up to the amount of redemption of Government securities in the portfolio of the Reserve Bank. During 2007-08, the total amount of Government of India securities purchased under OMO was Rs.13,510 crore.
Liquidity Management during 2008-09 so far
2.100 Liquidity conditions eased from the beginning of April 2008, mainly due to substantial reduction in the cash balances of the Central Government. Auctions under the MSS were resumed and the balances under the MSS were at Rs.1,72,444 crore as on April 25, 2008. Absorption under the LAF was placed at Rs.32,765 crore as on April 25, 2008. On a review of the liquidity situation, the Reserve Bank announced a two-stage hike of the CRR by 25 basis points each to 8.0 per cent, effective from the fortnights beginning April 26, 2008 and May 10, 2008, respectively. The average daily net outstanding liquidity absorption under the LAF was Rs.26,359 crore during April 2008. On a review of the evolving liquidity situation, the Annual Monetar y Policy Statement issued on April 29, 2008, announced an increase in the CRR by 25 basis points to 8.25 per cent with effect from the fortnight beginning May 24, 2008. Reflecting the impact of the CRR hikes, average daily absorption under LAF declined to Rs.11,841 crore during May 2008. No auction of dated securities was conducted during May 2008 and the outstanding balance under the MSS was at Rs.1,75,362 crore on May 30, 2008. Liquidity conditions eased in the early part of June and the average daily absorption under LAF was placed at Rs.15,469 crore during June 1-9, 2008. On a review of the prevailing macroeconomic and overall monetary conditions and with a view to containing inflationar y expectations, the Reser ve Bank increased the repo rate under the LAF by 25 basis points to 8 per cent with effect from June 12, 2008. Subsequently, with the build-up in Government balances in the face of advance tax collections, liquidity conditions turned into a deficit mode and the average daily net injection under LAF during June 2008 was Rs.8,622 crore. Liquidity conditions tightened further in July 2008 in comparison with that of June 2008 after the two-stage CRR hike became effective. The average daily net injection was Rs.27,961 crore during July 2008. Consistent with the stance of monetary policy set out in the Annual Policy Statement (April 2008) and on the basis of latest information on domestic and global macroeconomic and financial development, it was decided on June 24, 2008 to raise the CRR by 50 basis points in two stages of 25 basis points each effective from the fortnight beginning July 5, 2008 and July 19, 2008. On the same day (i.e. June 24, 2008), the repo rate was also hiked by 50 basis points to 8.5 per cent. In view of the current assessment of the economy including the outlook for growth and inflation, the Reserve Bank announced, in the first Quarter Review of the Annual Statement on Monetary Policy, issued on July 29, 2008, a 50 basis points hike in the repo rate (to 9 per cent) with immediate effect and 25 basis points hike in CRR to 9 per cent with effect from fortnight beginning August 30, 2008. The liquidity conditions remained tight during August 2008 and the average daily net injection under LAF was Rs.26,478 crore during August 1-22, 2008.
2.101 Keeping in view the systemic implications of the liquidity and other related issues faced by public sector oil companies arising from the unprecedented escalation in international crude oil prices, the Reserve Bank announced Special Market Operation (SMO) on May 30, 2008, for the smooth functioning of financial markets and for overall financial stability. The operation commenced from June 5, 2008. Under SMO, the Reserve Bank in the first leg of operation purchased oil bonds held by public sector oil marketing companies in their own accounts through designated banks, subject to an overall ceiling of Rs.1,500 crore (revised upwards from Rs.1,000 crore on June 11, 2008) on any single day. In the second stage, it provided equivalent foreign exchange through designated banks at market exchange rate to the oil companies. The settlement of the forex and the bond transactions were synchronous so that there was no liquidity impact. The total amount of oil bonds purchased by the Reserve Bank under SMO aggregated Rs.19,325 crore. The SMO was an exceptional measure taken in the interest of financial stability. It was terminated effective August 8, 2008.
Money Market
Call Money Market
2.102 Reflecting the impact of liquidity management operations, money markets remained largely orderly during 2007-08, barring a few brief spells of volatility. During 2007-08, liquidity pressures eased gradually from April 4, 2007 till mid-April 2007, partly on account of reduction in the cash balances of the Central Government. Reflecting this, the call rate, which had moved above the repo rate in the second half of March 2007, gradually eased to 3.27 per cent on April 12, 2007. Notwithstanding the continued reduction in the cash balances of the Central Government, liquidity conditions tightened subsequently partly on account of a two-stage hike in cash reserve ratio (CRR) of 25 basis points each, announced on March 30, 2007 effective from the fortnights beginning April 14, 2007 and April 28, 2007. Consequently, the call rate edged higher and exceeded the repo rate during the second half of April 2007 and some part of May 2007. From May 28, 2007 onwards, the liquidity conditions eased significantly, reflecting increase in Government expenditure and the Reserve Bank’s forex market operations. Since the amount that could be absorbed under the reverse-repo window of LAF, on a daily basis, was capped at Rs.3,000 crore in accordance with the modified arrangements for liquidity management, the call rate remained below the reverse repo rate in June and July 2007. In fact, the call rate was placed below 1 per cent on a number of occasions in June and July 2007 and reached as low as 0.13 per cent on August 2, 2007. With the withdrawal of the ceiling of Rs.3,000 crore on the daily reverse repo window of LAF with effect from August 6, 2007, the call rate increased but remained mostly within the informal corridor of the reverse-repo and repo rates during August, September and October 2007. In the wake of relative tightness in liquidity conditions from the second week of November 2007, the call/notice money market rates edged up and moved around the upper bound of the informal corridor. This was mainly because of festive season demand for currency, increase in Government’s cash balances with the Reserve Bank and hike in the CRR by 50 basis points to 7.5 per cent with effect from the fortnight beginning November 10, 2007. In December 2007, the call/ notice rate moved around the repo rate and the average call/notice rate for December 2007 was at 7.50 per cent. With the easing of liquidity conditions, partly on account of reduction in the cash balances of the Central Government, the call rate declined and mostly remained within the informal corridor in January 2008 and averaged 6.69 per cent for the month. In February 2008, the rate hardened over the previous month and averaged 7.06 per cent. In March 2008, the Central Government’s cash balances with the Reserve Bank started picking up during the second half mainly on account of advance tax outflows and the call rate remained mostly above the repo rate beginning from March 15, 2008. The average call rate in March 2008 increased further to 7.37 per cent. For the full year 2007-08, the average call rate was, however, placed lower at 6.07 per cent as compared with 7.22 per cent in 2006-07.
2.103 As liquidity conditions eased, the average call rate declined to 6.11 per cent in April 2008 (Table 2.30). Reflecting the impact of CRR increases in April and May 2008, the average call rate increased to 6.62 per cent in May 2008. During June 2008, the average call rate increased to 7.75 per cent, reflecting the tightness in liquidity conditions mainly on account of advance tax outflows. As liquidity conditions tightened further, the average call rate increased to 8.76 per cent during July 2008.
Collateralised Markets
2.104 The collateralised market – the market repo (outside the LAF) and the collateralised borrowing and lending obligation (CBLO) – has emerged as the dominant segment of the money market after the phasing-out of non-bank participants from the call money market from August 6, 2005. At present, the collateralised segment comprises about 80 per cent of the total volume of the money market. Mutual funds are the major lenders in the collateralised segment, while banks and primary dealers (PDs) are the major borrowers in this segment.
2.105 During 2007-08, interest rates in the market repo (outside the LAF) and the CBLO segments moved in tandem with but remained below call rate. Interest rates averaged 5.20 per cent and 5.50 per cent, respectively, in the CBLO and market repo segments during 2007-08 as compared with 6.24 per cent and 6.34 per cent, respectively, a year ago. The average rates in the CBLO and market repo segments increased from 5.05 per cent and 5.48 per cent, respectively, during April 2008 to 7.78 per cent and 7.99 per cent, in July 2008, in line with the movement in the call rate (Chart II.12).
2.106 A screen-based negotiated quote-driven system for all dealings in the call/notice and term money market (NDS-CALL) was launched on September 18, 2006. Though the dealing on the platform is optional, 86 banks and 8 primary dealers have taken membership of NDS-CALL so far. NDSCALL now accounts for more than 75 per cent of total call-notice transactions.
Commercial Paper
2.107 The issuance of commercial paper (CP) increased significantly during 2007-08.The outstanding amount of CP increased from Rs.17,863 crore at end-March 2007 to Rs.32,592 crore as on March 31, 2008. The major issuers of CP were ‘leasing and finance companies’, accounting for three-fourths of total outstanding. Manufacturing companies and financial institutions accounted for 17 per cent and 8 per cent of the total outstanding of CP, respectively at end-March 2008. The weighted average discount rate (WADR) on CP declined from 11.3 per cent at end-March 2007 to 7.7 per cent as at end-October 2007, reflecting the general easing of liquidity conditions in the money market. Thereafter, the WADR hardened to reach 10.4 per cent as on March 31, 2008. The most preferred tenor of CP issuance was increased from 5.05 per cent and 5.48 per cent, respectively, during April 2008 to 7.78 per cent and 7.99 per cent, in July 2008, in line with the movement in the call rate (Chart II.12).
2.106 A screen-based negotiated quote-driven system for all dealings in the call/notice and term money market (NDS-CALL) was launched on September 18, 2006. Though the dealing on the platform is optional, 86 banks and 8 primary dealers have taken membership of NDS-CALL so far. NDSCALL now accounts for more than 75 per cent of total call-notice transactions.
Commercial Paper
2.107 The issuance of commercial paper (CP) increased significantly during 2007-08.The outstanding amount of CP increased from Rs.17,863 crore at end-March 2007 to Rs.32,592 crore as on March 31, 2008. The major issuers of CP were ‘leasing and finance companies’, accounting for three-fourths of total outstanding. Manufacturing companies and financial institutions accounted for 17 per cent and 8 per cent of the total outstanding of CP, respectively at end-March 2008. The weighted average discount rate (WADR) on CP declined from 11.3 per cent at end-March 2007 to 7.7 per cent as at end-October 2007, reflecting the general easing of liquidity conditions in the money market. Thereafter, the WADR hardened to reach 10.4 per cent as on March 31, 2008. The most preferred tenor of CP issuance was for the period ranging from 181 to 365 days. The amount of outstanding CP increased to Rs.51,569 crore as on July 31, 2008 and the WADR stood at 10.95 per cent.
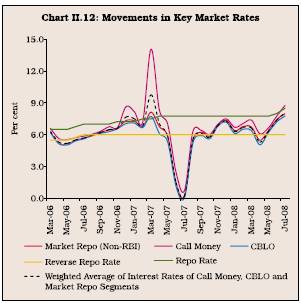
Certificates of Deposit (CDs)
2.108 The issuance of certificates of deposit (CDs) by scheduled commercial banks increased by 58.5 per cent from Rs.93,272 crore at end-March 2007 to Rs.1,47,792 crore as on March 28, 2008.The outstanding amount of CDs constitute 6.0 per cent of the aggregate deposits of CD-issuing banks with significant inter-bank variation (very high percentage in respect of certain small banks with lower deposit base and lower percentage for large banks). The large issuance of CDs during 2007-08 was resorted to by the banks to augment their deposit mobilisation. Mutual Funds were the major investors in CDs. The weighted average discount rate (WADR) of CDs declined from 10.8 per cent as at end-March 2007 to 7.9 per cent in end-October 2007 before increasing to 10.0 per cent as at end-March 2008. The amount of outstanding CDs increased to Rs.1,64,892 crore and the WADR was placed at 10.23 per cent as at July 18, 2008.
Government Securities Market
Central Government Cash Management
2.109 In pursuance with the new regime under the Fiscal Responsibility and Budgetary Management (FRBM) Act, 2003, the WMA limits for 2007-08 were fixed at Rs.20,000 crore for the first half of the year (April-September) and Rs.6,000 crore for the second half of the year (October-March). The Reserve Bank retained the flexibility to revise the limits in consultation with the Gover nment taking into consideration the transitional issues and prevailing circumstances. The applicable interest rate on WMA and overdraft was continued to be linked to the repo rate as hitherto. The Centre began the fiscal year with a large surplus balance of Rs.50,092 crore, which eroded rapidly and turned into a deficit by April 27, 2007 reflecting sharp reduction in the investments in the Government of India Treasury Bills by States, higher than anticipated spending and lower collections under the National Small Savings Fund (NSSF). The cash balances of the Government persisted in a deficit mode till June 17, 2007 except for a brief period of 2 days on May 17-18, 2007. The cash deficit crossed the WMA limit of Rs.20,000 crore on May 30, 2007 and remained in an overdraft position till June 8, 2007. Additional issuance of 91-day,182-day and 364-day Treasury Bills amounting to Rs.27,500 crore on six occasions, during June 6-27, 2007, coupled with an auction of dated securities amounting to Rs.5,000 crore on June 12, 2007 outside the calendar, advance tax inflows for the April-June quarter together with the resumption of investments by States in the Government of India Treasury Bills facilitated building up of a surplus position in Government balances from June 18, 2007. With the transfer of the State Bank of India (SBI) stake from the Reserve Bank of India to the Government involving cash outgo of Rs.35,531 crore on June 29, 2007, the cash balance of the Government again turned into a deficit and remained so till August 8, 2007. Following the transfer of surplus from the Reserve Bank on August 9, 2007, the cash balance of the Government of India returned to a surplus mode. The Government resorted to overdraft on three occasions during 2007-08 in contrast with the previous year when it did not resort to any overdraft. During 2007-08 the Government availed of WMA/OD on 91 days as against 39 days during the previous year.
2.110 The WMA limits for 2008-09 have been fixed at Rs.20,000 crore for the first half of the year (April-September) and Rs.6,000 crore for the second half of the year (October-March). The applicable interest rate on WMA and overdraft would continue to be linked to the repo rate as hitherto. The Centre began the fiscal year with a large surplus balance of Rs.76,686 crore and continued to be in surplus till August 3, 2008. The Centre resorted to WMA for 3 days from August 4, 2008 to August 6, 2008. In all, the Centre resorted to 3 days WMA during 2008-09 so far (up to August 11, 2008) as against 91 days WMA (inclusive of 37 days overdraft) during the corresponding period of the previous year.
Market Borrowings of the Central Government - 2007-08
2.111 Market borrowings (including dated securities and 364-day TBs) of the Central Government for 200708 were budgeted at Rs.1,88,828 crore (net Rs.1,09,579 crore) which were Rs.9,455 crore higher than the actual amount raised in 2006-07. The issuance calendar for dated securities for the first and second half of 2007-08 was issued in consultation with the Central Government fixing the market borrowing at Rs.92,000 crore and Rs.59,000 crore, respectively, as against Rs.89,000 crore and Rs.57,000 crore, respectively, raised during the corresponding periods last year. The actual amount raised during the first half of 2007-08 was Rs.97,000 crore, of which Rs.5,000 crore was raised outside the issuance calendar towards partially financing the transfer of stake in the State Bank of India from the Reserve Bank of India to the Government of India. In the second half, Rs.59,000 crore was raised, which was as per the issuance calendar.
Dated Securities
2.112 During 2007-08, gross market borrowings by way of dated securities by the Central Government amounted to Rs.1,56,000 crore as compared with Rs.1,46,000 crore during the previous year. Gross market borrowings through dated securities during 2007-08 accounted for 100.35 per cent of the budget estimates as against 94.18 per cent in the previous year. During the year, only one new security (7.99 % GS 2017) was issued in July 2007, while all the remaining 34 securities were re-issues. The total devolvement on PDs during the financial year was at Rs.957 crore.
2.113 The weighted average yield of dated securities issued during 2007-08 was higher at 8.12 per cent as compared with 7.89 per cent during 2006-07. The weighted average maturity of dated securities issued dur ing the year worked out to 14.90 years as compared with 14.72 years during the previous year.
Market Borrowings during 2008-09
2.114 The market borrowings (including dated securities and 364-day TBs) of the Central Government for 2008-09 are budgeted lower at Rs.1,75,780 crore (net Rs.99,000 crore) than the actual amount raised in 2007-08. On March 24, 2008, the issuance calendar for dated securities for the first half of 2008-09 (April-September) was released in consultation with the Central Government. Accordingly, an amount of Rs.96,000 crore is scheduled to be raised as compared with Rs.97,000 crore raised during the corresponding period of the previous year. The monthly amount to be raised varies from Rs.8000 crore (September 2008) to Rs.20,000 (April and May 2008). While 36 per cent of the securities to be raised during the first half of 2008-09 would be of tenor between 10-14 years, 32 per cent of the securities would be of the tenor 20 years and above.
2.115 During 2008-09 so far (up to August 11, 2008), the Central Government has raised Rs.82,000 crore through dated securities under the market borrowing programme. The borrowings were raised in accordance with the indicative calendar except for the auction on July 24, 2008, where a 10 year benchmark security was issued in place of a higher maturity security in view of uncertain market conditions. The auctions held on July 24, 2008 and August 8, 2008 were based on uniform price method. All auctions during 2008-09 (up to August 11, 2008) were for reissuance of existing securities, barring one new issue of 10-year maturity. The weighted average maturity of dated securities issued during 2008-09 (up to August 11, 2008) at 15.21 years was higher than 14.32 year dur ing the corresponding period of the previous year. The weighted average yield of dated securities issued during the same period increased to 8.72 per cent from 8.24 per cent.
Treasury Bills
2.116 As per the annual issuance calendar that was issued on March 30, 2007, the notified amounts of 91day, 182-day and 364-day Treasury Bills under the nor mal market borrowing programme were kept unchanged at Rs.500 crore (weekly auction), Rs.500 crore (for tnightly auction) and Rs.1,000 crore (fortnightly auction), respectively. However, as indicated earlier, the notified amounts were increased on several occasions in June 2007 to inter alia, finance the temporary cash mismatch that was anticipated to arise on account of transfer of the Reserve Bank’s stake in SBI on June 29, 2007.
2.117 During April - June 2007, the primary market yields of 91-day, 182-day and 364-day Treasury Bills remained relatively stable around their end-March levels at 7.32 per cent, 7.73 per cent and 7.75 per cent, respectively. Yields softened during the second quarter of 2007-08, especially in July 2007, reflecting the trends in money market segments as well as fall in domestic inflation rate. Yields dipped on July 18, 2007, reflecting easy liquidity conditions and very low short-term rates. The surplus liquidity in the wake of ceiling of Rs.3,000 crore in LAF Reverse Repo resulted in extremely low short-term rates and aggressive bidding in auctions of TBs and hence the lower auction cut-off. Treasury Bills, yields hardened during August-mid-September 2007 in tandem with higher money market interest rates and removal of the ceiling on absor ption through reverse repo. Forex inflows increased following the rate cut of 50 basis points by the US Federal Reserve on September 18, 2007 and another 25 basis points on October 31, 2007. Consequently, treasury bills yields softened during mid-September-October 2007. The yields hardened again in November 2007 with the hike in CRR by 50 basis points with effect from November 10, 2007. Following the aggressive rate cuts by the US Fed (by 25 basis points, 75 basis points and 50 basis points, respectively, on December 11, 2007, January 22, 2008 and January 30, 2008), yields softened in January 2008 and remained rangebound till March 2008 (Chart II.13). The primary market yields
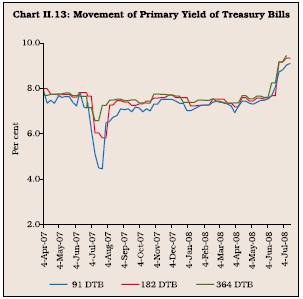
of 91-day, 182-day and 364-day Treasury Bills averaged at 7.11 per cent, 7.42 per cent and 7.50 per cent, respectively, in 2007-08.
2.118 The calendar for the regular auction of TBs for 2008-09 was announced on March 24, 2008.The notified amounts were kept unchanged at Rs.500 crore each for 91-day and 182-day TBs and Rs.1,000 crore for 364day TBs. However, the notified amount (excluding MSS) of 91-day TBs was increased by Rs.2,500 crore each on seven occasions and by Rs.1,500 crore on one occasion and that of 182-days TBs was increased by Rs.500 crore each on two occasions during 2008-09 (up to end-July 2008). Thus, an additional amount of Rs.20,000 crore was raised to finance the expected temporary cash mismatch in July 2008 arising out of expenditure on farmers’ debt waiver scheme.
Market Borrowings of State Governments
2.119 The net allocation under the market borrowing programme for the State Governments for 2007-08 was placed at Rs.28,781 crore. Taking into account additional allocations amounting to Rs.40,234 crore (inclusive of Rs.35,780 crore allocation on account of NSSF shortfall) and repayments of Rs.11,555 crore during the year (excluding Rs.156.44 crore of buy-back by Government of Orissa), the gross allocation amounted to Rs.80,570 crore as compared with the actual gross borrowings of Rs.20,825 crore in the previous year. The gross borrowings of the State Governments during the year amounted to Rs.67,779 crore raised exclusively through auction route. In the auctions of State Government market loans during the year 2007-08, the spread over the corresponding 10 year Central Government securities ranged between 19 and 90 basis points. The spread for all the States (excluding Jammu and Kashmir) was less than 50 basis points up to October 2007, however, for subsequent auctions, the spreads for majority of the States was more than the usual spread of 50 basis points fixed over the prevalent yield of Central Government security of equivalent tenor in the secondary market in case of tap sale and ranged from 35 to 89 basis points.
2.120 During 2007-08, the weighted average yield of the securities issued by the State Governments was at 8.25 per cent as compared with 8.10 per cent during the previous year (Chart II.14). The cut-off yield ranged between 7.84 and 8.90 per cent during the year (Table 2.31). All the issues during the fiscal were of 10-year maturity. Four States did not enter the market during the year.
2.121 On a review of the State-wise limits of Normal WMA, it was decided to keep these limits unchanged for 2007-08. Reserve Bank has entered into an agreement with the Government of Union Territory of Puducherry effective from December 17, 2007, to carry out its general banking business and manage rupee public debt. The Government of Union Territory of Puducherry has Rs.50 crore Normal Ways and Means Advance limit. Accordingly, the aggregate Normal WMA limit inclusive of UT of Puducherry stood at Rs.9,925 crore for 2007-08.
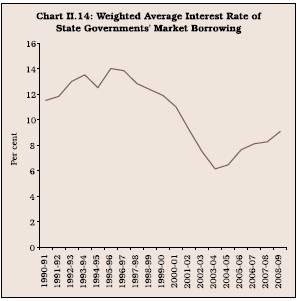

2.122 The liquidity position of a majority of States continued to remain comfortable during 2007-08. The monthly average investment by the States in 14-day inter mediate treasury bills (ITBs) and auction treasury bills (ATBs) during 2007-08 at Rs.74,047 crore was higher than that of Rs.63,908 crore in the previous year. The average utilisation of WMA and overdraft by the States during 2007-08 was placed somewhat higher at Rs.648 crore as against Rs.248 crore during the previous year (Chart II.15) though significantly lower than the WMA limit of Rs.9,925 crore fixed for 2007-08 and 2008-09. During the year 2007-08, eight States availed of WMA and three States resorted to overdraft as compared with seven States and three States, respectively, during the previous year. During 2008-09 (upto end-July 2008) average utilisation of WMA and overdraft of States was Rs.313 crore. During the same period four States availed WMA and three States resorted to overdraft. The consolidated investment by the State Governments in 14-day ITBs and auction TBs were at Rs.97,615 crore as at end-March 2008 as compared with Rs.73,403 crore as at end-March 2007, while the aggregate outstanding WMA and Overdraft of States was at Rs.172 crore as at end-March 2008 as against Rs.285 crore as at end-March 2007.
Market Borrowings of State Governments during 2008-09 so far (up to August 11, 2008)
2.123 The estimated net market borrowings of the State Governments for 2008-09 are placed at Rs.44,692 crore. Taking into account repayments of Rs.14,371 crore, the gross market borrowings of the State Governments are estimated at Rs.59,108 crore. During the current year (up to August 11, 2008), eight State Governments raised Rs.10,812 crore under the market borrowing programme as compared with Rs.8,542 crore during the corresponding period of the previous year. The cut-off yield in the auction ranged between 8.39 per cent and 9.90 per cent. The weighted average interest rate on market loans firmed up to 9.07 per cent during 2008-09 (up to August 11, 2008) from 8.35 per cent during the corresponding period of 2007-08. The spreads of State Gover nment securities over the yields of Central Government security of corresponding maturity ranged between 30 and 98 basis points as against 19 and 44 basis points during the corresponding period of the last year.
2.124 The consolidated investments by the State Governments in 14-day intermediate treasury bills (ITBs) and auction TBs were at Rs.86,464 crore as on August 11, 2008. The average investment by the States in Treasury Bills (14-day and Auction) during April-July 2008 amounted to Rs.82,298 crore as against Rs.70,513 crore in the corresponding period of the previous year (Chart II.16).
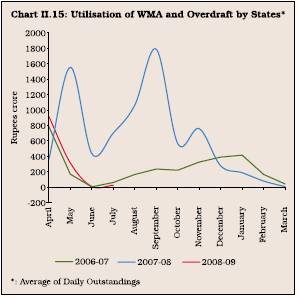
Secondary Market Transactions in Government Securities
2.125 During 2007-08, the total volume of secondary market transactions increased by 57 per cent to Rs. 56,27,347 crore (30 per cent of which were outright transactions and the remaining on account of repos) from Rs.35,83,336 crore (29 per cent of which accounted for outright transactions and the remaining for repos) in 2006-07. The total volume of secondary market transactions was lowest during April 2007 at Rs.2,31,094 crore (average benchmark 10-year yield during the month was at 8.17 per cent) and at peak at Rs.7,42,365 crore during January 2008 as the yields softened (average benchmark 10 year yield during the month was at 7.57 per cent) (Chart II.17).
2.126 During 2008-09 so far (April to July 2008), the total volume of secondary market transactions increased by 20 per cent to Rs.16,85,238 crore from Rs.14,09,136 crore during the corresponding period last year.
Yield Movement and Yield Curve
2.127 Yields in the Government Securities market declined marginally during 2007-08, barring the first quarter of 2007-08, when yields hardened, and again during August-December 2007. Yields hardened somewhat during the first quarter of 2007-08, partly
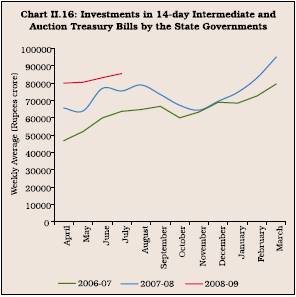
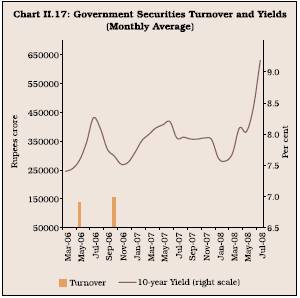
reflecting the global trends and announcement of an unscheduled auction. Yields generally remained range-bound during August-December 2007 period and softened during January and February 2008, partly reflecting global trends in yields, successive rate cuts by the Federal Reserve, lower inflation and easy liquidity conditions. However, yields hardened again in the second half of March 2008, reflecting higher inflation. The 10-year yield moved in a range of 7.42-8.32 per cent during 2007-08. As on March 31, 2008, the yield stood at 7.93 per cent, 4 basis points lower than that at end-March 2007. The spread between 1year and 10-year yields was 45 basis points at end-March 2008 as compared with 42 basis points at end-March 2007. The spread between 10-year and 30-year yields was 47 basis points at end-March 2008 as compared with 37 basis points at end-March 2007. The average yield for entire year 2007-08 at 7.91 per cent was higher as against 7.78 per cent during the previous year.
2.128 During 2008-09 so far (April to July 2008), yields remained range-bound in the first two months but hardened significantly during June-July 2008 due to hardening of inflation and soaring international oil prices. The 10-year yield, which varied between 7.90-8.20 per cent during the first two months, peaked at 9.51 per cent on July 15, 2008.
Foreign Exchange Market
2.129 During 2007-08, the rupee moved in the range of Rs.43.15-39.26 per US dollar with an upward bias.

The rupee depreciated during the first half of August 2007 due to strong FII outflows led by bearish conditions in the equity market in India, concerns over subprime lending crisis in the US and the news that the international bank BNP Paribas had been forced to suspend calculation of the net asset value of three of its mutual funds. Thereafter, the rupee appreciated as a result of large capital inflows, weakening of the US dollar vis-à-vis other currencies and bullish conditions in the domestic stock market. However, the rupee started depreciating against the US dollar from the beginning of February 2008 on account of bearish conditions in the stock market, capital outflows, rising oil prices, increased demand for dollars by importers and FIIs. The rupee was placed at Rs.39.99 per US dollar on March 31, 2008. At this level, the Indian rupee appreciated by 9.0 per cent over its level on March 30, 2007 against US dollar, 7.6 per cent against the Pound sterling. However, it depreciated by 7.8 per cent against the Euro and 7.6 per cent against the Japanese yen (Chart II.18). During 200809 so far, the rupee continuing its previous trend, reached at Rs.43.58 per US dollar on August 21, 2008. Between end-March 2008 and August 21, 2008, the exchange rate of Indian rupee depreciated by 8.2 per cent against the US dollar, 2.4 per cent against the Pound sterling, 2.2 per cent against the Euro and 0.1 per cent against the Japanese yen. Between March 2007 and March 2008, the 36currency trade weighted nominal effective exchange rate (NEER) and real effective exchange rate (REER) of the Indian rupee experienced an appreciation of 1.4 per cent and 2.0 per cent, respectively, as against a depreciation of 2.7 per cent and 0.7 per cent, respectively, during the corresponding period of the previous year. The 6-currency trade weighted NEER and REER of the rupee appreciated by 0.2 per cent and 3.2 per cent, respectively, between March 2007 and March 2008 (Table 2.32).
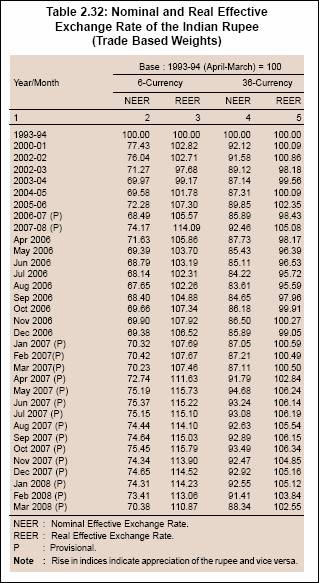
Management of Exchange Rate
2.130 The conduct of monetary policy in recent times had to contend with large capital flows and increased volatility in such flows. During 2007-08, FIIs invested in the Indian stock markets on a significant scale reflecting the buoyant stock markets, strong domestic activity and the appreciating trend in the Indian rupee. These inflows, however, were marked by volatile pattern over the months. During the large part of the year, the intervention by the Reserve Bank in the foreign exchange market mirrored the large capital flows on a month to month basis with the only exceptions being months of August 2007, November 2007, February 2008 and March 2008 when net purchases were made by the Reserve Bank despite net outflows on account of FIIs (Table 2.33 and Chart II.19). In August 2007, there were outflows on account of concerns over tightening of FII norms regarding Participatory Notes, bearish conditions in Asian stock markets including India, and a major sell-off in the US stock markets over concerns of further weakness in the housing market. The large outflows by FIIs in February 2008 were mainly due to refund of money brought in during January 2008 to subscribe to IPO issues.
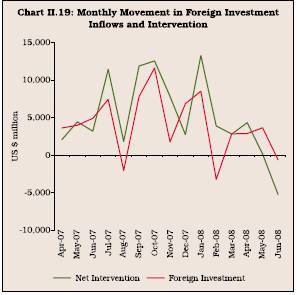
2.131 During the months of July, September, October 2007 and January 2008, the large purchases made by the Reserve Bank were in tandem with the large capital inflows during these months.
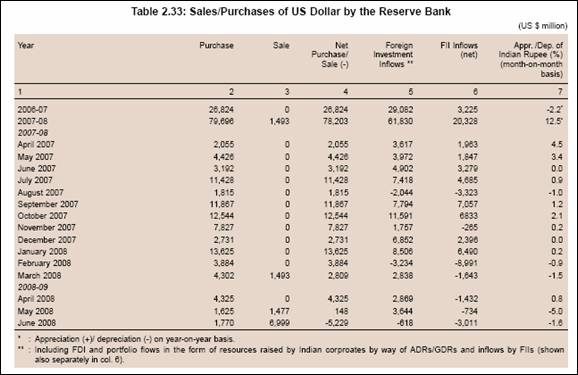
2.132 Despite large intervention by the Reserve Bank, the Indian rupee continued to appreciate during 2007-08. The rupee appreciated by 12.5 per cent on an annual average basis despite net purchases by the Reserve Bank to the tune of US $ 78.2 billion during the year 2007-08. In the absence of such large interventions, volatility in the exchange rate could have been significantly higher. In order to smoothen domestic liquidity impact of such interventions, the MSS operations – absorption in the face of heavy inflows and unwinding of balances during reversal/ lower inflows – were used on a significant scale, as detailed earlier.
2.133 Forward premia remained low during 2007-08, reflecting the easy liquidity conditions in the domestic money market and heavy forward sales by exporters. The forward premia in all maturities declined steadily during the year. The three-month forward premia declined from 5.1 per cent at end-March 2007 to 2.8 per cent at end-March 2008. The one-month forward rate turned into discount during February 2008. However, subsequently it was at premium. The one-month, three-month and six-month forward premia were 6.6 per cent, 5.3 per cent and 4.2 per cent, respectively, as on August 14, 2008 (Chart II.20).
Capital Market
2.134 The primary capital market in India witnessed generally buoyant conditions during 2007-08. The Indian stock markets witnessed sharp bouts of volatility during 2007-08 due mainly to trends in other emerging market economies.
Primary Market
2.135 Resource mobilisation through public issues was higher at Rs.83,707 crore (through 119 issues) during 2007-08 as compared with Rs.32,382 crore (through 119 issues) during the previous year (Table 2.34). All the public issues, except four, were by private sector companies. Further, out of 119 public issues, 116 were in the form of equity and only three in debt. However, resource mobilisation through public issues was adversely affected for a brief period in January 2008 due to sharp correction in the secondary market on account of concerns over recession in the US economy and turmoil in the global credit markets as detailed in the next section. This led to withdrawal of three issues from the market and also postponement of some planned issues. However, subsequently all the 16 issues, which entered the market during February-March 2008, were fully subscribed.

2.136 Resource mobilisation through pr ivate placement aggregated at Rs.2,12,568 crore during 2007-08, which was 45.7 per cent higher than that in 2006-07. Public sector entities accounted for 39.1 per cent of total resource mobilisation through private placements during 2007-08 as compared with 43.9 per cent in 2006-07 (Table 2.34). Resources mobilised by financial intermediaries (both public and private sector) increased by 43.6 per cent to Rs.1,44,336 crore during 2007-08 from Rs.1,00,531 crore in the last year.
2.137 Resource mobilisation through Euro issues by way of American depository receipts (ADRs) and Global depository receipts (GDRs) increased by 56.2 per cent during 2007-08. There were 26 Euro issues during 200708 amounting to Rs.26,556 crore as compared with 40 issues aggregating Rs.17,005 crore during 2006-07.
2.138 Net resource mobilisation by mutual funds (net of redemption) increased by 63.6 per cent during 200708 to Rs.1,53,802 crore (Table 2.35). Scheme-wise, 9.7 per cent of the net mobilisation of funds was under liquid/money market oriented schemes during 200708 (as compared with 5.3 per cent during the previous year) and 57.5 per cent by way of debt-oriented schemes (63.9 per cent during the previous year). Funds mobilised under equity-linked savings schemes, accounted for 4.0 per cent of total mobilisation during the period under review.
Secondary Market
2.139 The domestic stock markets began the financial year 2007-08 on a weak note. However, the markets bounced back soon and continued to surge till mid-August 2007 on the back of encouraging Q4 corporate results of 2006-07 declared by major companies, softening of global crude oil prices, reports of a normal South-West monsoon forecast by the India Meteorological Depar tment (IMD) and strong US employment data released on April 06, 2007. The BSE Sensex closed above the 15000-level on July 9, 2007. The markets, however, could not sustain the momentum and declined after mid-August 2007 taking cues from sharp correction in the global equity markets triggered by slump in the US home sales and rising concerns about the US mortgage and corporate lending markets. Increase in international crude oil prices, restrictions on repatriation of funds raised through external commercial borrowings (ECBs) by the Government and decline in global copper prices also affected the market sentiment.
2.140 The stock mar kets recovered again and remained buoyant till January 8, 2008 on the back of robust macroeconomic fundamentals, healthy corporate earnings, strong FIIs inflows, rise in global metal prices, cut in US Fed rate and easing of domestic annual inflation rate. Though, the domestic stock markets witnessed mild corrections during mid-October due to restrictions on Participatory Notes by SEBI and during mid-December 2007 due to downward trend in major international equity markets on account of worries over sub-prime losses and credit crunch in the US and Europe, concer ns over the slowdown in the US economy, depreciation of US dollar against major currencies and increase in global crude oil prices to record high levels, they recovered again to attain new highs. The BSE Sensex closed at the all time high level of 20873.33 on January 08, 2008, registering a gain of 59.7 per cent over end-March 2007.
2.141 Beginning, January 11, 2008, however, the domestic stock markets witnessed volatile conditions due to heightened concerns over recession in the US economy on account of contraction in the US service industry, weak earnings growth reported by some of the leading US companies, home foreclosures climbing to record high levels and lacklustre retail sales in the US. Liquidity squeeze from the secondary market in the wake of a large IPO, heavy sales by FIIs in the Indian equity market, downward revision of GDP growth rate by CSO, hike in short term capital gains tax from 10 per cent to 15 per cent in the Union Budget 200809, increase in domestic annual inflation rate, rise in global crude oil prices to record high levels and decline in ADR prices in the US markets also dampened the mar ket sentiment. As a consequence of these developments, the BSE Sensex and the S&P CNX Nifty closed at 15644.44 and 4734.50, respectively on March 31, 2008, registering a decline of 25.1 per cent and 24.7 per cent, respectively, over January 8, 2008. However, for the year as a whole, the BSE Sensex and S&P CNX Nifty registered gains of 19.7 per cent and 23.9 per cent, respectively.
2.142 Most of the sectoral indices, viz., metal, oil and gas, capital goods, fast moving consumer goods, public sector undertakings, banking and consumer durables registered gains during 2007-08. However, IT and auto sector stocks recorded declines (Chart II.21).
2.143 According to SEBI data, net investments by FIIs in Indian equities during 2007-08 at Rs.52,574 crore were more than two times the net investments in the previous year. Net investments in debt were Rs.12,499 crore as compared with Rs.6,081 crore during the previous year. Net investments by mutual funds in equities and debt instruments also increased sharply (Table 2.36).
2.144 The combined turnover in the cash segment of BSE and NSE during 2007-08 recorded an increase of 76.8 per cent over that of last year. The market capitalisation as a percentage of GDP improved from 85.5 per cent at end-March 2007 to 156.7 per cent on January 08, 2008 before declining to 109.5 per cent by end-March 2008. The price earning (P/E) ratio of BSE Sensex also rose from 20.3 at end-March 2007 to 28.5 by January 8, 2008, before sliding to 20.1 by end-March 2008. Volatility, measured by coefficient of variation, also increased during 2007-08 (Table 2.37).
2.145 During 2008-09, the domestic stock markets witnessed an increasing trend till May 21, 2008, registering gains of 10.2 per cent over end-March 2008. The markets, however, turned cautious thereafter mainly on account of hike in domestic retail fuel prices, rise in domestic inflation rate, net sales by FIIs in the Indian equity market, concerns over rising trade deficit and downward trend in major international equity markets, increase in international crude oil prices among others. As a result, both the BSE Sensex and the S&P CNX Nifty closed lower at 14297 and 4292, respectively, on August 27, 2008, registering losses of 8.6 per cent and 9.3 per cent, respectively, over their end-March 2008 level. Between end-March 2008 and August 27, 2008, the BSE Sensex moved in a range of 12576-17600.
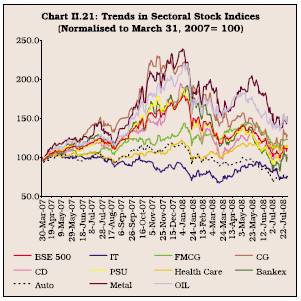

2.146 The total turnover in the derivative segment on NSE dur ing 2007-08 continued to remain significantly higher than the turnover in the cash segment (Table 2.38).
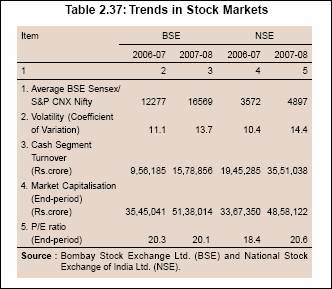

VI. BANKS AND FINANCIAL INSTITUTIONS
2.147 Robust macroeconomic perfor mance continued to underpin the business operations and financial performance of commercial banks, urban co-operative banks, FIs and NBFCs. The total assets of Scheduled Commercial Banks (SCBs) expanded by 24.3 per cent during 2006-07. The ratio of assets of SCBs to GDP (at factor cost at current prices) increased to 91.4 per cent at end-March 2007 from 85.0 per cent at end-March 2006, suggesting a faster growth of the banking system in relation to the real economy. However, after two consecutive years of strong expansion, the bank credit witnessed a modest slowdown in 2006-07.
2.148 For the third year in succession, loans and advances grew by over 30 per cent in 2006-07 (i.e., 30.6 per cent as compared with 31.8 per cent in 2005-06 and 33.2 per cent in 2004-05). The modest slowdown in overall credit6 was reflected in all the four major sectors, viz., agriculture, industry, services and personal loans. The credit slowdown was especially evident in real estate loans and personal loans. Credit growth to the priority sector also decelerated to 24.0 per cent in 2006-07 compared with the growth of 36.1 per cent in 2005-06. Credit to ‘other priority sector’, which witnessed a sharp growth in recent years, also decelerated sharply during 2006-07. Credit growth to the SSI sector, however, accelerated sharply. Reflecting the modest slowdown in credit growth and the sharp acceleration in deposits, the incremental credit deposit ratio (CDR), moderated towards the second half of 2006-07. As at end-March 2007, the incremental CDR was around 85 per cent (year-on-year) as compared with 110 per cent a year ago.
2.149 Net profits of SCBs, as a group, increased by 27.0 per cent during 2006-07 as compared with 17.3 per cent during 2005-06. The high growth in net profits was recorded despite a sharp increase in provisions and contingencies of SCBs. However, net profits as percentage of total assets were roughly the same as those in the previous year. Gross NPAs as percentage of gross advances at end-March 2007 declined further to 2.5 per cent from 3.3 per cent at end-March 2006. Net NPAs as percentage of net advances at end-March 2007 also declined to 1.0 per cent from 1.2 per cent at end-March 2006. SCBs’ capital to risk-weighted assets ratio (CRAR) remained at the previous year’s level of 12.3 per cent, suggesting that the increase in capital kept pace with the sharp increase in risk-weighted assets (Table 2.39).
2.150 The business operations of UCBs expanded by 5.9 per cent during 2006-07 compared with a growth of 24.3 per cent by SCBs during the same period. While loans and advances and other assets witnessed a sharp growth, growth in investments decelerated. Net profits of scheduled UCBs declined during 2006-07 as against an increase in the previous year mainly on account of increase in provisions, contingencies and taxes. Asset quality of UCBs improved significantly during 2006-07 as reflected in the decline in NPAs (gross and net) in absolute as well as percentage terms (Table 2.40).
2.151 As at end-March 2007, seven FIs were regulated by the Reserve Bank, viz., EXIM Bank, IFCI, IIBI, NABARD, NHB, SIDBI and TFCI. Of these, five FIs (EXIM Bank, IFCI, NABARD, NHB and SIDBI) were under the full-fledged regulation and supervision of the Reserve Bank. FIs not accepting public deposits but having asset size of Rs.500 crore and above are subject to limited off-site supervision by the Reserve Bank. TFCI belongs to this category, while IIBI is in the process of voluntary winding up. The exemption given to IFCI from NBFC regulations was withdrawn in August 2007 and it is now being regulated as a systemically important non-deposit taking non-banking financial company (NBFC-ND-SI).
2.152 Financial assistance sanctioned and disbursed (in absolute ter ms) by AIFIs, after showing a decline between 2000-01 and 2004-05, increased in the subsequent two years. Financial assistance sanctioned and disbursed by FIs, including AIFIs, specialised financial institutions and

investment institutions, increased by 12.9 per cent and 82.8 per cent, respectively, during 2006-07 as compared with an increase of 41.0 per cent and 38.0 per cent, respectively, during the previous year (Table 2.41).
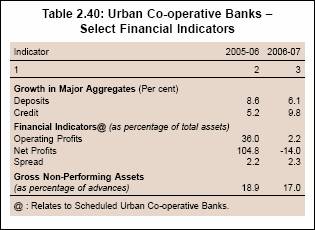
2.153 Resources raised by FIs from the money market during 2006-07 were significantly higher than those raised during 2005-06. The aggregate umbrella limits of select FIs for raising resources increased from Rs.15,157 crore as on March 31, 2006 to Rs.19,001 crore as on March 30, 2007. The aggregate outstanding resources raised by these FIs under the umbrella limit increased from Rs.1,977 crore (13.1 per cent of aggregate limit) as on March 31, 2006 to Rs.3,293 crore (17.3 per cent of aggregate limit) as on March 30, 2007. Based on outstanding position as on March 30, 2007, FIs raised bulk of resources through commercial paper (Rs.2,540 crore), followed by certificate of deposits (Rs.663 crore) and term deposits (Rs.89 crore). None of the FIs mobilised resources through term money or inter-corporate deposits during the period.
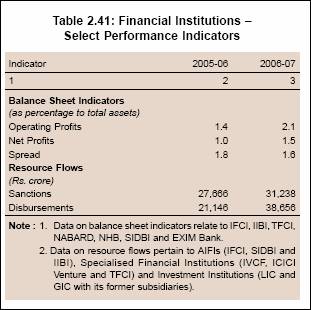
2.154 The capital adequacy ratio of FIs continued to be significantly higher than the minimum stipulated norm of 9 per cent. Net interest income of select all-India FIs increased to Rs.2,598 crore during 2006-07 from Rs.2,555 crore during 2005-06. In line with the trend in the previous year, non-interest income of FIs increased significantly from Rs.1,353 crore during 2005-06 to Rs.1,913 crore during 2006-07. However, in contrast to the sharp increase observed during the previous year, the operating expenses of FIs registered a decline of 55.9 per cent during the year. As a result, the operating profit increased sharply by 73.6 per cent (from Rs.1,993 crore in 2005-06 to Rs.3,460 crore in 2006-07). This was also reflected in the significant increase in net profit of FIs, despite higher provisions earmarked for taxation.
2.155 Total assets/liabilities of deposit taking NBFCs (excluding RNBCs), expanded at a much higher rate of 26.9 per cent during 2006-07 compared with 5.1 per cent during 2005-06 (Table 2.42). Borrowings, which represent a major source of funds for NBFCs, increased by 30.6 per cent during the year, while public deposits declined by 16.5 per cent indicating a shift in the pattern of resources raised. On the asset side, loans and advances and hire purchase assets together accounted for more than three-fourths of total assets. While loans and advances declined marginally by 0.8 per cent, hire purchase assets increased by 30.2 per cent during 2006-07. A new classification of NBFCs, viz., asset finance companies (AFCs) became effective since December 2006. Companies financing real/physical assets for productive/economic activities are reclassified as AFCs. As per this new classification, AFCs held the largest share in total assets/liabilities (51.5 per cent), followed by hire purchase finance companies (35.7 per cent) and loan companies (8.7 per cent). While assets of equipment leasing and hire purchase companies declined, reflecting mainly the reclassification of the NBFCs, those of loan and as well as investment groups increased during the year-ended March 2007.
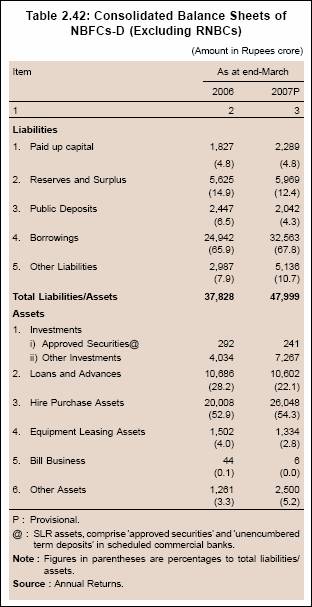
2.156 Assets of three RNBCs increased by 5.9 per cent during the year ended March 2007. Their assets in the form of unencumbered approved securities as well as bonds/debentures increased sharply, while those in fixed deposits/certificate of deposits of SCBs and other investments registered a decline (Table 2.43). Net owned funds of RNBCs increased by 15.5 per cent during 2006-07.
2.157 To sum up, the balance sheet of scheduled commercial banks continued to register a strong growth during 2006-07 on the back of robust macroeconomic performance. Credit growth continued to be robust at over 30 per cent for the third year in succession. Banks were able to sustain their profitability despite sharp increase in provisions and contingencies. Their capital adequacy level remained at the previous year’s level, despite a sharp increase in the risk-weighted assets. Asset quality, as reflected in gross and net NPA levels, improved further during the year.

VII. EXTERNAL SECTOR
Global Economic Outlook
2.158 Global economic activity remained strong in 2007, although it moderated from the robust conditions in 2006. Overall, global GDP measured at purchasing-power-parity weights is estimated to have increased by 5.0 per cent in 2007 - well above trend for the fourth consecutive year - as compared with 5.1 per cent in 2006 (Chart II.22). Following a stronger-than-expected third quar ter growth, activity in advanced economies decelerated quite sharply towards the end of the year 2007, particularly in the United States, as the problem in the U.S. sub-prime mortgage market had knock-on effects across a broad range of financial markets and institutions. By contrast, emerging and developing economies continued to grow at a robust pace, notwithstanding some slowing down of activity towards the end of the year 2007. China and India, which grew by 11.9 per cent and 9.0 per cent, respectively, in 2007, continued to lead the growth in emerging economies. The growth momentum was provided by strong productivity gains as these countries progressively integrated into the global economy. Furthermore, these countries benefitted from favourable terms of trade for commodity producers (oil and other raw material) on account of increase in prices.
2.159 During the fourth quarter of 2007, growth in most of the advanced countries decelerated from the corresponding period of the last year. In contrast, growth of emerging market economies accelerated (Table 2.44).

2.160 According to the IMF, the continuing housing correction in the United States would remain a drag on demand and a source of uncertainty for financial markets. As a result, the U.S. economy projected by the IMF, is to grow at 1.3 per cent in 2008 (Table 2.44), despite the substantial monetary and fiscal stimulus that has already been provided. Other advanced economies will also slow down in the face of trade and financial spillovers, with the housing market, in par ticular, acting as a source of drag in some European countries. Emerging and developing economies are also expected to decelerate, reflecting efforts to prevent overheating in some countries, spillovers from the advanced economies and some moderation in commodity prices. However, growth will continue to be above trend in all the regions.
2.161 According to the IMF, growth in world trade (goods and services) is expected to moderate to 5.6 per cent in volume terms in 2008 from 6.8 per cent in the preceding year (Chart II.23 A). Exports (goods and services) of other emerging market and developing countries are projected to grow by 7.1 per cent in 2008 (8.9 per cent a year earlier), while those of advanced countries are expected to grow by 4.5 per cent (5.8 per cent a year earlier). The prices of manufactures traded globally accelerated from 3.8 per cent in US$ terms (4.2 per cent in SDR terms) in 2006 to 9.7 per cent in US$ terms (5.6 per cent in SDR terms) in 2007 (Chart II.23 B). According to the IMF, private net capital flows to emerging and developing countries recorded a substantial increase from US$ 231.9 billion in 2006 to US$ 605.0 billion in 2007. Capital flows are projected to decline considerably to US$ 330.7 billion in 2008 mainly on account of projected decline in other private capital flows.
2.162 The overall balance of risks to the short-term global growth outlook remains tilted to the downside. The greatest risk comes from the still unfolding events in financial markets, particularly the potential for deep losses on structured credits related to the U.S. sub-prime mortgage market and other sectors, which could seriously impair the balance sheets of the financial system. Interaction between negative financial shocks and domestic demand, particularly through the housing market, remains a concern for the United States and to a lesser degree for Western Europe and other advanced economies. There is some upside potential from projections for domestic demand in the emerging economies, but these economies remain vulnerable to trade and financial spillovers.
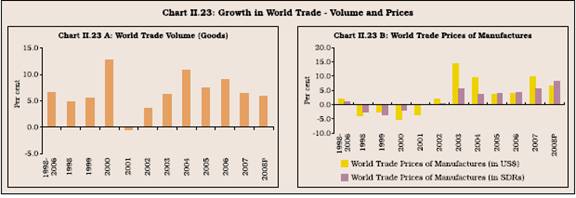
2.163 International financial markets witnessed heightened uncertainties and turbulent conditions during 2007-08, triggered by problems in the US sub-prime market. The disturbances, subsequently, spilled over into the credit market and the short-term money markets, resulting in sharp increase in overnight interest rates in major economies in August 2007 as banks sought to conserve their own liquidity. Central banks of advanced economies responded with both conventional and unconventional measures to ease liquidity stress in financial markets and address solvency issues among large financial institutions. Some central banks, notably the ECB, the Reserve Bank of Australia and the Swiss National Bank responded by providing liquidity to inter-bank markets, implicitly viewing the financial turmoil as essentially a problem of liquidity tightness. These central banks provided liquidity through fine-tuning operations aimed at assuring orderly conditions in their respective money markets. On the other hand, some central banks like the US Fed, the Bank of England and the Bank of Canada responded in a more diverse manner to deal with the market stress as reflected in both liquidity seizure as well as broader threats to financial stability, coupled with dangers of the slowdown in economic activity becoming protracted. Accordingly, they moved to inject liquidity into money markets through normal and special facilities. They also relaxed the class of eligible securities for liquidity availment from the central bank. Furthermore, they also cut policy rates substantially amidst fears that the sub-prime crisis could turn into a major credit crunch with adverse implications for the real sector. The US Fed was also involved in resolution of problems arising in non-bank entities such as investment banks and insurance companies. The Bank of England provided generalised and institution-specific emergency liquidity and facilities for swapping securities.
2.164 In the second phase of central bank intervention in December 2007 (the first phase being spread over August-September, 2007), major central banks such as the US Federal Reserve, the Bank of Canada, the Bank of England, the European Central Bank and the Swiss National Bank (SNB) injected liquidity in a co-ordinated manner. Actions taken by the Federal Reserve included the establishment of a temporary Term Auction Facility (TAF) against a wide variety of collateral that could be used to secure loans at the discount window; the establishment of foreign exchange swap lines with the ECB and the SNB which would provide dollars in amounts of up to US $ 20 billion and US $ 6 billion to the ECB and the SNB, respectively, for use in their jurisdictions. Besides, a Term Securities Lending Facility was announced on March 11, 2008 and a Primary Dealer Credit Facility (PDCF) on April 22, 2008. The size of individual TAF auctions was raised from US $ 20 billion at the inception of the programme to US $ 75 billion in the auctions in May 2008.
2.165 Some central banks have reduced policy rates since the third quar ter of 2007 when the financial market turmoil surfaced. During September 18, 2007 to April 30, 2008, the US Federal Reserve reduced its policy rate by 275 basis points to 2.00 per cent after seventeen increases to 5.25 per cent between June 2004 and June 2006. The Bank of England reduced its Bank Rate by 25 basis points each in February and April 2008 to 5.0 per cent. The Bank of Canada reduced its rate by 25 basis points each in December 2007 and January 2008 and 50 basis points each in March and April 2008 to 3.0 per cent. Central banks of some countries, including the Euro Area, Japan and Korea have not changed their rates since the last quarter of 2007. Some central banks that have tightened their policy rates in recent months include the Reserve Bank of Australia (Cash Rate raised by 25 basis points in February-March 2008 to 7.25 per cent); the People’s Bank of China (lending rate raised to 7.47 per cent in December 2007 from 7.29 per cent in September 2007); the Banco Central de Chile (benchmark lending rate raised to 6.25 per cent in January 2008 from 5.75 per cent in October 2007 and to 6.75 per cent is June 2008 and further to 7.25 per cent in July 2008), and Banco Central do Brasil (overnight Selic rate raised by 50 basis points to 11.75 per cent in April 2008, 12.25 per cent in June 2008 and by 75 basis points to 13 per cent in July 2008).
2.166 The sub-prime crisis in the US did not have any significant impact on the Indian economy, except that the equity market turned volatile in line with developments in the major inter national equity markets as detailed in the previous section. In India, however, surplus liquidity conditions and increase in inflation rate necessitated policy responses. The repo rate was revised from 7.75 per cent on March 30, 2007 to 8.00 per cent on June 11, 2008, 8.50 per cent on June 24, 2008 and further to 9.0 per cent with effect from August 30, 2008. The CRR was also revised progressively from 6.00 per cent on March 3, 2007 to 8.75 per cent on June 24, 2008 and further to 9.0 per cent with effect from August 30, 2008.
India’s Merchandise Trade
2.167 India’s merchandise trade (both exports and imports) continued to maintain high growth during 2007-08. According to the DGCI&S, exports at US $ 159.0 billion during 2007-08 registered a growth of 25.8 per cent as compared with 22.6 per cent in the previous year. Imports at US $ 239.7 billion during 2007-08 exhibited a growth of 29.0 per cent as compared with 24.5 per cent a year ago (Table 2.45).
2.168 Trade deficit during 2007-08 at US $ 80.6 billion showed an increase of US $ 21.3 billion over 2006-07. During 2007-08 trade deficit on oil account amounted to US $ 54.8 billion (US $ 38.5 billion a year ago) and non-oil trade deficit amounted to US $ 25.9 billion (US $ 20.9 billion a year ago).The annual growth in exports during the five year period (200308) averaged 24.7 per cent. As a result, India remained as one of the fastest growing exporting countries in the world (Table 2.46).
2.169 Commodity-wise exports data for 2007-08 (April-March) showed pick up in the growth of primary products, and manufactured goods exports (Table 2.47).
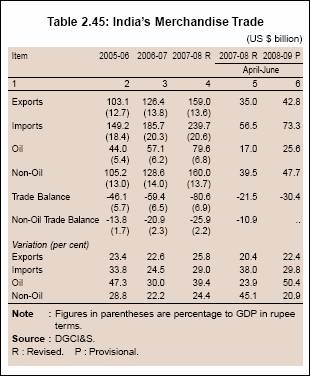
2.170 Agricultural and allied products, engineering goods, gems and jewellery and petroleum products were the main drivers of export growth as these products together contributed about 69 per cent of export growth during 2007-08. Exports of primary
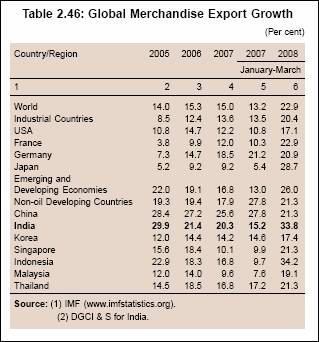

products during 2007-08 showed accelerated growth of 37.5 per cent due to pick up in the exports of agricultural and allied products (42.4 per cent) and iron ore (47.2 per cent). Exports of manufactured goods during 2007-08 recorded a growth of 19.1 percent (17.0 per cent a year ago). Within manufactured goods, chemicals and related products and gems and jewellery exhibited higher growth in exports, while engineering goods showed moderation. Exports of petroleum products recorded 33.1 per cent growth during 2007-08 (60.5 per cent a year ago). Destination-wise, the US continued to be the single largest market for India with a share of 13.0 per cent in the overall exports (14.9 per cent a year ago). The other major destinations were the UAE (9.7 per cent), China (6.8 per cent), Singapore (4.3 per cent), the UK (4.1 per cent), Hong Kong (4.0 per cent), Germany (3.2 per cent) and the Netherlands (3.0 per cent). Region-wise, exports to EU, Eastern Europe and Asian developing countries accelerated, while exports to OPEC and Latin American developing countries moderated (Table 2.48).
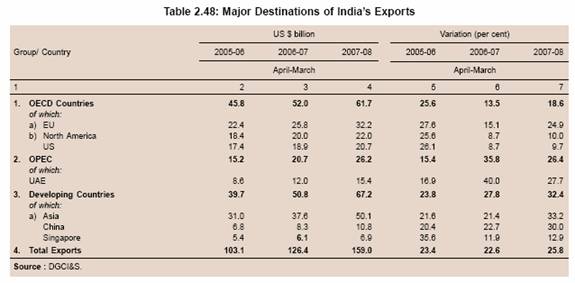
2.171 Imports maintained the growth momentum during 2007-08 due to high growth in both oil and non-oil imports (refer Table 2.45). During 2007-08, capital goods imports increased by 24.1 per cent (25.0 per cent a year ago), while gold and silver grew by 21.8 per cent (29.4 per cent a year ago) (Table 2.49). Source-wise, China was the principal source of imports, accounting for 11.3 per cent of total imports during 2007-08. The other major sources were Saudi Arabia (8.1 per cent), the UAE (5.6 per cent), the US (5.5 per cent), Iran (4.6 per cent), Switzerland (4.1 per cent), Germany (4.0 per cent) and Australia (3.3 per cent).
2.172 During 2008-09 (April-June) merchandise exports recorded a growth of 22.4 per cent [20.4 per cent in 2007-08 (April-June)] and imports posted a growth of 29.8 per cent (38.0 per cent a year ago). Trade deficit during April-June 2008 at US $ 30.4 billion was higher by US $ 9.0 billion than US $ 21.5 billion during April-June 2007.
Balance of Payments
2.173 India’s balance of payments position remained comfor table during 2007-08. Despite significant widening of the trade deficit, the current account deficit was contained, although it was somewhat higher than 2006-07, due to the surplus on the invisibles account led by higher private remittances and software services export. The higher current account deficit, however, was easily financed by capital flows, which remained large during 2007-08. Of the components of capital flows, por tfolio investment including FIIs, external commercial borrowings, inward foreign direct investment and short term trade credit increased significantly in 2007-08. Outward FDI continued to grow, reflecting the appetite of Indian companies for global expansion in terms of markets and resources.
Current Account
2.174 The trade deficit (balance of payments basis) widened to US $ 90.1 billion during 2007-08 from US $ 63.2 billion in 2006-07. Net surplus in invisibles was at US $ 72.7 billion during 2007-08 as against US $ 53.4 billion during 2006-07, exhibiting a growth of 36.0 per cent. The net invisible surplus offset 80.7 per cent of the trade deficit during 2007-08 as compared with 84.5 per cent during the corresponding period of the previous year. The current account deficit increased to US $ 17.4 billion in 2007-08 from US $ 9.8 billion in 2006-07 (Table 2.50).
2.175 Invisible receipts recorded a growth of 26.2 per cent during 2007-08 (28.3 per cent during 2006-07) (Chart II.24). The key contributors of invisibles receipts were remittances from overseas Indians, software services exports, investment income, travel earnings and transpor tation. Private transfers comprising primarily remittances from the Indians working overseas and local withdrawal from non-resident rupee account for domestic use, were at US $ 42.6 billion (US $ 29.0 billion in 2006-07), recording a growth of 47.1 per cent in 2007-08 (16.0 per cent in 2006-07). Software services exports at US $ 40.3 billion in 2007-08 showed a lower growth of 28.8 per cent than that of 32.6 per cent in 2006-07. Invisible payments recorded a growth of 17.7 per cent during 2007-08 (29.3 per cent in 2006-07). The major components of invisible payments were travel payments, transportation, business service payments
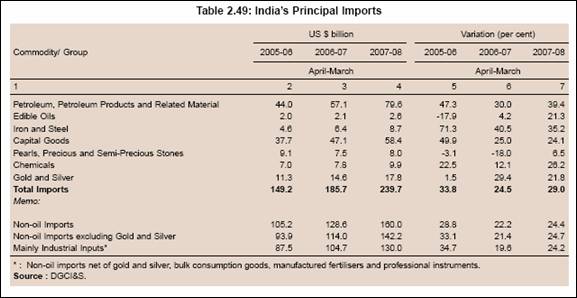
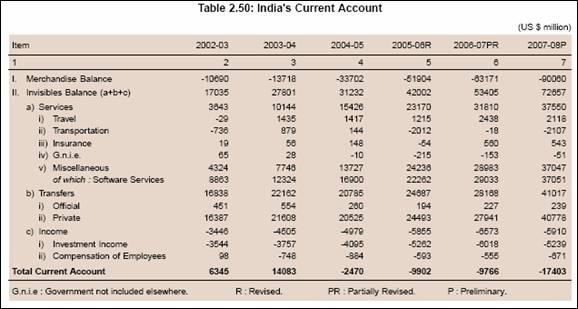
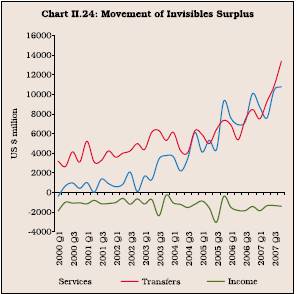
such as business and management consultancy; engineering and other technical ser vices; and dividend, profit and interest payments.
2.176 The current account deficit of India widened to US $ 17.4 billion in 2007-08 reflecting the sharp rise in trade deficit led by high growth of crude oil imports, capital goods and gold and silver. According to the DGCI&S data, non-oil imports recorded a higher growth of 24.4 per cent during 2007-08 (22.2 per cent in 2006-07). The other major non-oil products, which showed accelerated growth in imports during the period were edible oil, fertilisers, iron and steel, pearls, precious and semi-precious stones, chemicals, textiles, coal, and coke. Oil imports, according to the DGCI&S data, increased by 39.4 per cent in 2007-08 (30.0 per cent in 2006-07) with the average price of the Indian basket of international crude (a mix of Oman, Dubai and Brent varieties) rising to US $ 79.5 per barrel (ranging between US $ 65.5 to US $ 99.8 per barrel) in 2007-08 from US $ 62.4 per barrel in the corresponding period of the previous year.
Capital Account
2.177 Capital inflows (net) into India during 200708 were at US $ 108.0 billion as compared with US $ 45.8 billion during the corresponding period of last year (Table 2.51). All the components of capital flows, barring NRI deposits, recorded higher inflows during 2007-08.
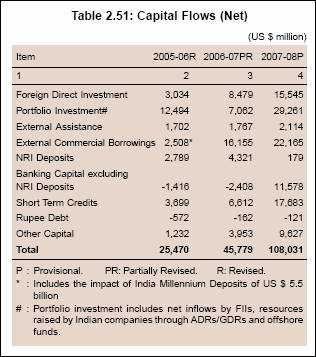
2.178 Foreign investment inflows continued to be robust, registering an inflow of US $ 61.8 billion in 2007-08. The inflows into India under direct investment (including equity capital of unincor porated entities, reinvested earnings and inter-corporate debt transactions between the related entities) at US $ 32.4 billion during 2007-08 were higher than those of the previous year (Table 2.52). The pick-up in FDI inflows reflected growing investors’ interest in the Indian economy due to rationalisation/liberalisation of the FDI policy. In continuation of India’s liberalisation policy, FDI ceiling was raised from 49 per cent to 74 per cent in the telecom sector. FDI was channelled mainly into manufacture, financial services and construction. Mauritius, Singapore, Netherlands and the UK remained the dominant sources of FDI into India.
2.179 During 2007-08, gross inflows and gross outflows by FIIs were of a higher order at US $ 226.6 billion and US $ 206.3 billion, respectively, resulting in net inflows of US $ 20.3 billion (US $ 3.2 billion in 2006-07). At the beginning of the year 2007-08, FIIs made net investments in the Indian stock markets on a significant scale, reflecting the strong domestic economic activity and the appreciating trend in the Indian rupee (Table 2.53 and Chart II.25). During June-July 2007, FII net inflows surged mainly due to two large IPOs as also the excess liquidity available in the global markets. However, in August 2007, there were heavy net outflows emanating from concerns over tightening of FII norms regarding participatory notes, bearish condition in the Asian stock markets including India, and the major sell-off in the US stock markets over concerns of further weakness in the housing market. This was followed by a surge in inflows to a record level in September 2007, which broadly continued till January 2008. During January 2008, there were net inflows of US $ 6.5 billion by FIIs mainly due to subscription to two large issues. However, a net outflow of US $ 9.0 billion was witnessed in February 2008 mainly because of refund of money brought in during January 2008 for subscription to IPOs.

2.180 The outflows continued during March 2008 till July 2008, which could be ascribed to the persistence of volatile global credit market conditions emanating from the US sub-prime loan crisis. The number of FIIs 08 (refer Table 2.52).
2.181 During the financial year 2007-08, the inflows (net) under external commercial borrowings (ECBs) were higher at US $ 22.2 billion as compared with US $ 16.2 billion in the corresponding period of previous year.
2.182 A net inflow of US $ 179 million was recorded under NRI deposits during 2007-08, reflecting the impact of downward revision in ceiling interest rates during January 2007 and April 2007 and large local withdrawals from Non-Resident External Rupee Account (NR(E)RA) deposits. However, there were inflows under NR(E)RA deposits and Non-Resident Ordinary (NRO) Rupee account segments (Table 2.54 and Chart II.26).
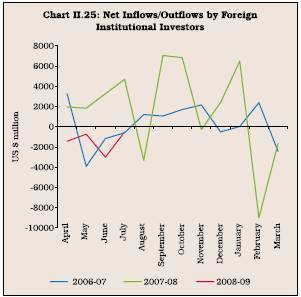
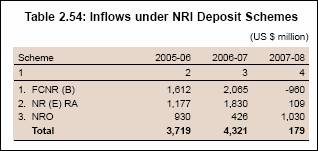
Foreign Exchange Reserves
2.183 During 2007-08 (April-March), capital inflows were significantly larger than the current account deficit, resulting in an increase in foreign exchange reserves of US $ 110.5 billion (including valuation) over end-March 2007. India’s foreign exchange reserves comprising foreign currency assets, gold, Special Drawing Rights (SDRs) and Reser ve Tranche Position (RTP) at the IMF reached US $ 296.2 billion as on August 15, 2008 (US $ 226.4 billion as on corresponding period of the previous year). At end-March 2008, India was the third largest holder of the stock of reserves among the emerging market economies and the fourth largest in the world.
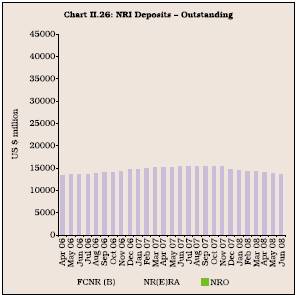
India’s External Debt
2.184 India’s total external debt was placed at US $ 221.2 billion at end-March 2008, recording an increase of US $ 51.5 billion (30.4 per cent) over end-March 2007. The increase in external debt during the period was mainly on account of higher external commercial borrowings, and higher shortter m trade credit. Higher external commercial borrowing by Indian companies reflected the existing interest differential between domestic and inter national rates and benign exchange rate expectations. Furthermore, of the increase of US $ 51.5 billion in external debt during the year 2007-08, valuation effects reflecting the depreciation of the US dollar against other major inter national currencies and Indian rupee accounted for US $ 9.9 billion. Suppliers’ credits up to 180 days maturity and investment by foreign institutional investors in short-term debt instruments have been included in short-term debt of India since March 2005. The short-term debt outstanding increased to US $ 44.3 billion at end-March 2008 from US $ 26.4 billion at end-March 2007, accounting for 34.8 per cent of the total increase in external debt (Table 2.55). The US dollar remained as the leading currency in which India’s external debt was denominated, accounting for about 57.1 per cent of total debt (Chart II.27).
2.185 Debt sustainability indicators remained at comfortable levels during 2007-08. The external debt to GDP ratio increased to 18.8 per cent at end-March 2008 from 17.8 per cent at end-March 2007.

The ratio was 30.8 per cent at end-March 1995. The debt service ratio was placed at 5.4 per cent during 2007-08 as against 4.8 per cent in 2006-07 and 9.9 per cent in 2005-06. Reflecting the rise in short term debt during 2007-08, the ratio of short-term to total debt and short term debt to reserves rose to 20.0 per cent and 14.3 per cent, respectively. India’s foreign exchange reserves exceeded the external debt by US $ 88.5 billion providing a cover of 140.0 per cent to the external debt stock at end-March 2008 (Table 2.55).
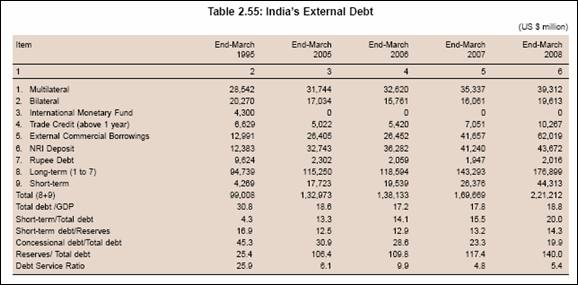
VIII. OVERALL ASSESSMENT
2.186 The Indian economy during 2007-08 continued to show robust growth, albeit with some moderation relative to the previous year. The performance of the South-West monsoon was better than the rainfall forecast by IMD. According to the fourth advance estimates released by the Ministry of Agriculture, the total foodgrain production during 2007-08 was estimated at a record high. The industrial sector growth moderated during 2007-08 mainly due to slowdown in the manufacturing sector growth. However, the capital goods sector continued to show robust growth performance.The service sector continued to register double-digit growth during 2007-08. The revised estimates by the CSO suggest that the service sector would continue to grow at double-digit rate, although the overall growth would be marginally lower than that in 2006-07. The revised estimates by the CSO placed the real GDP growth during 2007-08 at 9.0 per cent.
2.187 The gross fiscal deficit and revenue deficit, as percentages to GDP, under the revised estimates of the Central Government for 2007-08 were placed lower than the budgeted estimates. This was enabled by buoyant revenue receipts, especially direct taxes, which more than offset the increased expenditure on account of higher provisions for interest payments and subsidies. The budget estimates for 2008-09 project a further reduction in all the key deficit indictors, based on buoyant tax receipts on the one hand and better expenditure management on the other. Though the FRBM target of achieving GFD at 3.0 per cent of GDP by 2008-09 was set to be achieved, the target of achieving zero revenue deficit by 2008-09 was proposed to be rescheduled on account of implementation of plan programmes and schemes which entail substantial revenue expenditures. Off-budgetary pressure from oil bonds, Sixth Pay revision of salaries of the Central Gover nment employees, fer tiliser subsidy and systemic rigidities in containing non-plan expenditures in the short-run may exert some pressures on finances of the Central Government in 2008-09.
2.188 Inflation, based on wholesale price index (WPI), while remaining largely subdued in the first eight months of 2007-08, began to harden from December 2007 onwards on account of firming of prices of primary non-food articles and manufactured products. On a y-o-y basis, inflation was 7.7 per cent at end-March 2008. However, on an annual average basis, inflation at 4.7 per cent during 2007-08 was lower than that in the previous year. Inflation based on consumer price indices declined up to January 2008 on account of the moderation in food price inflation. However, subsequently CPI inflation measures hardened due to rise in food, fuel and services (represented by the miscelloneous group) prices. In recognition of the unanticipated supply-side pressures on inflation in recent months, partly due to global developments, the Government undertook several measures such as reduction in import duty on wheat and edible oils, a ban on exports of non-basmati rice, edible oils and pulses, an increase in the minimum export price relating to basmati rice, and reduction in customs duty on rice, skimmed milk powder, edible oils, butter oil and maize. Other administrative measures were also initiated such as imposition of stock limits on select agricultural products to contain inflationary expectations. Between end-March 2008 and July 29, 2008, the Reserve Bank also announced monetary measures such as increase in CRR by 150 basis points (including the 25 basis points to be effective from August 30, 2008) and the repo rate by 125 basis points. The recent initiatives with regard to supply management by the Government and monetary measures by the Reserve Bank are expected to have moderating impact on inflation in the near future.
2.189 Financial market conditions remained orderly during 2007-08, barring the equity market which witnessed bouts of volatility in tandem with the trends in major international equity markets. The money market witnessed brief spells of volatility on account of changes in capital flows and cash balances of the Central Government with the Reserve Bank. Money market interest rates remained within the informal corridor set by reverse repo and repo rates during most part of the second half of the year. In the foreign exchange market, Indian rupee generally exhibited two-way movements during the year. Yields in the Government securities market softened during the major part of the year.
2.190 The balance sheet of scheduled commercial banks continued to expand at a robust pace in 2006-07, underpinned by strong macroeconomic performance. The strong credit growth during the year was also accompanied by an improvement in asset quality. Banks profitability improved and they were able to maintain the CRAR at the previous year’s level.
2.191 India’s balance of payments position remained comfor table during 2007-08. Despite significant widening of trade deficit, the current account deficit was contained mainly due to increased surplus on invisibles account led by higher private remittances and software services export. During 2007-08, net capital inflows were large amounting to US $ 108.0 billion as compared with US $ 45.8 billion during 2006-07. India’s foreign exchange reserves increased by US $ 110.5 billion during the year to reach US $ 309.7 billion at end-March 2008.
2.192 Global economic activity is projected to slow down in 2008 on account of slowdown in the US economy. Furthermore, there is an apprehension that the financial turmoil may spill over to the real sector with adverse implication for employment and growth. In 2007-08, the food price inflation, triggered by strong demand and dwindling stocks, emerged as the key risk to global stability. World crude oil prices continued to remain high on account of low available crude oil surplus production capacity combined with supply concerns in several oil exporting countries. Inflationary pressures were evident in both mature economies and EMEs during 2007-08, although they were more pronounced in EMEs. Elevated inflationary pressure in many economies reflected historical peaks in crude oil prices.
2.193 The Reserve Bank’s Annual Policy Statement for 2008-09 (April 2008) noted that there were significant shifts in both global and domestic developments during 2007-08 in relation to the initial assessments. According to the Statement, the dangers of global recession had increased although consensus expectations did not rule out a soft landing. The Annual Policy Statement also noted that given the unprecedented complexities involved and the heightened uncertainties, there are some key factors that governed the setting of the stance of monetary policy for 2008-09. First, there is the immediate challenge of escalated and volatile food and energy pr ices which possibly contain some str uctural components. It is necessary, however, to recognise that there are also cyclical components in their evolution. Second, while demand pressures persist, there has been some improvement in the domestic supply response alongside a build-up of additional capacities, enabled by a conducive policy environment. Accordingly, even as investment demand remains strong, supply elasticities can be expected to improve further and new capacities should come on stream in the months ahead. Third, calibrated monetary policy actions undertaken since September 2004 continue to have some stabilising influence on the economy. Further, the recent initiatives in regard to supply-management by the Government of India and measures relating to the cash reserve ratio by the Reserve Bank are in the process of impacting the economy, although, inflationary outlook would depend upon a more reliable assessment of crop prospects at that point of time. Fourth, critical to the setting of monetary policy is the impor tance of anchoring expectations relating to both global and domestic developments. Accordingly, policy responses for managing expectations should consider the evolving global and domestic uncertainties surrounding the slowing down of global output growth and also the potential for exaggerated bearishness in the Indian context. Fifth, while monetary policy has to respond proactively to immediate concerns, it cannot afford to ignore considerations over a relatively longer term perspective of, say, one to two years, with respect to overall macroeconomic prospects. At the same time, it is critical at the prevailing juncture to demonstrate on a continuing basis a determination to act decisively, effectively and swiftly to curb any signs of adverse developments in regard to inflation expectations. In view of the above unprecedented uncertainties and dilemmas, it is important to take informed judgements with regard to the timing and magnitude of policy actions; and such judgements need to have the benefit of evaluation of incoming information on a continuous basis.
2.194 The Reser ve Bank in the Annual Policy Statement released in April 2008 placed the real GDP growth for 2008-09 at around 8.0 to 8.5 per cent, which has been placed at around 8.0 per cent in Statement on Quarterly Review of Monetary Policy July 2008. Against this backdrop, barring the emergence of any adverse and unexpected developments in various sectors of the economy and keeping in view the prevailing assessment of the economy including the outlook for growth and inflation, in the Annual Policy Statement for the year 2008-09, the overall stance of monetary policy was broadly stated as : (i) to ensure a monetary and interest rate environment that accords high priority to price stability, well-anchored inflation expectations and orderly conditions in financial markets while being conductive to continuation of the growth momentum; (ii) to respond swiftly on a continuing basis to the evolving constellation of adverse international developments and to the domestic situation impinging on inflation expectations, financial stability and growth momentum, with both conventional and unconventional measures, as appropriate; and (iii) to emphasise credit quality as well as credit delivery, in particular, for employment-intensive sectors, while pursuing financial inclusion.
1 The four broad homogeneous regions are: 1) North-West India (Uttar Pradesh, Rajasthan, Haryana, Chandigarh and Delhi, Punjab, Uttaranchal, Himachal Pradesh and Jammu and Kashmir); 2) Central India (Madhya Pradesh, Chhattisgarh, Maharashtra, Orissa, Gujarat and Goa); 3) South Peninsula (Andhra Pradesh, Karnataka, Tamil Nadu and Puducherry, Kerala, Lakshadweep and Andaman and Nicobar Islands); and 4) North-East India (Bihar, Jharkhand, West Bengal, Sikkim, Assam, Arunachal Pradesh, Meghalaya, Nagaland, Manipur, Mizoram, Tripura).
2 All comparisons of 2007-08 in this Section are with budget estimates, unless stated otherwise.
3 All comparisons with 2008-09 in this Section are with revised estimates for 2007-08, unless stated otherwise.
4 The analysis of State Finances for 2008-09 (Budget Estimates) is based on the budgets of 28 State Governments.
5 The CRR was further raised by 150 basis points during 2008-09.
6As per sectoral credit data relating to 51 scheduled commercial banks. |
 IST,
IST,


