 IST,
IST,


III. COVID-19 Pandemic and its Spatial Dimensions in India
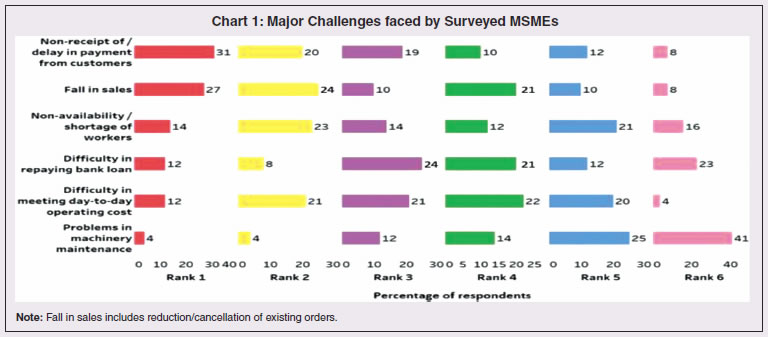
1. Introduction 3.1 State budgets were mostly presented during February-March 2020, i.e., ahead of the pandemic which has taken a more grievous toll in some of the states relative to even some of the most affected nations in the world1. A heartening feature is that the case fatality rate2 in all the states, except two, has been below the global average. While a large part of the policy response has been from the centre, mainly through its Aatma Nirbhar Bharat Abhiyan package, states have also ramped up health care, social services and containment measures. The spatial and structural dimensions of the pandemic are still unfolding. 3.2 No state or union territory in India has been spared by the pandemic, with the sole exception of Lakshadweep. The spread of infections has, however, been disproportionate and varied; policy responses and outcomes have also been diverse. A meta-analysis of spatial studies shows that the duration of the lockdown became a function of the availability of healthcare resources and accessibility to them across regions. Likewise, regions with well-developed digitised infrastructure and population could ensure faster and more effective relief operations. Another dimension of the health crisis is that lockdowns driven by fast spreading contagion posed a formidable challenge for spatial mobility of workers – inter- and intra-state, and abroad – with implications for regions dependent on migrant workers for labour or remittances. 3.3 These spatial and structural dimensions also have implications for the fisc on demographic and epidemiological considerations. High decentralisation in expenditure has been an enabling factor in the policy response of states – about 65 per cent of the total government expenditure is at the state level, and more so in the case of public health expenditure under which states spend above 85 per cent of the general government expenditure. 3.4 The rest of the Chapter is organised into 8 sections. Some stylised facts on the regional dimensions of the COVID-19 outbreak in India are documented in Section 2 against the backdrop of a quick tour of the history of pandemics in India. Structural health factors – demographics and epidemiology; and healthcare systems – are discussed in Section 3 and Section 4, respectively. The regional dimensions of migration, employment and micro, small and medium enterprises (MSMEs) are examined in Section 5. Digitisation has proved to be an important platform that provided offsets to demand and intermediate business transactions, as discussed in Section 6. The role of third tier local governments in influencing the effectiveness of the policy response is assessed in Section 7. Section 8 deals with the implications of the pandemic for states’ output during 2020-21. Concluding observations are set out in Section 9. 3.5 History is replete with visitations of pandemics in India. The ‘Black Death’ plague of 1346-1353 took the worst death toll ever worldwide, and also passed through India. The worst fatality record in India was associated with the Spanish flu pandemic during 1918-20. Operating in waves, the human cost of the pandemic was about 12 to 18 million people (4 to 7 per cent of the population)3, leading to a decline in population across provinces such as Ajmer-Merwara, United Provinces, Central Provinces, Bombay, Bihar and Orissa as per the 1921 decadal census, a first in modern India’s history (Table III.1). Like the COVID-19 pandemic, the 1918 flu was also superimposed on a pre-existing slowdown in the Indian economy. The country was also severely affected by several bubonic plague pandemics during 1855-1960, the spread of small pox in 1974, and localised but intense spread of bubonic and pneumonic plague in 1994. Most earlier outbreaks of epidemics across states viz., small pox, zika, chikungunya and dengue were not very contagious, had relatively lower death rates, and were contained with the discovery of vaccines. The Nipah outbreak in South India (2018) had a high fatality rate but stands out as the one to be detected and contained in a short span of time, primarily attributed to successful contact tracing operations and containment measures (Rahim et al., 2020). 3.6 An event study analysis using four pandemic outbreaks in India viz. the 1896 plague, the 1918 Spanish flu, the 1957 Asian flu and the 1974 small pox, shows that all episodes were associated with a contraction/deceleration in GDP, with the 1918 flu registering the sharpest downturn of about 13 per cent. Interestingly, the recovery pattern is quite similar - a sharp rebound in the immediate subsequent year because of favourable base effects, followed by contraction again, with the GDP growth rate finally subsiding back to pre-pandemic years in about 3-4 years (Chart III.1). These severe disease outbreaks have also depressed per capita economic output in the economy, albeit with varied magnitudes. The recovery, however, is observed to be swift and complete within two years of the outbreak, except in the case of the 1918 flu when GDP per capita was restored to pre-outbreak levels only in 19224. 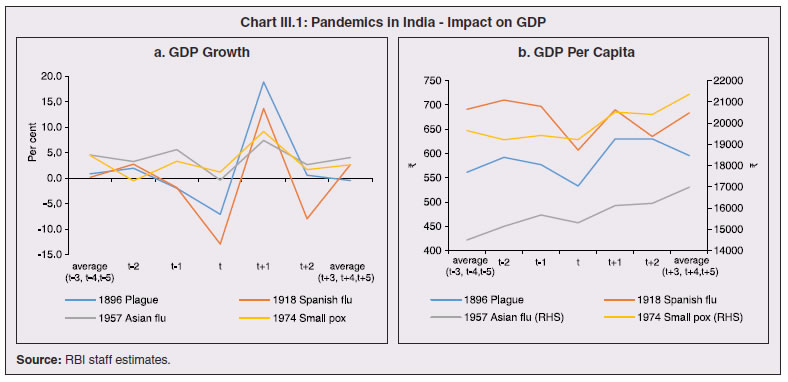 3.7 Policy responses post these pandemics have essentially focused on the provision of medical and public health services as well as offsetting the pernicious impact of pandemics on the economy, where required. Public health and infrastructure played a pivotal role in policy responses. State interventions in the form of subsidised medical treatment and drug price controls as part of the pandemic response have been documented. Economic resuscitations post pandemics have, in general, relied upon large scale fiscal stimuli, viz., temporary tax reliefs and subsidies for affected industries, loan guarantees, reduction in administrative fees, lower taxes for tourism-related sectors and measures to revive small and medium-sized businesses (Brito, 2020). 3.8 The first COVID-19 infection was confirmed in Kerala on January 30, 2020. By March 24, on the eve of the first nationwide lockdown, it had spread to 15 states and union territories5 (UTs) with 567 infections. As of October 12, 2020, all states and UTs (except Lakshadweep) were affected, with 71.2 lakh confirmed infections of which Maharashtra, Andhra Pradesh, Karnataka and Tamil Nadu accounted for 51.2 per cent, followed by Uttar Pradesh, West Bengal, Delhi, and Kerala (18.7 per cent). The silver lining has been that the rate of spread of the contagion, measured by the doubling rate6, increased from 5.0 days on March 31, 2020 to 68.4 days on October 12, 2020 (Chart III.2). 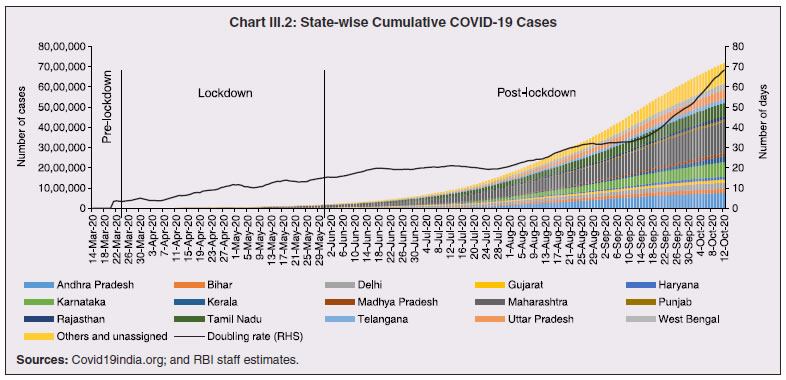 3.9 From the peak of 97.9 thousand cases on September 16, 2020, signs have begun to emerge that the COVID-19 curve has started to flatten, with a decline in the number of new cases in the four successive weeks up to October 12, 2020, though the total number of new cases still remains at a high level. In terms of spatial distribution, Maharashtra has accounted for the highest share in new cases throughout the pandemic. In the recent period, however, new cases are on the rise in Kerala, Delhi, Madhya Pradesh, West Bengal, Rajasthan, Odisha and Chhattisgarh (Chart III.3). This could potentially be a second wave of the pandemic spreading deeper into lower tier cities/towns. At the same time, the decline in new cases in Maharashtra, Andhra Pradesh, Karnataka and Tamil Nadu suggests that these states are past the peak of the first wave of infections. 3.10 The cumulative case fatality rate (CFR)7 for closed cases (deceased and recovered) was at a lower level across all states on September 30, 2020 than on May 31, 2020. Also, most states have registered a decline in the CFR measured for all cases (Chart III.4 a and b). This divergence is explained by an improvement in the ratio of recovered cases to total cases. This points to improvements in clinical management and better therapeutic practices (Box III.1). 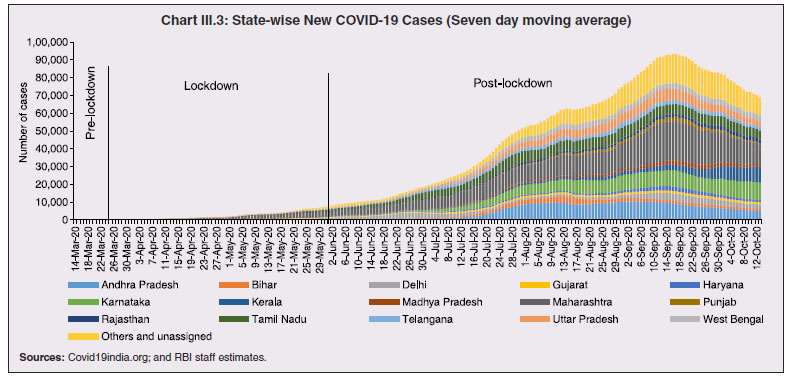 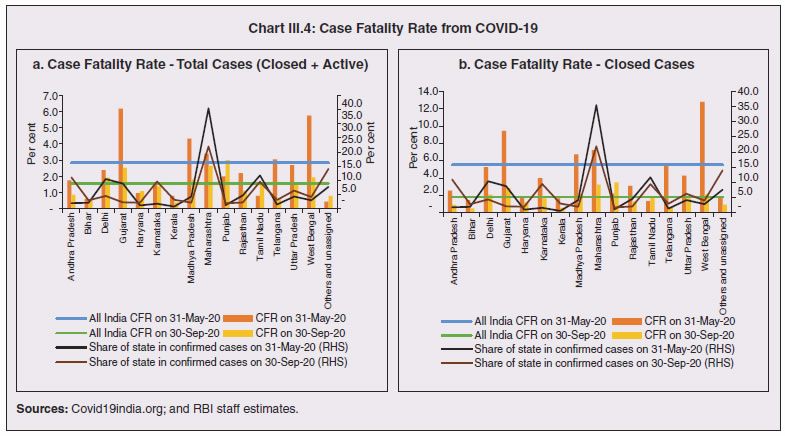
3.11 Nevertheless, the impact of COVID-19 has been asymmetric across states, both in terms of spread and mortality (Chart III.5), suggesting scope for improvement in the quality and availability of healthcare resources. 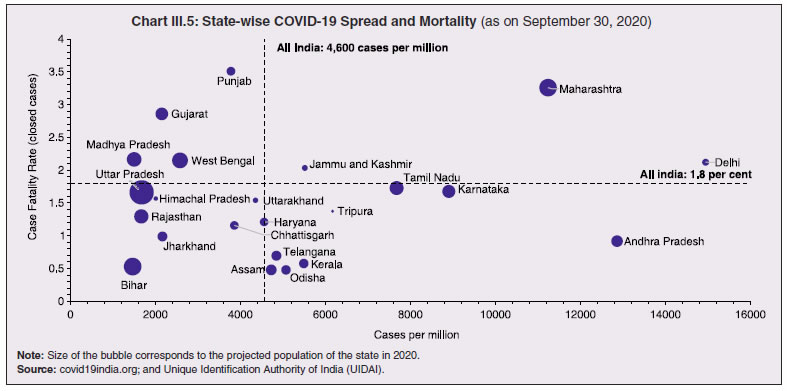 3. Demographics and Epidemiology 3.12 Demography played a key role in defining vulnerability to COVID-19 and hence in the healthcare needs of the population. Though a communicable disease, COVID-19 has shown properties similar to non-communicable diseases, with a higher mortality risk among older people and those with chronic degenerative conditions such as hypertension, diabetes, cardiovascular disease, chronic respiratory disease and cancer (United States Centre for Disease Control, 2020). 3.13 The demographic profile of a country/state is inherently linked to the sustainability of its fiscal policy and the profile of public expenditure – the young and old age cohorts are net beneficiaries of public expenditure on education, health and pensions, while people in the working age cohorts are net donors to the exchequer with lower benefits (National Transfer Accounts, 2004; Lee et al., 2016; Mohan, 2004; GoI, 2019a). 3.14 India is in the late expanding stage of demographic transition since the 1990s, characterized by a sharp decline in the crude birth rate (CBR), while the decline in the crude death rate (CDR) has tapered off (Annex III.1 and Chart III.6 a). Alongside, child mortality declined sharply between 1950 and 2000 and at a slower rate since then. While the increase in life expectancy has moderated (Chart III.6 b), it has not yet translated into a rapidly ageing population (Chart III.6 c). India fares better than the world average in both the share and the growth of population in the 60+ age cohort, signifying lower vulnerability to COVID-19 (Chart III.6 d). 3.15 Demographic transition at the state level shows significant heterogeneity, and barring a few exceptions, a strong correlation with GSDP per capita of the state. Among the richer states, Gujarat and Haryana have lagged in the transition process across the vital rates and have populations considerably younger for their income levels. Delhi is the other exception among the leading states, where the population skews younger despite its vital rates, due to the influx of younger internal migrants. Kerala, Tamil Nadu and Himachal Pradesh have a significantly higher proportion of population in the 60+ age cohort compared to the national average. This could potentially impact their ability to keep their economies open, as recurrent outbreaks will require them to impose strict isolation policies to protect their vulnerable population. In contrast, the low income states of Bihar, Uttar Pradesh and Jharkhand have a very low share of their population in the 60+ age cohort, making them less vulnerable to pandemics (Table III.2).   3.16 Epidemiological transition in India has moved in tandem with demographic transition, with a shift in the mortality and disease burden from communicable, maternal, neonatal, and nutritional diseases (CMNNDs) to non-communicable diseases (NCDs). The decline in the mortality rate by 25.4 per cent between 1990 and 2017 was driven by the decrease in CMNNDs (- 61.3 per cent), partially offset by an increase in NCDs (19.4 per cent). The share of CMNNDs in overall mortality has almost halved, with an across-the-board decline for all age cohorts (Chart III.7 a and b). The decline in disease burden is even sharper, as measured through the Disability Adjusted Life Years (DALYs) metric, primarily because the increase in DALYs from NCDs is only marginal (Chart III.7 c and d), which augurs favourably for vulnerability of the population to COVID-19.  3.17 State-level mortality and disease burden show a significant compositional variation between CMNNDs and NCDs, with an overall negative correlation across states (Chart III.8 a and c). Corrected for age disparities, however, there is a positive correlation between mortality and disease burden from NCDs and CMNNDs. Kerala, Goa, Jammu and Kashmir and Punjab stand out as states with the lowest age-standardised mortality and morbidity, while Chhattisgarh, Assam, Madhya Pradesh and Uttar Pradesh are characterised by the dual burden of disease with high mortality and morbidity from both CMNNDs and NCDs (Chart III.8 b and d). 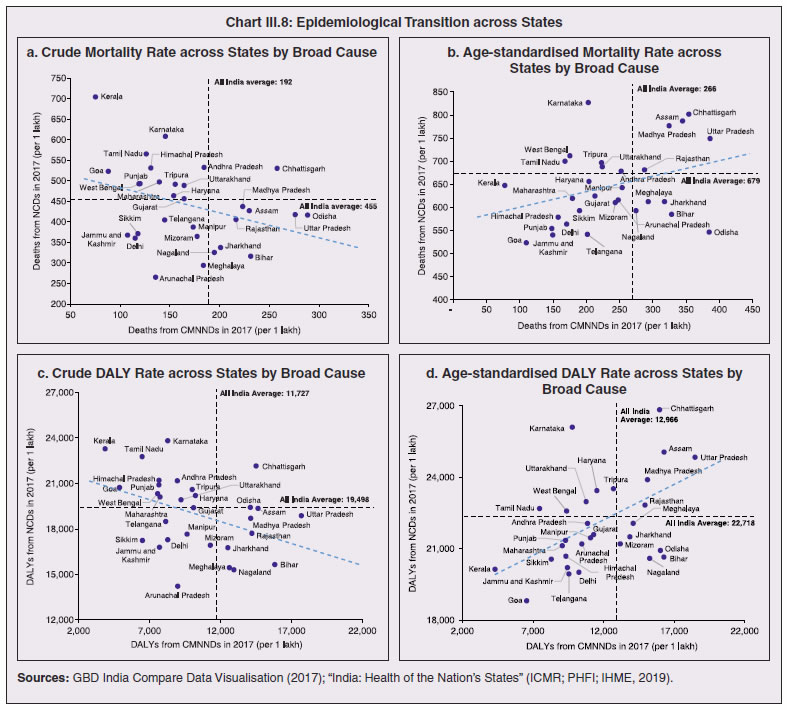 3.18 Thus, both from a demographic and epidemiological perspective, India fares better than the global average in terms of vulnerability to COVID-19. However, significant differences exist between states, with high income states more advanced in the ageing process and with a higher disease burden from non-communicable diseases than their poorer counterparts. A similar pattern is seen in the incidence of co-morbidity conditions that have been linked to higher mortality risk from COVID-19 infections (Table III.3). 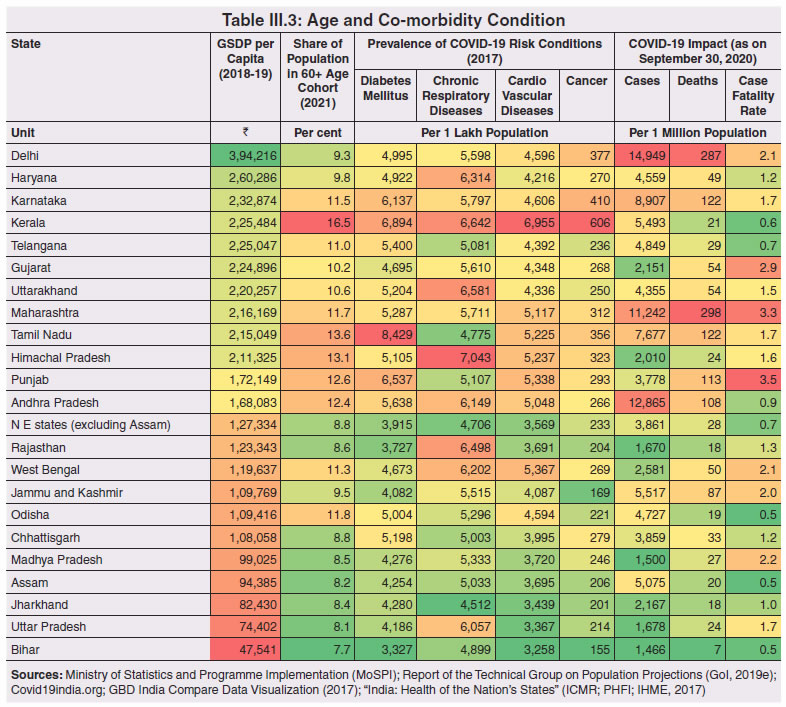 3.19 For all the states taken together, the share of developmental expenditure on education has declined between 2000-01 and 2020-21, in line with the decline in the share of the young in the population (Chart III.9 a). Conversely, the share of social security and welfare in developmental expenditure has increased faster than the share of the elderly in the population, while that on health and family welfare has stagnated, with implications on their preparedness to deal with COVID-19 outbreak (Chart III.9 b). State-wise analysis shows no correlation between education expenditure and the share of the young in the population, probably reflecting the growing role of private education. On the other hand, pension expenditure positively correlates with the share of elderly in populations across states (Chart III.9 c and d). 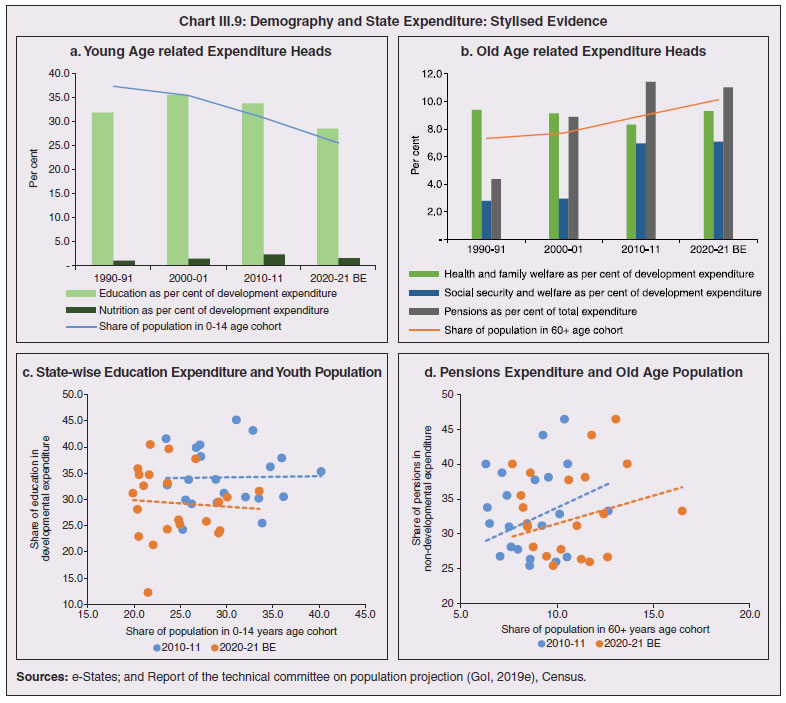 3.20 States need to prepare for demographic changes as their populations age. Historical data shows an increase in social security and welfare expenditure and a decrease in education expenditure shares. Over the last decade, however, backed by pension reforms viz., states joining the national pension system (NPS) that moved them from defined benefits to defined contributions, the increase in share of pensions in total expenditure has been arrested. The share of expenditure on health and family welfare has stagnated, even though the share of the old age population has increased. All these have implications on health system preparedness and interventions in response to pandemics. 4. Healthcare and Fiscal Implications for States 3.21 COVID-19 has set off considerable debate on the importance of health while framing long-term policies for public transport, urban development, workforce mobility and migration – areas in which it has traditionally been at the periphery. Much will depend on the shape of the post-COVID-19 “new normal”. Illustratively, the usage of the blunt instrument of lockdown, which has a significant impact on economic activity, is essentially governed by considerations on the adequacy/inadequacy of healthcare resources to manage the peak case load. Going forward, investing in healthcare is both prudent and urgent. 3.22 In the Indian federal structure, although the centre and states’ share differentiated responsibilities in management of the healthcare system, the states’ role is larger. The seventh schedule of the Indian constitution puts public health and sanitation; hospitals and dispensaries under entry 6 of the states list. Furthermore, law and order (entry 1 and entry 2 of the states list) and local government (entry 5 of the states list) also puts the onus of containment on the states10. The centre has specific responsibilities in the management of disease outbreaks under the Epidemic Diseases Act, 1897 and the Disaster Management Act, 2005, which can and were invoked in the current crisis. Also, successive central governments have undertaken various Centrally Sponsored Schemes (CSS) in public health and sanitation (subjects in the states list), which are routed through the treasuries of state governments and are contributory in nature11. From the perspective of management of the COVID-19 health crisis, while significant aspects of healthcare, particularly in health research (including testing and development of therapeutics and vaccines) and international collaboration, are in the primary domain of the central government, state governments will have to take on the mantle of leadership in healthcare delivery. This pandemic presents an opportunity for states to bring about structural changes to improve the quality, accessibility, and affordability of healthcare. 3.23 As per the National Health Accounts Estimates of 2016-1712 (GoI, 2019d), a major part of the current expenditure on healthcare is incurred on delivery of inpatient and outpatient care (52.4 per cent). Pharmaceuticals and other medical goods (principally prescribed medicines) is the other large expenditure category. This expenditure is largely cornered by private sector healthcare providers and is financed predominantly by households from their own pockets (63.2 per cent); the government’s contribution is significant and mostly non-insurance based (Chart III.10 a). 3.24 On an international comparison, India’s current health expenditure, both in terms of its level and financing structure, is broadly similar to that of South Asian Association for Regional Cooperation (SAARC) and Association of Southeast Asian Nations (ASEAN) countries, except in the case of Sri Lanka, Thailand and Viet Nam where the share of government in financing is higher. Among the BRICS countries, healthcare expenditure of Brazil and South Africa is at a significantly higher level than India, financed through government expenditure and private insurance. Healthcare expenditure in China and Russia is moderately higher than in India; significantly, a higher share of government expenditure in these countries is through the insurance route (compulsory contributory health insurance schemes). Among the developed regions of the world – east Asia; north America; and western Europe – current healthcare expenditure is at a significantly higher level, with a higher share of government financing (except in Germany and the Republic of Korea). The share of out-of-pocket expenditure by households on healthcare is low in these countries, while the financing is largely based on a mix of government schemes and compulsory contributory health insurance schemes, with no clear winner between the two on a cross-country comparison (Chart III.10 b). 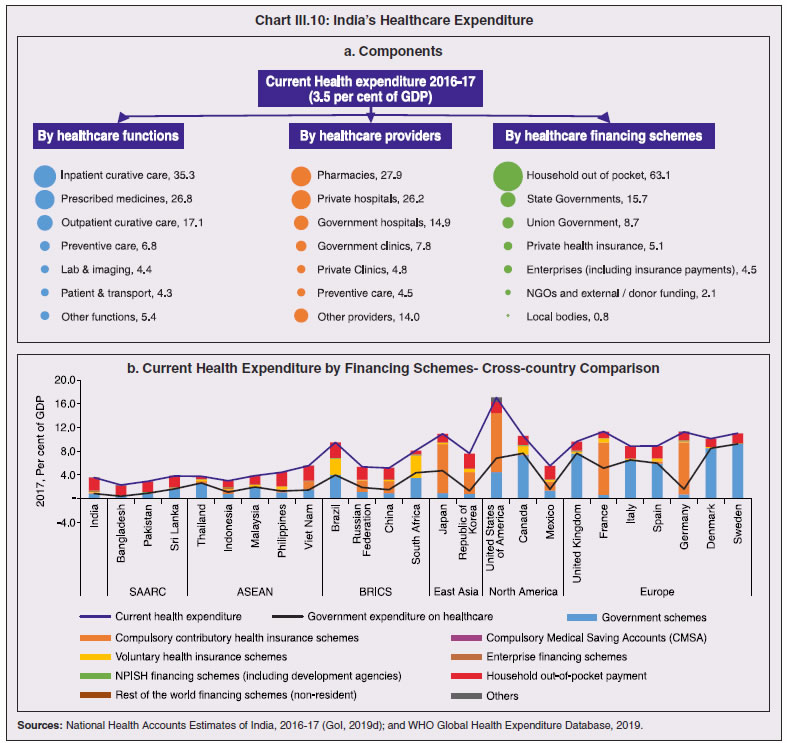 3.25 Turning to per capita healthcare expenditure (Chart III.11a13), states in the top right corner of the matrix (shaded red) perform poorly on healthcare spending which is funded by a high out of pocket component share, suggesting that they have the lowest government spending on healthcare on a per capita basis. Conversely, states in the bottom left corner (shaded green) are the best performing on both these metrics, highlighting the key role played by government finance in healthcare of these states. Kerala is the exception, with significantly higher healthcare spending per capita than all other states, driven by higher than average government spending as well as out of pocket spending, which has borne dividend in the handling of the Nipah outbreak as well as in keeping mortality from COVID-19 relatively low despite unfavourable demographics. In terms of the share of private hospitals in hospitalised cases and its affordability (Chart III.11b), states in the top right corner of the matrix (shaded red) have a higher reliance on private hospitals and at the same time, the cost of hospitalisation in these facilities (relative to their GSDP per capita) is higher than the all India average. At the other end of the spectrum are states in the bottom left corner (shaded green) where the reliance on private hospitals is low and they are relatively more affordable. 3.26 Thus, significant inter-state disparities exist in access to and affordability of healthcare. Himachal Pradesh acquits itself well in providing government healthcare as well as in keeping private healthcare affordable, while Uttar Pradesh, Bihar and Jharkhand will need some catching up. Individuals’ spending on healthcare is low in these states, financed largely from out of pocket, with high reliance on private facilities for hospitalisation that is prohibitively expensive and crowds out medical access to the poor. This requires urgent attention from state governments to prepare their states to meet the healthcare challenge from COVID-19 and future pandemics. 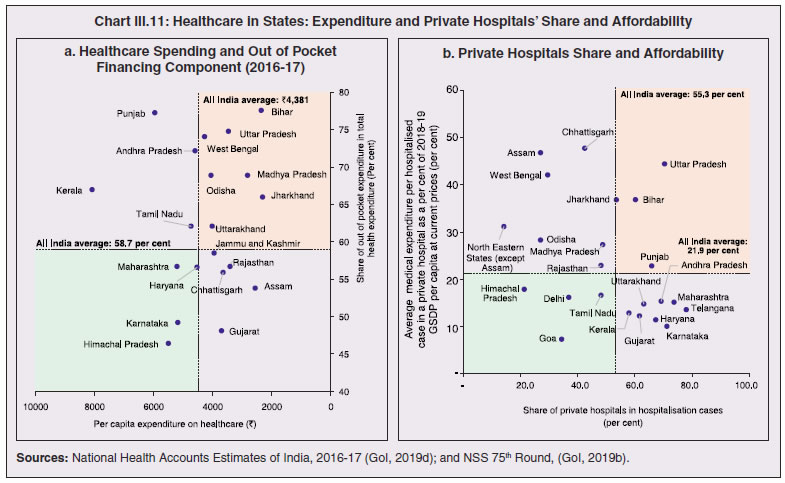 3.27 In terms of healthcare human resources, the availability of which is crucial to deal with the health fallout from COVID-19, the number of doctors per unit of population in India is broadly comparable with countries in Asia with similar demographic characteristics. However, there are significant state-level differences: Southern states (except Telangana) have significantly better coverage of medical doctors while the coverage in low-income states of Uttar Pradesh, Bihar and Jharkhand is among the lowest in the country. These states also have abysmally low number of registered nurses and midwives vis-à-vis their population size (Chart III.12). 3.28 As regards hospital infrastructure in terms of number of beds available – (a critical variable in time of COVID-19) – on a standardised measure of government hospital beds availability14 per 10,000 population, Himachal Pradesh and Delhi are best placed states while Bihar and Jharkhand lag. The pivotal role played by the private sector in hospital care is a guiding proxy variable. States that have a high share of private sector hospitalised cases as well as high availability of government beds (shaded green) appear to be best placed in terms of overall hospital infrastructure, while states that are on the lower end of both these measures (shaded red) are likely to be deficient (Chart III.13a). A crude estimate of overall availability of hospital beds across states, calculated on the assumption that the ratio of government sector (hospitals and medical colleges) hospital beds to overall hospital beds approximates the share of government in hospitalized cases in 2017 (from the NSS 75th Round) (Chart III.13 b), shows that Karnataka, Kerala and Telangana have the highest estimated number of beds per 10,000 population while Bihar, Odisha, Jharkhand, Chhattisgarh, Assam and Madhya Pradesh have the lowest number of beds. 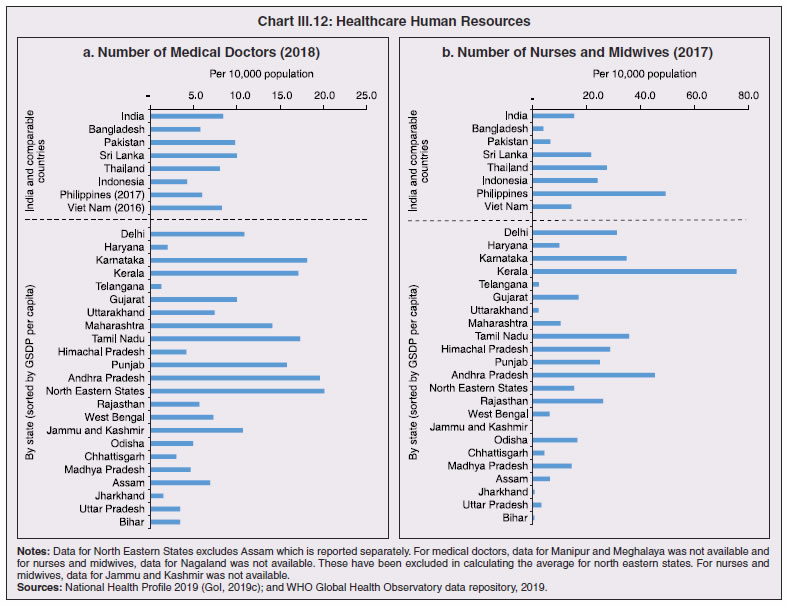 3.29 The government has a key role to play in the provision and/or financing of healthcare in India. Despite hospitalisation being prohibitively more expensive in a private than a public hospital, the former commands a predominant share, reflecting a conscious choice made by individuals, based on quality and accessibility considerations (real or perceived). At the same time, high out of pocket expenses with limited coverage of contributory and employer-based insurance raises concerns about affordability and equity in healthcare access, especially in the context of COVID-19 and the vulnerability of low-income segments of society. 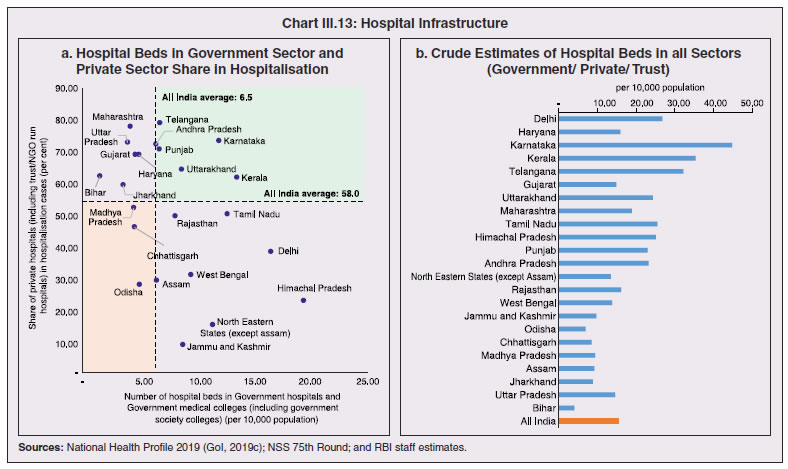 3.30 States have the overwhelming share (87.5 per cent in 2019-20) in government spending on healthcare, which is partially financed through transfers by the centre for CSS. Total healthcare spending by health ministries of the centre and states was 1.1 per cent of GDP in 2019-20 RE, up from 0.9 per cent of GDP in 2015-16 (Chart III.14 a). There is significant heterogeneity on state healthcare spending per capita across states owing to their varying revenue raising capacity (Chart III.14 b). Though funding from CSS health schemes – National Health Mission (NHM); Rashtriya Swasthya Bima Yojna (RSBY); and Pradhan Mantri Jan Arogya Yojana (PMJAY) – has played a role in correcting the imbalances in healthcare spending across states, it has not been enough to compensate for the inherent fiscal disabilities of poorer states15. 3.31 Universal access to healthcare has gained prominence in the policy agenda, both at the global and national levels. Universal Health Coverage (UHC) is a part of the sustainable development goals (SDGs) adopted by the United Nations (UN) in 2015, and further reinforced in the political declaration of the high level meeting on UHC at the UN General Assembly meeting in October 2019. Nationally, the progress towards UHC has gained significant traction with the adoption of National Health Policy in 2017 (GoI, 2017) and the launch of PMJAY in 2018. The former has set ambitious targets to increase government health expenditure to 2.5 per cent of GDP by 2025 and states’ health sector spending to 8 per cent of their budget by 2020. In the 2020-21 BE, however, only Assam and Delhi meet this target. PMJAY, also known as the Ayushman Bharat programme, was launched as the largest health assurance scheme in the world to cover 10.74 crores poor and vulnerable families (approximately 50 crore beneficiaries) that form the bottom 40 per cent of the Indian population. Also, the scheme has an infrastructure component – augmentation of which is necessary for COVID-19 health requirements going forward – and provides for viability gap funding under the PPP route for empanelled private hospitals, in addition to providing funding for establishing health and welfare centres (HWCs). 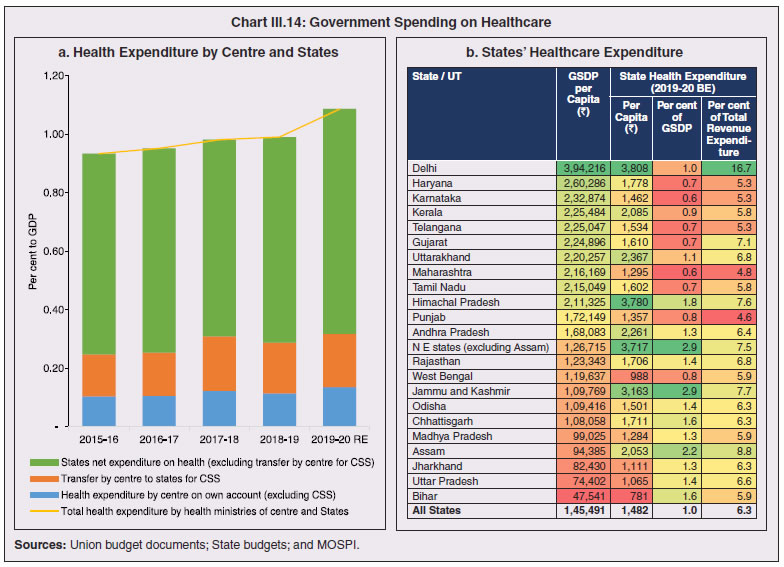 3.32 Notwithstanding the considerable progress made in recent years, the agenda for UHC remains unfinished in India and requires a step up in spending by the government, as COVID-19 demonstrated. Though a state subject, resources to augment health spending by states need to come from a mix of their own revenues and transfers from the centre for a balanced fiscal outcome. Transfers also have the additional advantage of mitigating the fiscal disability of poorer states, thus ensuring a minimum acceptable level of healthcare across the country. 5. Reverse Migration, Employment and MSMEs 3.33 COVID-19 led to large migrations during 2020, establishing a link with epidemiology. The nation-wide lockdown imposed job losses, prompting migrant labourers to return from cities to native places. The resulting transmission of the virus to rural areas added to transitory rural unemployment, besides causing labour shortages in urban areas (Singh et al., 2020). 3.34 A sizeable fraction of India’s workforce currently consists of inter-state migrants, mainly labourers. Inter-state, intra-state, inter-district and intra-district migrants (including migrant labourers) increased from 309.3 million in 2001 to 449.9 million in 2011, of which inter-state migrants (including migrant labourers) increased from 41.1 million in 2001 to 54.2 million in 2011 (Census, 2011). Since 2011, the inter-state migration has been reported to have grown annually by around 9 million up to 2016 (GoI, 2018), though reliable point estimates are unavailable in the absence of a robust data collection system. Over the decades, Uttar Pradesh (UP) and Bihar have been the major out-migration states, followed closely by Rajasthan and Odisha. The major in-migration states are Maharashtra, Delhi, Gujarat and West Bengal16 (Chart III.15). COVID-19 switched the sources and destinations of migrant labourers (Chart III.15). 3.35 In the reverse migration experienced during the pandemic, push factors, viz., high costs of living in urban areas; no earnings; loss of employment; uncertainty about the lifting of the lockdown; limited access to social and unemployment benefits, coupled with pull factors, viz., rabi crop harvesting; seeking other employment opportunities such as Mahatma Gandhi National Rural Employment Guarantee Act (MGNREGA); joining their family members in the native place; and the notion of feeling more safe and secure were the major drivers, in sharp contrast to the conventional push/pull factors (Todaro, 1969; Lee, 1966). 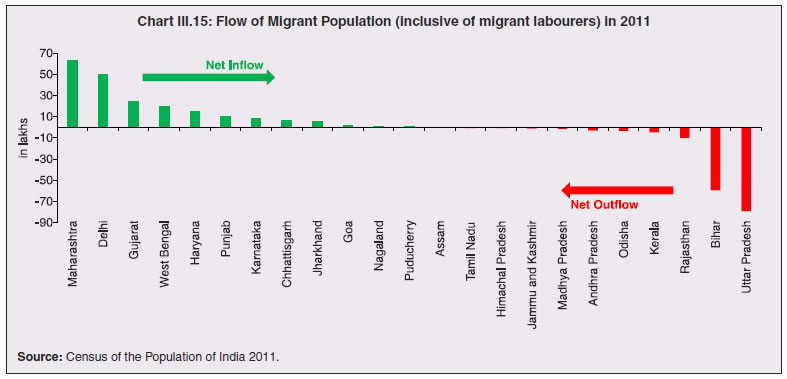 3.36 Several other Asian, European and Latin American countries also faced similar problems, but the size of the migrant workforce and nature of agglomeration was significantly lower than in India. The number of inter-state migrants in India moving back is estimated to be about 40 million17. The dire consequences for employment is reflected through the work demanded and generated under MGNREGA across states, which has been the highest in the past few years, especially in the months of May and June, 2020 (Chart III.16)18. 3.37 Almost 2.7 billion workers worldwide, accounting for four-fifths of the global workforce, had to face the brunt of lockdown measures enforced to contain the pandemic (ILO, 2020). Consequent upon reverse migration, a significant decline in employment was witnessed in India, particularly in sectors where a higher fraction of the workforce was not able to work remotely as in construction – (73 per cent of total rural female workers and 67 per cent of total urban female workers are migrant workers19) – and manufacturing sectors (59 per cent of total rural female workers and 51 per cent of total urban female workers) (Estupinan et al., 2020; Papanikolaou and Schmidt, 2020). Analysis of the daily data on unemployment reflects the sharp increase in unemployment during the lockdown (Chart III.17 a and b). 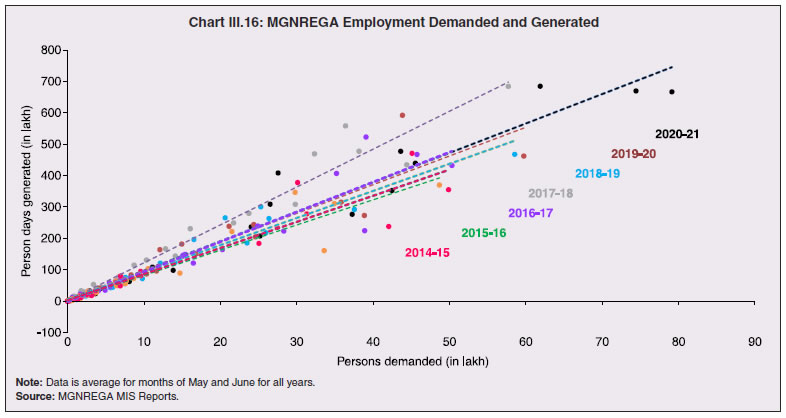 3.38 Regional differences were persistent prior to 2000s, with few signs of convergence in employment rates or participation rates across regions as per the NSS 55th round (World Bank, 2010). However, between 2009-10 and 2018-19, state-wise analysis shows that there were distinct signs of convergence across states and UTs in terms of unemployment rates (Annex Table III.2). Reverse migration might distort this convergence process. A major proportion of migrants moved back to their native states during April-June 2020 (Chart III.18). Consequently, the employment demand in these states might increase which, in turn, might render awry the regional convergence noticed during 2009-10 to 2018-19. This could lead to permanent loss of migration for future work with depressed wage growth and demand (RBI, 2020)20. 3.39 Against the backdrop of the pandemic, informal employment has drawn attention across the world, given that this segment consisting of about 2 billion workers, mostly in emerging and developing economies, seems to be impacted most by the economic fallout of the crisis (ILO, 2020). In countries with a larger share of informal labour force, the stringent lockdown measures have impacted employment to a greater extent than others (Chart III.19). In India, where almost 90 per cent of people work in the informal economy, about 40 crore workers in the informal economy are at risk of falling deeper into scarcity of finances during the crisis (ILO, 2020). In fact, the incidence of informality seems to have been stuck for decades in India, with the demand for labour and quality of labour being two major factors responsible for this persistence (Mehrotra, 2019). 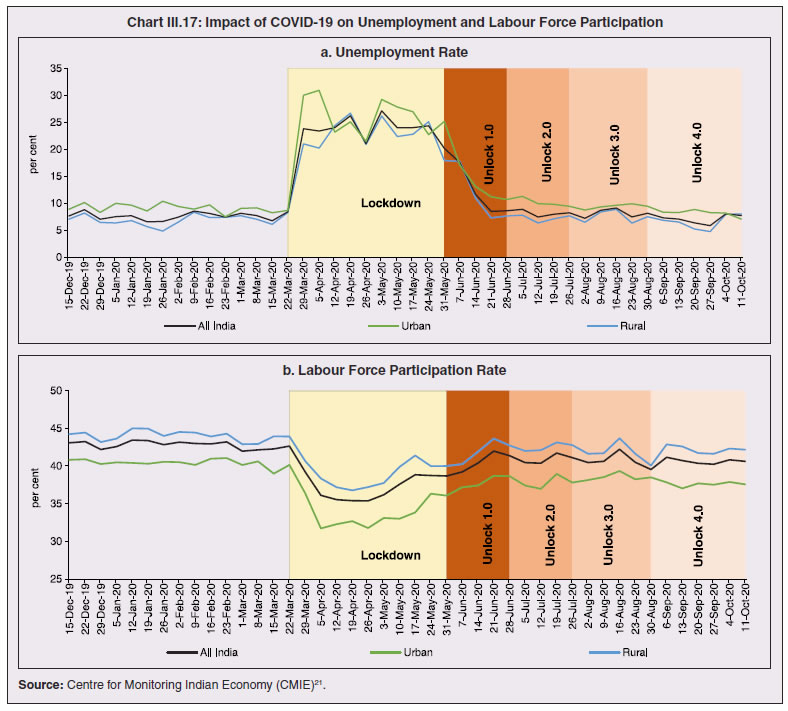 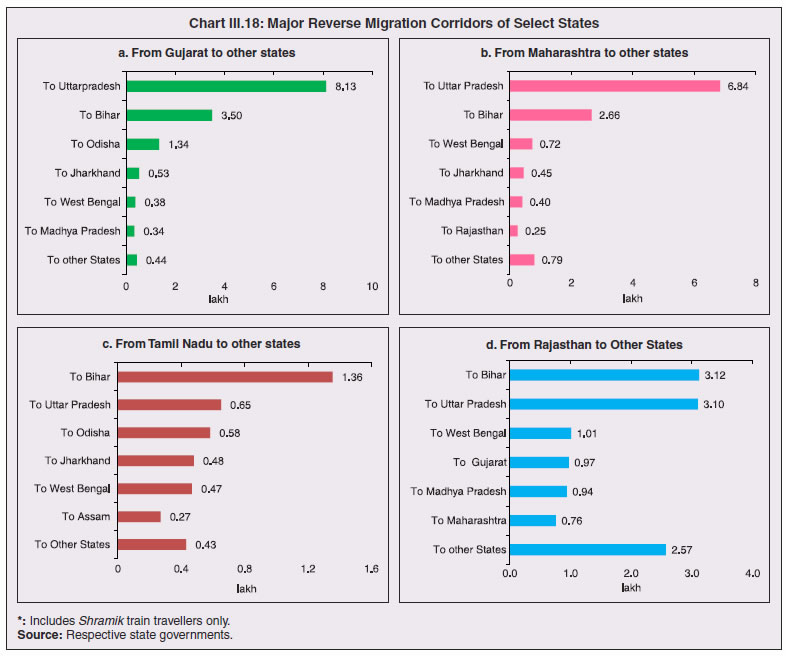 5.1 Micro Small and Medium Enterprises (MSMEs) 3.40 India’s 63.4 million MSMEs contribute significantly to the country’s economy. The sector accounts for 45 per cent of manufacturing output, more than 40 per cent of exports and employs about 120 million people. MSMEs have taken a bigger hit than other sectors, particularly because of the spatial distribution of the pandemic that is skewed towards states with a higher share of MSMEs, more so micro and small enterprises (Chart III.20). 3.41 The lockdown was a triple whammy for the MSME sector in India – supply disruption; domestic demand shock; and external demand decline (Sahoo and Ashwani, 2020). MSMEs also employ a large share of informal labourers. Consequently, the lockdown and reverse migration impacted MSME productivity, with severe implications for the states with MSME concentration (Chart III.21 a and b). State-wise data reveal that the top 11 states accounting for around 82 per cent of employment in 2019-20 also have a high incidence of COVID-19 cases and are witnessing the brunt of reverse migration (Dev and Sengupta, 2020; CRISIL, 2020). The case of Tamil Nadu is a stark example in this regard (Box III.2). 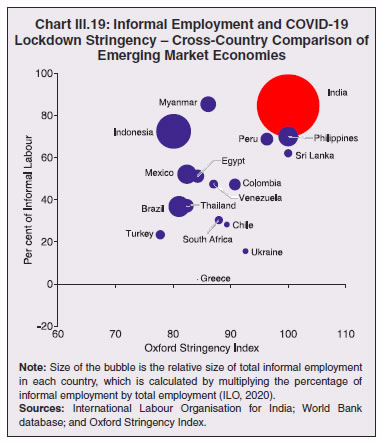 3.42 The Government of India has announced special measures for MSMEs under Aatma Nirbhar Bharat Abhiyan to enhance their capability to withstand the economic fallout of COVID-19. To begin with, a new definition of MSMEs has been announced wherein the investment limit has been revised upwards, an additional criterion of turnover is introduced and the distinction between manufacturing and service sector enterprises has been eliminated. An emergency credit line to businesses/MSMEs from banks and NBFCs up to 20 per cent of their outstanding credit as of February 29, 2020 has been proposed. The government will also facilitate the provision of ₹20,000 crore as subordinated debt to those MSMEs that are classified as stressed or with non-performing assets (NPA). A Fund of Funds, with a corpus of ₹10,000 crore, will be created for infusing ₹50,000 crore as equity into MSMEs with growth potential and viability. Moreover, global tenders will be disallowed in government procurement tenders up to ₹200 crore. While all these measures are likely to help MSMEs from the supply side, particularly in increasing their business, their effectiveness will depend upon the revival of demand and improvement in orders post-lock down (Ghosh, 2020; Purohit, 2020). 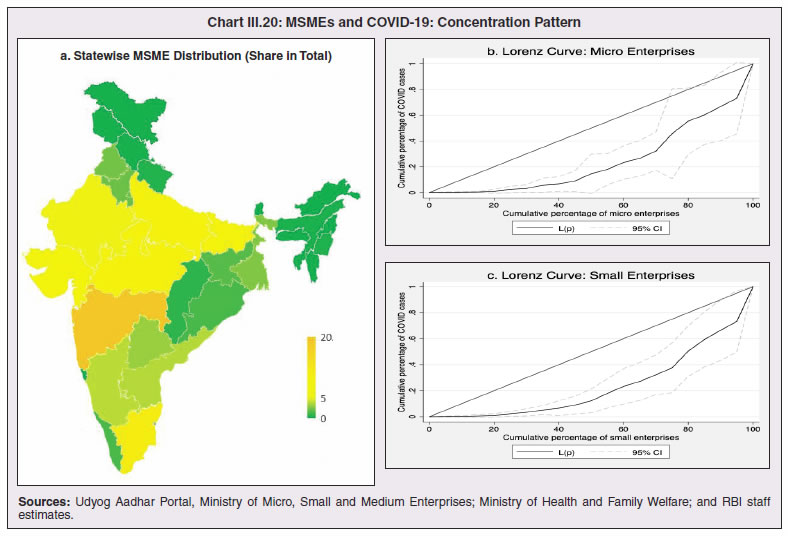 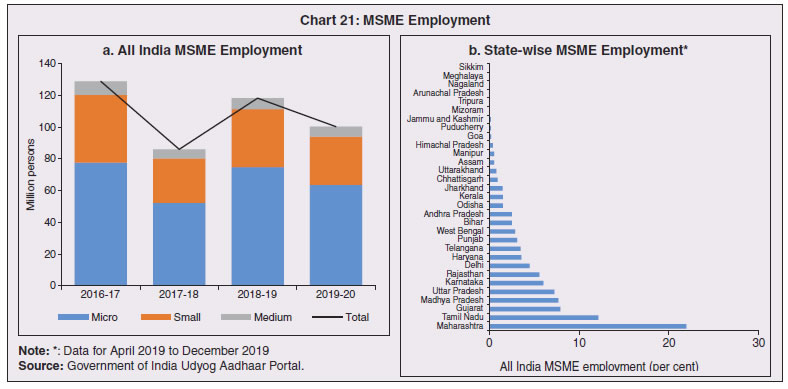
3.43 Consequent upon COVID-19 related reverse migration, many states went ahead with alteration in their labour laws (Annex III.3). Some of them seek to address reverse migration and the resultant labour shortage by enhancing work hours and some have also experimented with relaxing/suspending labour laws to enhance flexibility for relocations of global value chains (GVCs). On May 14, 2020, the centre announced a few measures as part of the Aatma Nirbhar Bharat Abhiyan Programme to streamline the labour codes in the country for the benefit of workers. 3.44 Digital technologies offer immense scope to mobilise resources and for provision of public goods and services, especially during pandemics. Digitalising government-to-person (G2P) transfers carry positive externalities that include increased transparency, better identification and targeting, reduced leakages, more convenient and faster transfer of funds, safer transactions with lower transaction costs and privacy of payments besides furthering financial inclusion (World Bank, 2014; Klapper and Singer, 2017; Mishra and Dey, 2020). To the degree G2P digital payments replace cash, there is improvement in tax compliance and shrinking of the shadow economy (Gupta et al., 2017). India’s track record of adoption of digital technology is reflected in IMD’s World Digital Competitiveness Ranking, 2020 in which it ranks 19th in a list of countries with population of 20 million or more, well ahead of most emerging market peers (Chart III.22). 6.1 Digital Preparedness of States 3.45 The Direct Benefit Transfer (DBT) system, launched by the union government in January 2013, was developed to transfer subsidies/benefits directly to Aadhaar linked bank accounts of the identified beneficiaries. Subsequently, state governments were nudged by the centre to move their welfare schemes to the Aadhaar-based DBT platform, which ensures timely transfer of benefits directly to the beneficiaries without any need of paperwork and curbs leakages by linking the Aadhaar numbers to the beneficiaries. The success of DBT depends, inter alia, on Aadhaar saturation27, availability of banking services and high-speed internet as these are instrumental in minimising inclusion and exclusion errors. More populous states like Bihar, Uttar Pradesh, Rajasthan and Madhya Pradesh lag behind the national average in terms of both Aadhaar saturation and availability of banking services (Chart III.23a). While there are small variations in average internet download speed, overall teledensity28 still varies widely amongst states, with Bihar, Uttar Pradesh, Madhya Pradesh, Assam lagging significantly, reporting a teledensity below 70 (Chart III.23b). 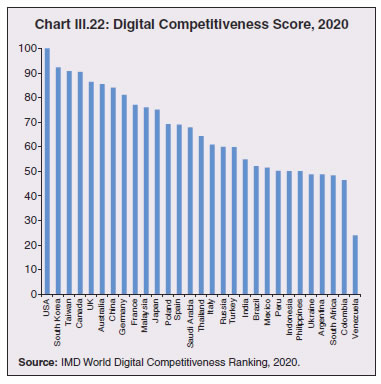 3.46 The ability of state governments to mitigate the effects of the pandemic crucially depends on their capacity to harness digital technologies. States have been assigned DBT scores, in the spirit of competitive federalism, based on their performance in 2019 on parameters like Aadhaar saturation, data reporting, savings-expenditure ratio and DBT per capita. Haryana tops this list, with an overall score of 88.8 as against the national average of 56.1 (Chart III.24a). In COVID-19 times, owing to social distancing norms, scaling up public work programmes became challenging, and consequently digital financial transfers have emerged as the most viable public intervention throughout the world. In India, several state governments have adopted large-scale, technology-enabled, real-time financial support through the DBT platform in order to provide immediate relief to vulnerable sections of the population like small farmers, migrant labour, women and senior citizens. Of the states and UTs for which data are available for 2020-21, Goa leads with a per capita DBT of ₹4,705 (Chart III.24b). Several digital strategies have also been adopted by states in the COVID-19 period for information dissemination, effective surveillance and citizen services, which aim to improve the quality of public services as well as spur innovation by unlocking the power of government data (Annex III.4). 3.47 Public financial management (PFM) systems can also leverage digital solutions for efficient and transparent implementation of government programmes in the COVID-19 and post COVID-19 period. In this regard, the Reserve Bank as a banker to state governments is leveraging its Core Banking System i.e., e-Kuber to augment states’ capacity for digitalisation. To achieve complete automation of process flow, the centralised treasury systems of states are being securely integrated with e-Kuber and a standardised e-payments/receipts model is being implemented. This results in a complete straight through processing (STP) of electronic payments of state governments, allowing them to make just-in-time payments and to have better control over their funds position. By end-April 2020, 16 states are integrated with e-Kuber for e-receipts and 19 states for e-payments. 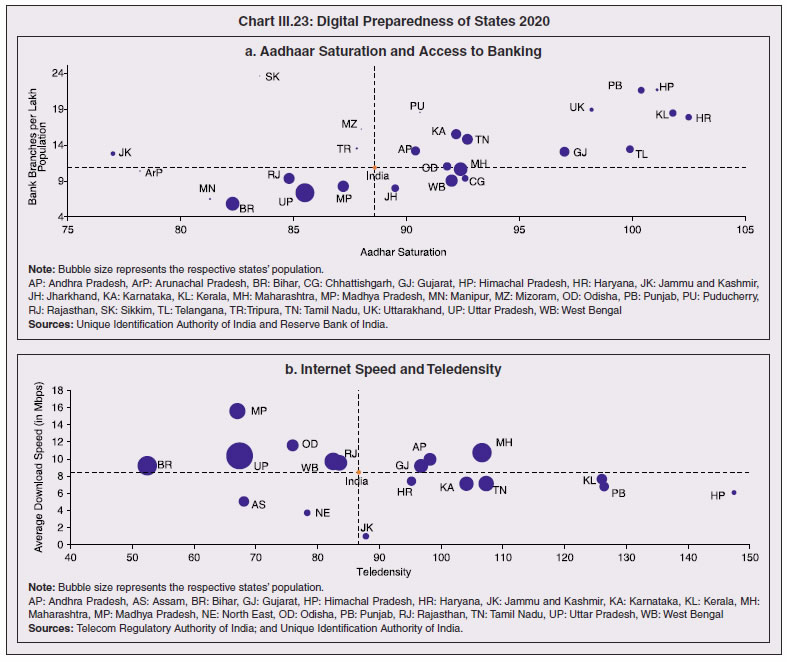 6.2 Digital Retail Transactions 3.48 Along with the government sector, other economic entities have also been rapidly adopting digitalisation as an enabling tool in their operations. India has been one of the fastest growing market for digital transactions, with a rich variety of digital payment options. During the five-year period 2014-19, digital transactions per capita per annum increased from 2.4 in 2014-15 to 22.4 in 2018-19 (RBI, 2019b). During 2019-20, the first eleven months witnessed a year-on-year (y-o-y) growth in volume of digital transactions in excess of 45 per cent (Chart III.25). This trend snapped in March 2020 when the COVID-19 pandemic and the associated containment measures brought economic activity to a near standstill. However, as the lockdown was gradually rolled back, digital transactions got a boost as people avoided use of cash for the fear of virus transmission through currency notes and preferred online shopping, keeping in view social distancing norms. Thus, digital payments, which were earlier a matter of convenience, became a necessity during the pandemic. 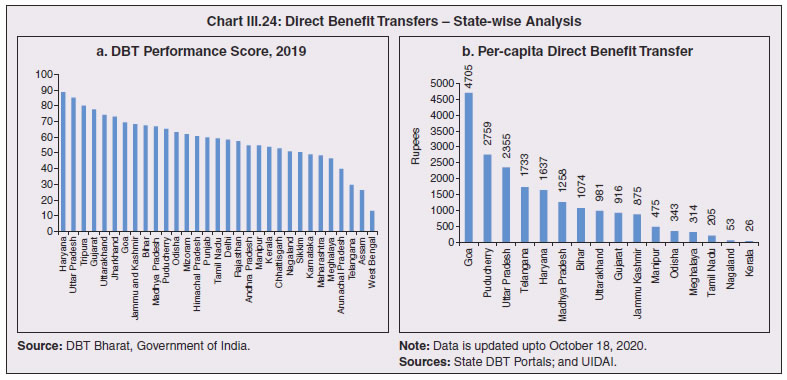 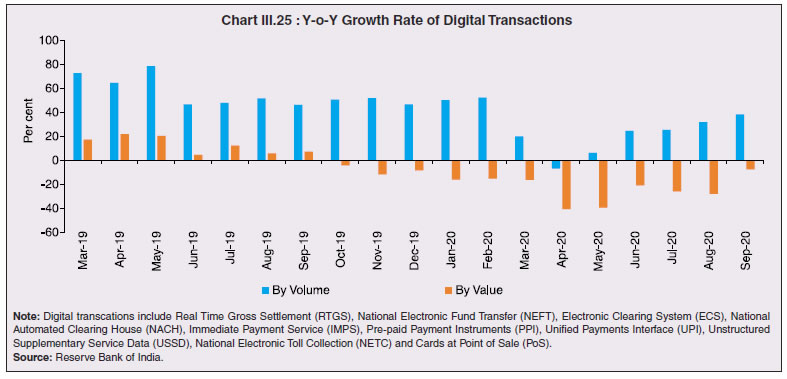 3.49 In terms of volume, digital transactions contracted in April 2020 for the first time in several months. In terms of value, digital transactions had been contracting consistently since October 2019 and during the early months of COVID-19 i.e., April-May 2020, this contraction became particularly severe. The quick rebound in volume thereafter, reflects the growing preference for digital transactions even for small value essential retail payments in an otherwise slowing economy. Economically advanced states like Maharashtra and Delhi, which account for a higher share of total digital transactions, saw a significant fall in Immediate Payment Service (IMPS) transactions volume during Q1:2020-21, as against the all-India average decline of 9.6 per cent. Unified Payment Interface (UPI) volume, on the other hand, saw a healthy rise of 57.3 per cent during the same period, with states in the north-east reporting growth in excess of 140 per cent. Except Uttar Pradesh and Haryana, all the states, including those with a decline in IMPS volume, saw a growth in UPI transactions volume (Chart III.26)29. This highlights the user preference of UPI over IMPS during the pandemic on account of its ease of usage and operability, especially for small value transactions. 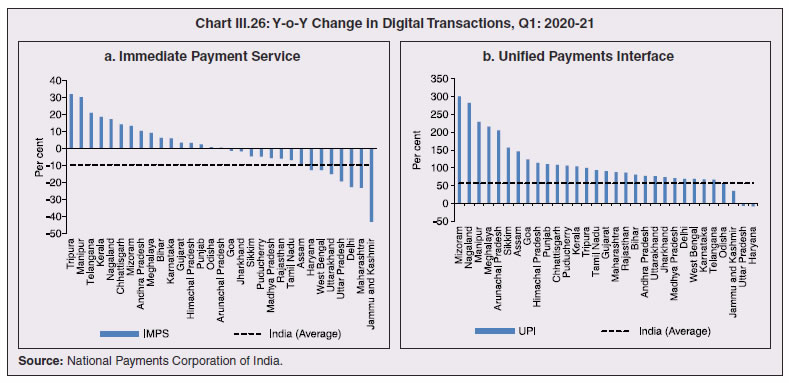 6.3 Banking Penetration 3.50 The adverse impact of the COVID-19 pandemic at the regional level is also reflected in state-wise performance of bank branches. Inter-state inequality in banking outreach, in terms of number of credit and deposit accounts, had been narrowing down since 2005 (RBI, 2019c). However, credit penetration, as measured by credit to GSDP ratio, in the hilly and less industrialised and urbanised states needs to catch up to take India’s financial penetration closer to its emerging market peers (Chart III.27). 3.51 The credit offtake from banks, which has been on a secular decline since Q4:2018-19, got further affected on account of COVID-19. Concomitantly, the C-D ratio30, which had deteriorated during 2019-20, saw a further fall in Q1:2020-21, even after incorporating seasonal factors (Chart III.28). 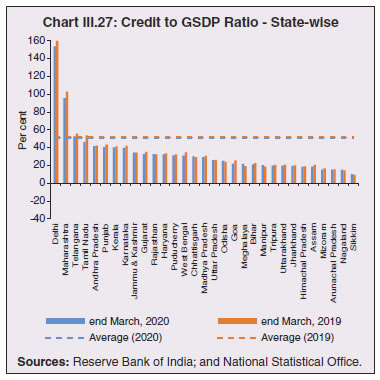 3.52 Regional variations in C-D ratio are difficult to interpret as credit provided from a region is often not used in the region. Yet, heterogeneity in this ratio can, to some extent, reflect activity levels, per capita incomes, level of banking infrastructure and effectiveness of financial intermediation by the banking system (Ghosh, 2012). Prior to the pandemic, urbanised and industrial states like Maharashtra, Andhra Pradesh, Telangana, Tamil Nadu and Delhi, which account for higher share in credit demand, had higher C-D ratios compared to the rest of India (Chart III.29a). With COVID-19 cases being largely concentrated in the urban centres in Q1:2020-21, prolonged lockdown and containment measures led to a decline of C-D ratios in urbanised states vis-à-vis the rural and hilly states, leading to an overall convergence in C-D ratio across states, albeit at a lower level than in the pre-COVID-19 period (Chart III.29b). 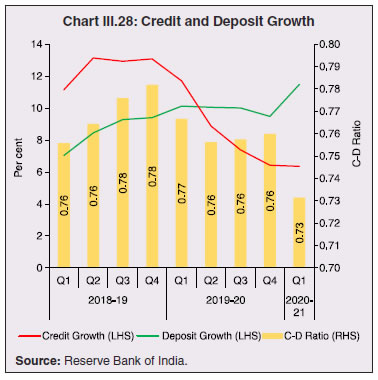 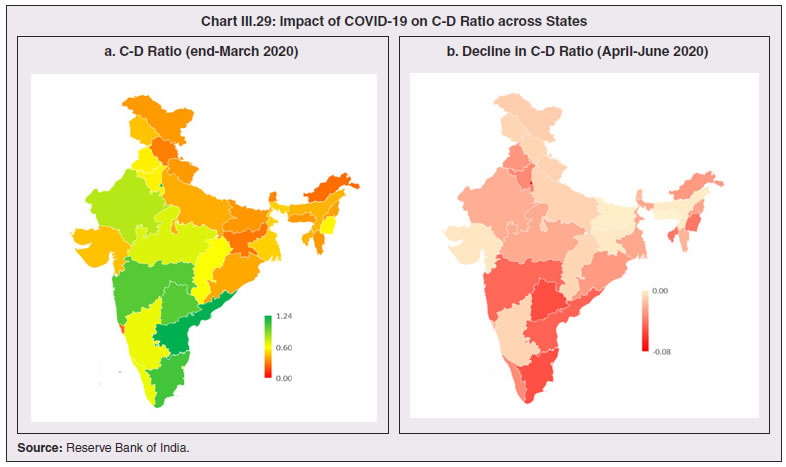 7. COVID-19 and the Role of Third Tier Government 3.53 COVID-19 has brought to the fore the need for modern, revamped and fiscally sound municipal bodies, which constitute the third tier of government. Municipal bodies in India perform a set of functions31 that are critical in a pandemic such as sanitation facilities, uninterrupted provision of basic utility services, and disinfecting public places to stop the spread of the virus. During the pandemic, various civic bodies adopted innovative approaches, which include, institution of a disinfection tunnel in Rajkot; high clearance boom sprayers in Surat; and use of drones across various cities including Raipur, Guwahati, Bengaluru and Chennai. Notwithstanding these novel initiatives by civic bodies, COVID-19 exposed their constraints in providing adequate and efficient health services. 7.1 Cross-country Comparison 3.54 An analysis of capital expenses across select advanced and emerging market economies (having a federal structure) suggests that local governments incur a relatively higher proportion of expenditure towards capital (asset) creation, except in the case of Germany. The proportion of capital expenses in total budgets of local governments is nearly double the proportion for state governments in the case of Australia, Mexico, Russia, South Africa and India. Local governments’ capex share in total expenditure is the highest in India among some of these federal states, however, as a proportion to GDP it remains the lowest at 0.3 per cent. (Chart III.30). 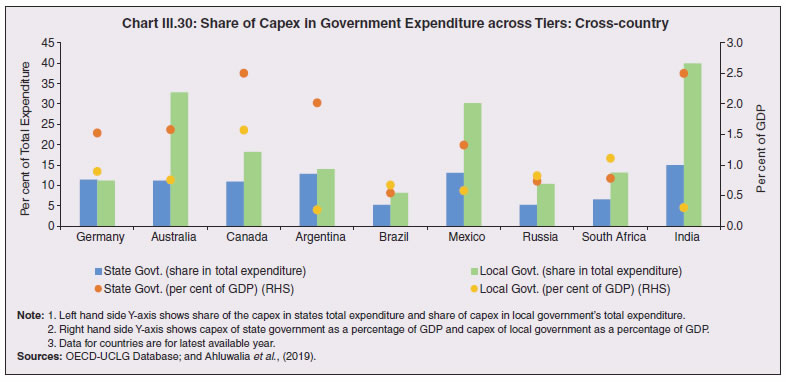 7.2 India’s Third Tier 3.55 In times of pandemics like COVID-19, strong and empowered local bodies can effectively play an intermediary role between the state and the people with policy interventions in the form of containment measures, spreading awareness and building infrastructure. Urban local bodies (ULBs) in India are, however, weak in terms of financial autonomy for raising resources. Though resource transfers to ULBs from the centre and states have increased over time, ULBs continue to face revenue constraints and their finances (revenues/expenditures) have remained stagnant at around 1 per cent of GDP for over a decade (Ahluwalia et al., 2019). Municipal tax revenues have lacked buoyancy, declining from 0.3 per cent of GDP in 2010-11 to 0.25 per cent in 2017-18. User charges levied by urban utility bodies remain low and add to budgetary constraints. While constrained revenues limit their expenditures, there also remain significant disparities in per capita expenditures and revenues of ULBs across states (Chart III.31). 3.56 ULBs depend heavily on the transfer of funds from, by and large, the state government, in the form of state grants and tax revenue sharing. The increase in share of transfers in total municipal revenues as observed from 2015-16 has, inter alia, been facilitated by the recommendations of the Finance Commissions. Specifically, the 14th Finance Commission had recommended assured transfers to the ULBs for smooth and effective delivery of mandated basic services, which were further enhanced by the 15th Finance Commission’s Interim Report for 2020-21. Per capita expenditure of the ULBs in India is found to be positively correlated with transfer of resources by the state government, with the correlation relatively stronger for capital expenditure (Chart III.32). States which have strengthened their local government institutions with substantial devolution of funds and greater autonomy over the years are observed to be managing the COVID-19 pandemic in a relatively more efficient and low-cost manner (Box III.3). 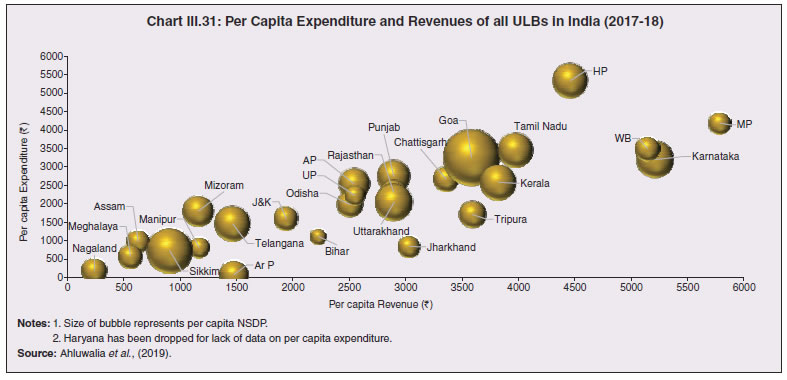 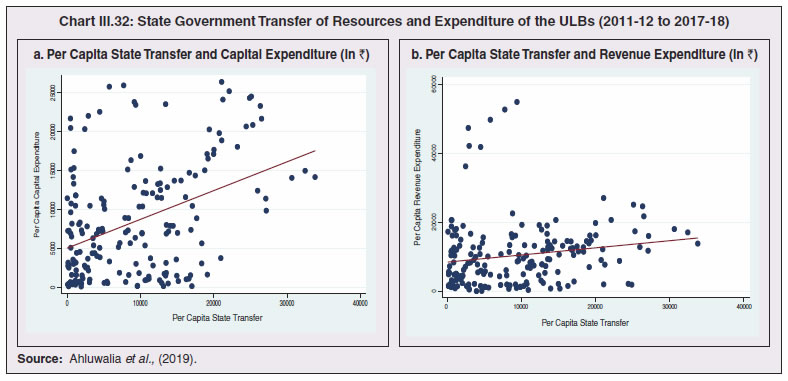
8. COVID-19 and States’ Output for 2020-21 3.57 Although the top ten COVID-19 affected states account for two-third of Indian agriculture and allied activities, the farm sector’s share in overall output is not even one-fifth for majority of states (Chart III.33). 3.58 When the pandemic broke out, India had comfortable food stocks, which further increased to 629.99 lakh metric tonne (MT) by end-September 2020, i.e., double the buffer stock norms. Some high COVID-19 incidence states had a low share in the foodgrains stock and accordingly, this necessitated steps to mitigate inter-state variations in stocks. The enhancement in area under wheat cultivation during the Rabi sowing season by 7.3 per cent in the states of Bihar, Gujarat, Jharkhand, Karnataka, Maharashtra, Rajasthan and West Bengal, helped in replenishment of food stocks (Table III.4). 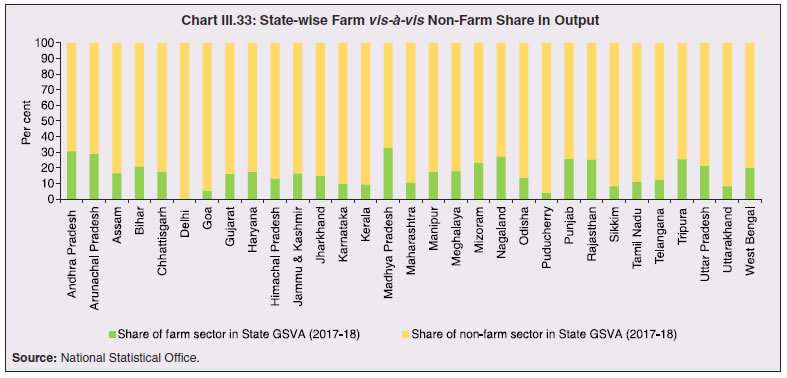 3.59 Several state-specific measures have played an important role during this lockdown period to ensure timely production, harvesting and procurement. The Punjab government allowed combine harvesters to run for 13 hours a day instead of the normal 8 hours. The Bihar government provided inter-state curfew passes to harvester drivers from Punjab and Haryana to promote the full mechanisation of the harvest of wheat. Punjab, in an effort to maintain social distancing and prevent overcrowding, issued coupons with holograms to farmers to bring their wheat crop to the mandi. Haryana launched the Bhavantar Bharpaii Yojana under which farmers are reimbursed for the difference in prices. Madhya Pradesh sent out messages to farmers directly to bring produce to the buying centre on a particular day. Uttar Pradesh conducted online sessions with mandi officials to facilitate sales, and used idle rickshaws to take the produce directly to consumers to avoid overcrowding in mandis and also to provide employment to daily wage earners. Rajasthan opened centres even at the panchayat level to arrange for procurement, sale, and purchase of wheat, mustard, and gram. Consequent upon these efforts by states, procurement operations remained broadly immune to COVID-19, with some of the highly affected states of Madhya Pradesh, Maharashtra, Tamil Nadu, Telangana, Gujarat and Punjab seeing a rise in their share in rice and wheat procurement. 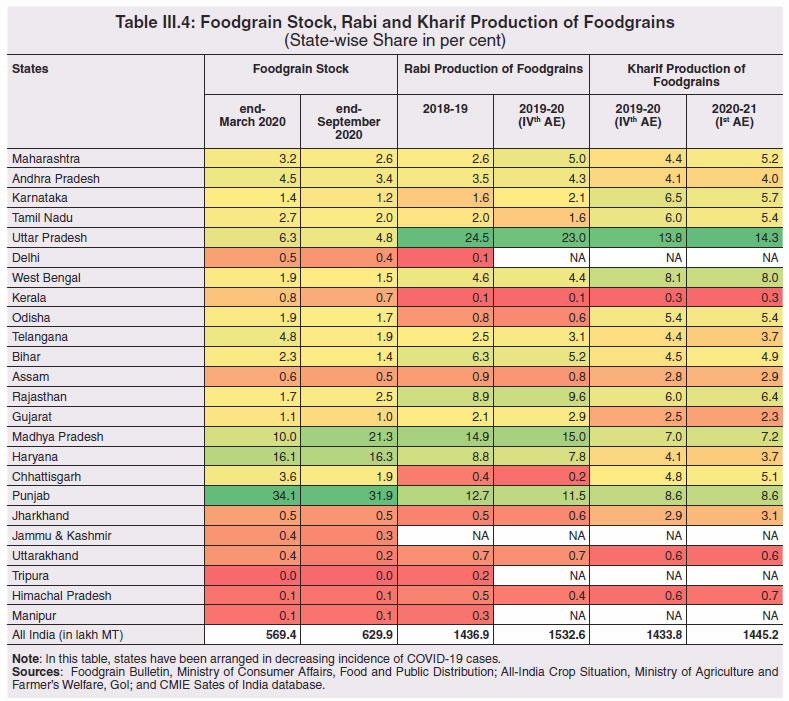 8.1 Non-Farm Activities 3.60 By contrast, non-farm activities came to a near standstill (Chart III.34). In manufacturing and services, units badly affected include transport equipment sectors; retail and wholesale trade; professional and real estate services; travel and tourism; and other services with direct contact between consumers and service providers and retailers such as cinemas and restaurants (OECD, 2020c,d). 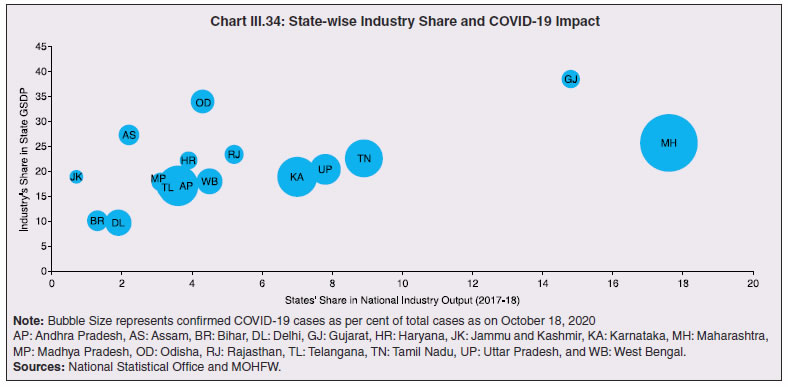 3.61 Using eight select high frequency economic activity indicators (monthly frequency), viz., vehicle registrations, air traffic, google mobility, electricity consumption, e-payments, unemployment rate, tax revenues and consumer price inflation, a composite index using Principal Component Analysis (PCA)32 technique is constructed for the select 14 states33 (Table III.5). The index reveals the severity of the pandemic’s impact on states and local authorities. Also, it shows that in states where disease control has improved between March and June 2020, signs of improvement in economic activity are visible. As the lockdown was gradually lifted, trajectories of recovery became evident in an increasing number of states in June 2020. All the states witnessed further improvement in economic activity in the month of July 2020, except Assam, Tamil Nadu and Tripura. During the month of August 2020, however, a rise in the unemployment rate and slowdown in electricity consumption in many states, coupled with surge in COVID-19 cases, especially in rural areas, brought about a slight reduction in economic activity. 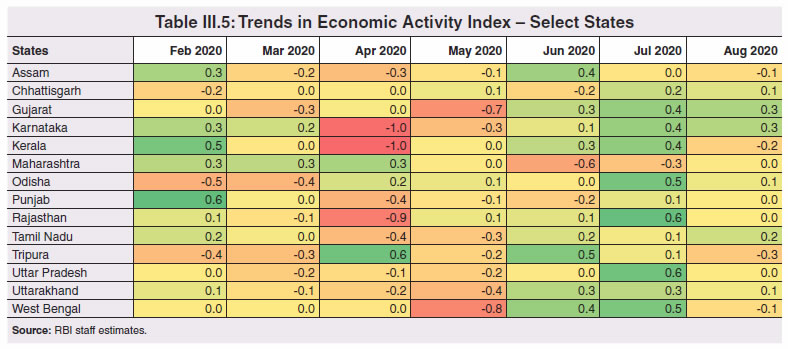 8.2 Exports and Remittances 3.62 As a consequence of the pandemic, private transfer receipts, embodying remittances from Indians working overseas, dropped by 8.7 per cent y-o-y in Q1:2020-21. India’s exports were weakened by demand and supply-side shocks and, together with the fall in remittances, per capita income levels in some states (Chart III.35). The top six states, viz., Maharashtra, Gujarat, Tamil Nadu, Uttar Pradesh, Karnataka and Andhra Pradesh, which reported around 60 per cent of total confirmed COVID-19 cases, account for nearly two-third of India’s merchandise exports. With slowdown in economic activity amid lockdown measures, exports from these states may have also become vulnerable34. Apart from the direct economic impact in the top six states, the loss of employment could be significant going forward for some of the other low-investment states like Uttar Pradesh, Bihar, West Bengal and Rajasthan, which had seen a large chunk of migration for overseas employment in recent years. 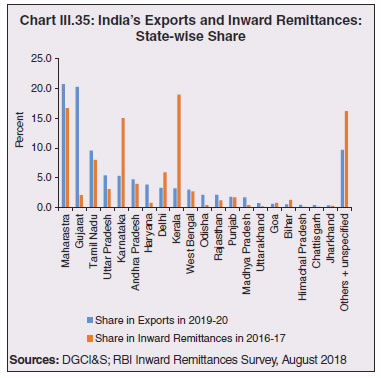 3.63 This is reflected in the drastic fall in emigration clearances (EC) obtained by recruiting agents, project exporters and under direct recruitment by foreign employers in January-September 2020 on a y-o-y basis (Table III.6). While reverse migration started in March, the government repatriated more than 18 lakh stranded Indians (both workers and tourists) safely to India under the Vande Bharat Mission (VBM) from 137 countries. Kerala received the largest number of stranded Indians, followed by Delhi, Uttar Pradesh, Tamil Nadu, Maharashtra, West Bengal, Telangana, Karnataka, Bihar and Andhra Pradesh. The largest number of Indians returning by VBM flights were from UAE, followed by Saudi Arabia, Qatar, Kuwait, Oman, and USA.
3.64 The pandemic has changed the landscape of sub-national government functioning and finance. As the public health crisis recedes, the priorities will need to shift to improving the resilience of economic, social and fiscal systems by addressing the stark vulnerabilities exposed by COVID-19. An unambiguous lesson from the varied experiences of states is the need to step up health care and related expenditure. Yet another important takeaway is boosting investment in basic digital infrastructure so as to sharpen aspects like contact-tracing, targeted public service provisioning amidst social distancing norms and sanitation compulsions. Upgrading the urban infrastructure to improve the resilience of our cities, which were severely hit during the pandemic, also assumes crucial importance. This highlights the role of local governance institutions and the importance of empowering these institutions for effective interventions at the grass-root level. 3.65 States have to be prepared better to manage migrations and reverse migrations through effective labour law reforms that bring in the flexibility to absorb migrant/informal labour productively and seamlessly. For out-migration states, it may be important to skill more people so that they get absorbed closer to home and contribute to greater regional balance. For in-migration states, gainful employment through state-specific urban schemes must go hand in hand with scaling up health infrastructure and social safety nets for migrant labour. 3.66 Even as states re-engage in restoring sustainability and quality of their finances especially in respect of capital spending, credibility considerations warrant retracing a glide path back to FRL fiscal targets within a stipulated time frame. Annex III.1: Demographic transition theory describes the stages (typically 4 to 5) in the transition from high mortality / high fertility to low mortality / low fertility for a population, commonly studied through variables such as birth rate, death rate, infant mortality rate, population growth rate, life expectancy and age composition. Typically, countries have gone through two intermediate stages in the transition from high mortality and high fertility to low mortality and low fertility. First, called early expanding stage, the crude death rate (CDR) registered a sharp fall though the crude birth rate (CBR) remains elevated, resulting in high growth of population (population explosion). The decline in CDR was driven by improvement in nutrition, and, successes in curbing the impact of pandemics through understanding diseases (germ theory) and taking societal measures, particularly in sanitation and vaccination, to safeguard against them. Reduction in mortality from communicable diseases (such as Smallpox) was the dominant factor in this decline; consequently, younger age cohorts (under 5 and under 10) saw a more perceptible decline in mortality as older cohorts had a higher likelihood of having survived these infections before and developed some form of immunity from it. In the second intermediate stage, called late expanding stage, fertility catches up to mortality as CBR registers a sharp decline, resulting in moderation in population growth rate (Chart 1). 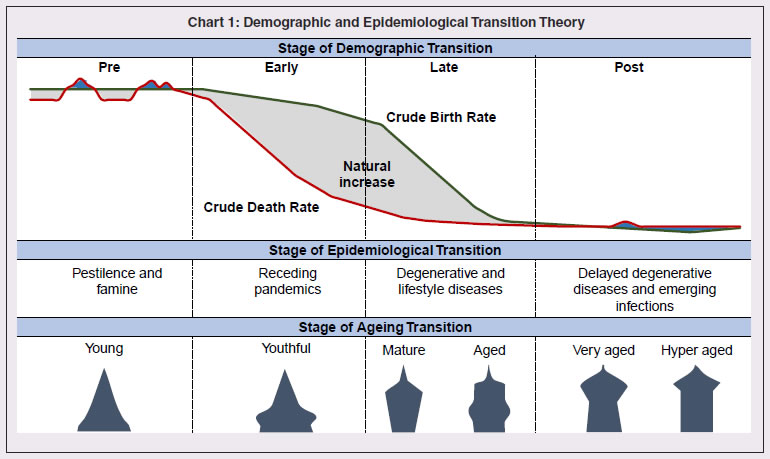 Closely linked with the demographic transition model is the epidemiological transition model, which considers the compositional change in causes of mortality, commonly studied through metrics of absolute and agestandardized mortality, and, their composition35 (Omran, 1971; McCracken et al., 2017). In recent years, with gains from life expectancy tapering, improvement in quality of healthy life and reducing burden of disease have gained importance in defining public health policy goals. Disability adjusted life years (DALYs) is a single measure that combines the burden of disease from both morbidity and mortality, by aggregating Years of life lost (YLL) due to premature death and Years lived with disability(YLD36) (WHO Global Burden of Disease (GBD) project). DALY as a measure for healthcare goals has gained wide acceptance across the world and is also recommended by India’s National Health Policy, 2017 and NITI Aayog Action Agenda, 2017–2020. Significantly, there was also a transition in the age composition of the population that accompanied demographic transition. The age structure progressively transformed from the initial shape of a triangle to a trapezoidal shape if fertility falls below replacement level and gains from life expectancy continue, as witnessed in some areas of Western Europe like Northern Italy (Chesnais, J., C., 1990). During the transition phases, initially the population tends to grow younger with a rising young age dependency ratio in early expansion stage (as decline in mortality is highest at the youngest ages). In the late expansion stage, the young age dependency ratio declines initially as fertility declines, causing an increase in share of working age population. In the later part of this stage, increased longevity results in an increase in share of elderly population and old age dependency ratio (Lee, R., 2003). References 1. Chesnais, J., C. (1990). “Demographic Transition Patterns and Their Impact on the Age Structure.” Population and Development Review. Vol. 16, No. 2 (Jun., 1990), pp. 327-336 2. Lee, R. (2003). “The Demographic Transition: Three Centuries of Fundamental Change.” Journal of Economic Perspectives—Volume 17, Number 4—Fall 2003—Pages 167–190. 3. McCracken, K., Philips, D., R. (2017). “Demographic and Epidemiological Transition.” 10.1002/9781118786352.wbieg0063. 4. Omran, A. R. (1971). “The Epidemiologic Transition: A Theory of the Epidemiology of Population Change.” The Milbank Memorial Fund Quarterly. Vol. 49, No. 4, Part 1 (Oct., 1971), pp. 509-538. 5. WHO, Global Burden of Disease (GBD) project. https://www.who.int/healthinfo/global_burden_disease/about/en/ Annex III.2: An analysis of the evolution of convergence in unemployment rates between Indian states/ UTs over recent years is attempted with the available data to understand the spatial distribution of employment conditions. Absolute or unconditional convergence is measured in levels in order to assess the catching up process across states/UTs between 2009-10 and2018-1937. Unemployment rate data are sourced from NSS 66th and 68th rounds and Periodic Labour Force Survey (PLFS) Annual Reports. In a cross-sectional ordinary least square (OLS) framework (Baumol ,1986) i.e., 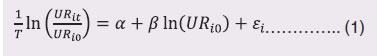 T is the time interval from 0 to t, URit is the unemployment rate of state i in the final year t and URi0 is the unemployment rate of state i at the beginning of time, α is the constant term, β is the slope coefficient that must be negative and statistically significant to confirm absolute convergence, ε is the error term, and In is natural logarithm. The results bring out evidence of beta-convergence across states (Chart 1). The negative sign of β shows that, on average, the higher the unemployment rate, the lower is the growth in unemployment. The speed of convergence, measured by half-life, indicates that the gap in unemployment rates will be reduced by 50 per cent in approximately 32 years. The regression satisfies all the residual diagnostic tests such as homoscedasticity and normality of the residuals. The model is parsimonious and the results are robust. 
Annex III.4:
1 There are 12 nations with confirmed COVID-19 cases exceeding six lakh, while there are four Indian states with confirmed cases above that number as on October 12, 2020. 2 The number of confirmed deaths from disease as a ratio of diagnosed cases. 3 See Arnold (2019) for a historic record of the Spanish flu. 4 It may be noted that apart from these pandemic years, India has also seen contraction in GDP during two more episodes in the past decade - 1965-66 and 1979-80 associated with war and oil/balance of payment crisis. 5 For state-wise numbers on COVID-19 (confirmed infections, recoveries and deaths), this report relies on datasets obtained from the crowdsourced website: https://www.covid19india.org/. 6 Doubling rate is defined as the number of days in which total cumulative confirmed infections double. It is typically estimated by using an exponential growth model in which the assumed back interval for calculating the doubling rate for a specific date is not uniform. In India, the Ministry of Health, Government of India uses seven days which has been considered in this report. 7 Traditionally, the mortality from a disease is measured as a ratio of total number of deaths and total number of cases (case fatality rate). However, in case of a new disease like COVID-19, whose epidemiology is still at an exponential growth stage, calculation of case fatality rate based on closed cases (deceased plus recovered) could be a more appropriate measure of mortality from the disease. 8 Mumbai with a population density of 20,634 people per square km, as against the all-India average of 411.48 persons per square km (UN, 2019a). 9 Dr.Tedros Adhanom, WHO chief, has acknowledged Dharavi’s success in controlling the virus spread and stated that ‘Dharavi should be seen as an example across the world’. 10 Some aspects of healthcare are in the concurrent list in which the centre and states share responsibilities, viz., Population Control and Family Planning (Entry 20 A), Legal, Medical and Other Professions (Entry 26) and Lunacy and mental deficiency, including places for the reception and treatment of lunatics and mental deficiencies (Entry 16). 11 The exclusive domain of the centre also includes institutions of national importance (e.g., Indian Council of Medical Research) and institutions for professional and technical training and research (e.g., All India Institute of Medical Sciences). 12 National health accounts describe the health expenditures and the sectoral flow of funds (government and private), derived within the framework of National Health Accounts Guidelines for India, 2016. These adhere to the System of Health Accounts 2011 (SHA 2011), a global standard developed in a collaborative effort by health accounts experts from the Organisation of Economic Co-operation and Development (OECD), World Health Organisation (WHO) and European Union (EU). 13 This analysis is based on NSS latest survey. Since the 1990s there have been four health surveys of NSO (erstwhile NSSO): those of the 52nd round (July 1995-June 1996), the 60th round (January 2004-June 2004), the 71st round (January 2014-June 2014), and the latest being the 75th round (July 2017-June 2018). The 71st and 75th round surveys were more comprehensive - done over a one year period and covering a larger sample size. 14 Hospital beds data available only for government hospitals and medical colleges. 15 Historically, the Central Sector Schemes that are fully funded by the centre included the NHM and the RSBY. The NHM, launched in 2013, with its two Sub-Missions - the National Rural Health Mission (NRHM) and the National Urban Health Mission (NUHM) – has been specially focused on both CDs and NCDs. The RSBY provide health insurance to workers in the unorganised sector. These schemes were subsequently restructured as CSS in 2015-16, with joint funding from the centre and states. 16 As per GoI (2018), the states that emerged as net inflow states by 2017-18 apart from those mentioned in this chart are Tamil Nadu, Andhra Pradesh and Assam, while those that emerged as net outflow states are Jharkhand, Haryana and Chandigarh. The trend for all other states is mostly in line with 2011 Census. 18 Data on demand for work and work generated is available 2014-15 and 2013-14, respectively. 19 Source: NSS 2007-08, Ministry of Housing and Urban Poverty Alleviation, 2017. 20 A survey of 2,917 returning migrants of six states, carried out by Inferential Survey Statistics and Research Foundation (ISSRF) in July- August, 2020 also indicates about one-third of migrants do not want to return to cities for work. 21 The unemployment rate is computed as the number of persons not employed but willing to work and actively looking for a job as a per cent of the total labour force, where the total labour force is the sum of all those who are employed and those who are not employed but are willing and looking for a job. 22 As per data from Ministry of Micro, Small and Medium Industries, Government of India on the basis of Udyog Aadhaar registration as on June 15, 2020. 23 The incentive package of the Tamil Nadu government includes 30 per cent capital subsidy, subject to a ceiling of ₹20 crore, on the investment made in eligible fixed assets, to be paid by the state government in equal instalments over a 5-year period; interest subvention of 6 per cent for two quarters (up to December 31, 2020) for working capital availed from banks/financial institutions; stamp duty waiver; and guaranteed purchase of at least 50 per cent of the medical equipment/drugs produced at a negotiated price (GoTN, 2020b). 24 The survey was conducted by the Department of Economic and Policy Research, Reserve Bank of India, Chennai. 25 According to data from Ministry of Finance, Government of India. 27 Aadhaar saturation is defined as the ratio of number of live Aadhaars assigned to the total population. 28 Teledensity is defined as total telephone subscribers per 100 population. 29 Data on IMPS and UPI are originally collected by National Payments Corporation of India (NPCI) bank branch-wise and converted to state-wise transactions by using the unique Indian Financial System Code (IFSC) allotted to each bank branch. 30 C-D ratio is a measure of how much banks lend out of the deposits they have mobilised. While there are no stipulations on the minimum and maximum levels, a very low C-D ratio indicates that banks are not utilising their resources optimally, while a high C-D ratio indicates pressure on resources. 31 The 74th Constitutional Amendment in 1992 assigns to ULBs vital functions such as town planning, regulation of land use, provision of water, sanitation and solid waste management, public health, urban poverty alleviation, etc. Almost all functions have been transferred to ULBs excepting the job of town planning, which is still in the domain of respective state governments. 32 The index is compiled on the basis of eight key sectoral indicators as per the availability of equal frequency data with a similar time lag. Mean imputation method has been followed to ensure a complete data set without missing values. All the indicators are normalised using z-scores. Weights are assigned using the PCA technique, which reduces the dimensionality while preserving variability, and extracts factors that are accountable for the co-movement of a cohort of key indicators. These co-movements are assumed to be predominantly due to fluctuations in the broader economic system. In order to create an index; each variable is first standardised so that they are expressed in the same units. Second, the proportion of variation explained by the principal components (PC) is also determined by eigen values. The eigen vectors or the factor loadings of the PCs are used as weights for constructing the index. 33 These 14 states together accounted for around 70 per cent of India’s GDP (2018-19). 34 Given the fact that Maharashtra, Karnataka, Delhi and Gujarat have been the major recipients of FDI in India, COVID-19 may have impacted finances of companies registered in these states. These states are reported to have hosted 75 per cent of FDI in India by end-March 2020 (GoI, 2020b). 35 Causes are broadly categorized into communicable, maternal, neonatal and nutritional diseases (CMNND), Non Communicable Diseases (NCD) and Injuries. 36 YLDs are measured by assigning disability weights to specific diseases. 37 Due to data limitations, UTs of Daman and Diu and Dadra and Nagar Haveli have been eliminated from the analysis, and mean imputation has been performed for newly formed state of Telangana using value of Andhra Pradesh for the data prior to bifurcation of Andhra Pradesh into Telangana and Andhra Pradesh. | ||||||||||||||||||||||||||||||||||||||||||||||||||||||||||||||||||||||||||||||||||||||||||||||||||||||||||||||||||||||||||||||||||||||||||||||||||||||||||||||||||||||||||||||||||||||||||

এই পেজটি শেয়ার করুন:


রিজার্ভ ব্যাঙ্ক অফ ইন্ডিয়া মোবাইল অ্যাপ্লিকেশন ইনস্টল করুন এবং সাম্প্রতিক সংবাদগুলিতে দ্রুত অ্যাক্সেস পান!
আমাদের অ্যাপটি ইনস্টল করতে QR কোডটি স্ক্যান করুন


পেজের শেষ আপডেট করা তারিখ:


