RbiSearchHeader

Press escape key to go back

Past Searches

Theme
Theme
Text Size
Text Size
S2

RbiAnnouncementWeb

RBI Announcements
RBI Announcements

Asset Publisher

83680694

Industrial Outlook Survey- Q2: 2014-15 (Round 67)

The Industrial Outlook Survey conducted during July-September 2014, provides qualitative assessment of business situation of companies in the Indian manufacturing sector for Q2:2014-15 and their expectations for the ensuing quarter Q3:2014-15. The survey elicited early response from 1,225 manufacturing companies.

Highlights:

Summary Table: Net response1 (NR in %) comparison over previous quarter

Assessment period

Expectation period

Parameters

Q1:2014-15

Q2:2014-15

Parameters

Q2:2014-15

Q3:2014-15

Improved positivity:


Increased optimism:


i. Capacity Utilisation

6.0

7.1

i. Production

33.7

34.5

ii. Exports

10.5

12.4

ii. Order Books

29.1

31.6

iii. Imports

9.3

12.7

iii. Capacity Utilisation

19.4

19.9

iv. Production

17.2

18.5

iv. Imports

15.0

25.9

v. Employment

5.4

6.3

v. Employment

8.9

11.2

vi. BEI

105.2

106.4

vi. Selling price

12.5

13.3

Reduced concern:


vii. Profit Margin

-2.3

1.0

i. Cost of Finance

-22.2

-18.5

viii. BEI

114.7

117.7

ii. Cost of Raw Material

-49.5

-44.7


Reduced pessimism:


i. Cost of Raw Material

-42.1

-39.2

Decline in positivity:


Reduced optimism:


i. Order Books

16.4

15.4

i. Availability of Finance

20.6

19.7

ii. Availability of Finance

12.4

12.1

ii. Exports

21.4

20.9

iii. Selling Price

9.8

6.8


iv. Profit Margin

-15.1

-15.3


No Change:


No Change:


i. Cost of Finance

-17.2

-17.2


1

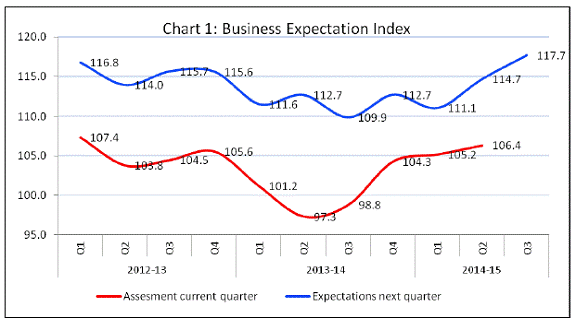
Expectation (Q3:2014-15)

  • Business outlook of the Indian manufacturing sector as inferred from movements in Business Expectation Index2 (BEI) shows improvement for Q3:2014-15 (117.7) as compared to previous quarter (114.7). This increase in composite index is due to higher optimism in capacity utilisation, imports, production and cost of raw material.

Assessment (Q2:2014-15)

  • Business outlook of the Indian manufacturing sector as inferred from movements in Business Expectation Index (BEI), shows improvement for Q2:2014-15 (106.4) as compared to previous quarter (105.2).
  • The improved positivity is mainly due to capacity utilisation, exports, imports, cost of finance and cost of raw material.

Table 1: Assessment & Expectation for Production

(Percentage responses)@

Quarter

Total response

Assessment

Expectation

Increase

Decrease

No change

Net response#

Increase

Decrease

No change

Net response

Q2:2013-14

1207

31.8

21.0

47.2

10.8

40.6

12.1

47.3

28.5

Q3: 2013-14

1223

31.7

20.2

48.1

11.5

40.8

12.0

47.2

28.9

Q4:2013-14

1114

36.6

16.6

46.7

20.0

42.3

10.2

47.5

32.1

Q1:2014-15

1293

34.4

17.2

48.4

17.2

39.2

12.2

48.6

27.1

Q2:2014-15

1225

35.2

16.7

48.1

18.5

43.4

9.7

46.8

33.7

Q3:2014-15


43.6

9.8

47.3

34.5

‘Increase’ in production is optimistic.
@Due to rounding off percentage may not add up to 100. This is applicable for all the tables from 1 to 17.
#Net Response (NR) is the difference of percentage of the respondents reporting optimism and that reporting pessimism. The range is -100 to 100. Any value greater than zero indicates expansion and any value less than zero indicates contraction.


Table 2: Assessment & Expectation for Order Books

(Percentage responses)

Quarter

Total response

Assessment

Expectation

Increase

Decrease

No change

Net response

Increase

Decrease

No change

Net response

Q2:2013-14

1207

27.9

22.3

49.8

5.5

36.8

11.5

51.8

25.3

Q3:2013-14

1223

28.2

21.2

50.6

7.0

34.7

13.7

51.5

21.0

Q4:2013-14

1114

32.1

17.3

50.6

14.8

38.1

10.5

51.4

27.6

Q1:2014-15

1293

31.8

15.4

52.9

16.4

36.2

11.5

52.3

24.6

Q2:2014-15

1225

31.2

15.8

53.0

15.4

38.2

9.1

52.6

29.1

Q3:2014-15


40.0

8.4

51.6

31.6

‘Increase’ in order books is optimistic.


Table 3: Assessment & Expectation for Pending Orders

(Percentage responses)

Quarter

Total response

Assessment

Expectation

Below Normal

Above Normal

Normal

Net response

Below Normal

Above Normal

Normal

Net response

Q2:2013-14

1207

21.3

3.9

74.8

17.3

15.9

4.4

79.6

11.5

Q3:2013-14

1223

19.2

5.1

75.7

14.1

17.5

3.8

78.8

13.7

Q4:2013-14

1114

16.1

5.4

78.5

10.7

14.2

6.0

79.8

8.1

Q1:2014-15

1293

15.6

5.1

79.3

10.5

14.0

5.8

80.1

8.2

Q2:2014-15

1225

16.8

4.2

79.1

12.6

12.3

5.7

82.0

6.5

Q3:2014-15


11.8

5.2

83.1

6.6

Pending orders ‘Below Normal’ is optimistic.


Table 4: Assessment & Expectation for Capacity Utilisation

(Percentage responses)

Parameter

Options

Assessment

Expectation

Q2:2013-14

Q3:2013-14

Q4:2013-14

Q1:2014-15

Q2:2014-15

Q3:2013-14

Q4:2013-14

Q1:2014-15

Q2:2014-15

Q3:2014-15

Capacity Utilisation (CU)-(main product)

Increase

20.7

20.7

24.9

22.3

23.8

26.8

27.2

23.8

29.5

29.5

No Change

58.6

59.9

60.1

61.3

59.5

60.6

61.9

63.6

60.4

60.9

Decrease

20.7

19.4

15.0

16.3

16.7

12.6

10.9

12.6

10.1

9.6

Net Response

0.0

1.3

9.9

6.0

7.1

14.2

16.3

11.2

19.4

19.9

Level of CU (compared to the average in last 4 quarters)

Above normal

8.9

8.5

10.1

10.3

8.7

9.8

11.1

9.7

10.6

10.0

Normal

70.7

69.7

72.2

71.8

72.3

75.0

73.4

75.4

76.6

77.3

Below Normal

20.4

21.8

17.6

17.9

19.0

15.2

15.5

14.9

12.7

12.7

Net Response

-11.5

-13.3

-7.5

-7.6

-10.3

-5.3

-4.4

-5.2

-2.1

-2.7

Assessment of Prod. Capacity (with regard to expected demand in next 6 months)

More than adequate

15.0

14.7

13.9

13.8

13.3

14.8

15.7

13.4

12.9

13.0

Adequate

77.0

76.6

77.9

78.1

78.7

78.0

77.6

79.5

80.3

80.9

Less than adequate

8.1

8.7

8.2

8.1

8.0

7.1

6.8

7.1

6.8

6.1

Net Response

6.9

5.9

5.7

5.7

5.3

7.7

8.9

6.3

6.1

6.9

‘Increase’ in capacity utilisation is optimistic.


Table 5: Assessment & Expectation for Exports

(Percentage responses)

Quarter

Total response

Assessment

Expectation

Increase

Decrease

No change

Net response

Increase

Decrease

No change

Net response

Q2:2013-14

1207

24.9

17.1

58.0

7.8

28.6

10.0

61.5

18.6

Q3:2013-14

1223

24.2

13.4

62.4

10.9

27.4

10.9

61.7

16.5

Q4:2013-14

1114

29.3

12.9

57.9

16.4

28.3

8.9

62.8

19.5

Q1:2014-15

1293

24.6

14.1

61.2

10.5

31.7

10.0

58.3

21.6

Q2:2014-15

1225

25.6

13.2

61.2

12.4

29.9

8.5

61.5

21.4

Q3:2014-15


28.5

7.6

63.9

20.9

‘Increase’ in exports is optimistic.


Table 6: Assessment & Expectation for Imports

(Percentage responses)

Quarter

Total response

Assessment

Expectation

Increase

Decrease

No change

Net response

Increase

Decrease

No change

Net response

Q2:2013-14

1207

18.3

14.7

67.0

3.6

19.9

8.7

71.4

11.2

Q3:2013-14

1223

19.1

12.0

68.9

7.0

19.0

11.3

69.7

7.7

Q4:2013-14

1114

19.3

10.0

70.7

9.3

20.8

7.3

71.9

13.4

Q1:2014-15

1293

18.8

9.4

71.8

9.3

18.3

7.8

73.9

10.5

Q2:2014-15

1225

20.9

8.2

70.9

12.7

21.2

6.2

72.6

15.0

Q3:2014-15


19.4

6.5

74.1

25.9

‘Increase’ in imports is optimistic.


Table 7: Assessment & Expectations for level of Inventory (Raw Material and Finished Goods)

(Percentage responses)

Parameter

Options

Assessment

Expectation

Q2:2013-14

Q3:2013-14

Q4:2013-14

Q1:2014-15

Q2:2014-15

Q3:2013-14

Q4:2013-14

Q1:2014-15

Q2:2014-15

Q3:2014-15

Inventory of raw material

Below average

8.7

8.3

7.7

7.2

8.4

6.3

5.3

6.7

6.4

6.1

Average

78.7

78.9

79.2

80.2

79.4

83.6

83.7

83.6

83.7

84.0

Above average

12.6

12.8

13.2

12.6

12.3

10.1

11.0

9.7

9.9

9.9

Net Response

-3.8

-4.6

-5.5

-5.4

-3.9

-3.9

-5.8

-3.1

-3.5

-3.8

Inventory of finished goods

Below average

7.5

7.3

7.7

6.7

7.5

6.2

6.6

7.6

6.4

6.7

Average

77.0

75.3

76.9

79.1

76.7

82.5

80.8

81.8

82.9

82.6

Above average

15.5

17.4

15.4

14.1

15.8

11.3

12.6

10.6

10.8

10.8

Net Response

-8.1

-10.2

-7.6

-7.4

-8.3

-5.0

-6.0

-3.0

-4.4

-4.1

Inventory of raw material and finished goods ‘Below average’ is optimistic.


Table 8: Assessment & Expectations for Employment Outlook

(Percentage responses)

Quarter

Total response

Assessment

Expectation

Increase

Decrease

No change

Net response

Increase

Decrease

No change

Net response

Q2:2013-14

1207

11.3

11.5

77.3

-0.2

16.0

8.4

75.6

7.7

Q3:2013-14

1223

13.1

12.7

74.2

0.4

13.3

8.8

77.9

4.5

Q4:2013-14

1114

16.1

10.7

73.2

5.4

14.3

7.4

78.3

7.0

Q1:2014-15

1293

15.0

9.6

75.4

5.4

15.7

8.4

75.9

7.2

Q2:2014-15

1225

14.6

8.3

77.1

6.3

15.2

6.2

78.6

8.9

Q3:2014-15


16.6

5.4

78.0

11.2

‘Increase’ in employment is optimistic.


Table 9: Assessment & Expectation for Overall Financial Situation

(Percentage responses)

Quarter

Total response

Assessment

Expectation

Better

Worsen

No change

Net response

Better

Worsen

No change

Net response

Q2:2013-14

1207

21.4

19.5

59.1

1.8

33.2

9.1

57.7

24.1

Q3:2013-14

1223

23.7

17.3

58.9

6.4

29.7

12.4

57.9

17.3

Q4:2013-14

1114

25.0

13.1

61.9

11.9

33.0

9.5

57.5

23.5

Q1:2014-15

1293

26.2

12.3

61.5

14.0

30.7

8.4

60.8

22.3

Q2:2014-15

1225

27.2

12.3

60.5

14.9

33.6

6.8

59.6

26.8

Q3:2014-15


36.0

6.2

57.8

29.8

‘Better’ overall financial situation is optimistic.


Table 10: Assessment & Expectation for Working Capital Finance Requirement

(Percentage responses)

Quarter

Total response

Assessment

Expectation

Increase

Decrease

No change

Net response

Increase

Decrease

No change

Net response

Q2:2013-14

1207

32.9

8.1

59.0

24.8

31.0

6.5

62.5

24.5

Q3:2013-14

1223

33.5

7.2

59.3

26.3

32.7

5.3

61.9

27.4

Q4:2013-14

1114

34.9

6.2

58.8

28.7

35.3

4.7

60.0

30.6

Q1:2014-15

1293

31.6

6.6

61.7

25.0

33.1

5.0

61.9

28.1

Q2:2014-15

1225

30.5

6.0

63.5

24.5

33.5

5.0

61.5

28.5

Q3:2014-15


31.7

4.8

63.5

26.9

‘Increase’ in working capital finance is optimistic.


Table 11: Assessment & Expectation for Availability of Finance

(Percentage responses)

Parameter

Options


Assessment

Expectation

Q2:2013-14

Q3:2013-14

Q4:2013-14

Q1:2014-15

Q2:2014-15

Q3:2013-14

Q4:2013-14

Q1:2014-15

Q2:2014-15

Q3:2014-15

Availability of finance (from internal accruals)

Improve

18.3

20.3

21.9

23.1

23.5

23.2

25.0

23.4

26.7

26.5

No Change

66.4

66.9

67.1

66.3

65.7

67.6

68.5

69.2

67.3

66.8

Worsen

15.2

12.7

11.0

10.6

11.1

9.2

6.6

7.4

6.1

6.8

Net Response

3.1

7.6

10.8

12.4

12.1

14.0

18.4

16.0

20.6

19.7

Availability of Finance(from banks & other sources)

Improve

14.2

17.1

18.2

20.1

18.8

18.2

19.0

20.5

21.5

20.8

No Change

75.6

74.5

72.4

72.3

74.4

75.6

76.2

73.6

74.7

75.1

Worsen

10.3

8.4

9.3

7.6

6.8

6.2

4.8

5.9

3.8

4.2

Net Response

3.9

8.7

8.9

12.5

12.0

12.0

14.2

14.6

17.6

16.6

Availability of Finance (from overseas, if applicable)

Improve

7.6

10.4

10.9

9.9

8.8

8.9

11.9

11.8

12.2

10.8

No Change

84.6

83.1

83.4

84.8

86.1

85.0

84.2

83.6

84.8

86.3

Worsen

7.8

6.5

5.7

5.3

5.1

6.0

3.9

4.6

3.0

2.9

Net Response

-0.1

3.9

5.2

4.6

3.7

2.9

8.1

7.2

9.1

7.9

‘Improvement’ in availability of finance is optimistic.


Table 12: Assessment & Expectation for Cost of Finance

(Percentage responses)

Quarter

Total response

Assessment

Expectation

Decrease

Increase

No change

Net response

Decrease

Increase

No change

Net response

Q2:2013-14

1207

5.0

37.6

57.4

-32.7

9.1

21.5

69.5

-12.4

Q3:2013-14

1223

5.6

37.5

56.9

-32.0

4.9

33.2

61.9

-28.3

Q4:2013-14

1114

5.0

32.9

62.0

-27.9

4.4

31.1

64.6

-26.7

Q1:2014-15

1293

5.3

27.4

67.3

-22.2

5.4

27.7

66.9

-22.2

Q2:2014-15

1225

6.5

25.0

68.6

-18.5

6.0

23.2

70.8

-17.2

Q3:2014-15


5.6

22.8

71.6

-17.2

Decrease’ in cost of finance is optimistic.


Table 13: Assessment & Expectation for Cost of Raw Material

(Percentage responses)

Quarter

Total response

Assessment

Expectation

Decrease

Increase

No change

Net response

Decrease

Increase

No change

Net response

Q2:2013-14

1207

2.8

65.0

32.2

-62.2

3.5

46.9

49.6

-43.4

Q3:2013-14

1223

4.2

59.5

36.3

-55.3

3.2

54.6

42.2

-51.5

Q4:2013-14

1114

2.6

56.7

40.7

-54.1

2.8

49.1

48.0

-46.3

Q1:2014-15

1293

3.0

52.5

44.5

-49.5

2.9

49.7

47.4

-46.9

Q2:2014-15

1225

4.6

49.3

46.2

-44.7

3.7

45.8

50.6

-42.1

Q3:2014-15


4.3

43.5

52.2

-39.2

‘Decrease’ in cost of raw material is optimistic.


Table 14: Assessment & Expectation for Selling Price

(Percentage responses)

Quarter

Total response

Assessment

Expectation

Increase

Decrease

No change

Net response

Increase

Decrease

No change

Net response

Q2:2013-14

1207

25.1

13.8

61.1

11.3

21.2

9.1

69.7

12.1

Q3:2013-14

1223

22.3

14.5

63.2

7.8

23.4

9.5

67.0

13.9

Q4:2013-14

1114

22.0

12.4

65.6

9.6

23.3

8.2

68.5

15.1

Q1:2014-15

1293

22.0

12.2

65.8

9.8

23.4

8.4

68.2

15.1

Q2:2014-15

1225

20.1

13.3

66.6

6.8

20.6

8.0

71.4

12.5

Q3:2014-15


20.5

7.2

72.3

13.3

‘Increase’ in selling price is optimistic.


Table 15: Assessment & Expectation for Profit Margin

(Percentage responses)

Quarter

Total response

Assessment

Expectation

Increase

Decrease

No change

Net response

Increase

Decrease

No change

Net response

Q2:2013-14

1207

12.3

36.4

51.3

-24.1

18.6

22.3

59.1

-3.7

Q3:2013-14

1223

12.8

35.2

52.0

-22.4

16.5

25.7

57.8

-9.3

Q4:2013-14

1114

14.1

30.6

55.3

-16.5

18.2

22.2

59.7

-4.0

Q1:2014-15

1293

14.3

29.4

56.4

-15.1

16.8

22.2

61.0

-5.4

Q2:2014-15

1225

12.6

27.9

59.4

-15.3

18.0

20.3

61.7

-2.3

Q3:2014-15


18.9

17.9

63.2

1.0

‘Increase’ in profit margin is optimistic.


Table 16: Assessment & Expectation for Overall Business Situation

(Percentage responses)

Quarter

Total response

Assessment

Expectation

Better

Worsen

No change

Net response

Better

Worsen

No change

Net response

Q2:2013-14

1207

28.2

20.8

51.0

7.4

39.2

9.2

51.6

30.0

Q3:2013-14

1223

28.7

19.0

52.3

9.6

37.4

11.7

50.8

25.7

Q4:2013-14

1114

30.9

13.5

55.7

17.4

40.6

9.1

50.3

31.5

Q1:2014-15

1293

31.7

12.6

55.7

19.1

36.5

9.1

54.4

27.4

Q2:2014-15

1225

34.6

12.6

52.8

22.0

43.9

7.0

49.1

37.0

Q3:2014-15


45.4

5.7

48.9

39.7

‘Better’ Overall Business Situation is optimistic.


Table 17: Assessment & Expectation for Salary/Other Remuneration

(Percentage responses)

Quarter

Total response

Assessment

Expectation

Increase

Decrease

No change

Net response

Increase

Decrease

No change

Net response

Q2:2013-14

1207

30.3

3.4

66.3

26.8


Q3:2013-14

1223

29.7

3.6

66.8

26.1

22.5

2.7

74.8

19.8

Q4:2013-14

1114

28.7

3.5

67.9

25.2

25.3

3.2

71.5

22.1

Q1:2014-15

1293

38.5

3.1

58.4

35.4

31.8

2.8

65.4

28.9

Q2:2014-15

1225

32.5

3.0

64.4

29.5

30.2

2.1

67.7

28.1

Q3:2014-15


24.0

2.4

73.6

21.6

‘Increase in Salary / other remuneration’ is optimistic.


Table 18: Business Expectation Index (BEI)

Quarter

BEI-Assessment Quarter

BEI-Expectation Quarter

Q2:2013-14

97.3

112.7

Q3:2013-14

98.8

109.9

Q4:2013-14

104.3

112.7

Q1:2014-15

105.2

111.1

Q2:2014-15

106.4

114.7

Q3:2014-15


117.7


1 Net Response (NR) is the difference of percentage of the respondents reporting optimism and that reporting pessimism. The range is -100 to 100. Any value greater than zero indicates expansion/optimism and any value less than zero indicates contraction/pessimism i.e. NR = (I – D); where, I is the percentage response of ‘Increase/optimism’, and D is the percentage response of ‘Decrease/pessimism’ and E is the percentage response as ‘no change/Equal’; I+D+E=100.

2 The Business Expectation Index (BEI), which is a composite indicator calculated as weighted net response of nine business parameters, gives a single snapshot of business outlook in every quarter. The range of BEI lies between 0 to 200, and 100 is the threshold line separating expansion from contraction.

RbiTtsCommonUtility

प्ले हो रहा है
শুনুন

Related Assets

RBI-Install-RBI-Content-Global

RbiSocialMediaUtility

রিজার্ভ ব্যাঙ্ক অফ ইন্ডিয়া মোবাইল অ্যাপ্লিকেশন ইনস্টল করুন এবং সাম্প্রতিক সংবাদগুলিতে দ্রুত অ্যাক্সেস পান!

Scan Your QR code to Install our app

RbiWasItHelpfulUtility

এই পেজটি কি সহায়ক ছিল?