The findings of 26th round of Inflation Expectations Survey of Households for the October-December 2011 quarter, conducted during the first fortnight of December 2011 are presented here. The survey captures the inflation expectationsof 4,000 urban households across 12 cities for the next three-month and for the next one-year. These expectations are based on their individual consumption baskets and hence, these rates should not be considered as predictors of any official measure of inflation. The households’ inflation expectations provide useful directional information on near-term inflationary pressures and also supplement other economic indicators to get a better indication of future inflation path. The survey results are those of the respondents and are not necessarily shared by the Reserve Bank of India.
The current round of the survey shows that the percentages of respondents expecting price rise in next three-month have gone down for all product groups (viz., food, non-food, household durables, housing and services); but these proportions have gone up for one-year ahead. Expectations on general price rise were mainly influenced by movements in food prices. The three-month ahead and one-year ahead inflation expectations of households have remained high at 12.4 per cent and 13.3 per cent,as compared with 12.2 per cent and 12.9 per cent respectively in the last round of the survey. Households expect inflation to rise further by 50 and 140 basis points during the next three-month and next one-year respectively from their perceived current rate of 11.9 per cent. As in the past rounds, daily-wage workers and housewives expect higher inflation rates compared to other categories. Across the cities, households in Bangalore and Jaipur expect the highest inflation while expectations were the lowest for Ahmedabad. On awareness, 36.0 per cent of the respondents felt that RBI is taking necessary action to control inflation, of which, 53.6 per cent felt that RBI's action is effective.
I: Introduction
Reserve Bank of India has been conducting Inflation Expectations Survey of Households (IESH) on a quarterly basis, since September 2005. The survey elicits qualitative and quantitative responses for short and long term indicated by three and twelve month period ahead on expected price changes and inflation. Inflation expectations of households (HHs) are subjective assessments and are based on their individual consumption baskets and therefore may be different from the official inflation numbers released periodically by the government. Again they may not be treated as forecast of any official measure of inflation, though these inflation expectations provide useful inputs on directional movements of future inflation.
II: Sample Coverage and Information Sought
The survey is conducted simultaneously in 12 cities that cover adult respondents of 18 years and above. The major metropolitan cities, viz., Delhi, Kolkata, Mumbai and Chennai are represented by 500 households each, while another eight cities, viz., Jaipur, Lucknow, Bhopal, Ahmedabad, Patna, Guwahati, Bangalore and Hyderabad are represented by 250 households each. The respondents are well spread across the cities to provide a good geographical coverage. The male and female respondents in the group are approximately in the ratio of 3:2. The sample coverage in terms of occupational category-wise representation is nearly as per the target (Table 1).
The single page survey schedule (Annex) is organised into seven blocks covering the respondent profile (block 1), general and product-wise short and long term price expectations (block 2 and 3), feedback on RBI's action to control inflation (block 4), current and expected short and long term inflation rate (block 5), amount paid for the purchase of major food items during last one month (block 6) and the expectations on changes in income/wages (block 7).
The response options for price changes are (i) price increase more than current rate, (ii) price increase similar to current rate, (iii) price increase less than current rate, (iv) no change in prices and (v) decline in prices. The inflation rates are collected in intervals - the lowest being ‘less than 1 per cent’ and the highest being ‘16 per cent and above’ with 100 basis point size for all intermediate classes.
III: Survey Results
III.1 General Price Expectations
-
The percentage of respondents expecting increase in general prices by ‘more than the current rate’ for three-month ahead has gone down to 73.4 per cent from 75.8 per cent in the previous round (July-September 2011). As compared with the last round, more respondents expect prices to rise by ‘less than the current rate’ Table 2.1).
-
In contrast, the proportion that expect prices to rise by ‘more than the current rate’in next one year has increased to 76.9 per cent from 73.5 per cent in the previous round.
III. 2 Product Group wise Price Expectations
-
Product group-wise price expectations reflect similar trend, i.e. the percentage of respondents expecting price increase in next three-month ahead has gone down vis-à-vis the last round for food products, non-food products, household durables, housing and services; while one-year ahead expectations have risen for all the product groups except household durables and cost of services (Table 2.2, 2.3, 2.4, 2.5 and 2.6).
-
Proportion of households expecting price increase three-month ahead by ‘more than the current rate’ has declined to some extent for food products, housing and cost of services. In line, more respondents expect rise in prices at ‘less than the current rate’, particularly in respect of housing prices and cost of services.
III. 3 Coherence between General and Product Group wise Price Expectations
-
As in the past rounds, the general price expectations are observed to be more aligned with food price expectations than with other product groups. On an average, around 90 per cent of the respondents appeared to have been driven by expected changes in food prices for arriving at general price expectations (Table 3 and Table 4).
-
The extent of coherence between general price expectations and that of other product groups has decreased considerably in the current survey round as compared with previous round. The association was the lowest with household durables prices (Table 3 and Table 4).
III. 4 Inflation Expectations
-
The three-month ahead and one-year ahead inflation expectations based on mean inflation rate reported by 4,000 households have moved up to 12.4 per cent and 13.3 per cent respectively from 12.2 per cent and 12.9 per cent in the last round (Table 5 and Chart 1).
-
According to the respondents’ perception based on their respective consumption baskets, current perceived, three-month ahead and one-year ahead expected inflation have increased by 20, 20 and 40 basis points respectively vis-à-vis corresponding average rates reported in the previous round.
-
Households expect inflation to rise further by 50 and 140 basis points during next three-month and next one-year respectively from the perceived current rate of 11.9 per cent.
-
For a large part of the survey history, the households' inflation expectations remained between the WPI and CPI-IW inflation rates. However, from September 2010 round of the survey, household inflation expectations are higher than the official inflation rates (Chart 2).
-
Based on 10,000 re-samples using simple random sampling with replacement, 99% bootstrap confidence intervals worked out for mean for short-term and long-term period have small width indicating the precision of point estimates for the population means of households' expectations of inflation (Table 6).
III. 5 Variations in Responses
-
Over different rounds of the survey, the variations in the responses in terms of standard deviation were observed to be lower for the perceived current inflation rate as compared with the expectations. However, in the current round of the survey, the variation in perceived current rate has been as much as that in the expectations (Table 7).
-
Variation in consumption baskets and thereby the variability in responses for inflation expectations may partly be explained by different classificatory factors (viz., gender, age-group, city and category) of respondents over different rounds.
-
An Analysis of Variance (ANOVA) carried out over different rounds revealed that ‘city’ has always been a significant source of variation in each round followed by occupational ‘category’ (Table 8).
-
Survey shows that housewives and daily workers tend to have higher inflation expectations. No visible pattern emerged from age-wise profileof respondents (Table 9).
-
City-wise, inflation expectations were found the highest in Bangalore and Jaipur and the lowest in Ahmedabad (Table 9).
III.6 Cross-tabulation of Current Inflation and Future Expectations
-
The proportions of respondents perceiving and expecting inflation at double digit for short and long term periods have increased as compared with those in the last round.
-
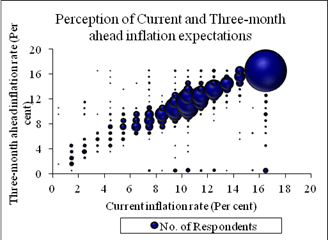
In particular, 72.0 per cent (64.5 per cent in previous round) of respondents perceive double digit current inflation. Similarly, 78.3 per cent (77.5 per cent in previous round) and 84.2 per cent (83.9 per cent in previous round) of the respondents expect double digit inflation rates for three-month ahead and one-year ahead periods (Table 10 , Table 11 and Chart 3).
-
A cross tabulation of the current inflation perception with the future inflation expectations indicates that among the 72.0 per cent respondents who perceive the current inflation in double digit, around 95 per cent expect that it would remain at similar levels in next three months or in next one year (Table 10 and Table 11).
III.7 Awareness on Reserve Bank of India's Action to Control Inflation
-
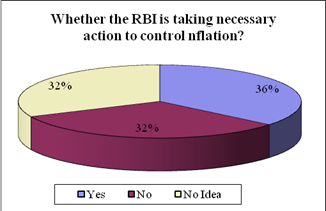
On the feedback of the RBI action to control inflation and its impact, the survey finds that 68.2 per cent (62.6 per centin previous round) of respondents are aware that RBI takes action to control inflation. Among these, 36.0 per cent (26.7 per centin previous round) felt that RBI is taking necessary action (Chart 4), of which,53.6per cent think that the action has an impact on controlling inflation.
-
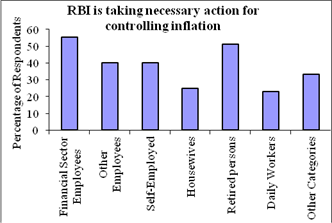
While financial sector employees are mostly aware of RBI role in controlling inflation, daily workers are largely unaware (Chart 5).
-
Among the respondents in each category who felt that RBI is taking necessary action to control inflation, most of them also felt that the action has an impact (Table 12).
III.8 Expectations in Change of Income/Wages
-
Out of 2,198 respondents in the wage earners/self-employed/daily workers categories, 41.8 per cent reported increase in wages/income in the past one year. Around 73 per cent do not see their income/wage increasing in next three months. However, 71.3 per cent expect their income/wages to rise in next one-year (Table 13).
-
Among the 41.8 per cent respondents who have reported wages/incomeincrease in past one year, 47.2 per cent are from salaried class, 38.1 per cent are self-employed and 35.3 per cent are daily workers.
- 65.5 per cent of daily workers, 66.1 per cent of self-employed and 77.7 per cent of financial sector and other employees expect increase in income in next one-year.
Table 1 : Respondents’ Profile (Category): Share in Total Sample |
Category of Respondents |
Share in Total (%) |
Target Share (%) |
Financial Sector Employees |
9.3 |
10.0 |
Other Employees |
16.0 |
15.0 |
Self- Employed |
20.9 |
20.0 |
Housewives |
30.6 |
30.0 |
Retired Persons |
8.7 |
10.0 |
Daily Workers |
8.8 |
10.0 |
Other categories |
5.8 |
5.0 |
Total |
100 |
100 |
Note: The above sample proportion is for the quarter ended December 2011 survey |
Table 2 : Percentage of Respondents - Product-wise Expectations of Prices for
Three-month and One-year Ahead |
Table 2.1: General |
Round No./survey period
(quarter ended) → |
17 |
18 |
19 |
20 |
21 |
22 |
23 |
24 |
25 |
26 |
Sep-09 |
Dec-09 |
Mar-10 |
Jun-10 |
Sep-10 |
Dec-10 |
Mar-11 |
Jun-11 |
Sep-11 |
Dec-11 |
Options |
Three-month ahead (percentage of respondents) |
Prices will increase |
95.8 |
97.4 |
95.7 |
95.3 |
96.5 |
98.6 |
96.0 |
98.7 |
97.3 |
96.1 |
Price increase more than current rate |
72.2 |
74.6 |
66.9 |
72.7 |
72.2 |
74.3 |
72.9 |
71.8 |
75.8 |
73.4 |
Price increase similar to current rate |
18.4 |
16.6 |
20.0 |
20.0 |
21.0 |
22.0 |
20.4 |
19.8 |
15.4 |
13.2 |
Price increase less than current rate |
5.1 |
6.2 |
8.8 |
2.6 |
3.3 |
2.3 |
2.7 |
7.1 |
6.0 |
9.6 |
No change in prices |
3.7 |
2.4 |
3.4 |
4.2 |
2.9 |
1.1 |
3.5 |
1.2 |
2.2 |
3.0 |
Decline in price |
0.6 |
0.3 |
0.9 |
0.5 |
0.6 |
0.4 |
0.5 |
0.1 |
0.6 |
0.9 |
Options |
One- year ahead (percentage of respondents) |
Prices will increase |
96.3 |
96.3 |
96.5 |
95.2 |
95.6 |
98.9 |
96.1 |
98.7 |
96.0 |
97.1 |
Price increase more than current rate |
69.5 |
68.2 |
62.8 |
70.8 |
70.4 |
77.4 |
73.4 |
73.3 |
73.5 |
76.9 |
Price increase similar to current rate |
17.3 |
15.2 |
19.8 |
18.7 |
19.7 |
17.9 |
18.6 |
18.0 |
16.7 |
12.6 |
Price increase less than current rate |
9.5 |
12.9 |
13.9 |
5.7 |
5.6 |
3.6 |
4.2 |
7.4 |
5.9 |
7.6 |
No change in prices |
3.1 |
3.1 |
2.6 |
3.8 |
3.5 |
0.9 |
3.5 |
1.3 |
3.3 |
2.5 |
Decline in price |
0.7 |
0.6 |
0.9 |
1.1 |
0.9 |
0.3 |
0.3 |
0.0 |
0.7 |
0.4 |
Table 2.2: Food Products |
Round No./survey period
(quarter ended) → |
17 |
18 |
19 |
20 |
21 |
22 |
23 |
24 |
25 |
26 |
Sep-09 |
Dec-09 |
Mar-10 |
Jun-10 |
Sep-10 |
Dec-10 |
Mar-11 |
Jun-11 |
Sep-11 |
Dec-11 |
Options |
Three-month ahead (percentage of respondents) |
Prices will increase |
96.3 |
98.0 |
95.9 |
95.8 |
96.7 |
98.1 |
95.4 |
98.6 |
97.3 |
95.3 |
Price increase more than current rate |
76.1 |
81.1 |
70.4 |
74.9 |
74.7 |
73.1 |
69.4 |
72.0 |
74.2 |
70.4 |
Price increase similar to current rate |
15.0 |
11.7 |
15.5 |
17.7 |
18.0 |
21.3 |
21.0 |
17.5 |
17.2 |
16.7 |
Price increase less than current rate |
5.2 |
5.3 |
10.0 |
3.2 |
4.0 |
3.7 |
5.1 |
9.1 |
5.9 |
8.2 |
No change in prices |
3.0 |
1.4 |
3.1 |
3.5 |
2.3 |
1.4 |
3.8 |
1.2 |
1.9 |
3.4 |
Decline in price |
0.8 |
0.6 |
1.0 |
0.7 |
1.0 |
0.6 |
0.8 |
0.2 |
0.9 |
1.3 |
Options |
One-year ahead (percentage of respondents) |
Prices will increase |
96.2 |
96.5 |
96.8 |
95.6 |
95.7 |
98.6 |
95.9 |
98.6 |
95.8 |
96.8 |
Price increase more than current rate |
71.0 |
72.1 |
65.9 |
72.8 |
71.7 |
76.4 |
75.5 |
73.6 |
72.0 |
73.7 |
Price increase similar to current rate |
15.2 |
11.9 |
16.5 |
16.9 |
17.8 |
17.8 |
16.6 |
17.2 |
19.0 |
15.8 |
Price increase less than current rate |
10.0 |
12.5 |
14.5 |
5.9 |
6.2 |
4.4 |
3.9 |
7.9 |
4.8 |
7.4 |
No change in prices |
2.9 |
2.7 |
2.3 |
3.3 |
3.2 |
1.1 |
3.6 |
1.3 |
3.3 |
2.7 |
Decline in price |
0.9 |
0.9 |
0.9 |
1.1 |
1.1 |
0.4 |
0.5 |
0.1 |
0.9 |
0.5 |
Table 2.3: Non Food Products |
Round No./survey period
(quarter ended) → |
17 |
18 |
19 |
20 |
21 |
22 |
23 |
24 |
25 |
26 |
Sep-09 |
Dec-09 |
Mar-10 |
Jun-10 |
Sep-10 |
Dec-10 |
Mar-11 |
Jun-11 |
Sep-11 |
Dec-11 |
Options |
Three-month ahead (percentage of respondents) |
Prices will increase |
94.7 |
95.8 |
94.0 |
92.9 |
95.4 |
95.9 |
95.0 |
98.0 |
95.6 |
94.3 |
Price increase more than current rate |
59.3 |
63.1 |
57.4 |
60.1 |
64.4 |
58.8 |
58.4 |
65.6 |
67.1 |
66.1 |
Price increase similar to current rate |
27.1 |
24.8 |
28.0 |
29.4 |
27.3 |
33.2 |
31.3 |
25.0 |
21.5 |
18.3 |
Price increase less than current rate |
8.3 |
7.9 |
8.7 |
3.4 |
3.7 |
3.9 |
5.3 |
7.4 |
7.0 |
9.9 |
No change in prices |
4.7 |
3.7 |
4.8 |
6.3 |
3.9 |
0.5 |
4.4 |
1.9 |
3.8 |
4.9 |
Decline in price |
0.7 |
0.5 |
1.2 |
0.9 |
0.7 |
0.7 |
0.6 |
0.1 |
0.7 |
0.9 |
Options |
One-year ahead (percentage of respondents) |
Prices will increase |
95.2 |
94.6 |
94.7 |
92.8 |
94.6 |
97.5 |
94.7 |
97.8 |
95.2 |
96.2 |
Price increase more than current rate |
59.6 |
60.7 |
53.0 |
59.7 |
64.0 |
65.2 |
59.9 |
66.9 |
66.4 |
67.5 |
Price increase similar to current rate |
23.6 |
20.7 |
27.6 |
26.4 |
24.9 |
28.1 |
29.2 |
24.0 |
22.7 |
20.8 |
Price increase less than current rate |
12.1 |
13.2 |
14.1 |
6.7 |
5.7 |
4.2 |
5.6 |
7.0 |
6.1 |
8.0 |
No change in prices |
4.0 |
4.6 |
4.2 |
5.9 |
4.4 |
2.2 |
4.6 |
2.0 |
4.1 |
3.3 |
Decline in price |
0.8 |
0.8 |
1.1 |
1.3 |
1.0 |
0.4 |
0.7 |
0.1 |
0.8 |
0.5 |
Table 2.4: Household Durables |
Round No./survey period
(quarter ended) → |
17 |
18 |
19 |
20 |
21 |
22 |
23 |
24 |
25 |
26 |
Sep-09 |
Dec-09 |
Mar-10 |
Jun-10 |
Sep-10 |
Dec-10 |
Mar-11 |
Jun-11 |
Sep-11 |
Dec-11 |
Options |
Three-month ahead (percentage of respondents) |
Prices will increase |
86.8 |
87.7 |
86.4 |
87.1 |
89.7 |
91.9 |
90.4 |
91.7 |
91.0 |
86.9 |
Price increase more than current rate |
38.4 |
45.5 |
44.1 |
45.1 |
45.8 |
45.5 |
47.0 |
49.0 |
50.5 |
53.6 |
Price increase similar to current rate |
30.5 |
23.4 |
27.2 |
30.5 |
32.9 |
28.9 |
28.0 |
30.6 |
26.4 |
19.5 |
Price increase less than current rate |
18.0 |
18.9 |
15.1 |
11.6 |
11.0 |
17.5 |
15.4 |
12.1 |
14.1 |
13.8 |
No change in prices |
11.0 |
9.5 |
8.8 |
9.1 |
6.3 |
5.9 |
5.9 |
6.7 |
5.8 |
10.8 |
Decline in price |
2.2 |
2.9 |
4.8 |
3.8 |
4.1 |
2.4 |
3.8 |
1.7 |
3.3 |
2.3 |
Options |
One-year ahead (percentage of respondents) |
Prices will increase |
88.7 |
87.8 |
85.2 |
87.2 |
89.0 |
94.4 |
91.3 |
92.8 |
91.5 |
90.6 |
Price increase more than current rate |
43.3 |
45.5 |
43.2 |
46.6 |
46.3 |
48.6 |
49.6 |
52.0 |
52.2 |
54.6 |
Price increase similar to current rate |
28.2 |
22.1 |
25.4 |
30.1 |
31.8 |
32.5 |
29.0 |
25.7 |
26.0 |
22.6 |
Price increase less than current rate |
17.3 |
20.3 |
16.6 |
10.6 |
11.0 |
13.3 |
12.8 |
15.1 |
13.3 |
13.4 |
No change in prices |
9.1 |
8.5 |
9.6 |
8.0 |
6.7 |
3.8 |
5.7 |
5.4 |
6.2 |
7.8 |
Decline in price |
2.2 |
3.7 |
5.3 |
4.8 |
4.3 |
1.9 |
3.0 |
1.9 |
2.3 |
1.7 |
Table 2.5: Housing Prices |
Round No./survey period
(quarter ended) → |
17 |
18 |
19 |
20 |
21 |
22 |
23 |
24 |
25 |
26 |
Sep-09 |
Dec-09 |
Mar-10 |
Jun-10 |
Sep-10 |
Dec-10 |
Mar-11 |
Jun-11 |
Sep-11 |
Dec-11 |
Options |
Three-month ahead (percentage of respondents) |
Prices will increase |
93.8 |
96.1 |
95.2 |
96.1 |
96.0 |
97.0 |
94.5 |
95.2 |
97.0 |
95.5 |
Price increase more than current rate |
64.4 |
70.8 |
60.4 |
70.8 |
64.6 |
73.1 |
73.5 |
65.4 |
73.5 |
67.4 |
Price increase similar to current rate |
22.0 |
19.8 |
25.4 |
21.0 |
24.8 |
21.3 |
18.3 |
23.5 |
18.2 |
18.2 |
Price increase less than current rate |
7.4 |
5.6 |
9.5 |
4.3 |
6.7 |
2.6 |
2.7 |
6.4 |
5.4 |
10.0 |
No change in prices |
5.0 |
3.4 |
3.5 |
3.1 |
2.8 |
2.1 |
4.7 |
4.5 |
2.2 |
3.8 |
Decline in price |
1.2 |
0.5 |
1.3 |
0.9 |
1.2 |
0.9 |
0.8 |
0.3 |
0.8 |
0.7 |
Options |
One-year ahead (percentage of respondents) |
Prices will increase |
94.9 |
96.4 |
94.1 |
96.1 |
95.3 |
97.9 |
94.8 |
97.6 |
95.8 |
96.1 |
Price increase more than current rate |
66.0 |
73.4 |
61.0 |
72.0 |
65.9 |
75.5 |
72.1 |
70.4 |
70.2 |
67.3 |
Price increase similar to current rate |
21.4 |
15.1 |
21.7 |
19.1 |
21.6 |
19.4 |
20.1 |
21.7 |
20.0 |
20.6 |
Price increase less than current rate |
7.6 |
7.9 |
11.4 |
5.0 |
7.9 |
3.0 |
2.7 |
5.6 |
5.6 |
8.2 |
No change in prices |
3.8 |
2.9 |
4.6 |
2.7 |
3.2 |
1.4 |
4.6 |
2.0 |
3.3 |
3.5 |
Decline in price |
1.3 |
0.7 |
1.3 |
1.2 |
1.5 |
0.8 |
0.6 |
0.4 |
0.9 |
0.5 |
Table 2.6 : Cost of Services |
Round No./survey period
(quarter ended) → |
17 |
18 |
19 |
20 |
21 |
22 |
23 |
24 |
25 |
26 |
Sep-09 |
Dec-09 |
Mar-10 |
Jun-10 |
Sep-10 |
Dec-10 |
Mar-11 |
Jun-11 |
Sep-11 |
Dec-
11 |
Options |
Three-month ahead (percentage of respondents) |
Prices will increase |
92.4 |
91.7 |
89.9 |
94.1 |
94.2 |
94.1 |
91.6 |
96.2 |
95.3 |
91.9 |
Price increase more than current rate |
63.7 |
62.7 |
58.6 |
63.2 |
59.2 |
61.4 |
62.1 |
61.0 |
68.1 |
58.7 |
Price increase similar to current rate |
22.9 |
21.2 |
23.9 |
26.2 |
28.6 |
28.9 |
26.4 |
26.2 |
20.3 |
21.2 |
Price increase less than current rate |
5.8 |
7.8 |
7.5 |
4.8 |
6.4 |
3.8 |
3.1 |
9.1 |
6.8 |
12.1 |
No change in prices |
6.3 |
7.0 |
6.7 |
4.8 |
5.2 |
4.5 |
7.7 |
3.8 |
4.0 |
7.4 |
Decline in price |
1.3 |
1.4 |
3.4 |
1.1 |
0.6 |
1.4 |
0.7 |
0.0 |
0.8 |
0.7 |
Options |
One-year ahead (percentage of respondents) |
Prices will increase |
95.0 |
92.3 |
89.9 |
94.2 |
94.3 |
95.2 |
91.2 |
97.3 |
95.2 |
93.6 |
Price increase more than current rate |
65.6 |
62.9 |
57.2 |
63.2 |
58.0 |
64.6 |
62.6 |
62.7 |
66.3 |
65.3 |
Price increase similar to current rate |
21.5 |
18.5 |
23.0 |
24.9 |
29.5 |
25.7 |
24.4 |
25.3 |
23.4 |
18.6 |
Price increase less than current rate |
7.9 |
10.9 |
9.8 |
6.1 |
6.8 |
4.9 |
4.2 |
9.3 |
5.4 |
9.8 |
No change in prices |
4.1 |
6.0 |
6.9 |
4.6 |
4.9 |
4.1 |
8.2 |
2.6 |
4.2 |
5.9 |
Decline in price |
1.0 |
1.8 |
3.2 |
1.2 |
0.9 |
0.7 |
0.7 |
0.1 |
0.7 |
0.5 |
Table 3 : Percentage of Respondents Expecting General Price
Movements in Coherence with Movements in Price Expectations of
Various Product Groups: Three-month Ahead |
(percentage of respondents) |
Round No. |
Survey Quarter |
Food |
Non-Food |
Households durables |
Housing |
Cost of services |
17 |
Sep-09 |
89.1 |
81.3 |
56.5 |
78.1 |
82.2 |
18 |
Dec-09 |
88.3 |
83.6 |
62.3 |
82.7 |
79.3 |
19 |
Mar-10 |
87.4 |
81.4 |
66.5 |
78.1 |
76.6 |
20 |
Jun-10 |
89.9 |
82.4 |
63.6 |
80.2 |
80.8 |
21 |
Sep-10 |
91.4 |
86.1 |
64.8 |
79.2 |
76.7 |
22 |
Dec-10 |
92.3 |
77.3 |
58.9 |
82.5 |
76.6 |
23 |
Mar-11 |
85.5 |
78.9 |
62.5 |
82.5 |
76.4 |
24 |
Jun-11 |
88.5 |
83.0 |
68.1 |
80.4 |
80.0 |
25 |
Sep-11 |
88.8 |
86.2 |
68.0 |
84.4 |
85.2 |
26 |
Dec-11 |
88.5 |
83.1 |
69.6 |
74.8 |
74.6 |
Table 4: Percentage of Respondents Expecting General Price
Movements in Coherence with Movements in Price
Expectations of Various Product Groups: One-year Ahead |
(percentage of respondents) |
Round No. |
Survey Quarter |
Food |
Non-Food |
Households Durables |
Housing |
Cost of services |
17 |
Sep-09 |
91.9 |
85.8 |
65.0 |
78.9 |
82.3 |
18 |
Dec-09 |
91.1 |
88.4 |
69.0 |
82.8 |
79.3 |
19 |
Mar-10 |
89.9 |
83.6 |
67.3 |
79.7 |
76.2 |
20 |
Jun-10 |
91.7 |
83.2 |
67.2 |
79.4 |
81.1 |
21 |
Sep-10 |
93.4 |
88.0 |
66.8 |
81.0 |
76.3 |
22 |
Dec-10 |
91.7 |
83.5 |
62.4 |
83.0 |
78.8 |
23 |
Mar-11 |
89.8 |
81.6 |
68.1 |
82.4 |
80.6 |
24 |
Jun-11 |
94.8 |
86.6 |
70.4 |
81.6 |
81.6 |
25 |
Sep-11 |
92.4 |
87.2 |
71.1 |
85.7 |
86.3 |
26 |
Dec-11 |
92.6 |
84.8 |
69.7 |
78.4 |
80.9 |
Chart 1 : Household inflation expectations – Current, Three-month Ahead and One-year Ahead |
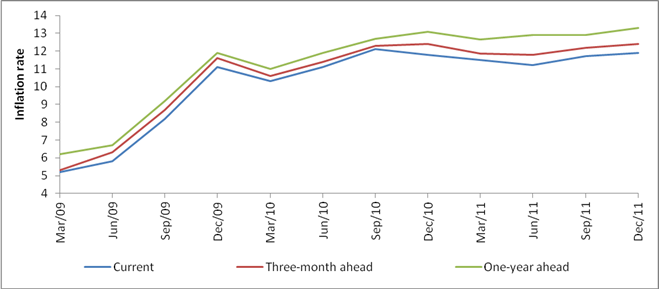 |
Chart 2: Households Inflation Expectations - vis-à-vis Official Inflation Numbers |
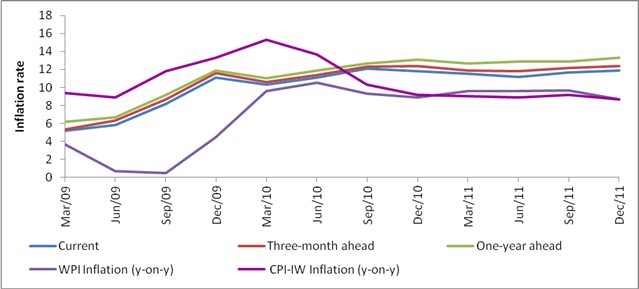 |
Table 5 : Household Inflation Expectations - Current,
Three-month Ahead and One-year Ahead |
Survey
Round |
Survey
Quarter |
3-month
Expectation period |
Inflation rate in Per cent |
Current |
Three-
month ahead |
One-year
ahead |
14 |
Dec-08 |
Jan-Mar 09 |
9.3 |
8.9 |
9.6 |
15 |
Mar-09 |
Apr-Jun 09 |
5.2 |
5.3 |
6.2 |
16 |
Jun-09 |
Jul-Sep 09 |
5.8 |
6.3 |
6.7 |
17 |
Sep-09 |
Oct-Dec 09 |
8.2 |
8.7 |
9.2 |
18 |
Dec-09 |
Jan-Mar 10 |
11.1 |
11.6 |
11.9 |
19 |
Mar-10 |
Apr-Jun 10 |
10.3 |
10.6 |
11.0 |
20 |
Jun-10 |
Jul-Sep 10 |
11.1 |
11.4 |
11.9 |
21 |
Sep-10 |
Oct-Dec 10 |
12.1 |
12.3 |
12.7 |
22 |
Dec-10 |
Jan-Mar 11 |
11.8 |
12.4 |
13.1 |
23 |
Mar-11 |
Apr-Jun 11 |
11.5 |
11.9 |
12.7 |
24 |
Jun-11 |
Jul-Sep11 |
11.2 |
11.8 |
12.9 |
25 |
Sep-11 |
Oct-Dec 11 |
11.7 |
12.2 |
12.9 |
26 |
Dec-11 |
Jan-Mar 12 |
11.9 |
12.4 |
13.3 |
Table 6 : 99% Bootstrap Confidence Intervals (BCI) based on 10,000 Resamples |
Current |
Three-month ahead |
One-year ahead |
99 BCI for Mean () |
Interval width |
99 BCI for Mean () |
Interval width |
99 BCI for Mean () |
Interval width |
(11.72, 12.02) |
0.30 |
(12.26,12.55) |
0.29 |
(13.12,13.39) |
0.27 |
Table 7 : Variability in Responses in Various Rounds |
Round
No. |
Survey
Quarter |
Inflation rate |
Current |
Three-month Ahead |
One-year Ahead |
Mean |
Std. Dev. |
Mean |
Std. Dev. |
Mean |
Std. Dev. |
16 |
Jun-09 |
5.8 |
4.4 |
6.3 |
4.6 |
6.7 |
4.7 |
17 |
Sep-09 |
8.2 |
6.0 |
8.7 |
6.0 |
9.2 |
5.9 |
18 |
Dec-09 |
11.1 |
4.9 |
11.6 |
4.9 |
11.9 |
5.1 |
19 |
Mar-10 |
10.3 |
4.4 |
10.6 |
4.7 |
11.0 |
4.8 |
20 |
Jun-10 |
11.1 |
3.6 |
11.4 |
4.1 |
11.9 |
4.2 |
21 |
Sep-10 |
12.1 |
3.2 |
12.3 |
3.6 |
12.7 |
3.8 |
22 |
Dec-10 |
11.8 |
3.5 |
12.4 |
3.7 |
13.1 |
3.6 |
23 |
Mar-11 |
11.5 |
3.1 |
11.9 |
3.7 |
12.7 |
3.6 |
24 |
Jun-11 |
11.2 |
3.4 |
11.8 |
3.3 |
12.9 |
3.3 |
25 |
Sep-11 |
11.7 |
3.1 |
12.2 |
3.4 |
12.9 |
3.7 |
26 |
Dec-11 |
11.9 |
3.5 |
12.4 |
3.4 |
13.3 |
3.4 |
Table 8 : Factors that Explain the Total Variability |
Round No. |
Survey Quarter |
Current |
Three-month Ahead |
One-year Ahead |
16 |
Jun-09 |
City, Gender, Category, Age |
City, Gender, Category |
City, Category, Age |
17 |
Sep-09 |
City, Age |
City, Age |
City, Age |
18 |
Dec-09 |
City, Category, Age |
City, Age |
City |
19 |
Mar-10 |
City, Category, Age |
City, Category |
City, Category |
20 |
Jun-10 |
City, Category, Age |
City, Category, Age |
City, Category, Age |
21 |
Sep-10 |
City, Gender, Category, Age |
City, Gender, Category |
City, Category |
22 |
Dec-10 |
City, Category |
City, Category |
City, Category |
23 |
Mar-11 |
City, Category |
City, Category |
City, Category, Age |
24 |
Jun-11 |
City, Category |
City, Category |
City, Category |
25 |
Sep-11 |
City, Gender, Category |
City, Category |
City, Gender, Category |
26 |
Dec-11 |
City, Category |
City, Category, Age |
City, Category |
Note: Results based on exercise using Analysis of Variance. |
Table 9: Various Group-wise Inflation Expectations for December 2011 Survey Round |
|
Current |
Three-month Ahead |
One-year Ahead |
Mean |
Std. Dev |
Mean |
Std. Dev |
Mean |
Std. Dev |
Gender-wise |
Male |
11.6 |
3.6 |
12.2 |
3.5 |
13.1 |
3.3 |
Female |
12.2 |
3.4 |
12.7 |
3.4 |
13.4 |
3.5 |
Category-wise |
|
|
|
|
|
|
Financial Sector Employees |
11.4 |
3.3 |
11.8 |
3.5 |
12.8 |
3.4 |
Other Employees |
11.8 |
3.4 |
12.4 |
3.3 |
13.1 |
3.5 |
Self Employed |
11.2 |
3.8 |
12.0 |
3.5 |
12.8 |
3.3 |
Housewives |
12.3 |
3.5 |
12.8 |
3.3 |
13.7 |
3.3 |
Retired Persons |
11.8 |
3.4 |
12.2 |
3.5 |
13.2 |
3.4 |
Daily Workers |
12.5 |
3.6 |
12.9 |
3.6 |
13.8 |
3.4 |
Other category |
11.9 |
3.4 |
12.4 |
3.4 |
13.2 |
3.3 |
Age-wise |
|
|
|
|
|
|
Up to 25 years |
12.5 |
3.5 |
13.0 |
3.5 |
13.6 |
3.5 |
25 to 30 years |
11.7 |
3.4 |
12.3 |
3.2 |
13.2 |
3.2 |
30 to 35 years |
11.8 |
3.7 |
12.3 |
3.6 |
13.2 |
3.5 |
35 to 40 years |
11.7 |
3.5 |
12.4 |
3.3 |
13.1 |
3.6 |
40 to 45 years |
11.9 |
3.6 |
12.6 |
3.2 |
13.4 |
3.1 |
45 to 50 years |
11.9 |
3.6 |
12.4 |
3.5 |
13.2 |
3.2 |
50 to 55 years |
11.7 |
3.6 |
12.4 |
3.2 |
13.3 |
3.1 |
55 to 60 years |
11.6 |
3.4 |
11.8 |
3.8 |
12.9 |
3.3 |
60 years and above |
11.8 |
3.3 |
12.1 |
3.6 |
13.1 |
3.5 |
City-wise |
|
|
|
|
|
|
Mumbai |
14.1 |
3.2 |
14.1 |
4.0 |
15.5 |
2.2 |
Delhi |
11.4 |
3.0 |
11.9 |
3.5 |
12.8 |
3.1 |
Chennai |
11.2 |
1.9 |
12.2 |
1.9 |
11.3 |
4.1 |
Kolkata |
10.9 |
2.0 |
10.7 |
2.4 |
11.0 |
2.6 |
Bangalore |
15.8 |
1.8 |
16.0 |
1.5 |
16.1 |
1.2 |
Hyderabad |
11.9 |
2.8 |
12.4 |
2.8 |
12.7 |
2.7 |
Ahmedabad |
8.4 |
2.6 |
9.8 |
2.2 |
11.2 |
2.3 |
Lucknow |
12.9 |
3.0 |
13.9 |
2.7 |
14.7 |
2.3 |
Jaipur |
16.0 |
1.8 |
15.0 |
3.0 |
16.3 |
1.2 |
Bhopal |
8.4 |
2.5 |
10.5 |
2.5 |
13.0 |
2.9 |
Patna |
10.8 |
5.9 |
11.7 |
5.4 |
13.0 |
4.6 |
Guwahati |
10.4 |
0.6 |
11.6 |
1.4 |
13.7 |
1.8 |
All |
11.9 |
3.5 |
12.4 |
3.4 |
13.3 |
3.4 |
Table 10: Cross-tabulation of Current and Three-month Ahead Inflation Expectations |
(Number of respondents) |
|
Three-month ahead inflation rate (per cent) |
Current inflation rate (per cent) |
|
<1 |
1-2 |
2-3 |
3-4 |
4-5 |
5-6 |
6-7 |
7-8 |
8-9 |
9-10 |
10-11 |
11-12 |
12-13 |
13-14 |
14-15 |
15-16 |
>=16 |
No idea |
Total |
<1 |
|
1 |
|
|
|
|
|
|
|
1 |
1 |
|
|
|
|
|
|
|
3 |
1-2 |
1 |
10 |
9 |
6 |
7 |
|
|
|
|
|
|
|
|
|
|
|
|
|
33 |
2-3 |
|
|
3 |
12 |
7 |
4 |
|
|
|
2 |
2 |
3 |
|
|
|
|
|
|
33 |
3-4 |
|
|
|
2 |
4 |
8 |
4 |
|
|
1 |
|
|
|
|
|
|
1 |
|
20 |
4-5 |
|
|
|
1 |
8 |
6 |
6 |
12 |
2 |
3 |
1 |
1 |
|
|
1 |
1 |
1 |
|
43 |
5-6 |
|
|
|
|
1 |
7 |
6 |
21 |
14 |
6 |
2 |
|
|
1 |
|
|
|
|
58 |
6-7 |
|
|
|
|
|
|
9 |
45 |
26 |
20 |
2 |
|
|
|
1 |
|
|
|
103 |
7-8 |
3 |
|
|
|
|
1 |
6 |
33 |
53 |
42 |
14 |
1 |
1 |
2 |
3 |
2 |
2 |
|
163 |
8-9 |
1 |
|
|
|
|
|
1 |
16 |
43 |
106 |
25 |
1 |
1 |
|
|
|
|
1 |
195 |
9-10 |
8 |
|
1 |
|
1 |
|
|
3 |
19 |
96 |
232 |
77 |
24 |
2 |
1 |
1 |
3 |
1 |
469 |
10-11 |
10 |
|
|
1 |
1 |
|
1 |
2 |
3 |
61 |
211 |
324 |
137 |
36 |
16 |
2 |
2 |
8 |
815 |
11-12 |
3 |
|
|
|
|
|
|
|
|
2 |
16 |
107 |
173 |
32 |
11 |
2 |
4 |
4 |
354 |
12-13 |
5 |
|
|
|
|
|
|
|
1 |
1 |
4 |
5 |
61 |
193 |
23 |
4 |
6 |
5 |
308 |
13-14 |
1 |
|
|
|
|
|
|
|
|
|
1 |
3 |
3 |
32 |
90 |
13 |
3 |
3 |
149 |
14-15 |
|
|
|
|
|
1 |
1 |
|
|
|
|
1 |
4 |
3 |
28 |
64 |
42 |
2 |
146 |
15-16 |
2 |
|
|
|
|
|
2 |
|
|
|
1 |
|
|
|
8 |
24 |
88 |
|
125 |
>=16 |
14 |
|
|
|
4 |
|
2 |
2 |
4 |
8 |
2 |
5 |
5 |
3 |
18 |
24 |
889 |
3 |
983 |
Total |
48 |
11 |
13 |
22 |
33 |
27 |
38 |
134 |
165 |
349 |
514 |
528 |
409 |
304 |
200 |
137 |
1041 |
27 |
4000 |
Table 11 : Cross-tabulation of Current and One-year Ahead Inflation Expectations |
(Number of respondents) |
Current inflation rate (per cent) |
One-year ahead inflation rate (per cent) |
|
<1 |
1-2 |
2-3 |
3-4 |
4-5 |
5-6 |
6-7 |
7-8 |
8-9 |
9-10 |
10-11 |
11-12 |
12-13 |
13-14 |
14-15 |
15-16 |
>=16 |
No idea |
Total |
<1 |
|
|
|
|
1 |
|
|
|
|
|
|
2 |
|
|
|
|
|
|
3 |
1-2 |
1 |
|
4 |
6 |
8 |
6 |
|
|
|
2 |
|
1 |
|
|
3 |
1 |
1 |
|
33 |
2-3 |
1 |
|
2 |
1 |
7 |
3 |
1 |
1 |
|
4 |
1 |
5 |
2 |
1 |
2 |
|
2 |
|
33 |
3-4 |
|
|
|
|
|
5 |
2 |
2 |
|
3 |
3 |
1 |
1 |
2 |
|
1 |
|
|
20 |
4-5 |
|
|
|
|
1 |
3 |
3 |
10 |
1 |
12 |
5 |
2 |
2 |
|
1 |
1 |
2 |
|
43 |
5-6 |
|
|
|
|
|
4 |
5 |
3 |
5 |
19 |
8 |
5 |
6 |
1 |
|
2 |
|
|
58 |
6-7 |
|
|
|
|
|
1 |
8 |
8 |
22 |
24 |
18 |
8 |
8 |
4 |
|
2 |
|
|
103 |
7-8 |
2 |
|
|
|
|
1 |
11 |
20 |
23 |
32 |
27 |
21 |
9 |
4 |
4 |
3 |
6 |
|
163 |
8-9 |
2 |
|
|
|
|
|
1 |
22 |
33 |
33 |
50 |
26 |
18 |
3 |
1 |
2 |
2 |
2 |
195 |
9-10 |
11 |
|
|
|
|
|
|
5 |
24 |
59 |
55 |
131 |
66 |
42 |
31 |
20 |
18 |
7 |
469 |
10-11 |
10 |
|
1 |
|
|
|
1 |
2 |
8 |
36 |
152 |
55 |
211 |
81 |
93 |
90 |
61 |
14 |
815 |
11-12 |
11 |
|
|
|
|
|
|
1 |
|
3 |
16 |
70 |
83 |
92 |
24 |
13 |
34 |
7 |
354 |
12-13 |
17 |
1 |
|
|
|
|
|
|
1 |
4 |
|
16 |
64 |
40 |
111 |
17 |
26 |
11 |
308 |
13-14 |
8 |
|
|
|
|
|
|
|
|
1 |
1 |
4 |
5 |
40 |
18 |
47 |
21 |
4 |
149 |
14-15 |
1 |
|
|
|
|
|
|
|
|
|
1 |
2 |
2 |
3 |
16 |
33 |
85 |
3 |
146 |
15-16 |
|
|
|
|
|
|
|
|
|
|
|
|
1 |
1 |
4 |
13 |
106 |
|
125 |
>=16 |
4 |
|
|
|
|
|
1 |
1 |
|
|
|
1 |
|
1 |
1 |
12 |
959 |
3 |
983 |
Total |
68 |
1 |
7 |
7 |
17 |
23 |
33 |
75 |
117 |
232 |
337 |
350 |
478 |
315 |
309 |
257 |
1323 |
51 |
4000 |
Chart 3 : Relationship in the perception level of current inflation with future expectations |
 |
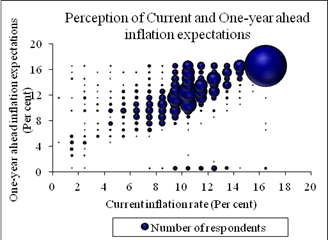 |
Chart 4 : Respondents’ view on RBI's Action to Control Inflation |
 |
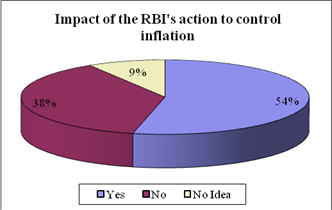 |
Chart 5 : Category-wise Awareness on RBI's Action on Inflation Control |
 |
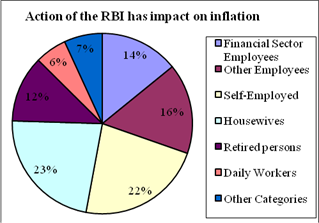 |
Table 12: Category-wise Responses on the Impact of RBI’s
Action on Inflation Control |
Category of Respondents |
Impact of RBI's action for inflation control (percent of respondents*) |
Yes |
No |
No Idea |
Financial Sector Employees |
52.9 |
40.3 |
6.8 |
Other Employees |
48.6 |
40.1 |
11.3 |
Self-employed |
51.9 |
40.0 |
8.1 |
Housewives |
57.0 |
34.4 |
8.5 |
Retired Persons |
51.7 |
39.9 |
8.4 |
Daily Workers |
54.3 |
33.3 |
12.3 |
Other Category |
68.8 |
24.7 |
6.5 |
| * Respondents who felt that RBI is taking necessary action to control inflation |
Table 13 : Respondent's Expectation on Change in Wage/Income level |
(Percentage of Response) |
Category of Respondents |
Change in income since
last year |
Change in income in
three-month ahead
period |
Change in income in one- year ahead period |
Increase |
Same |
Decrease |
Increase |
Same |
Decrease |
Increase |
Same |
Decrease |
Financial Sector Employees |
56.9 |
39.3 |
3.8 |
33.1 |
64.8 |
2.2 |
79.7 |
18.4 |
1.9 |
Other Employees |
41.5 |
56.7 |
1.8 |
22.8 |
76.2 |
1.0 |
76.6 |
22.2 |
1.3 |
Total Employees |
47.2 |
50.3 |
2.5 |
26.6 |
72.0 |
1.4 |
77.7 |
20.8 |
1.5 |
Self Employed |
38.1 |
52.2 |
9.7 |
23.9 |
71.7 |
4.4 |
66.1 |
30.1 |
3.8 |
Daily Workers |
35.3 |
58.6 |
6.0 |
17.8 |
77.0 |
5.2 |
65.5 |
29.3 |
5.2 |
Total |
41.8 |
52.4 |
5.8 |
24.2 |
72.7 |
3.1 |
71.3 |
25.7 |
2.9 |
|
 IST,
IST,


