The Inflation Expectations Survey of Households for December - 2015 (42nd round) captures the inflation expectations of 4,828 urban households across 16 cities, for the next three month period and the next one year period. These expectations are based on their individual consumption baskets and hence these rates should not be considered as benchmark of official measure of inflation. The households’ inflation expectations provide useful directional information on near-term inflationary pressures and also supplement other economic indicators. Highlights: -
In terms of qualitative response, the proportion of respondents expecting price rise by ‘more than current rate’ for prices in general as well as prices in all product groups (except cost of services) have decreased marginally as compared with previous round of survey for both three-month ahead period and one-year ahead period (Table 2). However, proportion of respondents expecting price rise by ‘similar to current rate’ for prices in general as well as prices in all product groups have increased as compared with previous round of survey for both three-month ahead period and one-year ahead period. -
In terms of quantitative responses, common respondents’ expect similar level of inflation as their current inflation perceptions, for three-month ahead period based on their own consumption and buying experiences (Chart 1). 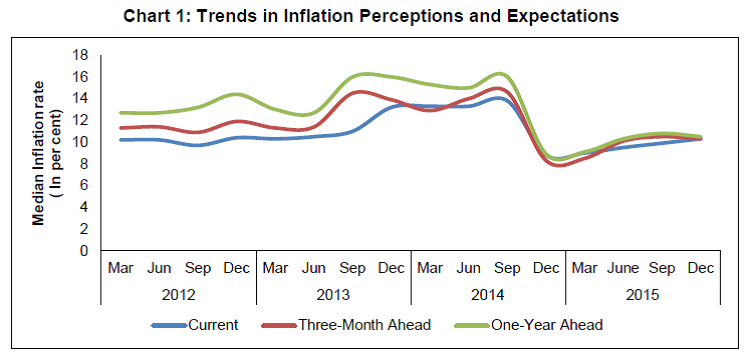 - The survey shows that self-employed, retired persons and daily workers have comparatively higher inflation expectations for three month ahead period based on median inflation rates. Respondents from Guwahati, Ahmedabad, Chennai, Jaipur and Bhubaneswar expect relatively higher inflation for next three months.
| Table 1: Respondents’ Profile (Category): Share in Total Sample | | Category of Respondents | Share in Total (%) | Target Share (%) | | Financial Sector Employees | 10.4 | 10.0 | | Other Employees | 15.4 | 15.0 | | Self-employed | 20.0 | 20.0 | | Housewives | 29.5 | 30.0 | | Retired Persons | 9.5 | 10.0 | | Daily Workers | 9.7 | 10.0 | | Others | 5.5 | 5.0 | | Note: The above sample proportion is for the round ended December, 2015 survey |
| Table 2: Product-wise Expectations of Prices for Three-month ahead and One-year ahead | | (Percentage of respondents) | | Round No./survey period | 38 | 39 | 40 | 41 | 42 | 38 | 39 | 40 | 41 | 42 | | (Round ended) → | Dec-14 | Mar-15 | Jun-15 | Sep-15 | Dec-15 | Dec-14 | Mar-15 | Jun-15 | Sep-15 | Dec-15 | | Options: General | Three month Ahead | One year Ahead | | Prices will increase | 72.4 | 73.6 | 81.0 | 81.1 | 85.4 | 79.8 | 82.2 | 90.9 | 89.0 | 90.0 | | Price increase more than current rate | 25.7 | 28.3 | 34.4 | 32.1 | 31.5 | 32.1 | 32.9 | 41.7 | 38.8 | 36.2 | | Price increase similar to current rate | 27.0 | 24.0 | 24.3 | 22.1 | 31.3 | 29.9 | 28.8 | 28.8 | 24.8 | 30.0 | | Price increase less than current rate | 19.8 | 21.2 | 22.3 | 26.9 | 22.6 | 17.8 | 20.6 | 20.4 | 25.4 | 23.8 | | No change in prices | 16.5 | 15.4 | 13.9 | 12.8 | 9.8 | 11.2 | 10.0 | 5.8 | 5.8 | 5.9 | | Decline in price | 11.0 | 11.1 | 5.2 | 6.1 | 4.8 | 9.0 | 7.8 | 3.3 | 5.2 | 4.0 | | Options: Food Product | Three month Ahead | One year Ahead | | Prices will increase | 72.3 | 74.4 | 83.1 | 82.0 | 84.6 | 79.9 | 82.4 | 91.9 | 87.6 | 89.8 | | Price increase more than current rate | 25.2 | 27.9 | 35.1 | 33.7 | 31.5 | 30.7 | 32.0 | 39.1 | 38.2 | 36.8 | | Price increase similar to current rate | 28.5 | 25.2 | 25.7 | 24.2 | 31.7 | 30.5 | 29.2 | 30.5 | 25.3 | 30.4 | | Price increase less than current rate | 18.5 | 21.3 | 22.3 | 24.1 | 21.4 | 18.7 | 21.1 | 22.3 | 24.0 | 22.6 | | No change in prices | 17.1 | 15.0 | 11.7 | 11.2 | 9.3 | 11.3 | 9.9 | 5.2 | 6.6 | 5.9 | | Decline in price | 10.6 | 10.6 | 5.3 | 6.9 | 6.0 | 8.9 | 7.7 | 3.0 | 5.8 | 4.3 | | Options: Non-Food Product | Three month Ahead | One year Ahead | | Prices will increase | 65.1 | 64.2 | 76.0 | 71.3 | 72.7 | 75.1 | 76.0 | 85.6 | 80.4 | 80.7 | | Price increase more than current rate | 21.2 | 21.7 | 27.7 | 24.7 | 21.9 | 26.1 | 25.8 | 31.7 | 29.0 | 26.1 | | Price increase similar to current rate | 26.1 | 24.0 | 26.3 | 22.7 | 29.2 | 30.6 | 28.4 | 30.3 | 23.6 | 29.8 | | Price increase less than current rate | 17.8 | 18.5 | 21.9 | 23.9 | 21.7 | 18.4 | 21.7 | 23.6 | 27.7 | 24.8 | | No change in prices | 25.6 | 24.6 | 20.6 | 22.4 | 21.8 | 16.6 | 16.3 | 11.2 | 13.8 | 15.0 | | Decline in price | 9.3 | 11.2 | 3.4 | 6.3 | 5.5 | 8.3 | 7.7 | 3.1 | 5.8 | 4.4 | | Options: Household Durables | Three month Ahead | One year Ahead | | Prices will increase | 59.7 | 68.2 | 69.1 | 63.3 | 67.9 | 72.1 | 77.6 | 82.2 | 75.5 | 77.0 | | Price increase more than current rate | 20.4 | 25.4 | 25.9 | 22.1 | 20.6 | 27.5 | 29.2 | 31.8 | 28.6 | 26.1 | | Price increase similar to current rate | 23.8 | 24.4 | 24.2 | 18.9 | 26.9 | 27.8 | 29.2 | 28.7 | 22.1 | 29.2 | | Price increase less than current rate | 15.6 | 18.4 | 19.0 | 22.3 | 20.4 | 16.8 | 19.2 | 21.7 | 24.8 | 21.6 | | No change in prices | 27.3 | 21.6 | 23.5 | 26.3 | 22.6 | 16.5 | 15.5 | 12.7 | 15.9 | 15.2 | | Decline in price | 13.0 | 10.2 | 7.4 | 10.5 | 9.5 | 11.4 | 6.9 | 5.2 | 8.6 | 7.8 | | Options: Housing Prices | Three month Ahead | One year Ahead | | Prices will increase | 78.4 | 83.2 | 81.4 | 77.8 | 79.6 | 86.1 | 90.3 | 90.1 | 87.3 | 87.7 | | Price increase more than current rate | 39.5 | 46.7 | 43.1 | 38.7 | 38.6 | 47.9 | 53.1 | 50.3 | 48.7 | 45.4 | | Price increase similar to current rate | 24.9 | 21.5 | 23.7 | 20.8 | 26.1 | 25.6 | 23.0 | 24.3 | 19.4 | 25.8 | | Price increase less than current rate | 13.9 | 14.9 | 14.5 | 18.3 | 14.9 | 12.6 | 14.2 | 15.5 | 19.2 | 16.5 | | No change in prices | 13.7 | 11.8 | 13.8 | 14.9 | 13.2 | 6.6 | 5.4 | 6.5 | 7.0 | 7.0 | | Decline in price | 7.9 | 5.0 | 4.8 | 7.3 | 7.2 | 7.3 | 4.4 | 3.4 | 5.8 | 5.3 | | Options: Cost of Services | Three month Ahead | One year Ahead | | Prices will increase | 71.6 | 78.5 | 79.9 | 72.0 | 80.2 | 81.8 | 86.9 | 89.7 | 84.9 | 89.8 | | Price increase more than current rate | 28.4 | 32.7 | 34.2 | 28.4 | 33.2 | 34.7 | 37.6 | 39.5 | 36.9 | 38.1 | | Price increase similar to current rate | 26.6 | 25.7 | 26.7 | 20.7 | 28.3 | 30.0 | 29.5 | 29.7 | 22.1 | 29.8 | | Price increase less than current rate | 16.6 | 20.0 | 19.1 | 22.9 | 18.8 | 17.2 | 19.9 | 20.5 | 25.8 | 21.9 | | No change in prices | 21.7 | 17.9 | 18.0 | 23.4 | 16.3 | 11.6 | 9.7 | 8.2 | 10.6 | 7.2 | | Decline in price | 6.7 | 3.6 | 2.1 | 4.7 | 3.5 | 6.6 | 3.3 | 2.1 | 4.5 | 3.0 |
Table 3: Households Expecting General Price Movements in Coherence with Movements in
Price Expectations of Various Product Groups: Three-month ahead and One-year ahead | | (Percentage of respondents) | | Round No. | Survey period ended | Food | Non-Food | Households durables | Housing | Cost of services | | Three-month Ahead | | 38 | Dec-14 | 62.0 | 51.9 | 48.5 | 48.3 | 49.5 | | 39 | Mar-15 | 68.8 | 57.3 | 43.3 | 43.1 | 47.5 | | 40 | Jun-15 | 67.8 | 51.3 | 47.2 | 48.4 | 52.2 | | 41 | Sep-15 | 70.0 | 58.9 | 50.8 | 53.0 | 55.9 | | 42 | Dec-15 | 72.6 | 58.6 | 51.1 | 52.8 | 59.1 | | One-year Ahead | | 38 | Dec-14 | 66.8 | 57.8 | 53.5 | 53.3 | 56.6 | | 39 | Mar-15 | 70.5 | 61.8 | 51.5 | 52.0 | 55.8 | | 40 | Jun-15 | 70.2 | 62.2 | 58.5 | 59.8 | 62.8 | | 41 | Sep-15 | 69.5 | 60.4 | 54.7 | 59.0 | 60.0 | | 42 | Dec-15 | 76.8 | 63.2 | 58.8 | 60.2 | 65.8 |
| Table 4: Household Inflation Expectations -Current, Three-Month Ahead and One-year Ahead | | Survey Round | Survey period Ended | Inflation rate in Per cent | | Current | Three-month Ahead | One-year Ahead | | Mean | Median | Std. Dev. | Mean | Median | Std. Dev. | Mean | Median | Std. Dev. | | 38 | Dec-14 | 9.0 | 8.8 | 4.2 | 8.8 | 8.3 | 4.5 | 9.3 | 8.9 | 4.6 | | 39 | Mar-15 | 9.1 | 9.0 | 4.0 | 9.0 | 8.5 | 4.3 | 9.6 | 9.1 | 4.5 | | 40 | Jun-15 | 10.0 | 9.5 | 4.1 | 10.1 | 10.1 | 4.5 | 10.8 | 10.3 | 4.4 | | 41 | Sep-15 | 10.6 | 9.9 | 4.4 | 10.7 | 10.5 | 4.5 | 11.1 | 10.8 | 4.6 | | 42 | Dec-15 | 11.0 | 10.3 | 4.2 | 10.9 | 10.3 | 4.1 | 11.2 | 10.5 | 4.3 |
| Table 5: Factors that Explain the Total Variability | | Round No. | Survey period ended | Current | Three-month Ahead | One-year Ahead | | 38 | Dec-14 | City, Category | City, Category | City, Category | | 39 | Mar-15 | City | City | City | | 40 | Jun-15 | City, Category, Age-Group | City, Category, Age-Group | City, Category, Gender | | 41 | Sep-15 | City, Age-Group | City, Age-Group | City, Age-Group, Gender | | 42 | Dec-15 | City, Age-Group | City, Category, Age-Group | City, Age-Group | | Note: Results based on exercise using Analysis of Variance. |
| Table 6 : Various Group-wise Inflation Expectations for December 2015 Survey Round | | | Current | Three-month Ahead | One-year Ahead | | Mean | Median | Std. Dev. | Mean | Median | Std. Dev. | Mean | Median | Std. Dev. | | Gender-wise | | Male | 10.9 | 10.4 | 4.2 | 10.8 | 10.3 | 4.2 | 11.0 | 10.4 | 4.3 | | Female | 11.1 | 10.3 | 4.2 | 10.9 | 10.2 | 4.1 | 11.4 | 10.6 | 4.3 | | | | Financial Sector Employees | 10.8 | 10.0 | 4.2 | 10.5 | 9.7 | 4.2 | 11.1 | 10.2 | 4.3 | | Other Employees | 11.1 | 10.4 | 4.2 | 10.8 | 10.2 | 4.2 | 11.2 | 10.4 | 4.2 | | Self Employed | 11.2 | 10.6 | 4.2 | 11.1 | 10.6 | 4.2 | 11.3 | 10.7 | 4.3 | | Housewives | 10.9 | 10.2 | 4.2 | 10.9 | 10.2 | 4.1 | 11.1 | 10.4 | 4.4 | | Retired Persons | 11.3 | 10.5 | 4.2 | 11.1 | 10.6 | 4.2 | 11.5 | 11.0 | 4.4 | | Daily Workers | 11.2 | 10.5 | 4.1 | 11.1 | 10.6 | 4.1 | 11.4 | 10.9 | 4.2 | | Other category | 10.1 | 9.7 | 3.9 | 10.0 | 9.5 | 3.9 | 10.3 | 9.6 | 4.2 | | | | Up to 25 years | 10.2 | 9.7 | 4.0 | 10.2 | 9.7 | 3.9 | 10.4 | 9.7 | 4.1 | | 25 to 30 years | 10.9 | 10.3 | 4.1 | 10.9 | 10.3 | 4.2 | 11.2 | 10.5 | 4.3 | | 30 to 35 years | 10.9 | 10.2 | 4.2 | 10.9 | 10.2 | 4.2 | 11.2 | 10.5 | 4.3 | | 35 to 40 years | 10.9 | 10.3 | 4.3 | 10.7 | 10.1 | 4.3 | 11.0 | 10.3 | 4.3 | | 40 to 45 years | 11.3 | 10.6 | 4.3 | 11.2 | 10.6 | 4.2 | 11.6 | 10.8 | 4.4 | | 45 to 50 years | 11.7 | 10.7 | 4.2 | 11.3 | 10.6 | 4.2 | 11.7 | 11.1 | 4.4 | | 50 to 55 years | 11.4 | 10.9 | 4.1 | 11.0 | 10.6 | 3.9 | 11.5 | 11.2 | 4.2 | | 55 to 60 years | 11.5 | 10.9 | 4.2 | 11.2 | 10.9 | 4.2 | 11.2 | 10.9 | 4.5 | | 60 years and above | 11.7 | 11.1 | 4.3 | 11.5 | 11.0 | 4.2 | 11.9 | 11.5 | 4.4 | | | | Ahmadabad | 13.8 | 15.8 | 3.6 | 14.2 | 16.2 | 3.6 | 14.4 | 16.3 | 3.6 | | Bangalore | 9.9 | 9.7 | 3.6 | 8.3 | 9.0 | 2.9 | 9.6 | 9.4 | 3.7 | | Bhopal | 6.7 | 5.9 | 2.9 | 6.6 | 6.0 | 3.0 | 6.5 | 5.8 | 2.9 | | Bhubaneswar | 11.8 | 11.6 | 4.1 | 12.7 | 13.3 | 3.7 | 13.3 | 16.1 | 4.0 | | Chennai | 14.8 | 16.3 | 3.1 | 12.9 | 16.0 | 4.3 | 14.9 | 16.3 | 3.1 | | Delhi | 7.5 | 6.3 | 3.2 | 8.5 | 7.6 | 3.4 | 7.7 | 6.6 | 3.7 | | Guwahati | 14.9 | 16.3 | 3.3 | 14.5 | 16.3 | 3.6 | 15.4 | 16.3 | 2.7 | | Hyderabad | 9.2 | 9.1 | 2.8 | 9.2 | 9.3 | 2.6 | 10.0 | 9.6 | 3.0 | | Jaipur | 12.7 | 12.9 | 3.4 | 13.0 | 13.9 | 3.4 | 13.1 | 14.1 | 3.5 | | Kolhapur | 11.5 | 10.8 | 2.9 | 11.5 | 10.7 | 3.2 | 10.6 | 10.0 | 3.4 | | Kolkata | 11.9 | 10.8 | 3.8 | 12.0 | 11.8 | 4.2 | 11.8 | 10.5 | 4.0 | | Lucknow | 11.3 | 10.9 | 4.3 | 11.3 | 11.5 | 4.5 | 10.8 | 10.1 | 4.4 | | Mumbai | 11.1 | 10.6 | 3.2 | 11.2 | 10.6 | 3.2 | 11.2 | 10.7 | 3.4 | | Nagpur | 7.0 | 6.4 | 2.4 | 7.4 | 7.2 | 2.3 | 7.1 | 6.8 | 2.2 | | Patna | 9.5 | 9.4 | 1.8 | 10.2 | 10.0 | 1.8 | 10.2 | 10.0 | 1.7 | | Thiruvananthapuram | 11.8 | 12.5 | 4.8 | 10.0 | 10.5 | 4.5 | 11.6 | 11.9 | 4.9 | | All | 11.0 | 10.3 | 4.2 | 10.9 | 10.3 | 4.1 | 11.2 | 10.5 | 4.3 |
| Table 7: Cross-tabulation of Current and Three-month Ahead Inflation Expectations | | (Number of respondents) | | | Three-month Ahead inflation rate (per cent) | Current inflation
rate (per cent) | | <1 | 1-2 | 2-3 | 3-4 | 4-5 | 5-6 | 6-7 | 7-8 | 8-9 | 9-10 | 10-11 | 11-12 | 12-13 | 13-14 | 14-15 | 15-16 | >=16 | No idea | Total | | <1 | 5 | 0 | 0 | 0 | 0 | 0 | 0 | 0 | 0 | 0 | 0 | 0 | 0 | 1 | 0 | 0 | 2 | 0 | 8 | | 1-2 | 2 | 2 | 2 | 0 | 0 | 0 | 0 | 0 | 0 | 0 | 0 | 0 | 0 | 0 | 0 | 0 | 0 | 1 | 7 | | 2-3 | 4 | 6 | 11 | 2 | 1 | 1 | 0 | 1 | 0 | 1 | 0 | 0 | 0 | 0 | 0 | 0 | 0 | 0 | 27 | | 3-4 | 0 | 0 | 10 | 17 | 8 | 2 | 3 | 0 | 2 | 2 | 0 | 0 | 0 | 0 | 0 | 0 | 0 | 1 | 45 | | 4-5 | 0 | 0 | 17 | 22 | 45 | 30 | 45 | 13 | 5 | 11 | 0 | 0 | 1 | 0 | 2 | 0 | 1 | 4 | 196 | | 5-6 | 0 | 0 | 10 | 18 | 48 | 124 | 88 | 92 | 29 | 28 | 9 | 4 | 0 | 0 | 2 | 3 | 0 | 12 | 467 | | 6-7 | 0 | 0 | 0 | 10 | 35 | 45 | 62 | 47 | 47 | 19 | 6 | 1 | 0 | 0 | 1 | 2 | 1 | 3 | 279 | | 7-8 | 0 | 0 | 0 | 1 | 14 | 38 | 39 | 84 | 62 | 57 | 10 | 6 | 1 | 1 | 1 | 1 | 2 | 3 | 320 | | 8-9 | 0 | 0 | 0 | 7 | 2 | 13 | 12 | 34 | 69 | 72 | 25 | 10 | 3 | 1 | 5 | 5 | 1 | 3 | 262 | | 9-10 | 0 | 0 | 0 | 3 | 3 | 13 | 11 | 47 | 54 | 208 | 54 | 70 | 23 | 8 | 43 | 3 | 36 | 29 | 605 | | 10-11 | 0 | 0 | 0 | 2 | 5 | 22 | 6 | 11 | 26 | 43 | 207 | 63 | 63 | 20 | 22 | 18 | 29 | 30 | 567 | | 11-12 | 0 | 0 | 0 | 0 | 1 | 1 | 1 | 5 | 8 | 30 | 31 | 65 | 17 | 23 | 12 | 5 | 10 | 13 | 222 | | 12-13 | 0 | 0 | 0 | 0 | 0 | 0 | 2 | 1 | 4 | 10 | 36 | 6 | 28 | 15 | 16 | 7 | 3 | 1 | 129 | | 13-14 | 0 | 0 | 0 | 0 | 0 | 0 | 1 | 1 | 3 | 3 | 18 | 7 | 8 | 11 | 3 | 4 | 9 | 3 | 71 | | 14-15 | 0 | 0 | 0 | 0 | 4 | 2 | 1 | 4 | 4 | 14 | 25 | 13 | 9 | 10 | 47 | 26 | 55 | 10 | 224 | | 15-16 | 0 | 0 | 0 | 2 | 5 | 2 | 2 | 3 | 1 | 8 | 32 | 2 | 8 | 11 | 7 | 54 | 47 | 11 | 195 | | >=16 | 0 | 0 | 0 | 3 | 14 | 11 | 6 | 7 | 13 | 61 | 61 | 2 | 19 | 6 | 15 | 50 | 861 | 75 | 1204 | | Total | 11 | 8 | 50 | 87 | 185 | 304 | 279 | 350 | 327 | 567 | 514 | 249 | 180 | 107 | 176 | 178 | 1057 | 199 | 4828 |
| Table 8: Cross-tabulation of Current and One-year Ahead Inflation Expectations | | (Number of respondents) | | | One-year Ahead inflation rate (per cent) | Current inflation
rate (per cent) | | <1 | 1-2 | 2-3 | 3-4 | 4-5 | 5-6 | 6-7 | 7-8 | 8-9 | 9-10 | 10-11 | 11-12 | 12-13 | 13-14 | 14-15 | 15-16 | >=16 | No idea | Total | | <1 | 5 | 0 | 0 | 0 | 0 | 0 | 0 | 0 | 0 | 0 | 0 | 0 | 0 | 0 | 0 | 0 | 3 | 0 | 8 | | 1-2 | 0 | 4 | 1 | 0 | 1 | 0 | 0 | 0 | 0 | 0 | 0 | 0 | 0 | 0 | 0 | 0 | 0 | 1 | 7 | | 2-3 | 0 | 2 | 14 | 9 | 0 | 0 | 0 | 0 | 0 | 0 | 0 | 0 | 0 | 0 | 0 | 0 | 0 | 2 | 27 | | 3-4 | 0 | 0 | 6 | 18 | 13 | 0 | 0 | 0 | 0 | 0 | 0 | 0 | 0 | 0 | 0 | 0 | 0 | 8 | 45 | | 4-5 | 0 | 0 | 5 | 16 | 52 | 64 | 2 | 1 | 0 | 0 | 0 | 0 | 0 | 0 | 0 | 0 | 2 | 54 | 196 | | 5-6 | 0 | 0 | 11 | 18 | 57 | 126 | 199 | 3 | 0 | 0 | 0 | 0 | 0 | 0 | 0 | 0 | 1 | 52 | 467 | | 6-7 | 0 | 0 | 0 | 5 | 33 | 44 | 60 | 108 | 0 | 0 | 0 | 0 | 0 | 0 | 0 | 0 | 6 | 23 | 279 | | 7-8 | 0 | 0 | 1 | 1 | 11 | 22 | 40 | 80 | 133 | 1 | 0 | 0 | 2 | 0 | 0 | 0 | 4 | 25 | 320 | | 8-9 | 0 | 1 | 0 | 0 | 5 | 7 | 10 | 28 | 45 | 127 | 6 | 3 | 2 | 0 | 0 | 1 | 5 | 22 | 262 | | 9-10 | 0 | 0 | 0 | 1 | 4 | 8 | 5 | 36 | 44 | 199 | 171 | 1 | 1 | 0 | 0 | 1 | 56 | 78 | 605 | | 10-11 | 0 | 0 | 0 | 0 | 3 | 4 | 4 | 27 | 46 | 64 | 177 | 161 | 1 | 1 | 0 | 2 | 43 | 34 | 567 | | 11-12 | 0 | 0 | 0 | 0 | 0 | 0 | 3 | 3 | 10 | 21 | 16 | 57 | 56 | 0 | 0 | 0 | 35 | 21 | 222 | | 12-13 | 0 | 0 | 0 | 0 | 0 | 0 | 1 | 4 | 4 | 24 | 13 | 10 | 28 | 25 | 0 | 1 | 5 | 14 | 129 | | 13-14 | 0 | 0 | 0 | 0 | 0 | 0 | 0 | 1 | 1 | 9 | 5 | 7 | 1 | 25 | 8 | 0 | 9 | 5 | 71 | | 14-15 | 0 | 0 | 0 | 0 | 0 | 0 | 0 | 1 | 4 | 24 | 6 | 4 | 4 | 19 | 47 | 12 | 82 | 21 | 224 | | 15-16 | 0 | 0 | 0 | 0 | 0 | 1 | 0 | 0 | 0 | 21 | 3 | 12 | 9 | 6 | 22 | 48 | 55 | 18 | 195 | | >=16 | 0 | 0 | 0 | 0 | 0 | 0 | 0 | 1 | 3 | 14 | 6 | 7 | 3 | 5 | 19 | 9 | 1038 | 99 | 1204 | | Total | 5 | 7 | 38 | 68 | 179 | 276 | 324 | 293 | 290 | 504 | 403 | 262 | 107 | 81 | 96 | 74 | 1344 | 477 | 4828 |
|
 IST,
IST,


