Operation and Performance of Commercial Banks - আরবিআই - Reserve Bank of India
Operation and Performance of Commercial Banks
The year 2009-10 witnessed a relatively sluggish performance of the Indian banking sector with some emerging concerns with respect to asset quality and a slow deposit growth. Gross NPAs as ratio to gross advances for Scheduled Commercial Banks as a whole increased from 2.25 per cent in 2008-09 to 2.39 per cent in 2009-10. Notwithstanding the weakening asset quality, the Capital to Risk-Weighted Assets Ratio (CRAR) of Indian banks remained strong at 14.5 per cent, way above the regulatory minimum even after migration to the Basel II framework, providing banks with adequate cushion for emerging losses. In 2009-10, the profitability of Indian banks captured by the Return on Assets (RoA) was a notch lower at 1.05 per cent than 1.13 per cent during the previous year. Low levels of financial penetration and inclusion in the global comparison continued to be an area of concern for the Indian banking sector. In the short-term, the Indian banking sector needs to lend support to the process of economic recovery, while in the medium to long-term, it needs to transform itself to become more efficient and vibrant so as to ensure a more sustainable and inclusive pattern of economic growth. 1. Introduction 4.1 Commercial banks form the most important part of the Indian financial landscape in terms of their role in channelling credit to the commercial sector and facilitating the process of financial inclusion. With the onset of economic reforms, the commercial banking sector, which has retained its predominantly public character, has undergone a number of changes in terms of size, efficiency of operation and financial soundness. As per the analysis by the World Bank for 2005, prior to the outbreak of the global financial crisis, the operational efficiency and financial soundness of the Indian banking sector compared favourably with its Asian peer group countries as well as developed OECD countries.1 The global financial crisis, which left the banking sector of most developed and even developing countries weakened, had relatively limited impact on the Indian banking sector. The Report on Trend and Progress of Banking in India (RTP) - 2008-09 had concluded that while the Indian banking system largely withstood the pressures of the crisis, it was not expected to remain insulated from the slowdown of the Indian economy, which followed the crisis. The analysis of the banking sector in 2009-10 is thus crucial in understanding the nature and extent of medium- to long-term impact of the crisis on the Indian banking system. 4.2 This chapter discusses developments in the Indian banking sector in detail during 2009- 10 in a comparative perspective with the earlier year/s to bring out trends in balance sheets, financial performance and profitability, and financial soundness of the sector based on data of 81 Scheduled Commercial Banks (SCBs).2 The chapter also spells out key issues related to several aspects of operation of the Indian banking sector, such as financial inclusion, sectoral distribution of credit, spatial and regional distribution of banking services, customer services, technological development apart from separately analysing the trends in two segments closely related to the SCB sector, namely Regional Rural Banks and Local Area Banks. 2. Balance Sheet Operations of Scheduled Commercial Banks 4.3 In continuation of the trend observed during 2008-09, the growth in consolidated balance sheet of SCBs decelerated in 2009-10 (Tables IV.1 and IV.2). Foreign banks, in particular, witnessed a contraction in their asset size to the tune of 2.7 per cent in 2009-10 (Table IV.2). This contraction in the assets of foreign banks was a break in the trend observed in the recent past, when assets of foreign banks had posted an annual growth consistently exceeding 20 per cent. There was a slowdown in the growth of balance sheets of public sector banks (comprising nationalised banks and State Bank of India (SBI) group) as well as old private sector banks in 2009-10. The only exception was new private sector banks, which had underperformed their old counterparts in 2008-09, recorded accelerated growth in 2009-10.
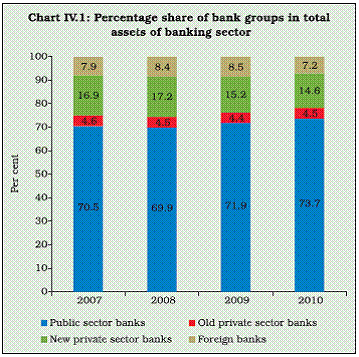
4.4 Consequent to the contraction in the balance sheet of the group of foreign banks, the share of foreign banks in total assets of the banking sector witnessed a decline in 2009-10 (Chart IV.1). There was also a decline in the share of new private sector banks in total assets of the banking sector. Despite the decelerated growth of assets of public sector banks, their relative share in the total assets of the banking sector posted an increase in 2009-10, while the share of old private sector banks stood almost unchanged at the last year’s level. Major Liabilities of SCBs Deposits 4.5 The slowdown in the growth of balance sheets in 2009-10 largely emanated from deposits, the major component of liabilities of SCBs (Tables IV.1 and IV.2). Bank deposits, which constituted around 78 per cent of the total liabilities of SCBs, registered a decelerated growth for the third consecutive year since 2007- 08. One of the factors responsible for a decline in the deposits growth in 2009-10 was the prevalence of low interest rates for a major part of the year.
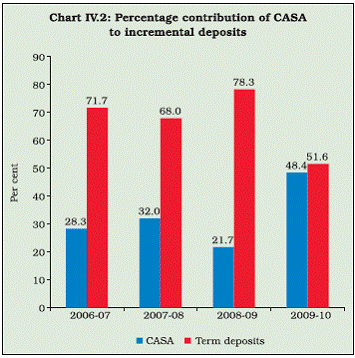
4.6 The composition of deposits, however, indicated significant changes in 2009-10 with the percentage of Current and Saving Accounts (CASA) increasing from 33.2 per cent to 35.4 per cent between 2008-09 and 2009-10 in contrast to the declining trend in the recent past. Moreover, unlike in the past, CASA contributed almost half of the incremental deposits in 2009-10 (Chart IV.2). Saving deposits alone contributed about 34 per cent to the total increment in deposits in 2009-10. The calculation of interest rate on a daily product basis by banks with effect from April 1, 2010 is expected to give a further boost to saving deposits. Borrowings 4.7 Borrowings, the major non-deposit liability for banks, constituted 8.7 per cent of their total liabilities in 2009-10. Similar to deposits, borrowings also recorded a sharp deceleration in growth adding to the overall slowdown in banks’ balance sheets in 2009-10 (Tables IV.1 and IV.2). A decline in the growth of borrowings could be seen across all bank groups but was most striking in the case of foreign banks (Table IV.2).
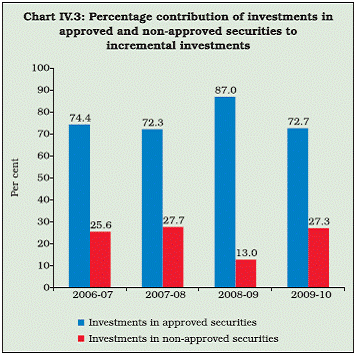
Major Assets of Scheduled Commercial Banks Bank Credit 4.8 In 2009-10, there was a decline in the growth in bank credit like in the previous year. Bank credit, which had reached a high of over 30 per cent in 2004-05, exhibited a continued decline in the subsequent years, reaching a low of 16.6 per cent in 2009-10. As deposits are the most important source of funds for banks, a slowdown in the growth of deposits was expected to translate itself into a slowdown in bank credit growth. Thus, notwithstanding the signs of recovery of the Indian economy and a low interest rate regime, on a year-on-year basis, bank credit growth registered a slowdown in 2009-10. However, on an intra-year basis, there were signs of a pick up in bank credit after November 2009, as economic recovery became more broad-based.3 Investments 4.9 In 2009-10, investments of SCBs, like bank credit, showed a deceleration in growth. Moreover, there was a perceptible change in the composition of investments of SCBs, as the percentage contribution of investments in approved securities to incremental investments showed a decline in 2009-10 in contrast to a striking increase in 2008-09, when banks had shown preference for low-risk investments following market uncertainties resulting from the global financial crisis (Chart IV.3).
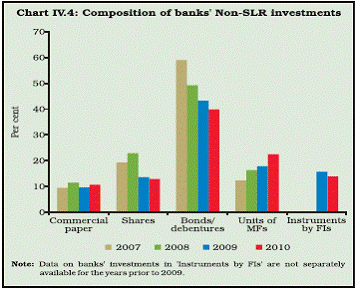
4.10 Non-SLR investments of banks, which include investments in mutual funds, bonds/ debentures, shares and commercial papers, showed significant increase in 2009-10. This increase in non-SLR investments was primarily on account of investments in mutual funds, which increased to the tune of 42.8 per cent during the year, though it showed large intrayear volatility (Table IV.3). Bonds and debentures, which constitute the largest portion of banks’ non-SLR investments, showed a declining trend in share in the recent years. The share of investments in shares, which had registered a steep fall in 2008-09 resulting from the subdued conditions in the capital market in the aftermath of the financial crisis, showed a further – although marginal – fall in 2009-10 (Chart IV.4). Thus, as against the waning importance of bonds/debentures and shares in the investment portfolio of banks, the share of investments in mutual funds showed a steady increase in the recent years.4
4.11 World over, banks’ involvement in mutual funds has increased significantly over the last two decades. Banks have emerged as conduits for Mutual Funds (MFs) diverting a large portion of their deposits towards investments in such funds as well as have been borrowing from these funds. However, there are issues concerning systemic stability related to the growing involvement of banks in mutual funds, which have been discussed in Box IV.1. International Liabilities and Assets of Scheduled Commercial Banks 4.12 Both international liabilities and assets of banks registered accelerated growth during 2009-10 (Tables IV.4 and IV.5). There was an increase by about 17 per cent in the international liabilities of banks (located in India) in 2009- 10, which far exceeded the growth of 7.4 per cent in their international assets. The surge in international liabilities during the year was primarily due to inflows through American/ Global Depository Receipts (ADRs/GDRs) and equities of banks held by non-residents. There was a fall in the inflows of FCNR(B)/NRE deposits in 2009-10. A steady fall in the benchmark London Inter-Bank Offered Rate (LIBOR) during 2009-10 resulting in a fall in the effective rate of interest payable on FCNR(B)/ NRE deposits could partly explain the fall in the FCNR(B)/NRE inflows in 2009-10. The fall could also be partly on account of an appreciation in the exchange rate of Indian rupee with respect to major international currencies during this period. Box IV.1: Inter-linkages between Scheduled Commercial Banks and Mutual Funds In advanced countries, such as the US, last two decades have seen an increasing involvement of banks in mutual funds channeling deposits mobilised from households towards investments in such funds. The growing exposure of banks to mutual funds could have a number of systemic implications arising out of the quantum, direction and concentration of such investments. An analysis of inter-linkages between banks and Debt- Oriented Mutual Funds (DOMFs) was carried out in the Indian context using monthly data under OSMOS returns, money market data received from Clearing Corporation of India Limited (CCIL). The analysis was restricted to Debt Oriented funds as these funds make up almost the whole of banks’ investments in MFs. The analysis covered data on banks’ investments in MFs and MFs’ investments in banks through the money market (Repo/CBLO) and Certificates of Deposits (CDs). The time period chosen for this analysis was from December 2008 to November 2009. The major conclusions emerging from this analysis were the following: First, there was a significant growth in banks’ investments in DOMFs during the period of analysis. Growth in investments in DOMFs was higher than the growth observed in the total investments of SCBs as well as their total non-SLR investments during this period (Table below). Secondly, banks were net borrowers since December 2008 and not net lenders to MFs. The net borrowing by SCBs from MFs for November 2009 was `1,56,317 crore. This was arrived at by taking the difference between the investments by banks in DOMFs and MFs’ funds with SCBs (including investments in Certificates of Deposits (CDs) and MFs’ placements in Repo and CBLO that were held by banks). Thirdly, all the banks investing in DOMFs were domestic and did not include any foreign bank. When banks were arranged in a descending order by the amount of their net borrowings from MFs, public sector banks figured prominently at the upper end as major borrowers, while the new private sector banks along with SBI could be seen as major lenders to MFs. Finally, in terms of concentration, more than 90 per cent of total investments in DOMFs by SCBs, which was held by 14 banks in November 2008, increased to 24 banks in November 2009.
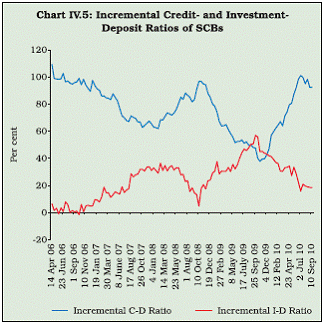
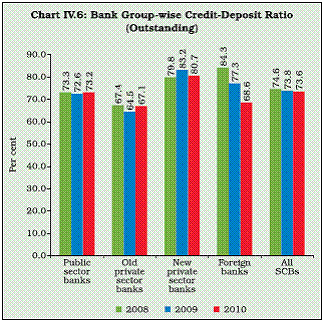
Consolidated International Claims 4.13 There was a perceptible slowdown in the growth of consolidated international claims of banks (based on immediate country risk) from 32.6 per cent in 2008-09 to 3.7 per cent in 2009-10. The (residual) maturity composition remained almost unchanged between 2008-09 and 2009-10 with claims having short term maturity (of less than a year) comprising about two-thirds of the total international claims indicating a preference of Indian banks towards short-term international loans and investments (Table IV.6). 4.14 As regards the country-wise composition, the largest proportion of the total international claims of Indian banks was accounted for by the US followed by the UK (Table IV.7). However, there was a fall in the absolute quantum as well as relative proportion of claims held by Indian banks on the US in 2009-10. This was in contrast to 2008-09, the year of financial crisis, when Indian banks’ claims on the US had witnessed a steep increase, partly a reflection of the tight liquidity conditions prevailing then in the US markets. Credit-Deposit and Investment-Deposit Ratios of Scheduled Commercial Banks 4.15 In 2009-10, the series of incremental credit-deposit and investment-deposit ratios drifted away from each other since mid-October 2009 reflecting banks’ growing preference for credit over investments (Chart IV.5). The outstanding credit-deposit ratio at end-March 2010 was marginally lower at 73.6 per cent as compared to 73.8 per cent at end-March 2009. Conversely, the investment-deposit ratio was marginally higher at 36.2 per cent at end-March 2010 as compared to 35.7 per cent at end March 2009. Foreign banks, which had the highest (outstanding) credit-deposit ratio, witnessed a steep fall in this ratio between 2008 and 2009, and then further between 2009 and 2010.5 At end-March 2010, foreign banks along with old private sector banks were in the lowest brackets with regard to credit-deposit ratio in comparison with public and new private sector banks (Chart IV.6). Maturity Profile of Assets and Liabilities of Banks 4.16 The asset liability management by banks is critically dependent on the maturity profile of their assets and liabilities. As banks generally raise resources through short-term liabilities to finance assets ranging from short- to long-term, the liquidity and credit risks get multiplied particularly during the periods of crisis. 4.17 The maturity profile of assets and liabilities of Indian banks in general shows greater reliance on short-term deposits matched by short- and medium-term loans and advances, and long-term investments on the assets side. In 2009-10, there was a shift towards the short- (up to 1 year) and medium-term (over one and up to three years) deposits mobilised by banks (Table IV.8). As already noted, there was an increase in the share of CASA in 2009-10. Concurrently, there was a decline in the share of deposits with long-term maturity of over three years. While the maturity distribution of loans and advances remained largely unchanged in 2009-10, there was a shift in favour of long-term investments by banks. 4.18 The asset liability mismatch was noticeable for public sector banks with a shift in their deposit liabilities during 2009-10 towards the short-term end of the maturity spectrum alongside a shift in their loans and investments towards the long-term end. Interestingly, new private sector banks, which normally relied heavily on short-term deposits, exhibited a shift in favour of medium- and longterm deposits in 2009-10, while their loans moved closer towards the short-term end of the spectrum.
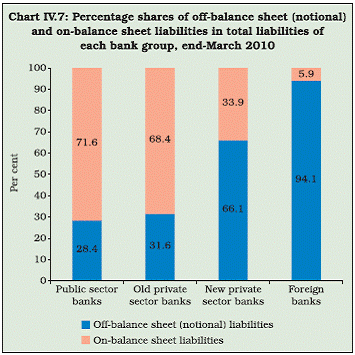
Off-Balance Sheet Operations of Scheduled Commercial Banks 4.19 Off-balance sheet operations of the banking system contributed in a major way in the aggravation of the global financial crisis and have thus been an important area of concern for financial regulators worldwide. In India, the Reserve Bank tightened the prudential norms for off-balance sheet exposures of banks, following which, there was a decline in this exposure by 23.1 per cent in 2008-09 breaking the trend of increase observed during the earlier period. In 2009-10, there was a further decline in the off-balance sheet exposure of banks, although the rate of decline was relatively lower at 5.6 per cent as compared to the previous year (Appendix Table IV.1). The decline in 2009-10, like in the previous year, was contributed by forward exchange contracts, which constituted the largest portion of the off-balance sheet liabilities of banks in India. 4.20 Among bank groups, off-balance sheet exposure was generally the largest for foreign banks. Notwithstanding the decline, the offbalance sheet exposure continued to be the largest for foreign banks at end-March 2010 constituting – in notional terms – about 1,599 per cent of their on-balance sheet liabilities (Appendix Table IV.1). Off-balance sheet (notional) liabilities occupied a share of 94.1 per cent in the total (on- plus off-balance sheet (notional)) liabilities of foreign banks at end- March 2010 (Chart IV.7). In contrast, for public sector banks, off-balance sheet (notional) liabilities held a share of 28.4 per cent in their total liabilities.
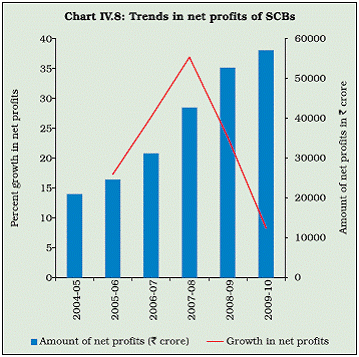
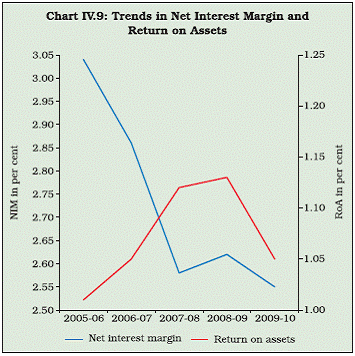
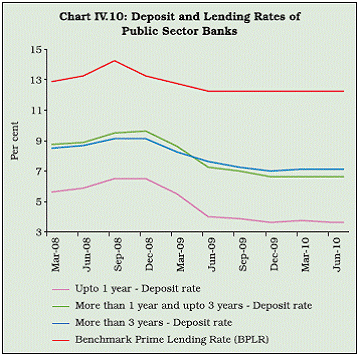
3. Financial Performance of Scheduled Commercial Banks 4.21 Similar to the slowdown in the balance sheets of SCBs, there were signs of a considerable slowdown in the income of SCBs in 2009-10. The slowdown in total income emanated from both interest and non-interest incomes of SCBs. Furthermore, there was a deceleration in the growth of total expenditure of SCBs in 2009-10 attributable mainly to a decline in the growth of interest expenditure (Table IV.9). 4.22 With the growth in both income and expenditure of SCBs recording a sharp decline, there was a slowdown in the growth of operating profits of SCBs in 2009-10. Operating profits recorded a growth of 10.4 per cent, while provisions and contingencies posted a relatively high growth of 12.3 per cent resulting in a low growth of 8.3 per cent in net profits of SCBs in 2009-10. The growth in net profits was on a steady rise during the four years up to 2007- 08. The growth in net profits, however, posted a fall in 2008-09, which became even steeper in 2009-10 (Chart IV.8). 4.23 During the last five years since 2005-06, the net interest margin of SCBs was by and large on a declining trend except for a marginal recovery in 2008-09 (Chart IV.9). Both deposit and lending rates of SCBs, which influence the net interest margin of banks, had shown a generally upward movement during the first half of 2008-09. These rates, however, were on a decline during the second half of the year following the accommodative monetary policy stance pursued by the Reserve Bank in the aftermath of the financial crisis. During a major part of 2009-10, the declining trend in the deposit rates of SCBs continued with the rates offered by public and private sector banks on deposits across the maturity spectrum showing a steady fall up to December 2009 (Chart IV.10).6 As part of calibrated exit, the Reserve Bank increased its Repo rate by 125 basis points (bps), Reverse Repo rate by 175 bps and CRR by 100 bps during February- September 2010. Taking cues from the changes, banks increased their deposit rates in the range of 25-125 bps across various maturities during the same period. As regards the lending rate, the Base Rate system replaced the Benchmark Prime Lending Rate (BPLR) system with effect from July 1, 2010 (Box IV.2). Prior to the shift to the Base Rate system, the BPLR of SCBs remained unchanged between July 2009 and July 2010. A subdued interest rate environment coupled with a low credit off-take for a major part of the year partly explained the decline in the net interest margin of banks in 2009-10.
4.24 Both cost as well return on funds of SCBs showed a decline in 2009-10. In particular, the decline in return on advances was most striking from 10.50 per cent in 2008-09 to 9.29 per cent in 2009-10. The decline in return on advances in 2009-10 was more prominent for foreign and new private sector banks (Table IV.10). 4.25 Similar to a decline in net interest margin, there was also a decline in the Return on Assets (RoA) in 2009-10, another indicator of profitability of the banking sector, which captures the amount of profits that can be generated from one unit of assets held by the banking sector. RoA (defined as net profits as per cent of average total assets) posted a fall in 2009-10 largely reflecting the significant slowdown in profits of banks in 2009-10 (Chart IV.9).7 Return on Equity (RoE), which reflects the banking sector’s efficiency in generating profits from every unit of equity, also showed a decline in 2009-10 (Table IV.11). 4.26 At the bank group level, the fall in both RoA and RoE in 2009-10 was the largest for foreign banks. On the contrary, in the case of new private sector banks, both these indicators of profitability posted an increase in 2009-10 (Table IV.11). Box IV.2: Base Rate System of Interest Rates –Features and Issues The system of Benchmark Prime Lending Rate (BPLR) introduced in 2003 was expected to serve as a benchmark rate for banks’ pricing of their loan products so as to ensure that it truly reflected the actual cost. However, the BPLR system fell short of its original objective of bringing transparency to lending rates. This was mainly because under the BPLR system, banks could lend below the BPLR. For the same reason, it was difficult to assess the transmission of policy rates of the Reserve Bank to lending rates of banks. In order to address these concerns, the Reserve Bank announced the constitution of the Working Group (Chairman: Shri Deepak Mohanty) on Benchmark Prime Lending Rate (BPLR) in the Annual Policy Statement of 2009-10 to review the BPLR system and suggest changes to make credit pricing more transparent. The Working Group submitted its Report on October 20, 2009. Based on the recommendations of the Group and the suggestions from various stakeholders, the Reserve Bank issued the Guidelines on the Base Rate system on April 9, 2010. Accordingly, the system of Base Rate came into effect since July 1, 2010. Base Rate includes all those elements of the lending rates that are common across all categories of borrowers. The actual lending rates charged to borrowers would be the Base Rate plus borrower-specific charges. The Base Rate is the minimum rate for all loans and as such, banks are not permitted to resort to any lending below the Base Rate except some specified categories such as (a) Differential Rate of Interest (DRI) advances; (b) loans to banks’ own employees; and (c) loans to banks’ depositors against their own deposits. Further, in the case of interest rate subvention given by Government to agricultural loans and rupee export credit, the actual lending rate can go below the Base Rate. In the case of restructured loans, if some of the Working Capital Term Loans (WCTL), Funded Interest Term Loans (FITL) need to be granted below the Base Rate for the purposes of viability and there are recompense clauses, such lending will not be construed as violating of the Base Rate guidelines.The interest rates on small loans up to `2 lakh were deregulated to increase the credit flow to small borrowers at reasonable rates. The Base Rate system is applicable to all new loans and to the old loans that come up for renewal. The existing loans based on the BPLR system may run till their maturity. The Reserve Bank on April 28, 2010 also deregulated the interest rate on rupee export credit with effect from July 1, 2010 and stipulated that the interest rate on rupee export credit could be priced at or above the Base Rate. The Base Rate system is expected to facilitate better pricing of loans, enhance transparency in lending rates and improve the assessment of transmission of monetary policy. For the system as a whole, the Base Rates were in the range of 5.50 – 9.00 per cent as on October 13, 2010 (Table below). During end-September and early-October 2010, several banks increased their base rates by 25-50 basis points. There has been a large degree of convergence of base rates as announced by banks. In the latest review, 48 banks with a share of 94 per cent in total bank credit fixed their base rates in the range of 7.50-8.50 per cent. In July 2010, over 40 banks with the share of 81 per cent in total bank credit had fixed their base rates in the range of 7.25-8.00 per cent.
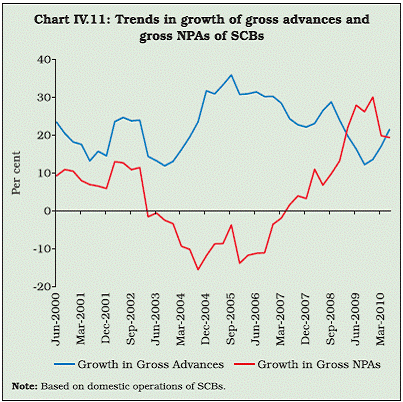
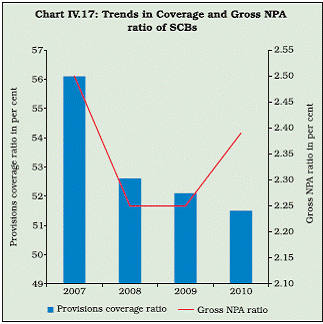
References: Reserve Bank of India (2010), Report of the Working Group on Benchmark Prime Lending Rate (Chairman: Shri Deepak Mohanty). Mohanty, Deepak (2010), “Perspectives on Lending Rates in India”, Speech delivered at the Bankers’ Club, Kolkata, RBI Bulletin, July. 4.27 The third major indicator of profitability of the banking sector namely, the spread – defined as the difference between return and cost of funds – also showed a marginal fall by about 0.10 percentage points in 2009-10 at the aggregate level. At the bank group level, the fall in the spread was again most striking for foreign banks (Table IV.10). 4. Soundness Indicators 4.28 Financial soundness of banks has an important bearing on the stability of the financial system as a whole. In the aftermath of the crisis, initiatives have been taken to strengthen the prudential regulatory framework across countries under the enhanced Basel II framework.8 Using three indicators of Capital to Risk Weighted Assets Ratio (CRAR), Non- Performing Assets and leverage ratio, this section analyses the financial soundness of Indian banks during the year 2009-10. Capital to Risk Weighted Assets Ratio 4.29 As discussed in the Report on Trend and Progress of Banking in India (RTP) -2008-09, the Indian banking system withstood the pressures of the global financial crisis and a factor that facilitated the normal functioning of the banking system even in the face of one of the largest global financial crisis was its robust capital adequacy. The CRAR of Indian banks under Basel I framework, which had been on a steady rise since 2007, posted a marginal increase during the crisis year, from 13.0 per cent at end-March 2008 to 13.2 per cent at end-March 2009. At end- March 2010, there was a further rise in the CRAR to 13.6 per cent (Table IV.12).9 4.30 As all commercial banks in India excluding RRBs and LABs have become Basel II compliant as on March 31, 2009, it is essential to also look at the capital adequacy position under this framework. Under Basel II, CRAR of Indian banks as at end-March 2009 stood at 14.0 per cent, far above the stipulated minimum ratio by the Reserve Bank of 9 per cent. This signified that Indian banks successfully managed to meet the increased capital requirement under the changed framework. Moreover, between end-March 2009 and 2010, there was an increase by about 0.5 percentage points in the CRAR of SCBs reflecting further strengthening of their capital adequacy under the new framework. 4.31 Core CRAR reflecting the paid up capital and reserves generally forms the prime measure of the financial strength of any bank. In the case of Indian banks, core capital (measured by Tier I capital) made up about 70 per cent of the total capital at end-March 2010. Core CRAR ratio of SCBs at end-March 2010 stood at 9.4 per cent and 10.1 per cent under Basel I and II frameworks, respectively, again much above the Reserve Bank’s stipulation of 6 per cent as under the Basel II framework, underlining the core capital strength of the Indian banking system (Table IV.13). 4.32 At the bank group-level, each bank group reported a CRAR ranging, on an average, above 12 per cent both under Basel I and II frameworks (Table IV.12). Under both frameworks, the level of CRAR was relatively high for foreign banks, which was about 4-6 percentage points above the levels reported by public sector banks. Foreign and private sector banks reported an increase in CRAR (under both Basel I and II) between 2009 and 2010. As against this, there was a decline in the capital adequacy ratio for the SBI group, while nationalised banks maintained their position with regard to capital adequacy during this period. Non-Performing Assets 4.33 While the capital adequacy of Indian banks remained robust, there were some emerging concerns with regard to the second important soundness indicator of banks of Non- Performing Assets (NPAs). Asset quality of Indian banks had generally seen a steady improvement as evident from a declining level of gross and net NPA ratio since 1999. The gross NPA ratio of SCBs placed at 14.6 per cent at end-March 1999, had declined steadily to 2.25 per cent at end-March 2008. During the crisis year 2008-09, the gross NPA ratio remained unchanged for Indian banks. However, during 2009-10, the gross NPA ratio showed an increase to 2.39 per cent (Table IV.14). After netting out provisions, there was a rise in the net NPA ratio of SCBs from 1.05 per cent at end-March 2009 to 1.12 per cent at end-March 2010. 4.34 It is noteworthy that the growth in NPAs of Indian banks has largely followed a lagged cyclical pattern with regard to credit growth (Chart IV.11). The empirical analysis taking growth rates of gross advances and gross NPAs since June 2000 indicated that NPA growth follows credit growth with a lag of two years.10 The coefficients of credit growth were positive and statistically significant from the second lag onwards reflecting that credit growth fed into growth in NPAs in a lagged manner. This underlined the pro-cyclical behaviour of the banking system, wherein asset quality can get compromised during periods of high credit growth and this can result in the creation of nonperforming assets for banks in the later years.
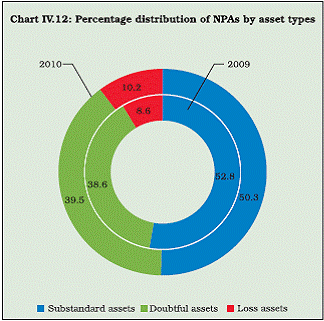
4.35 At the bank group level, the gross NPA ratio was the highest for foreign banks at end-March 2010 followed by private sector banks. On the other hand, it was the lowest for public sector banks. The increase in the gross NPA ratio between 2009 and 2010 could be seen across all bank groups except in the case of private sector banks. The increase in the gross NPA ratio during this period was perceptible for foreign banks (Table IV.14). 4.36 Apart from the increase in NPA ratio, there was also deterioration in the distribution of NPAs of SCBs between 2009 and 2010. This was evident from an increase in the percentage of loss making and doubtful assets of SCBs, which represented the lower end of the NPA spectrum (Table IV.15; Chart IV.12). The shift in the distribution of NPAs in favour of doubtful and loss making assets was more prominent in the case of foreign and new private sector banks as compared to public sector banks. 4.37 The sectoral distribution of NPAs showed a growing proportion of priority sector NPAs between 2009 and 2010 (Table IV.16). Priority sector NPAs, which constituted little over half of the total NPAs of domestic banks up to 2008, had shown a steep decline in 2009 attributable primarily to the Agricultural Debt Waiver and Debt Relief Scheme of 2008. Between 2009 and 2010, however, the share of priority sector NPAs in general, and small scale industries in particular, went up for domestic banks, partly a reflection of the impact of the financial crisis and the economic slowdown that had set in thereafter. At end-March 2010, the percentage of priority sector NPAs in total NPAs was 53.8 per cent for public sector banks as against 27.6 per cent for private sector banks (Appendix Tables IV.2 (A-C)). 4.38 The sectoral NPA ratio of banks also indicated a rise for priority and non-priority sectors between 2009 and 2010; the increase in NPA ratio for priority sector, however, was higher than that of the non-priority sector (Chart IV.13). 4.39 It is noteworthy that weaker sections comprising, among others, small and marginal farmers, Scheduled Castes and Tribes (SC/STs) have shown a steady decline in the NPA ratio in the recent years. This trend corroborates the point that weaker sections are in fact not less creditworthy than other sections and strengthens the argument for furthering the process of financial inclusion. At end-March 2010, the NPA ratio for weaker sections stood at 2.73 per cent for domestic banks, a little higher than the NPA ratio for non-priority sectors (Chart IV.14). The NPA ratio for weaker sections for public sector banks was higher at 3.0 per cent than 0.5 per cent for private sector banks at end-March 2010 (Appendix Tables IV.3 (A-B)).
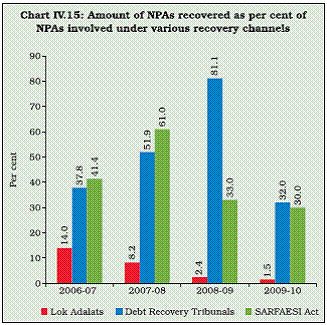
4.40 Among the various channels, the amount
of NPAs recovered under the Securitisation and
Reconstruction of Financial Assets and
Enforcement of Security Interest (SARFAESI)
Act, 2002 formed over half of the total amount
of NPAs recovered in 2009-10. The SARFAESI
Act has, thus, been the most important means
of recovery of NPAs. However, there has been a
steady fall in the amount of NPAs recovered
under SARFAESI Act as per cent of the total
amount of NPAs involved under this channel in
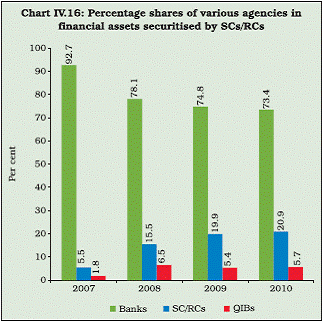
4.41 At end- June 2010, there were 13 registered Securitisation/Reconstruction Companies (SCs/RCs) in India. Of the total amount of assets securitised by these companies at end-June 2010, the largest amount was subscribed to by banks. However, there was a steady decline in the percentage share of banks in total value of securitised assets in the recent years, while the shares of both SCs/RCs and Qualified Institutional Buyers (QIBs) were on a rise (Table IV.18; Chart IV.16). This could partly be explained by trend of nonrealisation of Security Receipts (SRs) by SCs/ RCs within the stipulated period of five years (extended to eight years w.e.f. April 21, 2010) from the time of acquisition of the financial asset. This trend possibly led to waning of interest of commercial banks in subscribing to SRs of SCs/RCs. As the non-realised SRs remained on the books of SCs/RCs, their share continued to show a rise, while the share of commercial banks posted a decline.
4.42 The rise in NPAs was reflected in
increased amount of provisioning by banks in
2009-10. The amount of NPA provisioning of
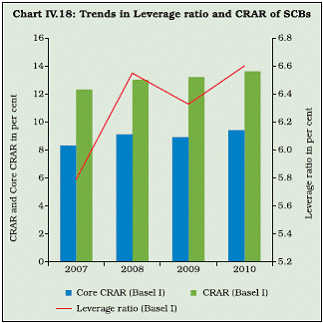
Leverage Ratio 4.43 Following the financial crisis, there have been deliberations at various international fora including the Basel Committee on Banking Supervision (BCBS) in its formulation of the enhanced Basel II framework about the need for a non-risk based measure for monitoring the leverage of the banking system.11 It has been argued that such a measure could supplement the existing risk-based measures and can introduce additional safeguards by putting a floor on the build up of leverage within the system. A simple measure is being used by countries, such as the US, to capture the most visible balance sheet leverage by taking the ratio of Tier I capital to total adjusted assets.12 Using a similar definition for the Indian banking system, the leverage ratio worked out to 6.6 per cent at end-March 2010.13 The leverage ratio showed an increase during recent years except for a marginal fall between 2008 and 2009. The consistent increase in both non-risk-based leverage ratio and risk-based CRAR as well as core CRAR in the recent years indicated the growing soundness of the Indian banking system (Chart IV.18).
5. Sectoral Distribution of Bank Credit 4.44 Sectoral distribution of bank credit provides an understanding of the contribution of bank credit towards economic growth and financial inclusion as well as its role in ensuring financial stability. Accordingly, this section highlights the general trends and relevant issues in sectoral distribution of bank credit in 2009-10 followed by detailed discussions on the trends in priority sector credit as well as retail credit and credit to certain sensitive sectors. 4.45 As discussed in Section 2, bank credit witnessed a slowdown on a year-on-year basis during 2009-10 continuing with the trend observed in the recent past. However, there were signs of pick up in growth of bank credit in general, and industrial credit in particular, following the recovery in the real sector. As shown in Chart IV.19, the growth in Index of Industrial Production (IIP), a proxy for the real economic activity, which is expected to largely impact the corporate sector loans of banks, showed signs of recovery from June 2009, but it consolidated only after October 2009 entering into the double digit zone. It was also the period when growth in industrial credit, and bank credit as a whole, began to increase. Taking monthly data on industrial credit and production from April 2006 onwards, the elasticity of industrial credit with respect to industrial production worked out to 2.08.14
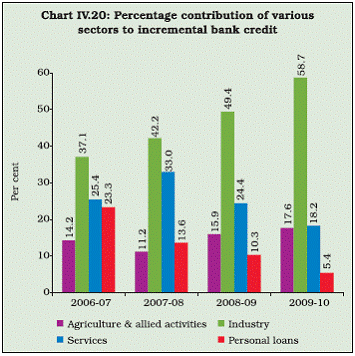
4.46 On the year-on-year basis, the main drivers of non-food bank credit during 2009-10 were the sectors of industry and agriculture. There was a considerable slowdown in credit to the services sector and personal loans during the year (Table IV.20).15 4.47 The general trend in the recent years has been the strengthening of the contribution from industrial credit to the increment in total bank credit. Between 2006-07 and 2009-10, the percentage contribution of industrial credit to total bank credit increased steadily from 37.1 per cent to 58.7 per cent (Chart IV.20). There was also a rising trend in the contribution of credit to agriculture and allied activities. On the other hand, personal loans, which were a major driver during the high credit growth phase of the mid-2000s, witnessed a decline in their percentage contribution. A decline could also be seen in the contribution from the services sector to the increment in total credit.
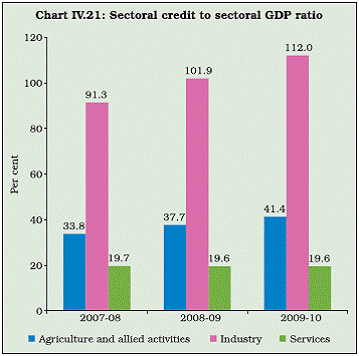
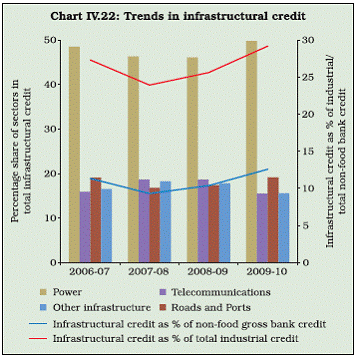
4.48 The sectoral credit to sectoral GDP ratio was the highest for the industrial sector (at 112 per cent) followed by agriculture (and allied activities) (at 41.4 per cent) and then services (at 19.6 per cent) in 2009-10 (Chart IV.21). During the recent years, the ratio was on a rising trend for industrial and agricultural sectors, while it was almost stagnant for the services sector.16 4.49 Given the importance of infrastructural development for economic growth, infrastructural financing has been an important area of concern for both Government and the Reserve Bank. Accordingly, a number of regulatory measures and concessions have been provided to banks including take out financing, relaxed asset classification norms and enhanced exposure ceilings for infrastructural lending. Infrastructural financing has been a growing component in banks’ credit portfolio in the recent years partly on account of such policy initiatives. Infrastructural credit as per cent of total non-food gross bank credit as well as total industrial credit has shown a steady increase from 2007-08 onwards. The largest component of infrastructural finance has been of power accounting for almost half the total infrastructural credit from banks in 2009-10 (Chart IV.22).
Credit to Priority Sectors 4.50 Priority sectors have been an integral part of bank credit delivery in India. Between 2009 and 2010, there was a growth in priority sector credit from domestic commercial banks of 18.4 per cent primarily due to the growth in agricultural credit. The growth in agricultural credit from domestic banks was to the tune of 22.6 per cent in 2009-10. Foreign banks, however, posted a much lower growth of 8.8 per cent in priority sector credit in 2009-10 than their domestic counterparts.
4.51 At end-March 2010, domestic (public and private sector) and foreign banks had more than met their overall priority sector lending targets of 40 and 32 per cent, respectively (Tables IV.21 and IV.22). However, at the disaggregated level, three out of 27 public sector banks and 2 out of 22 private sector banks could not meet the overall priority sector target in 2010. Further, three out of 27 foreign banks also could not meet the overall priority sector target (Appendix Tables IV.4 (A-C) and IV.5 (A-C)). 4.52 There were some concerns regarding the performance of domestic banks in meeting the sub-target (of 18 per cent) under agriculture. At the aggregate level, both public and private sector banks were below the sub-target of 18 per cent for agriculture at end-March 2010. At the disaggregated level, more than half of public sector banks (15 out of 27) and exactly half of the private sector banks (11 out of 22) could not meet the agricultural sub-target. Within private sector banks, the performance was relatively poor in the case of old private sector banks, while most new private sector banks were able to meet the sub-target under agriculture. Further, majority of the private sector banks (15 out of 22) could not meet the sub-target of 10 per cent under weaker sections. The performance of foreign banks in meeting the sub-targets under exports and Micro, Small and Medium Enterprises (MSME) sectors was significantly better with majority of the foreign banks being able to meet these targets in 2010.
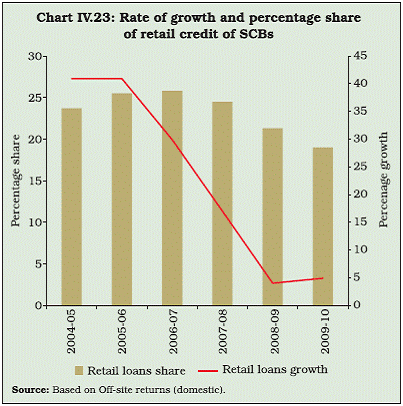
Retail Credit 4.53 Retail credit growth including personal loan portfolio of banks had shown a spurt between 2004-05 and 2005-06 but showed deceleration in the subsequent years (Chart IV.23). Retail credit growth posted only a marginal increase in 2009-10 (Table IV.23). 4.54 The marginal increase in retail credit growth between 2008-09 and 2009-10 was entirely attributable to the housing loan segment, which constituted the single-largest portion of total retail credit of Indian banks. The pick up in housing loan growth was partly on account of low interest rates that prevailed during most part of 2009-10 despite the fact that property prices, which had experienced a correction in 2008-09 immediately following the crisis, showed a spurt during 2009-10 (see Chart II.43, Page 53 from RBI Annual Report - 2009-10). Other retail segments such as consumer durables, auto loans and credit card receivables, however, recorded negative growth in 2009-10. Given that most retail sectors are rate-sensitive, credit to these sectors in future would be impacted by the emerging interest rate environment.
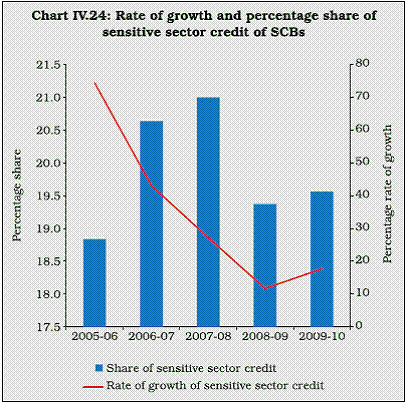
Credit to Sensitive Sectors 4.55 Capital market, real estate and commodities are deemed sensitive for the stability of the banking system on account of the price fluctuations in the related asset/ product markets. Credit to these sensitive sectors together constituted 19.6 per cent of the total bank credit at end-March 2010, with the real estate sector individually accounting for 16.6 per cent of this share (Appendix Table IV.6). 4.56 In the recent years, there has been a falling trend in both growth as well as share of credit to sensitive sectors except for a mild increase in 2009-10 (Chart IV.24). The fall in the share of credit to sensitive sectors, however, was mainly due to public sector banks (Appendix Table IV.6). Foreign banks, which had a much higher exposure to sensitive sectors than other bank groups, in fact, showed an increase in the share of credit given to these sectors.
6. Operations of Scheduled Commercial Banks in Capital Market 4.57 Capital market provides an important avenue to banks to raise resources for strengthening their capital base as well as to provide trading ground for bank stocks. Hence, in a liberalised and competitive environment, banks’ operations in the capital market have critical implications for the growth of their banking business. This section highlights the operations of banks in the primary and secondary capital markets.
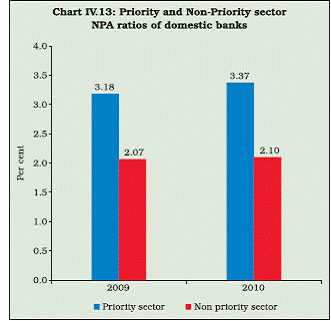
Banks’ Operations in the Primary Market 4.58 After abstaining during 2008-09, banks started resorting to capital market for raising resources in 2009-10. This revival in primary market resource mobilisation was a reflection of the easing of liquidity constraints witnessed during the previous year, a buoyant secondary market and improved investment demand by corporates (Table IV.24). 4.59 Given the concerns related to a slow pace of economic recovery in the industrialised economies and emergence of European sovereign debt crisis, mobilisation of resources by domestic banks from global capital markets showed no major signs of revival in 2009-10 like in the previous year (Table IV.25). There was resource mobilisation only to the tune of `843 crore through GDRs by private sector banks in 2009-10. 4.60 Given that private placements and public issues largely act as substitutes of one another in raising resources, in 2008-09, when there was no resource mobilisation through public issues in the domestic capital market, banks’ resource mobilisation through private placements had shown a significant increase by 34.6 per cent (Chart IV.25). Banks continued to raise funds through private placements in 2009-10 but the growth had abated to 15.8 per cent. The growth in mobilisation of resources through private placements in 2009-10 was attributable to private sector banks (Table IV.26).
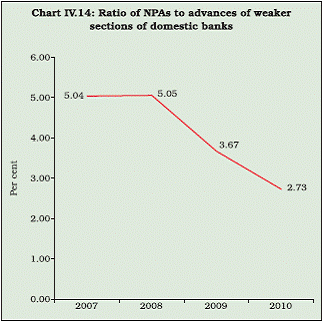
Performance of Banking Stocks in the Secondary Market 4.61 The domestic stock market, which had recorded significant losses in 2008-09 as a fallout of the financial crisis, registered phenomenal increase of 80.5 per cent in 2009- 10 outperforming many Emerging Market Economies (EMEs) largely a reflection of domestic economic recovery and resumption of FII flows. Though the Dubai-debt crisis and the uncertainty over the health of indebted euro-zone countries overshadowed the stock market sentiment in the beginning of the 2010, there was a general upward movement in stock prices throughout the year with the BSE Sensex reaching the pre-crisis level in mid- September 2010. 4.62 The BSE Bankex (representing the banking sector scrips) recorded larger gains than those in the BSE Sensex during 2009-10 reflecting the buoyancy in bank stocks (Table IV.27). However, while the returns were higher, the volatility of BSE Bankex, reflecting the risk in trading in these stocks, was also higher than that of BSE Sensex in 2009-10. 4.63 In line with the overall trend, all of the 39 listed banks recorded gains during 2009-10. The upward movement of prices of bank stocks was also reflected in increase of Price/Earning (P/E) ratios across most bank stocks. However, the increase in P/E ratio was much sharper in the case of scrips of private sector banks as compared to those of their public sector counterparts (Appendix Table IV.7). 4.64 After registering almost a doubling of their share in total capital market turnover between 2007-08 and 2008-09, bank stocks witnessed a decline in their share in total turnover in 2009- 10 and even in 2010-11 (between April and October 15) (Table IV.27). On the other hand, the share of bank stocks in total market capitalisation posted a rise since 2007-08. 7. Shareholding Pattern in Scheduled Commercial Banks 4.65 Though government shareholding in public sector banks had remained above 51 per cent during 2009-10, majority of the public sector banks (11 out of 21) were very close to the floor (Table IV.28; Appendix Table IV.8). This raised the important issue of recapitalisation in order to ensure continued credit creation by public sector banks if the statutory floor of 51 per cent for government shareholding had to be maintained.17 4.66 In public sector banks, the percentage of foreign shareholding was only up to 20 per cent. However, the extent of foreign shareholding in new private sector banks was much greater; three banks out of seven from this bank group had foreign shareholding exceeding 50 per cent (Table IV.29). 8. Technological Developments in Scheduled Commercial Banks 4.67 Developments in the field of Information Technology (IT) strongly support the growth and inclusiveness of the banking sector thereby facilitating inclusive economic growth. IT not only enhances the competitive efficiency of the banking sector by strengthening back-end administrative processes, it also improves the front-end operations and helps in bringing down the transaction costs for the customers. It has the potential of furthering financial inclusion by making small ticket retail transactions cheaper, easier and faster for the banking sector as well as for the small customers. The Reserve Bank has thus been actively involved in harnessing technology for the development of the Indian banking sector over the years. 4.68 The most fundamental way in which technology has changed the face of the Indian banking sector has been through computerisation. While new private sector banks and foreign banks have an edge in this regard, public sector banks have been investing for upgrading their operations by way of computerisation. Of the total number of public sector bank branches, 97.8 per cent were fully computerised at end-March 2010 (Table IV.30; Appendix Table IV.9). All branches of the SBI group were fully computerised. 4.69 The cumulative expenditure on ‘computerisation and development of communication networks’ by public sector banks from September 1999 to March 2010 aggregated to `22,052 crore (Appendix Table IV.10). On an annual basis, the expenditure on ‘computerisation and development of communication networks’ registered a growth of 23.2 per cent in 2009-10. 4.70 A technological development closely related to computerisation in bank branches is the adoption of the Core Banking Solutions (CBS). CBS enable banks to offer a multitude of customercentric services on a continuous basis from a single location, supporting retail as well as corporate banking activities thus making “onestop” shop for financial services a reality. An important development in 2009-10 was a significant increase in the percentage of branches of public sector banks implementing CBS. The percentage of such branches increased from 79.4 per cent at end-March 2009 to 90 per cent at end- March 2010 (Table IV.30). The percentage of branches under CBS was much larger for the SBI group as compared to nationalised banks (Appendix Table IV.9).
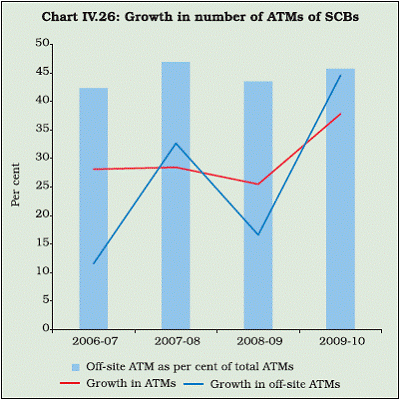
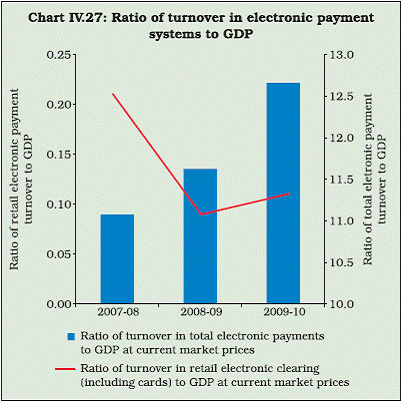
4.71 While computerisation in general, and CBS in particular, having reached near completion, it is important to leverage on to this technological advancement to look at areas beyond CBS that can help in not just delivering quality and efficient services to customers but also generating and managing information effectively. With regard to the second aspect of information management, a system of receiving data from banks by the Reserve Bank in an automated manner without any manual intervention is under examination; the benefits of this system are discussed in Box IV.3. 4.72 The third major technological development, which has revolutionised the delivery channel in the banking sector, has been the Automated Teller Machines (ATMs). ATMs, particularly off-site ATMs, act as substitutes for bank branches in offering a means of anytime cash withdrawal to customers. Growth in ATMs, which had been generally on a steady rise in the recent years, was observed to be 37.8 per cent in 2009-10. More importantly, the growth in offsite ATMs too was comparably high at 44.6 per cent during the year. At end-March 2010, the percentage of off-site ATMs to total ATMs stood at 45.7 per cent for all SCBs (Table IV.31; Chart IV.26; Appendix Table IV.11). Box IV.3: Automated Data Flow in the Banking Sector: World over, central banks and various regulatory bodies depend on information received from regulated entities which helps in discharging their responsibilities and functions in an efficient manner. It also enables them to frame appropriate policies. Information consists of data which should be collected based on the principles of integrity, reliability, and accuracy. This information is systematically and meaningfully derived from data. It is, therefore, pertinent that data and information reaches the regulators not only in a timely manner but also is free from errors and distortions. The requirement is, therefore, to ensure collation of quality data along with its processing and flow to the appropriate level in a timely manner. The concept of Automated Data Flow (ADF) seeks to fulfil this requirement in which data is seamlessly transmitted from the host systems to the recipient system without any intermediation, thus making the whole process more efficient, consistent and reliable. At the same time, as a major spin-off benefit, the system of automated data flow also streamlines the information sharing mechanism at the host level thus serving as a potent MIS tool and encourages good data management practices. IT should help banks not just to deliver robust and reliable services to their customers at a lower cost, but also generate and manage information effectively. Submission of consistent data in a timely manner by banks is significant for the Reserve Bank in discharging its regulatory and supervisory functions. The flow of data from banks to the Reserve Bank in an automated manner would not only ensure its timely availability but also provide a better information-environment for building an effective decision support system. Large volumes of data relating to customers and transactions are now available with banks, which can be gainfully utilised through proper analysis with an objective to tailoring business strategies, meeting diversified internal and external MIS requirements and building robust risk management systems. With computerisation of commercial banks having reached a plateau (even with regard to adoption of CBS), it has become possible to bring about a paradigm shift in the data flow and information sharing arrangements by harnessing the benefits of IT resources. The system of ADF would help in leveraging on these benefits and propel the information sharing system between banks and Reserve Bank to the next higher level. 4.73 There has been a steady increase in the ratio of total value of electronic payments to Gross Domestic Product (GDP) reflecting growing preference for the electronic mode of payments in the recent years (Chart IV.27). Among the various electronic modes of payment, the centralised version of Electronic Fund Transfer (EFT) – National EFT (NEFT) – has become an important means of retail payments, while the Real Time Gross Settlement (RTGS) has shown significant growth as a means of settling large value payments. The development of NEFT and RTGS has been compared and contrasted in Box IV.4.
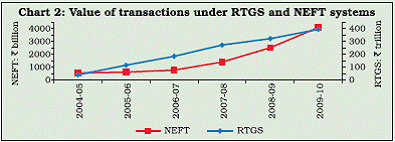
4.74 Going forward, there are a number of issues with regard to development of banking technology that need to be addressed. These relate to further improvement in back office management in the form of streamlining MIS, strengthening centralised processing, Customer Relationship Management (CRM) and IT Governance. The back office technological advancement would help in diverting banks’ resources more towards the front office management thereby increasing the customer focus of their services and support greater financial penetration and inclusion. Box IV.4: The Reserve Bank has taken a series of initiatives to facilitate use of electronic mode for various retail and large value transactions. RTGS is a large value payment system which processes both customer and inter-bank transactions of `1,00,000 and above, while the NEFT is essentially a retail system. Further, while RTGS is a realtime gross settlement arrangement, NEFT is a near-real time system with settlements taking place at hourly intervals. Both systems are operated by the Reserve Bank. The facility of RTGS and NEFT is available in over 70,000 branches with 119 members and 99 banks participating in the respective systems. The volume and value of transactions processed through the two systems has shown an impressive growth over the years (Charts 1 and 2). Considering the fact that RTGS is a large value payment system as against NEFT, the value of transactions processed in the former are much larger. However, the growth trend in the value of transactions in the two systems reveals that the amount of transactions processed in NEFT has increased exponentially since 2007-08, while RTGS has exhibited a relatively steady growth.
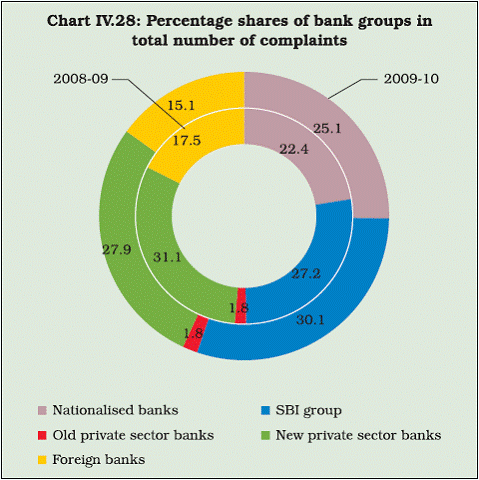
Bank group-wise analysis Bank group-wise data for 2008-09 and 2009-10 of RTGS and NEFT systems show that private sector banks were major participants in the systems and accounted for over one-third of total transactions. The SBI Group accounted for 22 per cent of the total transactions in the RTGS system but their presence in NEFT was only 10 per cent (Table below). Further, the volume and value of transactions in the RTGS system was concentrated among a few participants. The top eight players namely SBI, Punjab National Bank, AXIS Bank, HDFC Bank, ICICI Bank, Bank of India, IDBI Bank and CitiBank accounted for more than 50 per cent of total volume and value of transactions as at end-March 2010. 9. Customer Services 4.75 Making banks more customer-friendly has been high on the agenda of the Reserve Bank. Accordingly, a number of steps have been taken towards enhancing financial literacy and strengthening channels of information dissemination relating to banking services to customers. A full-fledged Customer Service Department was set up in 2006 by the Reserve Bank to enhance the pace and quality of provision of customer services, while providing customers a forum for redressal of their grievances. 4.76 The forum of redressal of consumers’ grievances about banking, the Banking Ombudsman (BO), received 79,266 complaints at its 15 offices in 2009-10 contributed largely by the complaints received at the offices of the three major metropolises of Mumbai, New Delhi and Chennai. These three offices together accounted for almost half of the total complaints (34,830 complaints accounting for 43.9 per cent of the total) in 2009-10. It may be highlighted that the number of complaints at almost all offices in India has been increasing in the recent years indicating the growing awareness among consumers about grievance redressal, but the increase was particularly rapid at the offices in these three metropolises (Table IV.32). 4.77 The share of complaints received against foreign banks and new private sector banks, which had been on a rapid increase in the recent years, showed signs of slowing down in 2009-10. In the case of foreign banks, there was a decline in the number of complaints received by the BOs in 2009-10. In contrast, there was a perceptible increase to the tune of over 26 per cent in the number of complaints received against public sector banks in 2009-10 (Table IV.33). On account of a fall in the growth of complaints against new private sector banks and foreign banks, the shares of these bank groups posted a decline between 2008-09 and 2009-10, while the share of public sector banks, particularly the SBI group showed a rise (Chart IV.28). In 2009-10, SBI group alone accounted for little less than one-third of the total number of complaints received by SCBs. The number of complaints per branch for public sector banks at 0.71 (1.3 for SBI group) was much lower than the corresponding figures of 2.3 and 37.8 for private sector and foreign banks, respectively, in 2009-10 (Appendix Table IV.12).
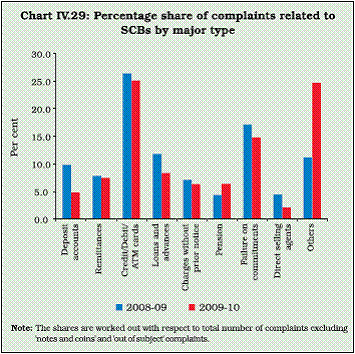
4.78 Though the largest number of complaints received by BOs continued to be with respect to credit/debit/ATM cards, there was a decline in the share of such complaints in 2009-10. Similarly, complaints about the core banking business of banks, particularly deposits and loans, also showed a fall during the year (Chart IV.29). The decline in the share of card-related complaints in 2009-10 needs to be juxtaposed with the decline in the share of complaints against foreign banks and new private sector banks, as card-related complaints formed an important reason for complaints against these two bank groups in the past. 10. Financial Inclusion 4.79 The Reserve Bank has put financial inclusion process into mission mode given that it can effectively help in addressing the concern of inclusive growth. Financial exclusion remains an area of concern given the low levels of financial penetration and deepening in India compared with other countries across the globe. Recent data from the World Bank suggest that India ranks low when compared with the OECD countries with regard to financial penetration (Table IV.34). When compared with select Asian peer group countries, the difference in financial access is much less striking as far as access to bank branches is concerned but it is prominent with regard to access to ATMs. Further, the size and depth of the banking sector when measured taking private credit to GDP ratio also works out to be much lower for India than many of its Asian peer group countries.18 These trends underline the need for strengthening the financial inclusion process in India in the years to come.
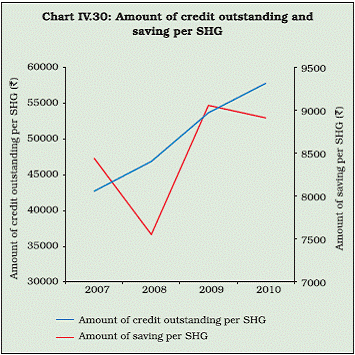
4.80 Financial inclusion in the Indian context has been defined as the provision of affordable financial services, viz., access to payments and remittance facilities, savings, loans and insurance services by the formal financial system to those who tend to be excluded. The Indian policy approach towards financial inclusion since early 2000s has been focused on ensuring inclusion at the individual and household level. Accordingly, the scheme of nofrills accounts (no pre-condition, low minimum balance maintenance) was initiated by the Reserve Bank in 2005 to provide an easy financial savings facility to the population at large, which can act as a means of their entry into the formal banking system. At end-March 2010, 50.6 million no-frills accounts were opened by the banking system. While no-frills accounts have grown phenomenally, an important challenge before the banking system is to keep these accounts operational, as many such accounts are found to be dormant since the poor often find it difficult to save and deposit money into these accounts. In order to keep these accounts operational, banks have been advised to provide small overdrafts in such accounts; up to March 2010, `27.54 crore were provided as overdrafts by banks in such accounts. 4.81 Micro-finance has been another important component of the financial inclusion process in India. Micro-finance is defined as provision of thrift, credit and financial services and products of very small amount to the poor in rural, semiurban and urban areas for enabling them to raise their income levels and improving living standards. The Self-Help Group-Bank Linkage Programme (SBLP), which started as a pilot programme in 1992 has developed with rapid strides over the years. In 2009-10, 1.59 million new SHGs were credit-linked with banks, and bank loan of `14,453 crore (including repeat loan) was disbursed to these SHGs. Further, at end-March 2010, 6.95 million SHGs maintained savings accounts with banks (Table IV.35). On an average, the amount of savings per SHG was `8,915 as compared to the amount of credit outstanding of `57,795 in 2009-10. While there was a continued increase in the amount of credit outstanding per SHG, there was a fluctuating trend in the amount of saving per SHG in the recent years (Chart IV.30).
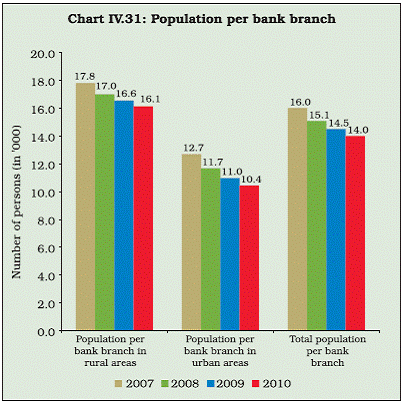
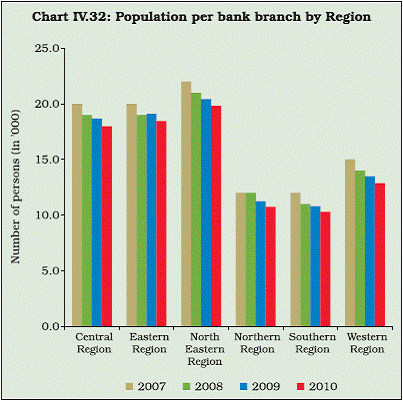
4.82 Alongside SBLP, Micro-finance Institutions (MFIs), such as Non-Governmental Organisations (NGOs), NBFCs, among others, have emerged as important sources of micro-finance delivery in India. In 2009-10, 691 MFIs were provided loans by banks to the tune of `8,063 crore. The growth under the MFI-linkage programme in terms of both number of credit-linked institutions and amount of loans was much higher than the corresponding growth under the SHG-Bank Linkage Programme in 2009-10. 11.Spatial and Regional Distribution of Banking Services 4.83 The spatial and regional distribution of banking services provides an insight into the spread and access of banking services and hence, is an important pointer of financial penetration and inclusion. This section sets out the distribution of bank branches across rural and urban areas, and across States/regions. Further, it also maps the distribution of ATMs, another channel of banking services, across rural and urban areas. Finally, it discusses the operations of Indian banks abroad and that of foreign banks in India. Distribution of Bank Branches 4.84 The average population per bank branch acts as a basic indicator of the penetration of banking services. Going by this indicator, the penetration of banking services has been on a consistent increase in India in the recent years (Chart IV.31). However, the rate of increase in the penetration of banking services in rural areas was much lower than that in urban areas.19 This was evident from a comparison of the rate of decline in the population per bank branch in rural and urban areas. 4.85 At the regional level, there was a striking differential in the degree of penetration of banking services. On the one hand were northern, southern and western regions, where the population per bank branch was in the range of 10,000 to 14,000 at end-March 2010. On the other hand, in the central, eastern and north-eastern regions, the population per bank branch was fairly higher in the range of 18,000 to 19,000. It may, however, be emphasised that population per bank branch was on a decline across all regions in the recent years signifying growing penetration of banking services across all regions (Chart IV.32).20
4.86 The branch authorisation policy was liberalised in December 2009 giving freedom to domestic scheduled commercial banks to open branches at Tier 3 to 6 centres (with population of up to 49,999 as per the Population Census of 2001) without having the need to take permission from Reserve Bank in each case, subject to reporting. A comparison of newly opened bank branches at Tier 3 to 6 centres between July 2009 and June 2010 with the previous year indicated that the impact of this policy change has been positive. During 2009- 10, 1,513 bank branches were opened at Tier 3 to 6 centres, which were higher than the addition of 1,481 branches during 2008-09 reflecting a growth of 2.2 per cent in the number of new branches (Table IV.36).
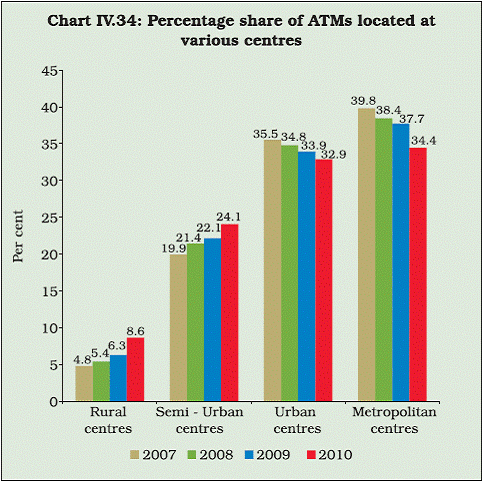
Distribution of ATMs 4.87 Like bank branches, there was also an increase in the penetration of ATMs in recent years as evident from a fall in the population per ATM (Chart IV.33). While there was greater concentration of ATMs in urban areas than in rural areas, the number and percentage of ATMs in rural areas was on a steady rise in the recent years (Chart IV.34; Table IV.37).21 The percentage of ATMs located in rural areas accounted for 28.4 per cent of the total ATMs in the country at end-March 2009, which increased to 32.7 per cent at end-March 2010 (Chart IV.34). A large part of the increase in ATMs in rural areas was due to public sector banks. The growing penetration of ATMs in rural areas could also be seen from a continued fall in the population per ATM in rural areas (Chart IV.33).
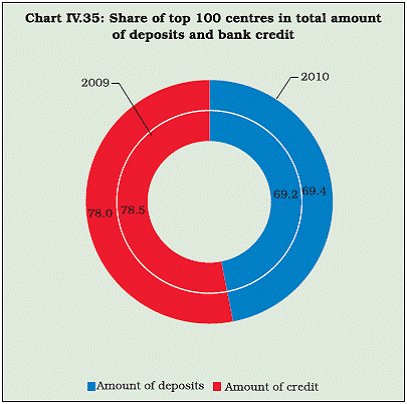
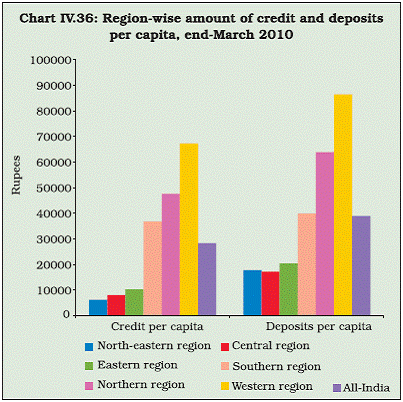
Distribution of Bank Credit and Deposits 4.88 The spatial distribution of bank credit showed high level of concentration of credit at the top 100 centres. At end-March 2010, the top 100 centres accounted for 78.0 per cent of the total bank credit in India, which was marginally lower than that at end-March 2009 (Chart IV.35). The top 100 centres, however, accounted for only 69.4 per cent of the total deposits mobilised at end-March 2010.22 4.89 At the regional level too, bank credit was concentrated in the western, southern and northern regions of the country (Chart IV.36). The amount of credit per capita in the western region was about 11 times the corresponding amount in the north-eastern region and about six to eight times the amount in the central and eastern regions at end-March 2010. The differential was less wide in the case of deposits per capita; the amount of deposits per capita in the western region was about four to five times the corresponding amount in the northeastern, central and eastern regions. Moreover, the credit-deposit ratio in the southern, western and northern regions was significantly higher than that in the eastern, central and northeastern regions at end-March 2010 (Appendix Table IV.13).
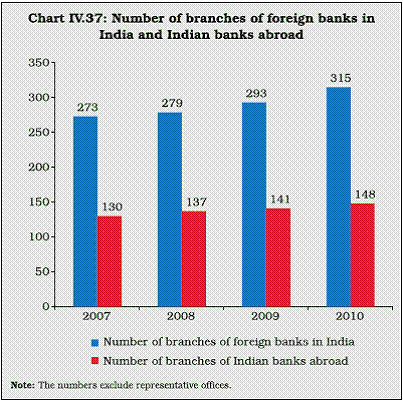
Foreign Banks’ Operations in India and Overseas Operations of Indian Banks 4.90 There has been a steady increase in the number of foreign banks and their branches operating in India. At end-September 2010, 34 foreign banks (from 24 countries) were operating in India as compared to 32 banks at end-June 2009. The total number of branches too increased to 315 in 2010 from 293 in 2009. In addition, 45 foreign banks operated in India through representative offices in 2010 as against 43 in 2009. The largest branch network of foreign banks in India was that of Standard Chartered Bank followed by HSBC Ltd., Citibank and the Royal Bank of Scotland N.V. 4.91 Between July 2009 and September 2010, permission was granted to four existing foreign banks to open seven branches and to three new foreign banks, viz., Sberbank (Russia), ANZ Bank (Australia) and Credit Suisse AG (Switzerland) to open one branch each in India. Permission was also granted to two foreign banks viz., CIMB Bank (Malaysia) and LA Caixa (Spain) to open a representative office each in India. 4.92 During 2009-10, Indian banks continued to expand their presence overseas. Between July 2009 and September 2010, Indian banks opened seven branches, one subsidiary and five representative offices abroad. At end-September 2010, 22 Indian banks (16 public sector and 6 private sector banks) operated through a network of 233 overseas offices (Table IV.38). While Bank of Baroda had the largest overseas branch network, the presence of State Bank of India in the overseas banking system was increasingly felt, as the Bank expanded its branch network by four new branches during 2009-10. 4.93 The number of foreign banks’ branches in India has generally exceeded the number of Indian banks’ branches aboard, as growth in the former has been faster than that in the latter in the recent years (Chart IV.37).
12. Regional Rural Banks 4.94 Regional Rural Banks (RRBs) were created with the objective of combining the good features of cooperatives and commercial banks to provide regionally oriented institutions that could direct credit to the under-privileged sections of the rural population. Thus, RRBs can be regarded as an ideal institution for achieving financial inclusion in rural areas. With the onset of financial sector reforms, a number of changes were brought about in the policy framework relating to RRBs to impart operational freedom to these institutions and improve their weakening financial health. These changes were primarily reflected in the restructuring and amalgamation, recapitalisation of RRBs along with the application of prudential regulatory framework to these institutions.
4.95 In 2009-10, the consolidated balance sheet of RRBs showed accelerated growth of 22.2 per cent as compared to 16.5 per cent during the previous year. On the liabilities side, deposits propelled the growth in balance sheets of RRBs, while on the assets side, the growth was mainly on account of investments. It may be noted that the credit-deposit ratio of RRBs in 2009-10 stood at 57.6 per cent, a level far lower than that of SCBs (Table IV.39). 4.96 Out of 82 RRBs, 79 RRBs were in profits during 2009-10 indicating an increase in the share of profit-making RRBs to 96.3 per cent during this year as compared to 93.0 per cent in the previous year. On the whole, all RRBs taken together reported a net profit of `1,884 crore showing a growth of 41.1 per cent in 2009-10. As a result, there was a marginal rise in the Return on Assets (RoA) of RRBs from 1.0 per cent in 2008-09 to 1.1 per cent in 2009-10 (Table IV.40). The RoA of RRBs in 2009-10 thus worked out to be relatively higher than that of SCBs. 4.97 In line with their role in furthering financial inclusion, priority sectors, which have generally constituted a major portion of the total advances of RRBs, occupied a share of about 82 per cent in their total advances at end-March 2010 (Table IV.41). Importantly, however, the share of agricultural credit in total credit from RRBs was on a declining trend in the recent years.
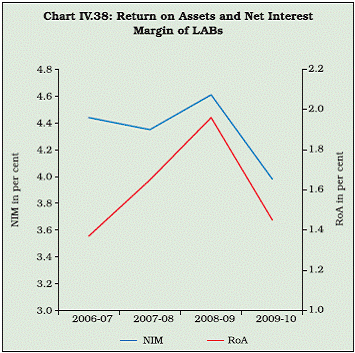
13. Local Area Banks 4.98 Local Area Banks (LABs) are a small but a vital component of the banking system in India. The LABs Scheme was introduced in 1996 with the objective of bridging gaps in credit availability and enhancing the institutional credit framework to provide efficient and competitive financial intermediation with a specialised local focus in rural and semi-urban areas. Although six LABs were licensed, as of now, only four LABs are functioning. This section discusses the performance of LABs during 2009-10 and highlights the major issues relating to the operation of these institutions. 4.99 The efficiency and profitability of LABs at the aggregate level measured by both RoA and NIM has been fairly higher than SCBs (Chart IV.38). There was a decline in both RoA and NIM in 2009-10 similar to that of SCBs partly reflective of the low interest rate environment that prevailed during most part of this year (Table IV.42). 4.100 Notwithstanding their higher efficiency, there were a number of issues of concern about the operation of LABs. First, a scrutiny of the bank-level data of LABs indicated that there was considerable concentration of the business in one LAB, namely Capital Local Area Bank making up over 68.8 per cent of the total assets and about 69.1 per cent of the total banking business of the LABs at end-March 2010 (Table IV.43). Secondly, as noted by the Review Group of 2002 which looked into the working of LABs, these institutions had a limited capital base and hence, were not in a position to absorb the unexpected losses. Hence, the Group had recommended stepping up their net worth of `25 crore. However, except Capital Local Area Bank, other LABs had not been able to meet this target. At end-March 2010, Capital Local Area Bank had a net worth of `45.9 crore, while Coastal Local Area Bank had net worth of `18.7 crore followed by Subhadra Local Area Bank (at `17.4 crore) and Krishna Bhima Samruddhi Local Area Bank (at `12.9 crore).
14. Conclusions 4.101 In 2009-10, the growth in the consolidated balance sheet of SCBs showed signs of slowdown contributed by a decline in the growth of deposits and bank credit similar to the trend noted during 2008-09. The growth in bank credit decelerated on a year-on-year basis reflecting the economic slowdown in the aftermath of the crisis. However, on an intrayear basis, bank credit showed signs of recovery after November 2009, as there was a pick up in growth momentum in the real economy. 4.102 An important development with regard to bank deposits was the rise in the percentage of CASA in 2009-10. As regards investment, there was a recovery in non-SLR investments in 2009-10, which had remained sluggish after the financial crisis. The growth in non-SLR investments was contributed mainly by investments in Mutual Funds (MFs) in 2009-10. 4.103 The growth in profitability of banks exhibited a slowdown contributed by a fall in the growth of income (and expenditure) of SCBs in 2009-10. Every indicator of profitability including RoA, RoE, Net Interest Margin and spread (difference between return and cost of funds) showed a decline at the aggregate level in 2009-10. 4.104 Apart from the decline in profitability, the other emerging concern in 2009-10 was with regard to the asset quality of SCBs. The gross NPA ratio showed an increase by about 0.14 percentage points at the aggregate level contributed by both priority and non-priority sector NPAs. Moreover, the increase in NPAs was owing to an increase in doubtful and loss making assets reflecting worsening of asset quality of banks. 4.105 While gross NPA ratio increased, the coverage ratio of provisions showed a fall at the aggregate level reflecting a weakening cushion to meet NPA losses. However, CRAR of SCBs, which had remained much above the stipulated minimum of 9 per cent in 2008-09 even after migration to Basel II framework, showed a further increase in 2009-10. The leverage ratio of SCBs also showed an increase indicating strengthening of core (Tier I) capital in comparison with the asset base of the banking system. 4.106 As regards financial inclusion, India compares poorly with OECD as well as many of its Asian peer group countries. However, a welcome development in the recent years has been a steady increase in the penetration of bank branches and ATMs (reflected by a decline in population per bank branch/ATM). More importantly, the increased penetration of both branches and ATMs could be seen across rural India. Micro-finance, which has emerged as an important engine for financial inclusion in India, showed further growth in 2009-10, particularly under the MFI-linkage programme as compared to the SHG-Bank Linkage programme. Domestic banks were able to meet their overall priority sector target but their performance in meeting the agricultural and weaker sections sub-targets was relatively weak in 2009-10. 4.107 As regards technological advancement in banks, an important development was the near completion of computerisation and an increase in the extent of adoption of CBS in public sector banks in 2009-10. 4.108 To sum up, in the near future, banking sector needs to support the growth momentum in the economy while giving due attention to the asset quality and prudent provisioning to balance emerging returns and risks. Further, banks need to step up efforts towards financial inclusion using the instrument of scale-neutral technology as this would help in bringing the vast population into the ambit of formal finance and also boost future economic growth coupled with equity. 1 The key indicators of operational efficiency used in the World Bank study were Return on Assets and Return on Equity, while the financial soundness parameters included capital adequacy and gross NPA ratio. Globally, India compared favourably with respect of each of these indicators with other Asian and OECD countries except gross NPA ratio. The gross NPA ratio for India was comparable with the Asian countries but was fairly higher than the OECD countries. See Kiatchai Sophastienphong and Anoma Kulathunga (2009), Getting Finance in South Asia 2009- Indicators and Analysis of the Commercial Banking Sector, World Bank. 2 These include 27 public sector banks (State Bank of India and its six associates, 19 nationalised banks and IDBI Bank Ltd.), 7 new private sector banks, 15 old private sector banks and 32 foreign banks. 3 For an illustration of this point, see Chart IV.19 in Section 5. 4 Since 2008-09, the separation of the category of banks’ investment in ‘instruments of FIs’ from ‘bonds and debentures’ was partly responsible for the decline in the share of ‘bonds and debentures’. However, even when these two categories were added in order to arrive at a category of ‘bonds and debentures’ comparable with the past data, a decline in the share of this category was still evident in 2009-10. 5 See Statistical Tables relating to Banks in India (STB) – 2009-10 for data on credit- and investment-deposit ratios at the bank-level. 6 Also see Monetary and Macro-economic Developments issued with the First Quarter Review of Monetary Policy for 2010-11, Table V.7 for details on bank group-wise range of interest rates. 7 The figures of Net interest margin and Return on Assets presented in Chart IV.9 are worked out taking average total assets of SCBs (averages of current and previous years). Hence, these figures may not tally with the figures presented in the Report on Trend and Progress of Banking in India for the relevant years. Time series data on these variables at the aggregate as well as bank group/bank levels can be obtained from various past issues of the Statistical Tables relating to Banks in India (STB). 8 See Chapter I for details on the enhanced Basel II framework. 9 The analysis in this section on CRAR is based on data from the off-site returns of Scheduled Commercial Banks. 10 The estimation was carried out for contemporaneous credit growth and credit growth with lags up to three years. The regression with lags showing significant coefficients is reported below: NPA growth = á + 0.62 Credit growth-2 + 1.41Credit growth-3 11 Also refer to policy brief put out by the World Bank on leverage ratio in Hulster (2009), “The Leverage Ratio – A New 12 Tier I capital refers to equity and reserves less intangible assets, while total adjusted assets refers to total assets less 13 The leverage ratio here is worked out as Tier I capital reported under the Basel I framework as per cent of total 14 The regression used for this exercise is as follows: Ln(industrial credit) = 2.01 + 2.08 Ln(industrial production) 15 One of the factors behind the slowdown in services sector credit was the significant deceleration in credit to the real estate sector on account of definitional changes effected in September 2009 by the Reserve Bank, whereby certain activities were excluded from credit to real estate. These activities, among others, included: (i) exposures to entrepreneurs for acquiring real estate for the purpose of their carrying on business activities, which would be serviced out of the cash flows generated by those business activities; (ii) loans extended to a company for a specific purpose, not linked to a real estate activity; (iii) loans extended against the security of future rent receivables; (iv) credit facilities provided to construction companies which work as contractors; (v) financing of acquisition/renovation of self-owned office/ company premises; (vi) exposure towards acquisition of units/to industrial units in SEZs; and (vii) advances to Housing Finance Companies (HFCs). 16 However, given the growing importance of non-bank sources in providing financial resources to the commercial sector, bank credit can provide only a partial picture of the total credit availability to any sector. See Table IV.9 from Quarterly Macro-economic and Monetary Developments, First Quarter Review – 2010-11 for the percentage shares of bank and non-bank sources in providing financial resources to the commercial sector. 17 See Chapter I for a discussion on recapitalisation of public sector banks in 2009-10. 18 See Kiatchai Sophastienphong and Anoma Kulathunga (2009), Getting Finance in South Asia 2009- Indicators and Analysis of the Commercial Banking Sector, World Bank. 19 ‘Rural’ areas here refer to rural and semi-urban centres together, while ‘urban’ areas refers to urban and metropolitan centres together. 20 See Statistical Tables relating to Banks in India – 2009-10 for the State-level data. 21 Rural’ areas here refer to rural and semi-urban centres together, while ‘urban’ areas refers to urban and metropolitan centres together. 22 See Quarterly Statistics on Deposits and Credit of Scheduled Commercial Banks for detailed State level data. |
|||||||||||||||||||||||||||||||||||||||||||||||||||||||||||||||||||||||||||||||||||||||||||||||||||||||||||||||||||||||||||||||||||||||||||||||||||||||||||||||||||||||||||||||||||||||||||||||||||||||||||||||||||||||||||||||||||||||||||||||||||||||||||||||||||||||||||||||||||||||||||||||||||||||||||||||||||||||||||||||||||||||||||||||||||||||||||||||||||||||||||||||||||||||||||||||||||||||||||||||||||||||||||||||||||||||||||||||||||||||||||||||||||||||||||||||||||||||||||||||||||||||||||||||||||||||||||||||||||||||||||||||||||||||||||||||||||||||||||||||||||||||||||||||||||||||||||||||||||||||||||||||||||||||||||||||||||||||||||||||||||||||||||||||||||||||||||||||||||||||||||||||||||||||||||||||||||||||||||||||||||||||||||||||||||||||||||||||||||||||||||||||||||||||||||||||||||||||||||||||||||||||||||||||||||||||||||||||||||||||||||||||||||||||||||||||||||||||||||||||||||||||||||||||||||||||||||||||||||||||||||||||||||||||||||||||||||||||||||||||||||||||||||||||||||||||||||||||||||||||


