 IST,
IST,
Operations and Performance of Commercial Banks
During 2018-19, the asset quality of scheduled commercial banks turned around after a gap of seven years. With a concomitant reduction in provisioning requirements, the banking sector returned to profitability in the first half of 2019-20, while recapitalisation helped public sector banks in shoring up their capital ratios. The Insolvency and Bankruptcy Code gained traction, enhancing resolutions. Furthermore, credit growth revival that began in 2017-18 maintained momentum into 2018-19, led by private sector banks. Notwithstanding these gains, credit growth has turned anaemic in 2019-20 while the overhang of NPAs remains high; further improvements in banking sector hinge around a reversal in macroeconomic conditions. 1. Introduction IV.1 The year 2018-19 marked a turnaround taking shape in the financial performance of India’s commercial banking sector. After seven years of deterioration, the overhang of stressed assets declined, and fresh slippages were arrested. With the concomitant reduction in provisioning requirements, bottom lines improved modestly after prolonged stress and the banking sector returned to profitability after a gap of two years in the first half of 2019-20. Meanwhile, recapitalisation of public sector banks (PSBs) strengthened their capital base and the Insolvency and Bankruptcy Code (IBC) began to gain traction in enhancing resolutions. IV.2 Against this backdrop, this chapter analyses the audited balance sheets of the Indian banking sector during 2018-19 and 2019-20 so far, backed by information received through off-site supervisory returns in Section 2. On this basis, an evaluation of the financial performance of 94 SCBs and their soundness is presented in Sections 3 and 4. Sections 5 to 11 address specific themes that assumed importance during the period under review such as the sectoral deployment of credit, capital market interface, ownership patterns, foreign banks in India and overseas operations of Indian banks, payment system developments, consumer protection and financial inclusion. Developments related to regional rural banks (RRBs), local area banks (LABs), small finance banks (SFBs) and payments banks (PBs) are also analysed in Sections 12 to 15. Section 16 concludes the chapter by bringing together the major issues that emerge from the analysis. IV.3 In 2018-19, the consolidated balance sheet of SCBs expanded at an accelerated pace for the first time since 2010-11, buoyed by a pick-up in deposits on the liabilities side and loans and advances on the assets side (Chart IV.1a and b). IV.4 Although private sector banks (PVBs) account for less than a third of assets of SCBs, they led the expansion in the consolidated balance sheet of SCBs, offsetting the deceleration posted by PSBs (Table IV.1). Furthermore, despite the overall improvement in banking performance continuing during the first half of 2019-20, a slowing down of bank credit growth has emerged as an area of concern. 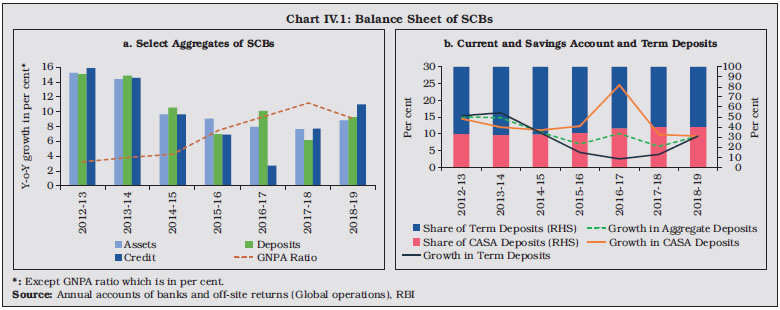
2.1 Liabilities IV.5 Deposits, which constituted 77.6 per cent of the total liabilities of SCBs at end-March 2019, recovered from a secular deceleration that set in from 2009-10, barring the demonetisation-induced spike in 2016-17. This turnaround overcame unfavourable base effects and was mainly driven by a pick-up in term deposits (Chart IV.2 a). PVBs attracted a significant portion – 77 per cent – of this increase in term deposits1, primarily reflecting the higher interest rates offered by them (Chart IV.2 b). Current and savings account (CASA) deposits kept pace with term deposits and maintained their share in total deposits at 40 per cent. The expansion in deposit mobilisation tempered banks’ borrowing requirements, especially those of PSBs (Chart IV.2 c and d). 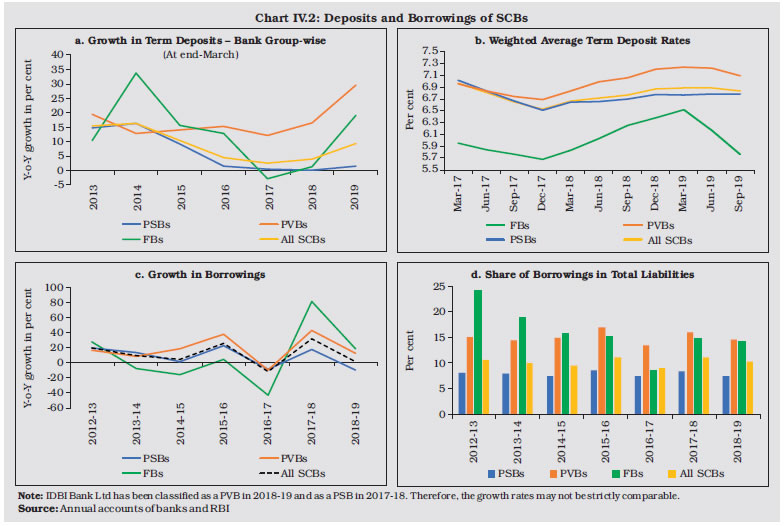 2.2 Assets IV.6 The revival in the growth of loans and advances – the most significant component in the asset side of the SCBs’ balance sheet – that began in 2017-18, maintained momentum into 2018-19 (Chart IV.3). The recognition of non-performing assets (NPAs) nearing completion, recapitalisation of PSBs, and the ongoing resolution process under the Insolvency and Bankruptcy Code (IBC) helped in improving the credit environment. 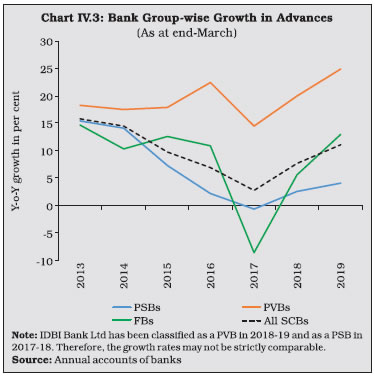 IV.7 PVBs led the upturn in credit growth. Their share in incremental loans was 69 per cent in 2018-19 (Chart IV.4a), commensurate with their share in incremental deposits2. Consequently, their share in outstanding credit increased (Chart IV.4b). In H1:2019-20, however, credit growth has decelerated across all bank groups. 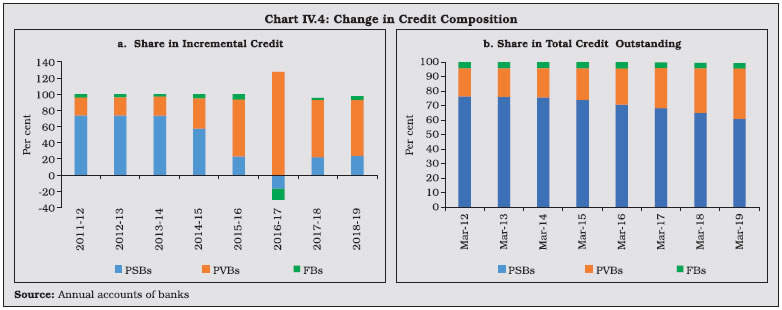 IV.8 India’s credit to GDP ratio is lower than that of its emerging market peers3. The incremental credit to GDP ratio has been increasing since 2016-17 (Chart IV.5a), though the credit-GDP gap remains negative4, indicative of the potential for further financial penetration. The outstanding C-D ratio increased marginally for the second consecutive year in 2018-19. The ratio was highest for PVBs as they led the credit expansion in 2018-19 (Chart IV.5b). IV.9 Investments—the second largest component in the asset side of SCBs’ balance sheet—decelerated in 2018-19, as PSBs economised on their investments in government securities and other approved securities, reflecting the shedding of excess statutory liquidity ratio (SLR) investments by them to accommodate the uptick in credit growth. 2.3 Flow of Funds to the Commercial Sector IV.10 During 2018-19, credit flow from Housing Finance Companies (HFCs), Systemically Important Non-Deposit taking (NBFC-ND-SI) and Deposit taking NBFCs (NBFC-D) declined. Public issuances of debt and equity by non-financial entities and net investment in corporate debt by LIC also exhibited a similar pattern. On the contrary, a sharp rise in commercial paper issuances, higher accommodation provided by All India Financial Institutions (AIFIs) regulated by the Reserve Bank, and a pick-up in net flows from foreign sources partly compensated for the decline in non-bank flows. External commercial borrowings (ECB)/ foreign currency convertible bonds (FCCB) registered net inflows for the first time in four years, partly reflecting the new ECB framework introduced by the Reserve Bank to simplify overseas borrowing norms. Foreign direct investment (FDI) flows grew at 18.9 per cent in 2018-19 (Table IV.2).  IV.11 The scenario appears to have altered in the first half of 2019-20 as the total flow of resources to the commercial sector declined by 60 per cent on a year-on-year basis, largely driven by a contraction in adjusted non-food bank credit. Flows from foreign sources, in contrast, accelerated in the first half of 2019-20 as ECB norms were eased further in July 2019 (Table IV.2). 2.4 Maturity Profile of Assets and Liabilities IV.12 As regards the maturity profile of SCBs’ balance sheet, the asset-liability gap in the 1-3 years category increased sizeably, while it declined in the more than 5 years category (Chart IV.6). Although the maturity structure of liabilities for all the buckets remained broadly similar to a year ago, the share of loans with maturity above five years declined, whereas those with maturity between 1-3 years increased sharply (Table IV.3). This indicates that the SCBs, especially PSBs, have shifted their lending strategy.  2.5 International Liabilities and Assets IV.13 The total international liabilities and assets of banks located in India expanded further in 2018-19. The ratio of claims to liabilities declined marginally, as the latter outpaced the former. The ratio of international liabilities of banks to India’s total external debt edged up during the year (Chart IV.7). On the liability side, accretions to Foreign Currency Non-resident Bank deposits [FCNR(B)] and Non-resident External Rupee (NRE) accounts picked-up while a build-up of NOSTRO balances, export bills and debt securities was primarily responsible for the enlargement in assets (Appendix Tables IV.9 and IV.10). India’s share in global cross-border aggregates remained small – less than one per cent, as at end-March 20195. IV.14 The concentration of claims of short-term maturity in the total consolidated international claims of banks increased in 2018-19 (Appendix Table IV.11). The country-composition of international claims remained broadly stable, with the United States (US) increasing its share further (Appendix Table IV.12). 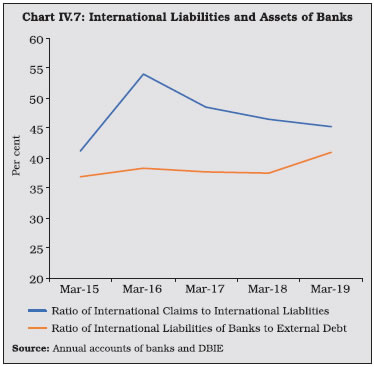 2.6 Off-balance Sheet Operations IV.15 The size of contingent liabilities of all SCBs in India increased to 1.2 times of their on-balance sheet as at end-March 2019, driven primarily by an expansion in forward exchange contracts, including derivative products (Appendix Table IV.2). The composition of on and off-balance sheet liabilities across bank groups has remained stable, with FBs and PVBs having significantly higher off-balance sheet exposures than PSBs (Chart IV.8).  IV.16 The financial performance of SCBs in the period under review was marked by PSBs reporting positive net profits after 3 years in H1:2019-20. As provisioning requirements slackened and credit growth revived modestly, interest income increased, even though interest expenses picked up on account of the increase in deposit growth (Table IV.4). The net interest margin as well as the spread improved (Table IV.5) IV.17 On the other hand, SCBs’ income from non-interest sources declined, contributed by spreading of mark-to-market losses in government security portfolios and transfer of funds to the investment fluctuation reserve (IFR). Apart from these factors, the muted growth in off-balance sheet exposures, mainly guarantees, and a fall in income from trading and forex transactions adversely affected the PSBs. In H1:2019-20, however, the non-interest income of SCBs has revived. IV.18 While the quantum of provisions declined for PSBs, it increased for PVBs in 2018-19, due to a rise in the latter’s NPAs6 (Chart IV.9). Similar movements were discernible in H1:2019-20. IV.19 The provision coverage ratio (PCR) of all SCBs improved to 61 per cent by end-September 2019, as PSBs’ gross NPAs declined faster than the decline in their provisions and PVBs’ provisioning went up markedly (Chart IV.10). IV.20 In the case of profitability ratios as well, differentials in performance of PSBs vis-a-vis PVBs were evident. For PVBs, both Return on Assets (RoA) and Return on Equity (RoE) worsened in 2018-19 from the previous year, although they were considerably better than those of PSBs (Table IV.6)7. In contrast, the latter were more successful in reducing their losses, building on the improvement in their asset quality. There was an overall increase in profitability in H1:2019-20 as interest income accelerated and non-interest income revived. Supervisory data suggest that RoA of SCBs improved to 0.35 per cent at end-September 2019. 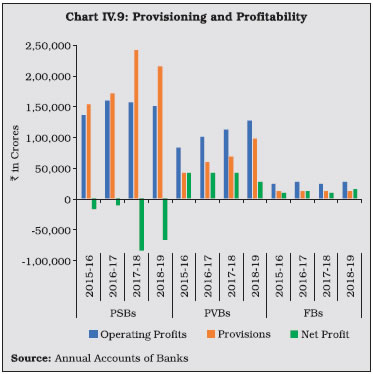  IV.21 Soundness indicators are matrices that enable a comparison of financial health across banks and time. During 2018-19 and 2019-20 so far, there has been a gradual improvement in capital adequacy, liquidity and asset quality. 4.1 Capital Adequacy IV.22 The capital to risk-weighted assets ratio (CRAR) of SCBs has been improving from the low of 13 per cent reached in 2014-15. Evidence suggests that strengthening the capital base of banks facilitates credit expansion in a non-linear fashion (Box IV.1)
IV.23 PSBs led the recovery in capital ratios in 2018-19. Recapitalisation to the tune of ₹ 90,000 crores in 2017-18 and ₹ 1,06,000 crores in 2018-19 bolstered their capital position, even as they battled with the overhang of impaired assets. PVBs and FBs remained well capitalised and above the regulatory minimum of 10.875 per cent for March 2019, though the former experienced a marginal decline in CRAR8 in 2018-19 (Table IV.7). IV.24 Notably, PSBs’ risk-weighted assets (RWAs) have contracted in the past two years, reflective of a change in their risk profile in favour of less risky borrowers with high credit ratings. Furthermore, all bank groups maintained robust Tier 1 capital ratios to comply with the capital conservation buffer (CCB) requirement under the Basel III norms. This improvement was broad-based as evident in the rightward shift in the distributions of capital ratios (Chart IV.11). 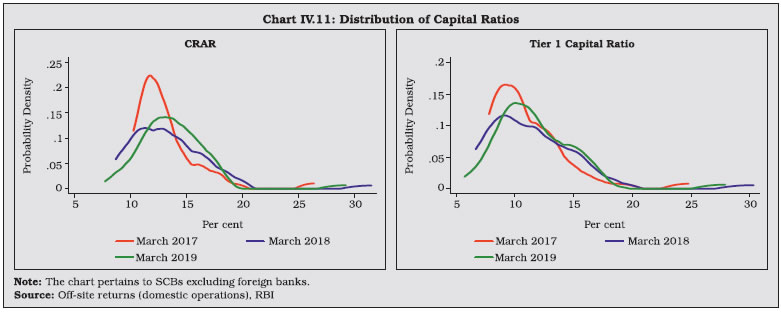 IV.25 In H1: 2019-20, SCBs’ CRAR and the Tier 1 capital ratio improved further to 15.1 per cent and 13.0 per cent respectively, led by PSBs and PVBs. The Government has announced another tranche of recapitalisation of ₹ 70,000 crores in PSBs in 2019-20, which is expected to better their capital position, going forward. 4.2 Leverage Ratio IV.26 The leverage ratio (LR), defined as the ratio of Tier 1 capital to total exposure (including off-balance sheet exposure), is calibrated to act as a supplementary measure to the CRAR under Basel III to constrain the build-up of leverage. At end-March 2019, the leverage ratio of SCBs was at 6.6 per cent, above the Pillar I prescription of 3 per cent by the Basel Committee on Banking Supervision (BCBS). All bank groups experienced a slight decrease in their LRs in 2018-19, mostly due to growth in total exposures during the year; however, this trend has been reversed in H1: 2019-20 (Chart IV.12). The Reserve Bank revised the minimum leverage ratio requirements for banks, effective October 1, 20199. 4.3 Liquidity Standards IV.27 The Basel III framework prescribes two minimum liquidity standards, viz., the liquidity coverage ratio (LCR) and the net stable funding ratio (NSFR). While the LCR promotes short-term resilience of banks in dealing with potential liquidity disruptions lasting for 30 days, the NSFR requires banks to fund their activities with stable sources of funding over the time horizon extending to one year. The former has been implemented in India since January 1, 2015 and the latter – defined as the ratio of available stable funding (ASF) to required stable funding (RSF) – will be effective from April 1, 2020. 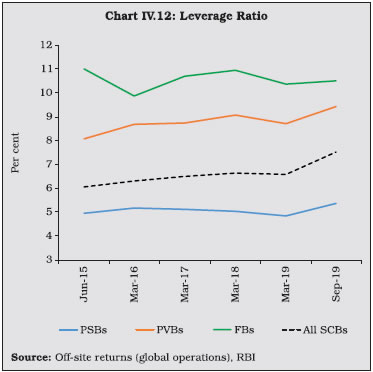 IV.28 Banks have been allowed to carve out Level 1 high quality liquid assets (HQLAs) from within the statutory liquidity ratio (SLR) for computing LCR, the limit for which is presently set at 16.5 per cent of net demand and time liabilities (NDTL). To encourage credit flow to the NBFC sector, additional carve-outs were also prescribed. The LCR of SCBs improved further in 2018-19 and in H1: 2019-20 and remained well above the Basel III requirement of 100 per cent (Chart IV.13).   4.4 Non-performing Assets IV.29 The GNPA ratio of all SCBs declined in 2018-19 after rising for seven consecutive years (Chart IV.14 a), as recognition of bad loans neared completion. Decline in the slippage ratio10 as well as a reduction in outstanding GNPAs helped in improving the GNPA ratio (Chart IV.14 c and d). While a part of the write-offs was due to ageing of the loans, recovery efforts received a boost from the IBC. The restructured standard advances to gross advances ratio began declining after the asset quality review (AQR) in 2015 and reached 0.55 per cent at end-March 2019 (Chart IV.14 b). IV.30 All bank groups recorded an improvement in asset quality, with PSBs experiencing a drop both in the GNPA and in the net NPA ratios (Table IV.8). The deteriorating asset quality of PVBs in terms of the GNPA ratio is due to the reclassification of IDBI Bank Ltd as a private bank effective January 21, 2019; however, after excluding IDBI Bank Ltd, PVBs’ GNPA ratio declined. Supervisory data suggest that the GNPA ratio of SCBs remained stable at 9.1 per cent at end-September 2019. IV.31 Consistent with these developments, the proportion of standard assets in total advances of SCBs increased in 2018-19, largely because of the improved performance of PSBs. The corresponding improvement in sub-standard and doubtful assets was partly reversed by an increase in the loss account (Table IV.9). IV.32 NPAs in the larger borrowal accounts (exposure of ₹ 5 crore or more) had contributed 91 per cent of total GNPAs in 2017-18 after the Reserve Bank withdrew various restructuring schemes. In 2018-19, however, SCBs recorded a synchronised decline in all the special mention accounts (SMA-0, SMA-1 and SMA-2), restructured standard advances (RSA) and GNPAs, attesting to the broad-based improvement in asset quality. Yet, these accounts – which constituted 53 per cent of gross loans and advances – contributed 82 per cent of GNPAs at end-March 2019. Furthermore, stress in large borrowal accounts has been on the rise for both PVBs and PSBs in H1: 2019-20 (Chart IV.15). 4.5 Recoveries IV.33 Recovery of stressed assets improved during 2018-19 propelled by resolutions under the IBC, which contributed more than half of the total amount recovered. However, recovery rates11 yielded by major resolution mechanisms (except Lok Adalats) declined in 2018-19, especially through the SARFAESI mechanism (Table IV.10). Cases referred for recovery under various mechanisms grew over 27 per cent in volume and tripled in value during the year, leading to a pile-up of bankruptcy proceedings. This highlights the need to strengthen and expand the supportive infrastructure. 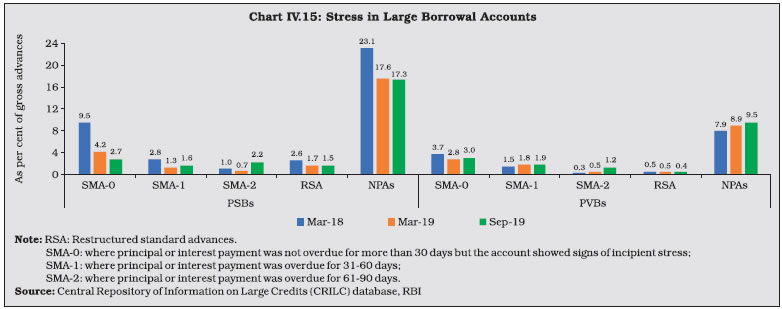 IV.34 As cases referred for recovery through legal mechanisms shot up, cleaning up of balance sheets via sale of stressed assets to asset reconstruction companies (ARCs) decelerated on a y-o-y basis and declined as a proportion to GNPAs at the beginning of 2018-19 (Chart IV.16). However, the acquisition cost of ARCs as a proportion to the book value of assets increased further, indicating that banks had to incur lesser haircuts on account of these sales. IV.35 The share of subscriptions by banks to security receipts (SRs) issued by ARCs declined to 69.5 per cent by end-June 2019 from 79.8 per cent a year ago, in line with the agenda to reduce their investments in SRs and to diversify investor base in SRs (Table IV.11). 4.6 Frauds in the Banking Sector IV.36 Frauds, especially the larger ones, tend to get reported with a lag. Thus, even though the number of cases of fraud reported by banks as well as the amount involved spiked during 2018-19, both would be trending lower if analysed on the basis of the date of occurrence (Table IV.12 and Table IV.13). In February 2018, the government issued a framework for timely detection, reporting and investigation relating to frauds in PSBs, which required them to evaluate NPA accounts exceeding ₹ 50 crores from the angle of possible frauds, to supplement the earlier efforts to unearth fraudulent transactions. This appears to have caused the sharp jump in reported frauds in 2018-19. 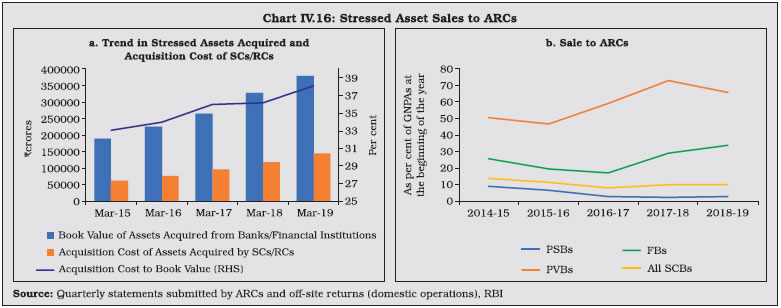 IV.37 Frauds have been predominantly occurring in the loan portfolio, both in terms of number and value. Incidents relating to other areas of banking viz., card/internet, off-balance sheet and forex transactions, in terms of value, have reduced (in terms of date of reporting) in 2018-19 vis-à-vis the previous year. The modus operandi of large value frauds12 – that account for 86.4 per cent of all frauds reported during the year in terms of value – involved, inter alia, diversion of funds by borrowers through various means, mainly via associated or shell companies; accounting irregularities; manipulating financial or stock statements; opening current accounts with banks outside the lending consortium without a no-objection certificate from lenders; and devolving of Letter of Credits (LCs). IV.38 PSBs accounted for a bulk of frauds reported in 2018-19 – 55.4 per cent of the number of cases reported and 90.2 per cent of the amount involved – mainly reflecting the lack of adequate internal processes, people and systems to tackle operational risks. PVBs’ and FBs’ shares in the former stood at 30.7 per cent and 11.2 per cent, whereas their shares in the latter were 7.7 per cent and 1.3 per cent, respectively. PSBs’ share in the value of large frauds was even higher at 91.6 per cent in 2018-19. 5. Sectoral Bank Credit: Distribution and NPAs IV.39 In response to the mounting NPAs of the industrial sector since 2012-13, banks diversified their portfolios towards services and retail loans (Chart IV.17 a). Within retail loans, the dominant share of housing has increased (Chart IV.17 b). IV.40 During 2018-19, bank credit to agriculture accelerated, mainly on the back of expanding the ambit of the interest subvention scheme provided by the Government for ensuring availability of credit to the sector at a reasonable cost and enhancement of the limit for collateral free agricultural loan by the Reserve Bank; however, it has declined significantly in H1: 2019-20 (Table IV.14). Disconcertingly, the GNPA ratio in bank lending to the agriculture sector increased in 2018-19 as well as in H1: 2019-20 (Chart IV.18 a). In fact, analysis by the Internal Working Group (Chairman: Shri M. K. Jain) constituted by the Reserve Bank to review agricultural credit indicates that NPA levels have increased for those states that announced farm loan waiver programmes in 2017-18 and in 2018-19. 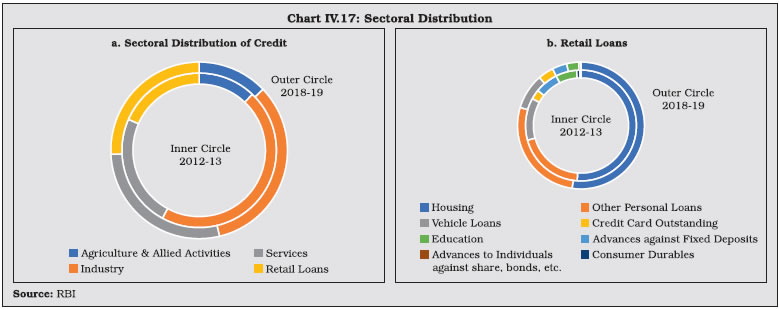 IV.41 Bank credit to industry decelerated in 2018-19 and in 2019-20 so far, partly tracking the slowdown in industrial production (Table IV.14). In 2018-19, out of the 19 industry sub-groups, credit accelerated only to 8 as compared with 12 in the previous year. Other sub-sectors such as food processing, textiles, paper and paper products, petroleum and coal products, gems and jewellery, and basic metals also experienced a decline in credit flows. IV.42 The quality of banks’ industrial assets improved in 2018-19 and in H1:2019-20, helped by a decline in fresh slippages and increase in recoveries through the IBC. Large industries posted the best progress in this regard (Chart IV.18 b). Notwithstanding, industrial GNPA ratio remained high at 17.4 per cent, constituting about two-thirds of total NPAs at the end of September 2019. IV.43 Services sector credit growth accelerated on enhanced flows to shipping, trade, commercial real estate and NBFCs. Of the incremental non-food credit expansion, NBFCs accounted for 14.6 per cent – the highest amongst the services sub-sectors – reflecting the recent initiatives taken by the Reserve Bank and the Government to revive the sector. Notwithstanding some moderation, retail loans grew in double digits, extending the expansion that has been underway over the past eight years. In H1: 2019-20, credit growth to both these sectors decelerated (Table IV.14). 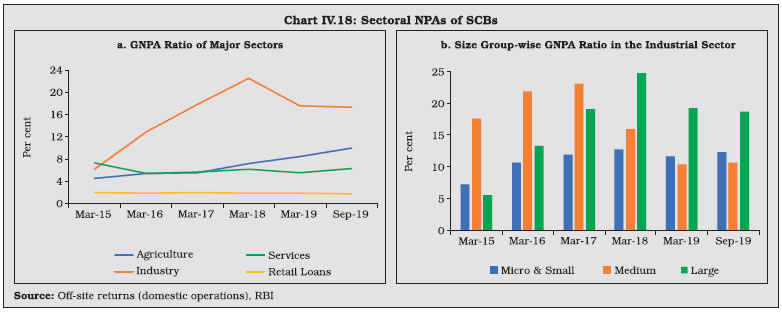  IV.44 PVBs maintained double-digit credit growth in respect of all the major sectors. Their lending to the relatively stress-free retail and services sectors grew by over 30 per cent in 2018-19 (Chart IV.19). PSBs’ credit to the services sector grew at 18.4 per cent, pulled up primarily by NBFCs, followed by commercial real estate. In contrast, PVBs exposure to services was more broad-based, even as credit to NBFCs accelerated. IV.45 In relation to preceding years, banks’ retail loans moderated in 2018-19 as exposures to auto and consumer durables sectors were scaled back. Besides, PSBs experienced a substantial deceleration in the housing loans category, which accounts for more than half of their total retail credit. PVBs, on the other hand, compensated for the tepid growth in auto and consumer durables segments by stepping up disbursements of housing loans, which grew at over 40 per cent on a y-o-y basis in 2018-19. IV.46 Supervisory data suggest that in H1:2019-20, PSBs’ loan growth to services and retail sectors moderated, and their agricultural and industrial lending declined. PVBs’ credit growth decelerated to all sectors barring agriculture but remained higher than that of PSBs (Chart IV.19). Prevalence of weak consumer demand and slowdown in economic activity seem to have impinged on the overall loan growth. 5.1 Priority Sector Credit IV.47 Priority sector credit accelerated in 2018-19, largely driven by a recovery in credit to agriculture and housing. The steadfast drive to promote affordable housing under the ambit of the Pradhan Mantri Awas Yojana (PMAY), coupled with the Reserve Bank’s June 2018 initiative to expand the eligibility of housing loan limits for priority sector lending enabled a sharp jump in housing loan growth from 0.7 per cent in 2017-18 to 24.9 per cent in 2018-19 (Chart IV.20). Both PVBs and PSBs contributed to this revival.  IV.48 All bank groups managed to achieve the overall priority sector lending (PSL) target. However, shortfalls were found in certain sub-targets: PSBs in micro enterprises; PVBs in small and marginal farmers; and both PVBs and FBs in non-corporate individual farmers (Table IV.15). The total trading volume of the Priority Sector Lending Certificates (PSLC) platform – introduced in April 2016 to allow market mechanism to drive priority sector lending by leveraging the comparative strength of different banks – grew by 78 per cent to ₹ 3,27,429 crores as on March 31, 2019. Among the four PSLC categories, the highest trading was recorded in the case of PSLC-General and PSLC-small and marginal farmer, with transaction volumes of ₹ 1,32,485 crores and ₹ 1,12,504 crores, respectively. IV.49 While the priority sector accounts for approximately 36 per cent of total bank lending13, its share in total GNPAs is 26 per cent of the total. Although the GNPA ratio of the priority sector declined marginally from 7.1 per cent at end-March 2018 to 6.8 per cent at end-March 2019, its share in total GNPAs increased during the year, mainly owing to the comparatively better performance of the non-priority sector (Table IV.16). 5.2 Credit to Sensitive Sectors IV.50 Banks’ exposure to sensitive sectors14 edged up to 23.5 per cent of total loans and advances during 2018-19. Lending to the capital markets declined in 2018-19, as banks attempted to safeguard their balance sheets against volatile market movements (Chart IV.21 and Appendix Table IV.4).  6. Operations of SCBs in the Capital Market IV.51 Against the backdrop of volatile market conditions and other uncertainties which were not conducive to raising resources from the equity market, banks did not venture into public issues. Given their financial condition, the high interest cost on debt deterred the banks from raising funds from the bond markets. There were, thus, no public issues either by PSBs or by PVBs during 2018-19 and 2019-20 (up to September 2019). Resource mobilisation through private placement of bonds too declined, both in terms of the number of issues and the amount raised. As in the previous two years, PVBs raised resources through large-sized private placements during 2018-19 (Chart IV.22 a and b). 7. Ownership Pattern in Scheduled Commercial Banks IV.52 At end-March 2019, the government’s shareholding in 13 PSBs increased due to recapitalisation, whereas it reduced in four banks albeit marginally, and remained constant in three (Chart IV.23). Capital infusions and mergers planned for PSBs in 2019-20 are likely to change the ownership structure further. Furthermore, IDBI Bank Ltd was privatised with effect from January 21, 2019, consequent upon the Life Insurance Corporation of India (LIC) attaining 51 per cent of the paid-up equity share capital of the bank. While the maximum foreign shareholding in PSBs was 11.3 per cent, four PVBs had foreign shareholding in excess of 50 per cent at end-March 2019 (Appendix Table IV.5).   8. Foreign Banks’ Operations in India and Overseas Operations of Indian Banks IV.53 During 2018-19, the number of branches operated by FBs in India increased, contrary to the trend in recent years (Table IV.17). This was mainly on account of opening of additional branches by DBS Bank post its conversion from branch to wholly owned subsidiary (WOS) mode. Indian PSBs, on the other hand, substantially reduced their overseas presence in terms of branches, representative offices and other offices with the objective of cost efficiency through shutting down of unviable foreign operations and rationalisation of multiple branches in same cities or nearby places. The presence of Indian PVBs remained stable in aggregate terms (Appendix Table IV.6). 9. Payment Systems and Scheduled Commercial Banks IV.54 The core vision for the payment and settlement systems in India is that of a less-cash society, with an emphasis on empowering every Indian with access to a bouquet of e-payment options. In pursuit of this, the focus is on making digital payments safe, secure, accessible, and affordable through enhancing competition, optimising costs, improving convenience, and raising consumer confidence. IV.55 The real time gross settlement (RTGS) system continued to dominate the payment system transactions15 in terms of value. While the share of retail electronic clearing has been increasing in terms of value and volume, card payments (debit and credit cards) witnessed a moderation in the latter. The paper clearing segment declined both in value and volume terms, as has been the trend in recent years (Chart IV.24).   IV.56 Card payments – which had decelerated in 2017-18 after the demonetisation-induced spike of the previous year – recovered in 2018-19; however, volumes remain lower than that of retail electronic payments, indicative of the changing dynamics in the payments landscape and consumer preferences (Chart IV.25) IV.57 The Reserve Bank has been striving to create an enabling environment for developing a customer-centric financial system by instituting mechanisms for addressing information asymmetries between providers and consumers of financial services, enhancing standards of disclosures and ensuring better alignment of product design vis-à-vis customer requirements, while providing an efficient and effective grievance redressal mechanism16. Recent initiatives include the Complaint Management System (CMS) which is a technology-enabled platform to effectively support the Ombudsman framework and consumer education and protection cells (CEPCs). IV.58 The increasing trend in complaints received over the years is indicative of greater awareness among consumers, especially against the backdrop of the Reserve Bank’s campaigns such as ‘RBI Kehta Hai Jankar Baniye Satark Rahiye’, and ‘Is Your Banking Complaint Unresolved?’. In spite of complaints increasing by 32,311 over the previous year, 94.03 per cent of the complaints filed were disposed of by Banking Ombudsman (BO) offices in 2018-19 as against 96.46 per cent in the previous year. Even though non-adherence to the fair practices code remained the main grievance against banks, complaints relating to ATM/debit/credit cards and mobile/electronic banking grew at a fast pace, in step with the increasing usage of these payment media (Table IV.18). IV.59 The share of complaints emanating from urban and metropolitan areas account for more than three fourth of the total, indicating the higher level of awareness regarding grievance redressal mechanisms among the customers in these population groups (Chart IV.26). A disproportionately large share of complaints relating to levy of charges without prior notice were filed against PVBs (45 per cent given that their share in total assets of the banking sector is 32 per cent). Similarly, almost all complaints relating to pensions were against PSBs (Chart IV.27).  IV.60 Since the introduction of the Pradhan Mantri Jan Dhan Yojana (PMJDY) in August 2014, the national financial inclusion agenda has taken long strides across the country in pursuit of its aim of expanding access to basic financial services to the most vulnerable sections of the population. By 2017, 77 per cent of the poorest 40 per cent in India had an account with a financial institution, the highest amongst BRICS countries. Yet, engagement of the people with the financial system remains low, as reflected in a high proportion of inactive accounts (Chart IV.28). Against this backdrop, the National Strategy for Financial Inclusion for India 2019-24, prepared under the aegis of the Financial Inclusion Advisory Committee (FIAC), incorporates the views of a range of stakeholders and market players in renewing the drive to make formal financial services accessible and affordable in a safe and transparent manner.  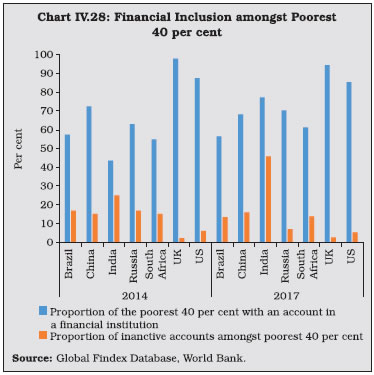 IV.61 Under financial inclusion plans (FIPs) of SCBs, the number of brick-and-mortar branches and banking outlets through the business correspondent (BC) model in rural areas increased in 2018-19, reversing the decline in 2017-18. Moreover, the share of BCs in total banking outlets in rural areas remained around 91 per cent and the number of urban locations covered through BCs recorded more than a three-fold rise. Furthermore, accelerated growth in the number of Basic Savings Bank Deposit Accounts (BSBDAs) opened via BCs and the healthy expansion of Information and Communication Technology (ICT) based transactions driven by BCs point to their rising popularity. Going forward, capacity building and skill-upgradation programmes, such as the ‘Train the Trainers’ initiative by the Reserve Bank, are expected to boost this momentum further (Table IV.19). 11.1 Pradhan Mantri Jan Dhan Yojana IV.62 As stated earlier, the PMJDY has contributed significantly to the cause of financial inclusion in the country. The total number of accounts opened under PMJDY increased to 37.1 crores, with ₹ 1.02 lakh crore of deposits as on September 25, 2019. Of these accounts, 59 per cent are operational in rural and semi-urban areas (Chart IV.29 a). Since September 2018, more than 70 per cent of the new PMJDY accounts have been opened with PSBs. The usage of these accounts, however, has stagnated in the last two years as evident from the deceleration in average balances (Chart IV.29 b). There has been a steady increase in the number of RuPay cards issued, driven by both PSBs and PVBs. 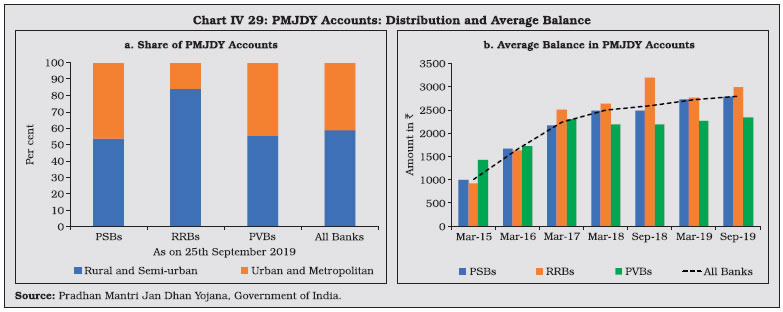 11.2 New Bank Branches IV.63 The pace of opening of new bank branches, which had moderated in the previous three consecutive years, reversed in 2018-19. More than 50 per cent of the new branches were opened in Tier-1 and Tier-2 centres; on the other hand, the shares of Tier-5 and Tier-6 centres declined (Table IV.20). This is consistent with the banks’ policy of opening branches in high population density areas where they are likely to be more commercially viable, while relying on BCs to enhance their outreach in other centres. The revised guidelines on rationalisation of branch authorisation policy introduced in May 2017 has provided banks the autonomy to decide their business strategy in facilitating financial inclusion. 11.3 ATMs IV.64 The total number of ATMs (on-site and off-site) operated by banks decreased during the year. This was partly compensated by growth in white label ATMs (WLAs) (Chart IV.30), boosted by policy changes introduced on March 7, 2019, to enhance the financial viability of WLAs, such as allowing their operators to source cash directly from the Reserve Bank, offer non-bank services, and advertise non-financial products in their premises. IV.65 While PVBs recorded an increase in their on-site and off-site ATMs, PSBs reduced both, with a higher rate of decline in the latter17. Notably, scheduled SFBs operated more ATMs than FBs by end-March 2019 (Table IV.21). Despite transactions at ATMs decelerating both in volume and value terms, they still serve as a common medium for people to access cash18. V.66 The distributional pattern of ATMs of SCBs remained broadly similar in 2018-19 to the previous year. However, rural and semi-urban areas, which had recorded marginal growth in the number of ATMs in 2017-18, experienced a decline in 2018-19. PVBs and FBs continue to have more ATMs concentrated in urban and metropolitan centres, causing the skew (Table IV.22).  11.4 Microfinance Programme IV.67 The self-help group (SHG)-bank linkage programme (SBLP) run by the National Bank for Agriculture and Rural Development (NABARD) has emerged as the world’s largest micro finance movement through which credit facilities are extended to the poor by organising them into groups and connecting them to the formal financial sector. SHGs’ outstanding loans with banks are approximately five times larger than those of their closest alternative model viz., Micro Finance Institutions (MFIs). The NPA ratio of the former reduced to 5.2 per cent from 6.1 per cent in the previous year19 (Appendix Table IV.13). 11.5 Credit to Micro, Small and Medium Enterprises (MSMEs) IV.68 Credit growth to micro, small and medium enterprises (MSMEs) accelerated in 2018-19 from the anaemic conditions that prevailed during 2017-18, owing to the aggressive credit expansion by PVBs. PSBs’ share in total credit to MSMEs decreased from 65 per cent in 2017-18 to 58 per cent in 2018-19. Although the number of accounts of PVBs was nearly double that of PSBs, the average amount of loans extended by PVBs was ₹ 2.75 lakhs – much lower than ₹ 7.79 lakhs by PSBs – indicative of the scale of businesses served by the two (Table IV.23). 11.6 Regional Banking Penetration IV.69 Banking outreach in India at the sub-national level remains heterogeneous and tilted towards the western and southern regions even after concerted efforts to further financial inclusion in hitherto unbanked areas (Chart IV.31). Concomitantly, the average population served per bank branch continues to be much higher in eastern, central and north-eastern regions than in other parts (Chart IV.32). Lower per capita income level and industrial activity, coupled with inadequate availability of infrastructural facilities are some of the factors, which are correlated with insufficient regional banking penetration in the country. However, empirical evidence suggests that regions, which historically lagged behind are catching-up (Box IV.2). IV.70 Regional Rural Banks (RRBs) were formed under the RRB Act, 1976 with the objective of providing credit and related banking facilities to small farmers, agricultural labourers, artisans, and other rural poor. In the union budget of 2019-20, ₹ 235 crores were allocated for recapitalisation of RRBs to enable them to comply with regulatory requirements and to empower them to channelise a larger volume of resources for financial inclusion. From 196 in 2005, the number of RRBs has come down to 45 as at April 1, 2019. The target is to further consolidate them into 38 RRBs to minimise overhead expenses, enhance capital, and expand their area of operation. 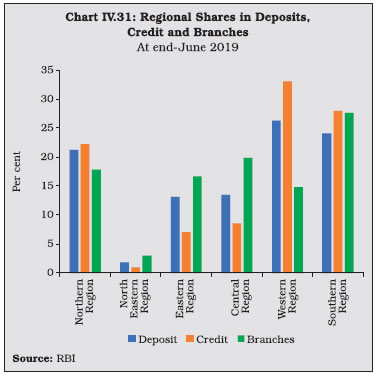 12.1 Balance Sheet Analysis IV.71 The consolidated balance sheet of RRBs expanded during the year, fuelled by growth in deposits and share capital on the liabilities side and loans and advances on the assets side. Furthermore, deposits – which had decelerated sharply in the previous year from a high demonetisation induced base – rebounded. Borrowings decelerated, mainly on account of a dip in funds from sponsor banks, although lending by other sources saw a sharp increase (Table IV.24). IV.72 In line with their mandate, the emphasis of RRBs’ lending remained on the priority sector. Within the priority sector, agriculture garnered the lion’s share – 77.1 per cent. While the balance sheet of RRBs is 3.3 per cent that of SCBs, their agriculture lending constitutes 14.8 per cent of SCB’s lending to the sector (Table IV.25). 
12.2 Financial Performance IV.73 The operating profits of RRBs declined in 2018-19, after two consecutive years of acceleration. The increase in interest income was lacklustre vis-à-vis the acceleration in operating expenses, of which the wage bill was the major contributor. The asset quality of RRBs has been worsening since 2015-16, leading to capital erosion (Table IV.26). IV.74 The consolidated assets of the three local area banks (LABs) grew at 13 per cent in 2018-19 up from 4.5 per cent in 2017-18. The credit-deposit ratio, on the other hand, fell from 79 per cent in the previous year to 75 per cent in 2018-19 as deposits accelerated at a significantly higher pace than gross advances (Table IV.27). Financial Performance IV.75 Non-interest income of LABs declined in 2018-19, causing the growth in overall income to decelerate in comparison to 2017-18. Expenditure, however, accelerated, leading to a deterioration in profitability (Table IV.28). IV.76 Small Finance Banks (SFBs) were set up in 2016 to offer basic banking services such as accepting deposits and lending to the unserved and the under-served sections, including small businesses, marginal farmers, micro and small industries, and the unorganised sector. At end-March 2019, ten SFBs were operational. 14.1 Balance Sheet IV.77 The consolidated balance sheet of SFBs expanded in 2018-19. Their deposit base more than doubled as they shed their legacy dependence on bank borrowings. While loans and advances grew strongly during the year and constituted 70.6 per cent of total assets, investments also registered a robust growth (Table IV.29). 14.2 Priority Sector Lending IV.78 SFBs’ share in advances to the priority sector declined for the second year in a row in 2018-19. Their focus remained on micro, small, and medium enterprises, followed by agriculture (Table IV.30). 14.3 Financial Performance IV.79 During 2018-19, the asset quality of SFBs improved significantly, leading to a contraction in provisions and contingencies even as their CRAR remained stable. Total income also grew, although one SFB reported exceptionally high losses which wiped out the net profit of other SFBs taken together in their combined finances (Table IV.31). IV.80 Payments Banks (PBs) were set up on the basis of the recommendations of the Committee on Comprehensive Financial Services for Small Businesses and Low-Income Households (Chairman: Shri Nachiket Mor) with the objective of improving financial inclusion by harnessing technology services via mobile telephony. PBs cannot undertake lending activities and their design is functionally equivalent to that of pre-paid instrument (PPI) providers which are permitted to receive cash payments from customers, store them in a digital wallet, and allow customers to pay for goods and services from this wallet. Consequently, credit and market risks involved in PBs’ activities are limited, though they are subject to operational and liquidity risks. The evolution of PBs since their inception suggests that they are yet to achieve the optimal scale to break-even or attain profitability. 15.1 Balance Sheet IV.81 At end-March 2019, there were seven PBs operational in India as compared with five as at end-March 2018. The consolidated balance sheet of PBs expanded in 2018-19 as their deposits more than doubled during the year. The share of deposits in total liabilities increased from 9 per cent to 12.4 per cent during the same period, although they can accept deposits only up to ₹ 1 lakh per customer. While total capital and reserves witnessed a marginal increase, other liabilities (such as unspent balances in PPIs) accounted for 61.3 per cent of total liabilities at end-March 2019 (Table IV.32). IV.82 PBs’ asset composition reflected the regulatory structure under which they operate; they are required to maintain a minimum investment of 75 per cent of demand deposit balances (DDBs) in Government securities for maintenance of SLR and hold a maximum 25 per cent with other SCBs. Furthermore, balances outstanding under PPIs issued should be flexibly deployed between SLR-eligible Government securities and bank deposits in such a manner that they are able to comply with the requirements of CRR and SLR on overall outside liabilities. During 2018-19, the share of investments declined to 43.9 per cent from 50 per cent in the previous year (Table IV.32). 15.2 Financial Performance IV.83 Despite improvement in net interest income and non-interest income, increases in operating expenses resulted in overall negative profits for PBs in 2018-19. The limited operational space available to them and the large initial costs involved in setting up of the infrastructure imply that it may take time for PBs to break even as they expand their customer base (Table IV.33). IV.84 Net interest margin (NIM) and efficiency (cost-to income) improved during the year even as losses as reflected in RoA, RoE and profit margins continued (Table IV.34). 15.3 Inward and Outward Remittances IV.85 In 2018-19, transactions through UPI took over from E-wallets as the most prominent channel for inward and outward remittances in terms of both value and volume (Table IV.35). IV.86 The banking sector is slowly turning around on the back of improvement in asset quality, strengthening capital base, and a return to profitability. At this cusp, however, the evolving macroeconomic scenario, and particularly, the ongoing loss of pace in domestic economic activity, presents daunting challenges as widespread risk aversion has turned credit demand anaemic even as corporations deleverage their own stressed balance sheets. Notwithstanding the improvement in 2018-19, the overhang of NPAs remains high. Further reduction in NPAs through recoveries hinges around a reversal of the downturn in the economy. IV.87 While banks have oriented their lending towards the relatively stress-free retail, the slowdown in private consumption spending has imposed limits to this growth strategy even as the possibility of defaults among retail segments rises as growth slows down. IV.88 The recapitalisation of PSBs remains an unfinished agenda. Apart from meeting the regulatory minimum, commercial banks need to augment their capital base to guard against future balance sheet stress. Moreover, they also need to improve their valuation methodologies, credit monitoring and risk management strategies in order to build resilience. IV.89 Over the last couple of years, the space vacated by risk-averse PSBs was taken up by PVBs; more recently, however, fault lines are becoming evident in the latter’s corporate governance. This is occurring at a time when the balance sheets of PSBs have not yet regained their strength. IV.90 Banks’ lending to NBFCs has remained strong, reflecting the policy initiatives to alleviate liquidity stress in that sector. Nonetheless, appropriate risk pricing is warranted so that excessive risk-build up does not occur. IV.91 Going forward, optimal bank capital, stringent corporate governance practices, and effective risk management strategies will help in strengthening the robustness of the banking system in an increasingly dynamic economic environment. Emergence of niche players is expected to augment innovation in financial technology and provide further impetus to the agenda of financial inclusion. 1 The average share of PVBs in the incremental term deposits during 2016-19 was 81 per cent vis-à-vis a 19 per cent in 2011-2015. Corresponding numbers for PSBs were 13 per cent and 77 per cent, respectively. 2 The sharp growth is partly due to the base effect, emnating from the reclassification of IDBI Ltd. as a PVB as on January 21, 2019. However, even after accounting for this reclassification, the credit growth was led by PVBs. 3 Source: Bank for International Settlements (BIS), 2019 available at www.bis.org 4 Source: BIS, available at www.bis.org 5 As per BIS data, available at https://stats.bis.org/statx/srs/table/a1?m=S. 6 After accounting for the reclassification of IDBI Bank Ltd as a PVB in 2018-19. 7 Return on assets = Return on assets for the bank groups are obtained as weighted average of return on assets of individual banks in the group, weights being the proportion of total assets of the bank as percentage to total assets of all banks in the corresponding bank group and Return on equity = Net profit/Average total equity. 8 Even after accounting for the reclassification of IDBI Bank Ltd as a PVB. 9 Please refer Chapter III for details. 10 Slippage ratio is defined as (Fresh accretion of NPAs during the year/Total standard assets at the beginning of the year) *100 11 Defined as the amount recovered as a per cent of amount involved. 12 Involving ₹ 50 crore or above 13 Corresponds to 43 per cent of ANBC. 14 Sensitive sectors include capital market, real estate and commodities. 15 Includes RTGS, paper clearing, retail electronic clearing, card payments and pre-paid payment instruments (PPIs). 16 Consumer Protection in a Digital Financial World – Initiatives and Beyond, Shri M K Jain, Deputy Governor, Reserve Bank of India. Speech delivered at the Annual Conference of Banking Ombudsman – 2019, Mumbai on June 21, 2019. 17 This is partly due to the reclassification of IDBI Bank as a private bank. Adjusted for IDBI bank, the PVBs showed a reduction in off-site ATMs and in the total number of ATMs, with no change among PSBs. 18 During 2018-19, the value of transactions that occurred at ATMs is 2.8 times that of PoS. | ||||||||||||||||||||||||||||||||||||||||||||||||||||||||||||||||||||||||||||||||||||||||||||||||||||||||||||||||||||||||||||||||||||||||||||||||||||||||||||||||||||||||||||||||||||||||||||||||||||||||||||||||||||||||||||||||||||||||||||||||||||||||||||||||||||||||||||||||||||||||||||||||||||||||||||||||||||||||||||||||
পেজের শেষ আপডেট করা তারিখ:


