Average of months/Average of |
Weight |
1994-95 |
2005-06 |
2006-07 |
2006 |
2007 |
weeks ended Saturday |
|
|
April-March |
Aug. |
Mar. |
Apr. |
May |
Jun. |
Jul. |
Aug. |
1 |
2 |
3 |
4 |
5 |
6 |
7 |
8 |
9 |
10 |
11 |
12 |
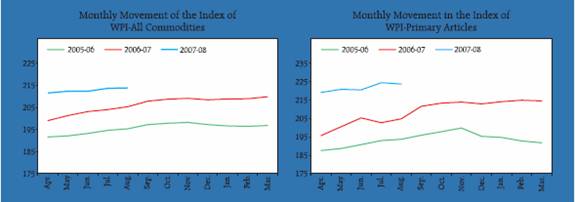
ALL COMMODITIES |
100.000 |
112.6 |
195.6 |
206.1 |
205.3 |
209.8 |
211.5 |
212.3 |
212.3 |
213.6 |
213.8 |
I. |
Primary Articles |
22.025 |
115.8 |
193.6 |
208.6 |
204.9 |
214.6 |
219.2 |
220.9 |
220.6 |
224.5 |
223.8 |
|
(A) Food Articles |
15.402 |
112.8 |
195.3 |
210.3 |
205.1 |
214.0 |
218.3 |
220.6 |
219.3 |
223.2 |
222.6 |
|
a. |
Foodgrains |
|
|
|
|
|
|
|
|
|
|
|
|
|
(Cereals+Pulses) |
5.009 |
114.7 |
186.9 |
205.9 |
201.0 |
211.1 |
211.0 |
210.9 |
211.2 |
214.1 |
215.6 |
|
|
a1. Cereals |
4.406 |
113.6 |
185.8 |
199.3 |
195.4 |
205.8 |
205.2 |
205.6 |
206.3 |
209.2 |
211.1 |
|
|
a2. Pulses |
0.603 |
122.2 |
194.6 |
253.8 |
242.1 |
250.4 |
252.5 |
249.0 |
247.1 |
249.7 |
248.6 |
|
b. |
Fruits & Vegetables |
2.917 |
108.0 |
219.3 |
227.9 |
216.6 |
222.3 |
238.3 |
244.7 |
232.9 |
245.8 |
243.6 |
|
|
b1. Vegetables |
1.459 |
110.4 |
191.6 |
197.9 |
209.7 |
178.0 |
214.6 |
222.3 |
236.2 |
273.2 |
268.7 |
|
|
b2. Fruits |
1.458 |
105.7 |
247.0 |
258.0 |
223.6 |
266.6 |
262.1 |
267.1 |
229.5 |
218.3 |
218.5 |
|
c. |
Milk |
4.367 |
110.3 |
184.3 |
195.8 |
191.6 |
201.2 |
203.0 |
205.6 |
207.3 |
209.2 |
212.2 |
|
d. |
Eggs, meat & fish |
2.208 |
116.1 |
217.2 |
226.9 |
226.1 |
236.6 |
240.8 |
245.8 |
246.0 |
244.6 |
232.8 |
|
e. |
Condiments & spices |
0.662 |
126.2 |
176.9 |
227.9 |
223.0 |
232.5 |
235.1 |
228.9 |
231.3 |
237.8 |
241.1 |
|
f. |
Other food articles |
0.239 |
111.6 |
129.9 |
154.3 |
151.3 |
149.0 |
149.0 |
150.1 |
161.2 |
157.4 |
153.8 |
|
(B) Non-Food Articles |
6.138 |
124.2 |
179.1 |
188.2 |
187.2 |
200.0 |
204.8 |
203.4 |
206.0 |
210.9 |
210.5 |
|
a. |
Fibres |
1.523 |
150.0 |
149.7 |
155.9 |
162.6 |
160.8 |
173.3 |
166.7 |
170.4 |
179.7 |
179.0 |
|
b. |
Oil seeds |
2.666 |
118.5 |
167.1 |
175.7 |
167.8 |
199.7 |
203.8 |
205.1 |
210.7 |
217.2 |
215.5 |
|
c. |
Other non-food articles |
1.949 |
112.0 |
218.5 |
230.6 |
233.0 |
231.0 |
231.0 |
229.7 |
227.3 |
226.5 |
228.1 |
|
(C) Minerals |
0.485 |
104.9 |
322.8 |
413.2 |
424.6 |
420.0 |
428.6 |
452.3 |
448.3 |
437.6 |
429.8 |
|
a. |
Metallic minerals |
0.297 |
103.8 |
453.1 |
598.7 |
618.2 |
608.1 |
622.0 |
661.8 |
655.4 |
638.0 |
622.7 |
|
b. |
Other minerals |
0.188 |
106.7 |
117.0 |
120.4 |
118.7 |
123.0 |
123.2 |
121.4 |
121.2 |
121.0 |
125.2 |
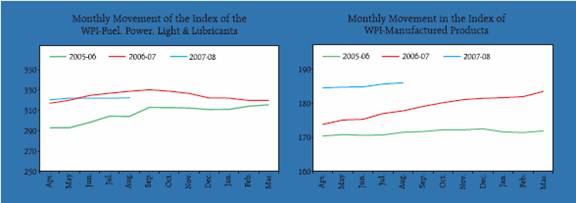
II. |
Fuel, Power, Light & Lubricants |
14.226 |
108.9 |
306.8 |
324.9 |
328.8 |
319.8 |
320.4 |
322.1 |
322.0 |
321.9 |
322.4 |
|
a. |
Coal mining |
1.753 |
105.1 |
231.6 |
231.6 |
231.6 |
231.6 |
231.6 |
231.6 |
231.6 |
231.6 |
231.6 |
|
b. |
Minerals oils |
6.990 |
106.1 |
359.8 |
388.1 |
402.3 |
379.1 |
380.3 |
383.5 |
383.3 |
383.0 |
384.0 |
|
c. |
Electricity |
5.484 |
113.6 |
263.4 |
271.7 |
266.3 |
272.4 |
272.4 |
272.7 |
272.7 |
272.7 |
272.7 |
Average of months/Average of |
Weight |
1994-95 |
2005-06 |
2006-07 |
2006 |
2007 |
weeks ended Saturday |
|
April-March |
Aug. |
Mar. |
Apr. |
May |
Jun. |
Jul. |
Aug. |
1 |
2 |
3 |
4 |
5 |
6 |
7 |
8 |
9 |
10 |
11 |
12 |
III.Manufactured Products |
63.749 |
112.3 |
171.5 |
179.0 |
177.8 |
183.5 |
184.6 |
184.8 |
184.9 |
185.7 |
186.1 |
(A) Food Products |
11.538 |
114.1 |
176.9 |
182.5 |
181.6 |
185.2 |
185.8 |
183.7 |
183.5 |
186.4 |
187.0 |
a. |
Dairy products |
0.687 |
117.0 |
206.5 |
217.3 |
217.2 |
219.9 |
220.3 |
224.3 |
224.6 |
227.4 |
233.1 |
b. |
Canning, preserving & |
|
|
|
|
|
|
|
|
|
|
|
|
processing of fish |
0.047 |
100.0 |
273.1 |
283.7 |
283.1 |
289.5 |
293.8 |
293.8 |
293.8 |
293.8 |
293.8 |
c. |
Grain mill products |
1.033 |
103.7 |
187.8 |
219.6 |
212.7 |
230.9 |
222.6 |
217.8 |
218.1 |
224.4 |
227.6 |
d. |
Bakery products |
0.441 |
107.7 |
175.8 |
184.3 |
186.4 |
192.2 |
192.2 |
192.2 |
192.2 |
192.2 |
192.2 |
e. |
Sugar, khandsari & gur |
3.929 |
119.1 |
178.8 |
179.8 |
185.6 |
164.3 |
163.1 |
158.7 |
155.7 |
155.6 |
155.1 |
f. |
Manufacture of |
|
|
|
|
|
|
|
|
|
|
|
|
common salts |
0.021 |
104.8 |
235.1 |
223.0 |
204.9 |
220.0 |
219.0 |
218.0 |
218.0 |
217.6 |
219.3 |
g. |
Cocoa, chocolate, |
|
|
|
|
|
|
|
|
|
|
|
|
sugar & confectionery |
0.087 |
118.3 |
177.2 |
183.1 |
183.0 |
188.1 |
188.1 |
188.1 |
188.1 |
188.1 |
188.1 |
h. |
Edible oils |
2.775 |
110.9 |
146.1 |
154.6 |
151.9 |
163.6 |
165.4 |
166.2 |
168.3 |
171.4 |
171.1 |
i. |
Oil cakes |
1.416 |
121.6 |
189.8 |
196.6 |
187.8 |
224.3 |
235.8 |
228.8 |
230.6 |
241.3 |
239.2 |
j. |
Tea & coffee proccessing |
0.967 |
104.4 |
197.3 |
178.9 |
171.5 |
188.6 |
187.8 |
188.4 |
189.4 |
191.3 |
197.0 |
k. |
Other food products n.e.c. |
0.154 |
111.6 |
190.1 |
198.1 |
199.2 |
201.4 |
210.4 |
211.4 |
214.7 |
214.7 |
214.7 |
(B) Beverages, Tobacco & |
|
|
|
|
|
|
|
|
|
|
|
Tobacco Products |
1.339 |
118.3 |
226.8 |
243.5 |
238.7 |
256.3 |
258.5 |
263.9 |
264.7 |
265.0 |
265.0 |
a. |
Wine Industries |
0.269 |
150.2 |
246.1 |
288.7 |
282.3 |
306.9 |
306.9 |
306.9 |
306.9 |
308.8 |
308.8 |
b. |
Malt liquor |
0.043 |
109.1 |
195.9 |
204.1 |
209.3 |
202.7 |
203.0 |
203.7 |
197.0 |
197.0 |
197.0 |
c. |
Soft drinks & |
|
|
|
|
|
|
|
|
|
|
|
|
carbonated water |
0.053 |
109.1 |
164.8 |
176.3 |
171.0 |
186.7 |
186.7 |
186.7 |
186.7 |
186.7 |
187.1 |
d. |
Manufacture of bidi, |
|
|
|
|
|
|
|
|
|
|
|
|
cigarettes, tobacco & zarda |
0.975 |
110.4 |
226.2 |
236.4 |
231.6 |
248.4 |
251.5 |
258.9 |
260.2 |
260.2 |
260.2 |
Average of months/Average of |
Weight |
1994-95 |
2005-06 |
2006-07 |
2006 |
2007 |
weeks ended Saturday |
|
|
April-March |
|
Aug. |
Mar. |
Apr. |
May |
Jun. |
Jul. |
Aug. |
1 |
2 |
3 |
4 |
5 |
6 |
7 |
8 |
9 |
10 |
11 |
12 |
(C) Textiles |
9.800 |
118.2 |
129.5 |
132.3 |
131.8 |
133.2 |
132.7 |
132.6 |
132.1 |
132.5 |
132.8 |
a. |
Cotton textiles |
4.215 |
132.7 |
154.3 |
159.1 |
157.6 |
159.9 |
159.2 |
160.5 |
160.1 |
159.5 |
160.1 |
|
a1. Cotton yarn |
3.312 |
136.2 |
150.0 |
156.4 |
154.4 |
157.3 |
156.4 |
158.0 |
157.5 |
156.7 |
158.0 |
|
a2. Cotton cloth (Mills) |
0.903 |
119.9 |
170.2 |
169.4 |
169.4 |
169.4 |
169.4 |
169.6 |
169.8 |
169.8 |
168.1 |
b. |
Man made textiles |
4.719 |
105.9 |
94.7 |
96.2 |
97.8 |
96.1 |
96.6 |
96.5 |
96.7 |
97.8 |
97.7 |
|
b1. Man made fibre |
4.406 |
105.6 |
91.6 |
93.4 |
95.1 |
93.2 |
93.8 |
93.6 |
93.9 |
95.1 |
95.1 |
|
b2. Man made cloth |
0.313 |
109.9 |
138.6 |
136.2 |
136.3 |
136.3 |
136.2 |
136.2 |
136.2 |
136.2 |
134.4 |
c. |
Woolen textiles |
0.190 |
132.6 |
181.4 |
174.1 |
170.4 |
170.3 |
170.3 |
170.3 |
170.3 |
170.3 |
170.3 |
d. |
Jute, hemp & mesta textiles |
0.376 |
110.3 |
206.4 |
217.3 |
204.3 |
239.4 |
229.0 |
211.6 |
202.5 |
205.7 |
209.1 |
e. |
Other misc. textiles |
0.300 |
109.0 |
199.6 |
189.8 |
190.2 |
184.9 |
184.7 |
184.8 |
184.6 |
182.2 |
181.8 |
(D) Wood & Wood Products |
0.173 |
110.9 |
194.6 |
206.4 |
201.5 |
215.6 |
215.9 |
215.9 |
215.9 |
215.9 |
215.9 |
(E) Paper & Paper Products |
2.044 |
106.1 |
178.4 |
190.7 |
190.9 |
192.6 |
192.5 |
192.6 |
192.8 |
193.8 |
194.8 |
a. |
Paper & pulp |
1.229 |
108.7 |
157.5 |
170.2 |
170.3 |
172.9 |
173.0 |
172.8 |
173.1 |
174.7 |
176.5 |
b. |
Manufacture of boards |
0.237 |
110.9 |
135.3 |
165.6 |
166.9 |
163.4 |
162.8 |
164.3 |
164.3 |
164.3 |
164.3 |
c. |
Printing & publishing of |
|
|
|
|
|
|
|
|
|
|
|
|
newspapers,periodicals etc. |
0.578 |
98.5 |
240.6 |
244.6 |
244.5 |
246.3 |
246.3 |
246.3 |
246.3 |
246.3 |
246.3 |
(F) Leather & Leather Products |
1.019 |
109.7 |
166.8 |
159.4 |
156.0 |
164.9 |
164.7 |
164.7 |
165.2 |
167.2 |
167.3 |
(G) Rubber & Plastic Products |
2.388 |
106.4 |
139.1 |
148.2 |
145.2 |
152.8 |
155.0 |
155.0 |
154.6 |
154.5 |
154.6 |
a. |
Tyres & tubes |
1.286 |
104.1 |
131.1 |
141.5 |
141.2 |
146.3 |
150.2 |
150.2 |
150.2 |
150.2 |
150.2 |
|
a1. Tyres |
1.144 |
103.4 |
122.5 |
130.4 |
131.5 |
133.2 |
136.8 |
136.8 |
136.8 |
136.8 |
136.8 |
|
a2. Tubes |
0.142 |
110.0 |
201.0 |
231.4 |
219.2 |
251.9 |
258.0 |
258.0 |
258.0 |
258.0 |
258.0 |
b. |
Plastic products |
0.937 |
106.8 |
139.1 |
146.7 |
139.0 |
152.7 |
153.0 |
153.0 |
152.0 |
151.8 |
152.0 |
c. |
Other rubber & plastic |
|
|
|
|
|
|
|
|
|
|
|
|
products |
0.165 |
121.0 |
201.5 |
209.8 |
212.4 |
203.8 |
203.8 |
203.8 |
203.6 |
202.8 |
202.8 |
(H) Chemicals & Chemical |
|
|
|
|
|
|
|
|
|
|
|
Products |
11.931 |
116.6 |
188.3 |
193.9 |
193.2 |
198.4 |
200.1 |
202.0 |
201.8 |
201.9 |
202.8 |
a. |
Basic heavy inorganic |
|
|
|
|
|
|
|
|
|
|
|
|
chemicals |
1.446 |
112.2 |
174.4 |
171.0 |
175.5 |
166.3 |
167.5 |
169.6 |
170.4 |
173.1 |
177.6 |
b. |
Basic heavy organic |
|
|
|
|
|
|
|
|
|
|
|
|
chemicals |
0.455 |
118.7 |
164.2 |
180.2 |
187.5 |
182.3 |
182.7 |
180.7 |
183.9 |
176.2 |
173.9 |
c. |
Fertilisers & pesticides |
4.164 |
117.7 |
171.6 |
171.6 |
170.0 |
171.3 |
173.0 |
172.6 |
172.5 |
172.5 |
172.8 |
|
c1. Fertilisers |
3.689 |
115.8 |
174.9 |
177.2 |
176.7 |
178.1 |
180.0 |
179.6 |
179.4 |
179.4 |
179.8 |
|
c2. Pesticides |
0.475 |
132.5 |
145.9 |
127.9 |
117.9 |
118.2 |
118.2 |
118.3 |
118.6 |
118.6 |
118.5 |
d. |
Paints, varnishes & lacquers |
0.496 |
101.3 |
124.0 |
128.1 |
127.7 |
129.7 |
134.5 |
137.1 |
137.0 |
136.9 |
146.4 |
e. |
Dyestuffs & indigo |
0.175 |
108.4 |
110.8 |
105.8 |
105.2 |
105.2 |
105.2 |
105.2 |
105.2 |
112.7 |
112.7 |
f. |
Drugs & medicines |
2.532 |
129.4 |
278.1 |
293.1 |
291.5 |
308.8 |
310.5 |
315.8 |
315.4 |
315.6 |
315.6 |
g. |
Perfumes, cosmetics, |
|
|
|
|
|
|
|
|
|
|
|
|
toiletries etc. |
0.978 |
118.0 |
204.9 |
223.6 |
221.1 |
235.4 |
238.4 |
238.4 |
238.4 |
238.4 |
238.4 |
h. |
Turpentine, synthetic |
|
|
|
|
|
|
|
|
|
|
|
|
resins, plastic materials etc. |
0.746 |
107.6 |
131.8 |
133.4 |
127.9 |
138.6 |
138.4 |
148.1 |
143.8 |
142.9 |
141.3 |
i. |
Matches, explosives & other |
|
|
|
|
|
|
|
|
|
|
|
|
chemicals n.e.c. |
0.940 |
98.3 |
128.8 |
136.0 |
135.0 |
141.1 |
142.6 |
142.6 |
142.6 |
142.6 |
142.5 |
Average of months/Average of |
Weight |
1994-95 |
2005-06 |
2006-07 |
2006 |
2007 |
weeks ended Saturday |
|
|
April-March |
Aug. |
Mar. |
Apr. |
May |
Jun. |
Jul. |
Aug. |
1 |
2 |
3 |
4 |
5 |
6 |
7 |
8 |
9 |
10 |
11 |
12 |
(I) |
Non-Metallic Mineral |
|
|
|
|
|
|
|
|
|
|
|
|
Products |
2.516 |
110.9 |
170.0 |
191.8 |
189.8 |
201.9 |
203.1 |
204.1 |
205.0 |
206.3 |
207.5 |
|
a. |
Structural clay products |
0.230 |
100.0 |
189.7 |
195.2 |
195.2 |
197.1 |
203.5 |
211.7 |
211.7 |
211.7 |
211.7 |
|
b. |
Glass, earthernware, |
|
|
|
|
|
|
|
|
|
|
|
|
|
chinaware & their products |
0.237 |
113.3 |
159.4 |
160.7 |
156.6 |
168.6 |
168.6 |
168.6 |
168.6 |
168.6 |
168.6 |
|
c. |
Cement |
1.731 |
112.4 |
166.7 |
197.3 |
195.0 |
210.7 |
211.6 |
211.6 |
213.3 |
215.1 |
215.6 |
|
d. |
Cement, slate & graphite |
|
|
|
|
|
|
|
|
|
|
|
|
|
products |
0.319 |
108.8 |
181.6 |
182.9 |
182.3 |
182.3 |
182.3 |
182.3 |
182.3 |
182.3 |
188.9 |
(J) |
Basic Metals Alloys & |
|
|
|
|
|
|
|
|
|
|
|
|
Metals Products |
8.342 |
108.4 |
218.7 |
233.3 |
231.7 |
241.9 |
244.6 |
244.5 |
244.6 |
244.5 |
243.5 |
|
a. |
Basic Metals & Alloys |
6.206 |
107.0 |
232.4 |
236.3 |
235.8 |
242.8 |
245.9 |
246.8 |
247.4 |
247.7 |
246.6 |
|
|
a1. Iron & Steel |
3.637 |
106.0 |
250.7 |
254.4 |
253.8 |
261.9 |
266.7 |
267.9 |
268.1 |
268.8 |
267.5 |
|
|
a2. Foundries for Casting, |
|
|
|
|
|
|
|
|
|
|
|
|
|
Forging & Structurals |
0.896 |
106.7 |
231.8 |
228.5 |
225.1 |
236.5 |
238.3 |
238.3 |
238.3 |
238.3 |
238.3 |
|
|
a3. Pipes, Wires Drawing & |
|
|
|
|
|
|
|
|
|
|
|
|
|
Others |
1.589 |
109.5 |
193.1 |
204.1 |
204.9 |
207.4 |
207.5 |
208.2 |
210.1 |
209.6 |
208.3 |
|
|
a4. Ferro Alloys |
0.085 |
104.5 |
186.2 |
148.5 |
150.7 |
150.7 |
154.1 |
154.1 |
154.1 |
154.1 |
156.2 |
|
b. |
Non-Ferrous Metals |
1.466 |
115.9 |
194.7 |
258.3 |
252.4 |
278.8 |
280.7 |
276.0 |
274.3 |
271.8 |
270.6 |
|
|
b1. Aluminium |
0.853 |
114.7 |
210.9 |
253.6 |
251.2 |
269.5 |
269.5 |
259.0 |
257.3 |
252.3 |
252.3 |
|
|
b2. Other Non-Ferrous |
|
|
|
|
|
|
|
|
|
|
|
|
|
Metals |
0.613 |
117.7 |
172.2 |
264.8 |
254.0 |
291.7 |
296.3 |
299.8 |
298.0 |
298.9 |
296.0 |
|
c. |
Metal Products |
0.669 |
105.0 |
144.1 |
149.8 |
148.4 |
153.8 |
153.8 |
153.8 |
153.8 |
154.7 |
155.5 |
(K) |
Machinery & Machine Tools |
8.363 |
106.0 |
147.5 |
155.6 |
153.7 |
161.9 |
163.0 |
164.6 |
165.1 |
166.0 |
166.7 |
|
a. |
Non-electrical machinery |
|
|
|
|
|
|
|
|
|
|
|
|
|
& parts |
3.379 |
108.6 |
188.3 |
194.8 |
194.9 |
196.6 |
197.5 |
198.0 |
197.8 |
198.0 |
198.4 |
|
|
a1. Heavy machinery |
|
|
|
|
|
|
|
|
|
|
|
|
|
& parts |
1.822 |
111.0 |
199.2 |
201.8 |
201.7 |
203.7 |
204.5 |
205.2 |
204.9 |
205.0 |
205.0 |
|
|
a2. Industrial machinery |
|
|
|
|
|
|
|
|
|
|
|
|
|
for textiles, etc. |
0.568 |
108.5 |
245.6 |
255.2 |
255.2 |
256.5 |
259.9 |
259.9 |
259.9 |
260.2 |
260.9 |
|
|
a3. Refrigeration & other |
|
|
|
|
|
|
|
|
|
|
|
|
|
non-electrical |
|
|
|
|
|
|
|
|
|
|
|
|
|
machinery |
0.989 |
104.3 |
135.2 |
147.3 |
147.6 |
149.1 |
148.9 |
149.2 |
149.0 |
149.4 |
150.4 |
|
b. |
Electrical machinery |
4.985 |
104.2 |
119.6 |
129.0 |
125.7 |
138.4 |
139.6 |
141.9 |
142.9 |
144.3 |
145.2 |
|
|
b1. Electrical industrial |
|
|
|
|
|
|
|
|
|
|
|
|
|
machinery |
1.811 |
105.2 |
142.4 |
150.4 |
149.5 |
153.8 |
156.0 |
155.7 |
156.6 |
159.2 |
162.8 |
|
|
b2. Wires & cables |
1.076 |
109.0 |
145.7 |
179.0 |
164.5 |
215.1 |
216.3 |
226.4 |
229.4 |
231.3 |
231.3 |
|
|
b3. Dry & wet batteries |
0.275 |
105.8 |
130.5 |
148.5 |
149.1 |
159.8 |
159.9 |
161.6 |
161.6 |
162.2 |
162.8 |
|
|
b4. Electrical apparatus & |
|
|
|
|
|
|
|
|
|
|
|
|
|
appliances |
1.823 |
100.1 |
80.0 |
75.3 |
75.6 |
74.7 |
75.1 |
75.2 |
75.4 |
75.4 |
74.1 |
(L) |
Transport Equipment & Parts |
4.295 |
107.4 |
159.9 |
162.4 |
162.9 |
163.5 |
163.6 |
163.8 |
164.2 |
164.7 |
164.9 |
|
a. |
Locomotives, railway |
|
|
|
|
|
|
|
|
|
|
|
|
|
wagons & parts |
0.318 |
105.3 |
124.8 |
125.2 |
127.5 |
122.2 |
122.2 |
122.2 |
127.8 |
131.6 |
131.6 |
|
b. |
Motor vehicles,motorcycles, |
|
|
|
|
|
|
|
|
|
|
|
|
|
scooters, bicycles & parts |
3.977 |
107.6 |
162.7 |
165.4 |
165.8 |
166.8 |
166.9 |
167.1 |
167.0 |
167.3 |
167.6 |
Source : Office of the Economic Adviser, Ministry of Commerce & Industry, Government of India. |
|


