 IST,
IST,


Agriculture in 2022-23: Kharif Performance and Rabi outlook
by Rishabh Kumar^, Kirti Gupta^ and The key drivers of agricultural crop acreage and production in India include rainfall and its temporal and spatial distribution during both the southwest and north east monsoon, availability of high-quality seeds, labour, fertilisers, pesticides, price expectations, minimum support prices (MSP) and procurement policy. This article analyses the impact of key factors on kharif production estimates for 2022-23 across states and an outlook for rabi. Although the cumulative southwest monsoon rainfall was above normal, its uneven temporal and spatial distribution and heavy rains towards the end of season could have adverse impact on the standing kharif crop production. However, late rains along with the delayed withdrawal ensured higher reservoir levels and better soil moisture conditions. An empirical analysis shows rains in September, higher MSP and forecast of normal northeast monsoon could enhance acreage and productivity of Rabi crops, particularly wheat. Introduction Economies across the globe are currently facing issues in meeting the demand for food, fertiliser, fodder, fuel and finance (5 Fs) emanating from three major challenges, viz., Covid, Climate and Conflict1 (3Cs) [Hendriks et al., 2022]. While Indian agriculture could overcome the Covid, others are posing hurdles for the sector. The last two years were favourable for agricultural production and food security led by mainly surplus labour (due to reverse migration), favourable monsoon and public food support scheme specially Pradhan Mantri Garib Kalyan Yojana (PMGKAY) [Mukherjee et al., 2021; Economic Survey, 2021-22]. Farmers undertake agriculture activity in India during three seasons: (i) Sowing of kharif crops during the southwest monsoon (SWM) season (June-September) which are harvested during October-November; (ii) Rabi crops sown during the retreating SWM or the North-East Monsoon (NEM) season (November-January) and harvested in spring (February to May); and (iii) a short summer season in some regions (zaid crops).2 The key factors driving agricultural production in India include; (a) the cumulative amount of rainfall during both SWM and NEM and its temporal and spatial distribution; (b) access to irrigation; (c) timely availability of quality seeds (d) timely and adequate supply of chemical fertilisers and pesticides; (e) labour availability; (f) price expectations; and (g) MSP and procurement policies announced by the government. As in other South Asian economies, Indian agriculture is fraught with risks arising from any of these factors. The monsoon plays a defining role in agriculture production. Accounting for nearly 75 per cent of the total rainfall received in the country, the SWM rains has been one of the most important factors driving the progress of Indian agriculture, both during kharif and rabi seasons. Although irrigation coverage of more than half of gross sown area under cultivation has been achieved, agriculture production continues to be sensitive to SWM rainfall (Kumar et al., 2019; Mukherjee et al., 2021). Since the sowing of rabi crops starts during or after the withdrawal of the SWM, the SWM rains have an indirect and the subsequent NEM rains have a direct impact on rabi production as they determine the live water storage levels in the major reservoirs available for irrigation and soil moisture conditions. Consequently, despite threat posed by the climate change, the prospects for rabi crop production appear to be brighter due to above normal rains during September (a phenomenon observed during the past 3 years). The higher rains towards the end of the SWM are attributed to the prevalence of continued La Nina conditions for 3 years since 2020 (commonly known as the triple dip). Over the last two decades, rabi foodgrains production levels have gradually caught up with that of kharif production and have even surpassed the latter in some years, especially when reinforced by heavy rains in September. The average deviation of September rains from the LPA has narrowed from (-)2.9 per cent during 1981-2000 to (-)1.0 per cent during 2001-2020 (Patra et al., 2021). On the other hand, the NEM rains mostly covers the Southern peninsula wherein rabi rice cultivation is predominant. Earlier this year, rabi wheat (raised during October 2021 – March 2022) faced severe heat waves during harvest time (April-May 2022) leading to downward revision in production estimates. Further, elevated exports on account of global shortage of wheat due to Ukraine-Russia conflict worsened the domestic shortage. On the other hand, some of the key rice producing states faced significant shortage of SWM rainfall (June – September 2022). Further, unusually high rains during late September and early October 2022 caused damage to the standing kharif crops like rice, soyabean and cotton (Kumar, 2022). While estimates of lower supply of the two prime staple grains contributed to inflationary pressures, it also encouraged farmers for higher acreages in the ongoing rabi sowing season. The prospects of the upcoming rabi crops, however, are supported by adequate soil moisture conditions and higher reservoir levels (vis-à-vis last year and the 10-year average) in the key producing states. The present study aims to dive deeper into key facets of agricultural production during the kharif (June to September 2022) at the regional level and provide some outlook for upcoming rabi (October 2022 to March 2023) season. The next section of the study looks at the progress of the SWM rainfall in 2022. The review of trends in the wholesale prices of three major kharif crops - rice, arhar and soyabean for the preceding marketing season (October 2021 to September 2022) has been covered in the third section. The fourth section looks at the role of other potential factors (fertiliser, labour availability3 and procurement policies) on the performance of the agricultural sector. The status of area, production, and productivity (yield) of the agricultural crops for kharif 2022 has been presented in the fifth section. The outlook for rabi production has been covered in Section VI. The empirical exercise has been taken up in Section VII. The final section concludes with the major findings along with the policy implications. II. Progress of South-West Monsoon The India Meteorological Department (IMD) provides its first stage long range forecast (FSLRF) of SWM rainfall during mid-April, well in advance of the commencement of the rains as well as the sowing season, to facilitate crop planning for the kharif season. In 2022, in line with IMD’s forecast, the SWM landed on the Indian mainland on May 29, 2022 (2 days prior to its normal date, i.e., June 01, 2022). The initial rainfall forecast was 99 per cent of Long Period Average (LPA) rainfall with a model error of +/- 5 per cent (Table 1). The revised assessment as on May 31, 2022, upgraded the forecast to 103 per cent of LPA (with a model error for +/-4 per cent). The cumulative rainfall at the end of SWM season (as on September 30, 2022), stood at an above normal level of 925.0 mm. Notwithstanding the average rainfall being more than the LPA, its progress varied across regions (Chart 1 and 2a). While rains in the Northwest India hovered around normal benchmark, the Central India and the South Peninsula received episodes of excessive rains during the middle as well as the end of the season rendering the standing crops vulnerable to damage. The East and North East Indian regions faced rainfall deficit during most of July and August, the crucial months for the kharif sowing. Notably, states like Bihar, Uttar Pradesh, Jharkhand and West Bengal faced a deficit of more than 20 per cent as compared to the normal, reason being ineffective low-pressure systems over the Bay of Bengal and a southward shift of the east-west monsoon trough (IMD, 2022). As regards the monsoon core zone (which consists of most of the rain-fed agriculture regions as defined by the IMD), the rainfall received was sizably above the normal (20 per cent above LPA). 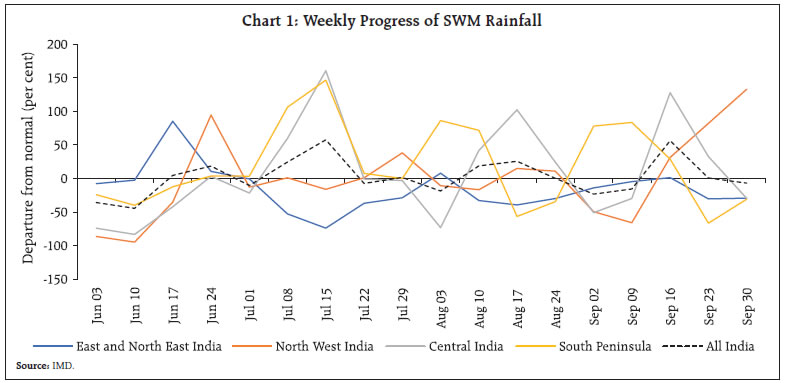 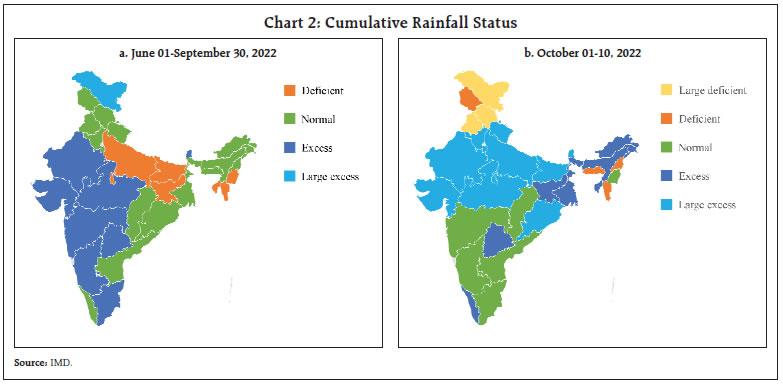 While the withdrawal of SWM started around September 20, 2022, but it ended on October 23, 2022. The slow withdrawal was due to cyclonic disturbances in the Bay of Bengal. As a result, the 52 per cent of the 36 meteorological subdivisions received above normal rainfall (October 1-10, 2022). States like Uttar Pradesh, Uttarakhand, Haryana, Rajasthan, Madhya Pradesh, Odisha, Gujarat, Telangana and Andhra Pradesh, comprising of around 47 per cent of the all-India kharif acreage, received very heavy down pour (29 per cent to 683 per cent above LPA) [Chart 2b]. The continuous heavy rains may potentially damage standing crops and cause delay in sowing of upcoming rabi crops (Bhushan et al., 2015; Anonymous, 2019; Jain and Madaan, 2019; Kumar, 2022). III. Price Situation during the Kharif Marketing Season (Oct 2021-Sept 2022) Empirical evidence shows that prices play a key role in the farmers’ decision on the allocation of acreage to various crops during the season (Gulati and Sharma, 1990; Townsend 1999; Haile et al., 2015). The prevailing prices prior to sowing period have substantial impact over the farmers price expectation (Mythili, 2006; Magrini et al, 2017). To understand the price expectation with respect to the kharif (2022) season, the wholesale prices of three major crops, namely rice, arhar and soyabean are presented in this section. Rice As per the usual trend, the average wholesale prices of rice showed wide, but increasing variations across northern and southern parts of the country. The average prices in the southern states remained at around ₹40/kg against the country average of around ₹31/kg during October 2021 to September 2022 (Chart 3a). The year-on-year (y-o-y) change was the highest in case of Chhattisgarh (24.3 per cent) [Chart 3b]. Among the major rice producing states, only Tamil Nadu (-2.6 per cent) and Punjab (-4.8 per cent) recorded decline in prices. Post the Ukraine crisis, rice export has risen substantially, thus, aggravating the price pressures in all major producer states4. This has further been fueled by the poor monsoon rains in key growing regions of eastern and northern India. The increasing price pressures on wheat following the war and due to declining stocks domestically appears to get transmitted into rice prices via its substitution by rice under the revised PMGKAY (RBI, 2022). Since March 2022, the average prices, in these states, varied widely in the range of 0.1 per cent (Tamil Nadu) to 17.5 per cent (West Bengal) on y-o-y basis indicating wider variations across states. 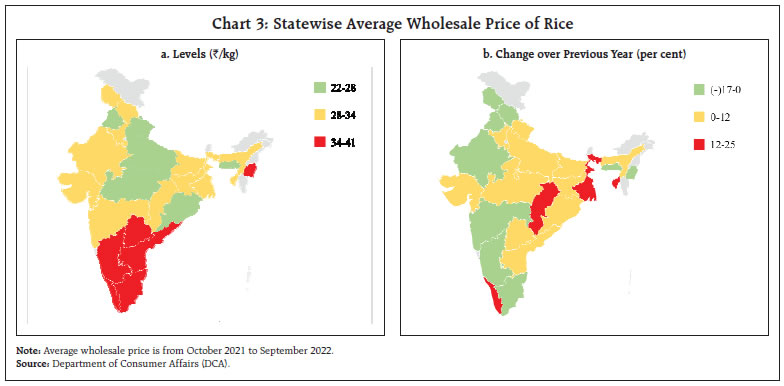 Arhar/Tur As regards arhar, the predominant kharif pulse crop, prices remained largely muted barring some of the northeastern states recording lower prices than the national average of ₹96/kg (Chart 4a). Amongst major producers, the y-o-y growth remained negative in major producer states like Karnataka, Madhya Pradesh, Andhra Pradesh, Uttar Pradesh, and Telangana except for Maharashtra (Chart 4b). As a result of the lower prices, it is likely that the farmers could have switched to other crops in place of arhar. 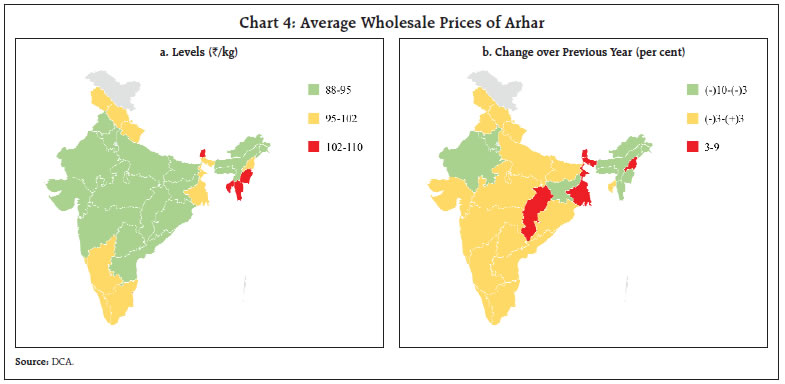 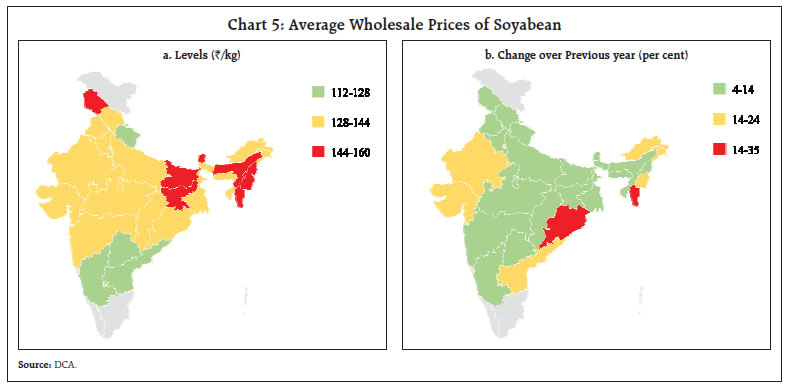 Soyabean The price of the key kharif oilseed, soyabean remained at around ₹138/kg (national average) [Chart 5a]. The prices remained comparatively lower in the central and southern states as compared to the others. The demand for soybean for both edible oil and oil meals increased substantially after the Ukraine crisis (Nasir, et al., 2022). As a result, the average prices for the kharif marketing season showed y-o-y increase in all the states (Chart 5b). While Odisha and Mizoram recorded the highest jump, the rest of the country including the major producer states like Madhya Pradesh, Maharashtra and Gujarat recorded an increase in the range of 4 per cent to 14 per cent. Fertilisers The timely and adequate supply of chemical fertilisers is essential for crop production. Anticipation of fertiliser shortage after the Ukraine conflict and the consequent rise in fertiliser subsidy from budgeted ₹1.05 lakh crore by another ₹1.10 lakh crore going to a record level of around ₹2-2.5 lakh crore for the fiscal year 2022-23 has added fiscal strain but proven to be of significance to prevent the cost of cultivation from rising sharply (The Hindu, 2022; GoI, 2022). While urea is domestically produced, India is dependent on imports for Diammonium phosphate (DAP) and Muriate of Potash (MOP). The supply of urea (most used fertiliser) remained comfortable in general whereas MOP remained in shortage (Chart 6a and 6b). The allocation of fertilisers across the states appears to be used in proportion to the amount of rainfall received. Specifically, in states like Rajasthan, Chhattisgarh, Madhya Pradesh and Gujarat, the urea supply remained higher than the requirement. Demand for jobs under Mahatma Gandhi National Rural Employment Guarantee Scheme (MGNREGS) The demand for jobs under the rural employment scheme, MGNREGS, declined during the kharif sowing months on y-o-y basis. While some part of this decline could be a part of overall economic recovery and increasing job opportunities in the rural non-farm as well as in the urban sector, a major portion of decline could be due to higher demand for labour in the agriculture sector (Chart 7a). State-wise representation shows that Telangana recorded the highest increase (113.8 per cent) in the demand for job during the peak sowing months of July and August (Chart 7b). The decline in the area coverage under major crops of the state reveals muted agricultural activity leading to higher demand for job under the scheme. The significant increase in job demand under MGNREGS in Bihar and Chhattisgarh also corroborates the subdued agriculture activity due to muted progress of monsoon rainfall. Apart from these states, Punjab and Maharashtra have also recorded higher growth in demand for MGNREGS jobs because these states are often destination of majority of the migrant labourers (Economic Survey 2021-22). On the contrary, other states with lower kharif acreage like Uttar Pradesh, Jharkhand and West Bengal reported lower demand despite poor monsoon and agricultural progress, which possibly indicates that the workers switched in the non-agricultural sectors either within the state or migrated outside. 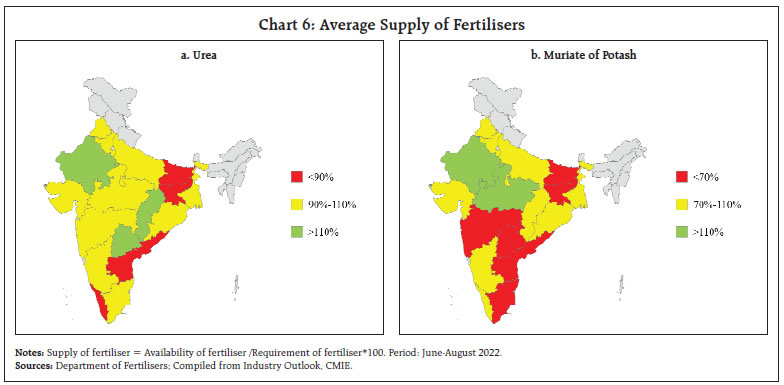 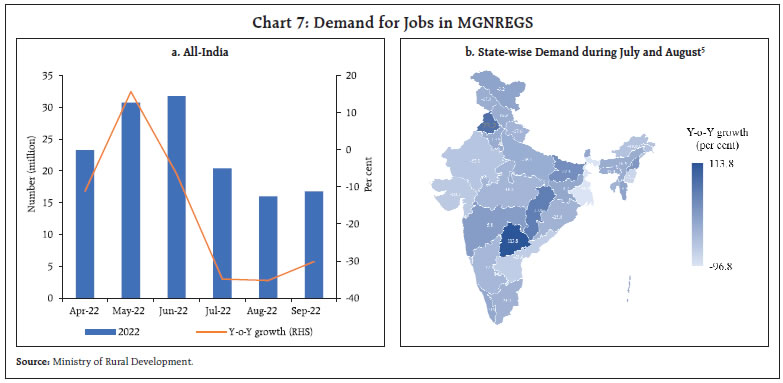 Procurement and Stocks Prior to the start of sowing activity, the Union Government announces minimum support prices (MSP) for the crops based on the cost of production as well as other demand and supply factors as recommended by the Commission on Agricultural Costs and Prices (CACP). When backed by sufficient procurement by the Food Corporation of India (FCI), National Agricultural Cooperative Marketing Federation of India Ltd. (NAFED) and other Government agencies, the MSP is observed to influence the domestic prices and shift in the cropping patterns significantly (NITI Ayog, 2016; Das, 2020). For kharif season, generally, MSP for 14 major crops is announced. The MSPs announced for the kharif season crops in 2022-23 were higher in the range of 4.4 – 8.9 per cent with an average of 6.1 per cent over the previous year. The MSP for paddy was higher by 5.2 per cent as compared to the previous year. The highest growth of MSP compared to last year was seen in the case of soyabean (8.9 per cent) followed by jowar (8.5 per cent), sesamum (7.2 per cent) and tur (4.8 per cent). On the other hand, the lowest growth is recorded in the case of bajra (4.4 per cent) followed by urad and maize. Overall, the growth numbers are higher than previous year. Increase in MSP announced for kharif season 2022-23 ensures a return of at least 50 per cent over the cost of production (including paid-out expenditure plus imputed cost of the family labour) across all the crops. The procurement operations are majorly dominated by rice during the kharif marketing season (KMS). The procurement share of rice during KMS 2021-22 was highest in Punjab, followed by Telangana and Chhattisgarh (Chart 8a). The higher y-o-y growth was observed in Chhattisgarh, West Bengal, Bihar and Madhya Pradesh. However, due to deficient rains in these states (except Madhya Pradesh) [Chart 8b], the expectation for remunerative prices emanating from increased procurement could not translate into higher acreages (discussed in the subsequent section). 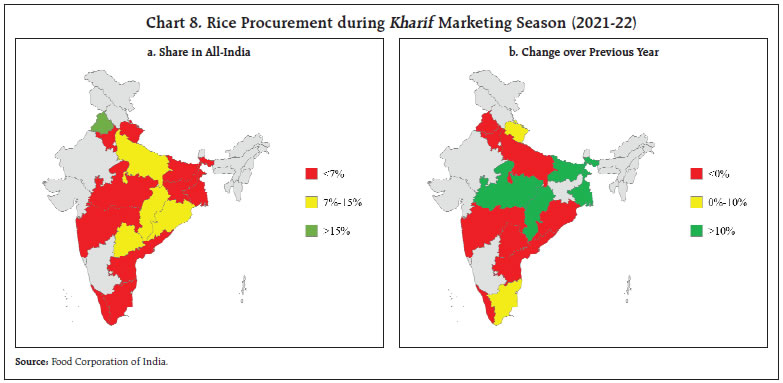 V. Kharif Production (2022-23) The production of kharif foodgrains in 2022-23, as per the First Advance Estimates (AE), is estimated at 149.9 million tonnes, 3.9 per cent lower than kharif foodgrains production of 156.0 million tonnes in 2021-22 (4th AE). Despite deficient rains, Uttar Pradesh recorded highest share in the overall food grain production followed by Madhya Pradesh (Chart 9a). While Rajasthan (25.5 per cent), followed by Telangana (13.6 per cent), recorded highest growth in the foodgrain production mainly on account of adequate rainfall However, the y-o-y growth was negative in Bihar, Uttar Pradesh, Jharkhand and Tamil Nadu (Chart 9b). The share of area under the kharif crops has been highest in Rajasthan, followed by Uttar Pradesh and Madhya Pradesh (Chart 10a). In terms of productivity of foodgrains, Punjab is at the top followed by Tamil Nadu and Haryana (Chart 10b). Kharif rice, which accounts for 86 per cent of annual rice production, estimated at 105.0 million tonnes is lower by 6.1 per cent over the 4th AE of 2021-22 on account of lower area sown as well as lower yield due to significant rainfall deficit in the major producing states like West Bengal, Uttar Pradesh, Chhattisgarh, Bihar and Assam (Table 2). However, some of the non-traditional rice producing states, namely Madhya Pradesh, Gujarat and Rajasthan, recorded significant jump in the production numbers which is possibly due to surplus rainfall received in these regions along with proportional allocation of fertilisers. In addition, a significant jump in the acreage in Madhya Pradesh could also be attributed to significant rise in the public procurement (23 per cent on y-o-y basis). Production of kharif pulses is expected at the same level as in the previous year with lower production in major pulse crops such as tur (-10.4 per cent) and urad (-5.2 per cent) compensated by other pulses. The increased acreage of pulses in Bihar, Assam, Uttar Pradesh and West Bengal reveals that the pulses (which are less water intensive crops) were substituted for the paddy in the advent of deficient rains. At all-India level, the acreage under pulses has been 6.3 per cent lower than previous year which could be attributed to y-o-y decline in the prices. 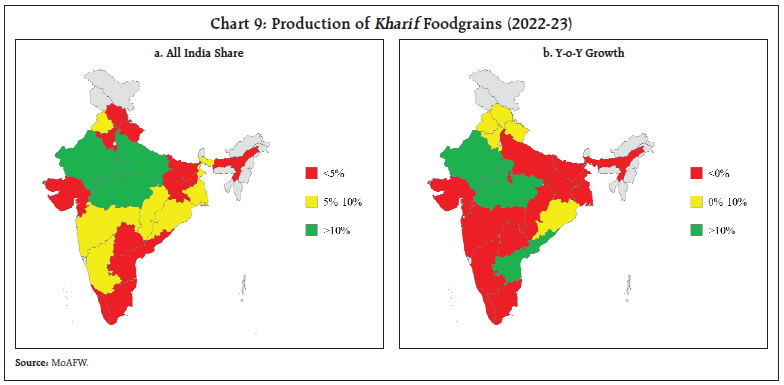 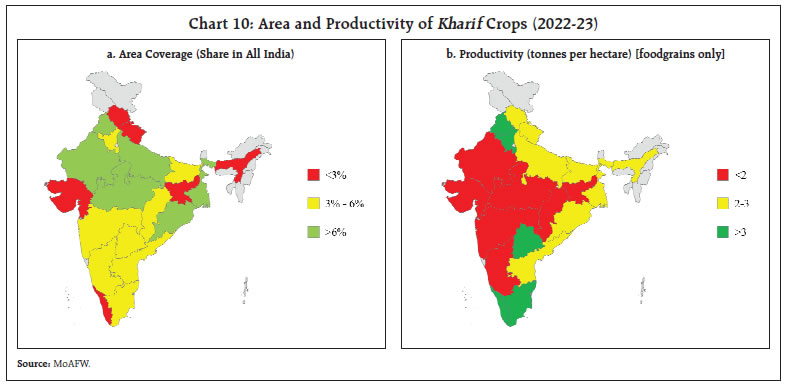 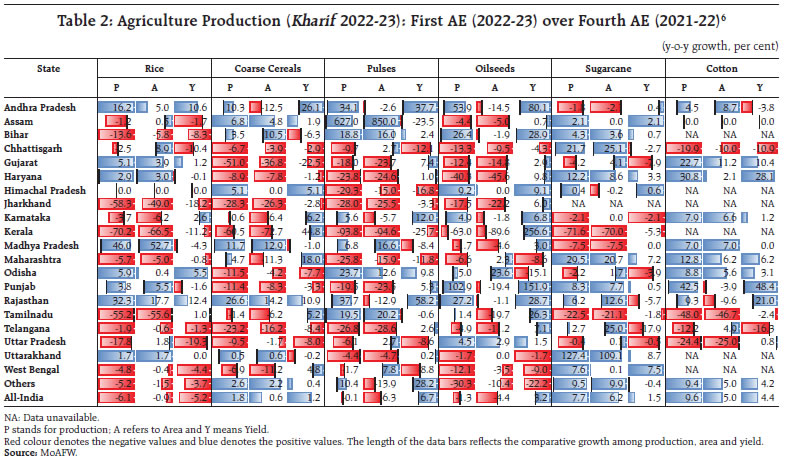 Production of kharif oilseeds is estimated to be lower by 1.3 per cent over last year driven by lower acreage in the major producer states, mainly Madhya Pradesh, Gujarat and Andhra Pradesh. Groundnut and soyabean production are expected to be less than that of last year by 0.1 per cent and 0.8 per cent, respectively. The decline in the acreage of oilseeds in these states appears to emanate from the increased cropping of cotton in anticipation of higher prices (Dave, 2022). While most of the states recorded degrowth in the oilseed acreage, rise in case of Uttar Pradesh and Odisha appears to be driven by the change in cropping pattern away from rice. The growth in the yield of the oilseeds has been higher than that of the area in most of the states. Among other commercial crops, production of cotton and sugarcane (record level) are estimated to be higher by 9.6 per cent and 7.7 per cent, respectively, over last year’s production. Among major sugarcane producing states, Maharashtra recorded an increase of 29.5 per cent due to ample rains, while the production declined in Uttar Pradesh and Tamil Nadu. All the major cotton producing states recorded jump in the production majorly driven by both growth in area as well as yield. VI. Outlook for Rabi Production (October 2022-March 2023) The harvesting of kharif crops is generally followed by the sowing of rabi (winter) crops from October. On average, wheat (48 per cent), gram (chana) [23.7 per cent], and rapeseed & mustard (10 per cent) comprise the major share in overall rabi acreage. As regards the price, wheat had highest inflation owing to the production loss due to the occurrence of prolonged heat waves during the harvesting stage as well as the reduction in global wheat supply in the wake of geopolitical conflict. With domestic open market prices prevailing above MSP, the public procurement of wheat was lower by 56.6 per cent as compared to the previous year. Being exclusively a rabi crop, the new harvest of wheat would be available from April 2023. Hence, wheat stock with the government continues to fall with offloading under various food support schemes and is thus, pulling up the prices throughout the ongoing rabi marketing season7 (Chart 12). 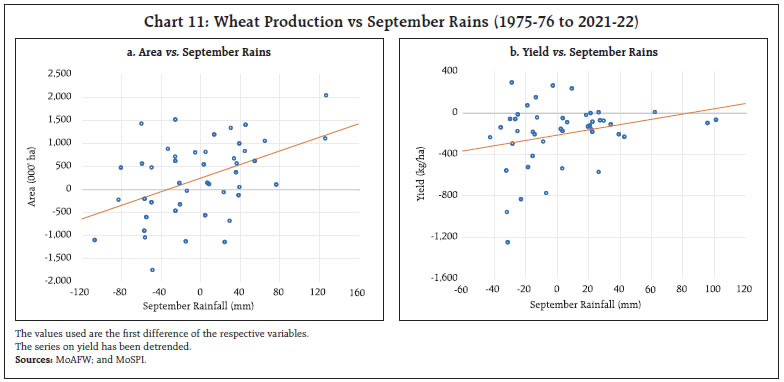 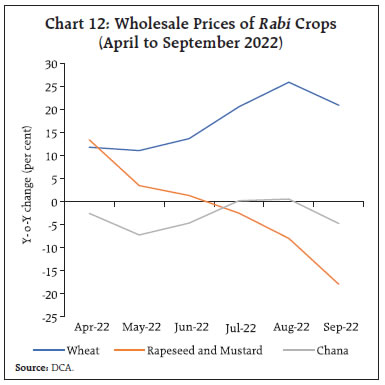 Contrastingly, the rapeseed and mustard recorded continuous decline in the y-o-y growth of wholesale prices (negative growth since mid-June) driven by record production during previous year and sufficient import of palm oil. Further, with higher inventories of the palm oil in Malaysia, one of the major global producer and exporter, India is expected to import sufficient amount of the same (Business Line, 2022). Until the importing countries significantly fasten up the import of palm oil in the wake of depreciating currencies, the price of rapeseed & mustard is not expected to record significant rise. The changes in the gram prices have also remained negative most part of the RMS (2022-23). Going by the price prospects, the acreage under wheat is expected to remain higher as compared to the previous year and could also replace some area under the other rabi crops. This is also likely to be supported by sufficient reservoir levels since the beginning of the season, aided by above normal rains during September and October (Chart 13). In addition, the IMD has forecasted the NEM rains to be normal. Apart from brightening the prospects for rabi rice in southern states, the higher NEM rains also appears to help in cooling down the temperature across the country, which is suitable for rabi crops, particularly wheat8 (Chart 14). It is also evident from the association between temperature and productivity that the lower growth stage temperature (GST) [October to December] favours higher productivity9 (Chart 15). 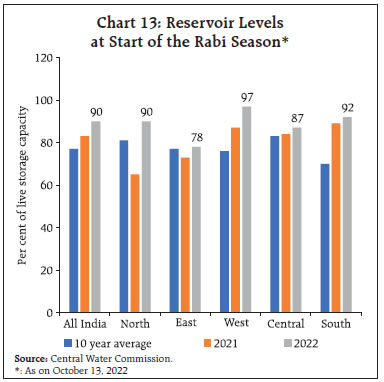 As illustrated above, heavy rains during September 2022 created congenial soil moisture conditions as well as adequate reservoir levels, which in turn is expected to augur well for the rabi sowing (Chart 13a). Using national level data from 1975-76 to 2021-22, we attempt to empirically test the impact of September rains on wheat acreage in the long run using the following equation. 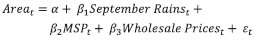 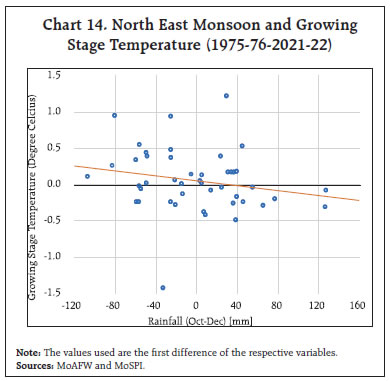 The descriptive statistics of the variables and expected sign from the above regression are presented in Table 3. The results of the stationarity test performed using Augmented Dickey-Fuller test (ADF) are presented in Table 4. This test is performed to determine the order of integration of the variables. Except the rainfall data, which is stationary at levels, all other variables are stationary at the first difference. 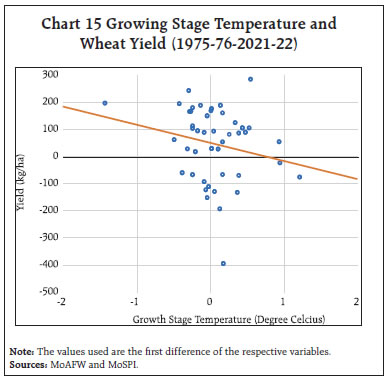 As one variable is integrated of order I(0) and others at I(1), Autoregressive distributed lags (ARDL) procedure was employed for estimation. The variables were used in the log form. The ARDL bounds test for cointegration between the area and the other variables show that the F-statistic is higher than the upper bound critical value, confirming cointegration between variables and hence, the existence of a long-run relationship (Table 5). The September rains appears to play a significant role in deciding the area to be sown under wheat. In addition to the soil moisture and reservoir levels for irrigation (both depicted by the September rains), price is also a key determinant of farmers’ acreage response (Gandhi et al., 2004; Mythili, 2006). Both the wholesale price index (pre sowing10) as well as the minimum support prices (MSPs) were found to have positive and significant impact on the wheat acreage. As regards the outlook for the ongoing rabi season 2022, all the three factors appear to augur well for the higher area under wheat production. The diagnostic tests, in terms of Breusch–Godfrey Serial Correlation test, Breusch-Pagan-Godfrey heteroskedasticity test, suggests the estimates are robust. The plot of the cumulative sum of squares (CUSUMSQ) of recursive residuals show that the results are stable at 5 per cent level of significance (Annex II, Chart A1). VIII. Conclusion and Way Forward The SWM rainfall in 2022 was above normal. However, its spatial and temporal distribution was uneven. As a result, though price, inputs and procurement policies are vital factors of production, the quantitative and qualitative progress of SWM rains continues to play key role in the supply response (both area and productivity) of the kharif crops. While both policy (MSP backed procurement) and market factors (export demand and declining stock) were likely to augur well for higher kharif rice production, it did not materialise on account of deficient rainfall in major producer states. This, in turn, nudged the farmers to shift towards region specific and remunerative alternate crops like pulses and oilseeds in these states. On the other hand, in the major pulses and oilseed producing states, cotton appears to have gained share in the overall acreage and production on account of higher price prospects. As the SWM ended, episodes of excess rains during September and October 2022 could lead to some damage of standing crops, the extent of which would likely be reported in the second advance estimates of agricultural production. Considering the sensitivity of arhar crop to heavy rain, water logging, lower production and lack of any substitute may spur price pressures if timely and adequate amount of import does not take place. As regards the rabi production outlook, the prospects for wheat in 2023 looks bright in the backdrop of announcement of higher MSP, current market prices ruling above MSP as well as soil moisture conditions and climatic factors supporting higher acreage and better yield. As on December 09, 2022, rabi crop sowing was 15.0 per cent higher over the previous year driven mainly by growth in acreage under wheat (25.4 per cent), gram (2.5 per cent) and rapeseed and mustard (8.9 per cent), respectively. However, the increasing incidences of heat waves across the globe would remain a possible downside risk until the final harvest is ready for sale (Kirkpatrick and Lewis, 2020). References Ali, S., Liu, Y., Ishaq, M., Shah, T., Abdullah, Ilyas, A. and Din, I. U. (2017). Climate Change and Its Impact on the Yield of Major Food Crops: Evidence from Pakistan. Food 6(39): https://doi.org/10.3390/foods6060039 Anonymous (2019). Unseasonal Rainfall Causes Severe Crop Damage Across States. News Report, November 01, NewsClickin. Retrieved from: https://www.newsclick.in/unseasonal-rainfall-causes-severe-crop-damage-across-states. Bhushan, C., Srinidhi, A., Kumar, V. and Singh, G. (2015). Lived Anomaly: How to Enable Farmers in India Cope with Extreme Weather Events. Assessment Report, Centre for Science and Environment, New Delhi. Das R, (2020). Minimum support price in India: what determines farmers’ access? Agricultural Economics Research Review. 33 (1), 61-69. Dave, N. (2022). Groundnut Oil Prices to Remain Firm due to Drop in Acreage. News Report, The Financial Express, October 26. Retrieved from: https://www.financialexpress.com/market/groundnut-oil-prices-to-remain-firm-due-to-drop-in-acreage/2742491/ Government of India (GoI). (2022). Review Meeting on the Situation of Fertilizers with the Agriculture Ministers of States/UT. Press Release, Press Information Bureau (May 02, 2022). Gulati A, Sharma PK (1990) Prices, procurement and production: An analysis of wheat and rice. Economic and Political Weekly. 25(13):A36–A47. Haile MG, Kalkuhl M, Von Braun J (2015) Worldwide acreage and yield response to international price change and volatility: A dynamic panel data analysis for wheat, rice, corn, and sybeans. American Journal of Agricultural Economics. 98(1):172-190 Hendriks, S. L., Montgomery, H., Benton, T., Badiane, O., de la Mata, G. C., Fanzo, J., ... & Soussana, J. F. (2022). Global environmental climate change, covid-19, and conflict threaten food security and nutrition. bmj, 378. Hodjo, M., Ram, A., Blayney, D. and Nakelse, T. (2021), “Impacts of price, weather and policy changes on maize and rice farming in Togo”, African Journal of Economic and Management Studies, 12(3), 357-380. https://doi.org/10.1108/AJEMS-09-2020-0427 India Meteorological Department (IMD). (2022). Monsoon Status. Press Release (August 11, 2022). Jain, B. and Madaan, N. (2019). October rain damages a third of kharif crops in Maharashtra. News Paper Article. The Times of India (November 02). Retrieved from: https://timesofindia.indiatimes.com/city/pune/october-rain-damages-a-third-of-kharif-crops-in-maharashtra/articleshow/71860782.cms Perkins-Kirkpatrick, S. E., & Lewis, S. C. (2020). Increasing trends in regional heatwaves. Nature communications, 11(1), 1-8. Kumar, M. D., Ganguly, A., & Sivamohan, M. V. K. (2019). What Drives Annual Agricultural Growth Rates in India? Economic and Political Weekly. 54(1): 33-36. Kumar, R. (2022). Rain Pours Misery on Standing Crops. News paper article. The Daily Pioneer (October 11). Retrieved from: https://www.dailypioneer.com/2022/pioneer-exclusive/rain-pours-misery--on-standing-crops.html Kuriachen, P., Devi, A., Sam, A. S., Kumar, S., Kumari, J., Suresh, A., & Jha, G. K. (2022). Wheat yield responses to rising temperature: insights from northern plains of India. Theoretical and Applied Climatology, 1-16. Magrini E, Balié J, Morales-Opazo C (2017) Price signals and supply responses for staple food crops in subSaharan Africa. Applied Economic Perspectives and Policy. 40(2): 276-296 Mukherjee, A, Bajaj, P., Kumar, R. and Sebastian, J. (2022). Indian Agriculture: Opportunities and Challenges. Monthly Bulletin (January), 43-59. Reserve Bank of India. Mythili G (2006) Supply response of Indian farmers: Pre and post reforms. IGIDR Working Paper series, WP-2006–009. Nasir, M.A., Nugroho, A.D. & Lakner, Z. (2022). Impact of the Russian–Ukrainian Conflict on Global Food Crops. Foods. 11, 2979. https://doi.org/10.3390/foods11192979 Patra, M.D., Gulati, S., Lokare, S.M., Jain, R., Srivastava, V.K., Gupta, B., Sachdeva, P., Khan, S., Borad, A. Guria, J.V., Sharma, M., Kumar, P., Kumar, R., Singh, S., Padhi, I., Kumar, A., Awasthy, S., George, A.T., Rath, D.P. &Behera, S.R.(2021). State of the Economy. Monthly Bulletin (October), 143-181. Reserve Bank of India. Reserve Bank of India (RBI). (2022). Monetary Policy Report (October). The Hindu. (2022). Govt. Giving Additional Fertilizer Subsidy of ₹1.10 lakh crore this Fiscal. Published on May 21, 2022. Retrieved from: https://www.thehindu.com/business/Economy/govt-giving-additional-fertilizer-subsidy-of-110-lakh-crore-this-fiscal-fm/article65443556.ece?homepage=true Gandhi, V. P., Zhou, Z. Y., & Mullen, J. (2004). India’s wheat economy: Will demand be a constraint or supply? Economic and Political Weekly, 4737-4746 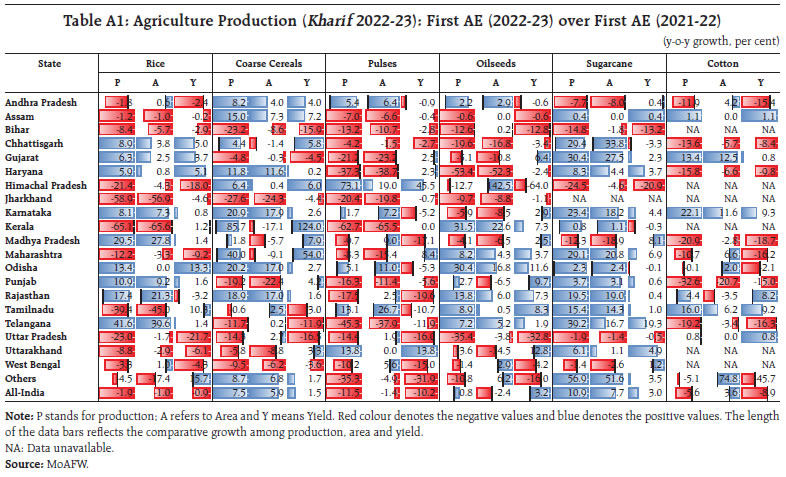 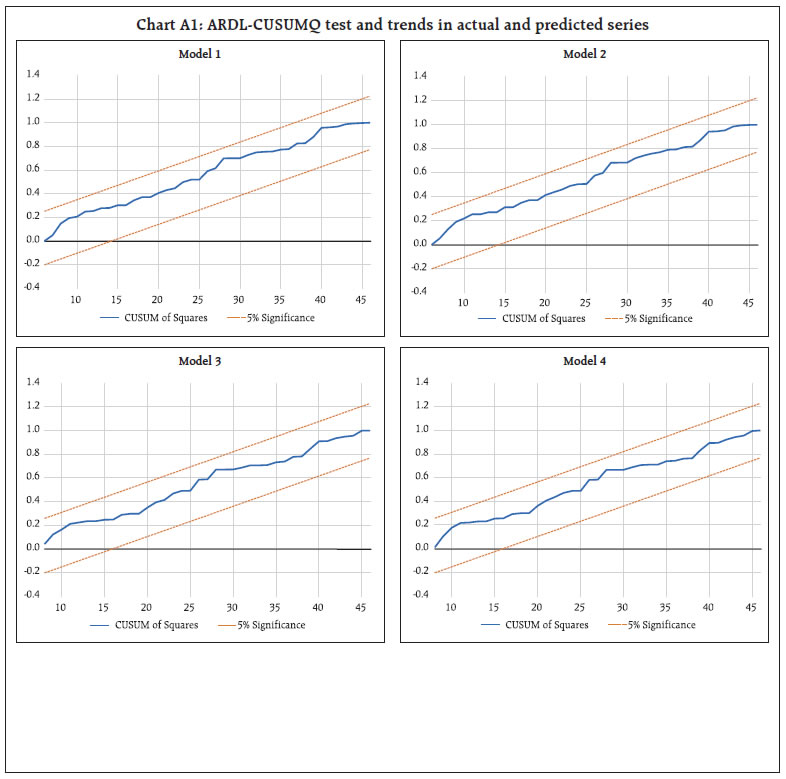 ^ The authors are from the Department of Economics and Policy Research. * The views expressed in the article are those of the authors and do not necessarily represent the views of the Reserve Bank of India. The authors duly acknowledge the suggestions provided by Shri Rajib Das (Adviser), Shri Sarat Dhal (Director) and Smt. D. Suganthi (Research Officer). 2 Major kharif crops are rice, soyabean, pulses, oilseeds, and cotton. Wheat, rapeseed & mustard, barley, gram, and pulses are major rabi crops. 3 Since the data for labour usage in agriculture is not available on real time basis, data on demand for jobs under Mahatma Gandhi National Rural Employment Guarantee Scheme has been used in this article as its proxy. 4 Although the export of broken rice has been restricted and that of other non-basmati rice (except parboiled rice) has been levied with a duty of 20 per cent, the sown area had already reached near normal (5 year average) acreage for the season before the implementation of the policy. 5 July and August are the peak sowing months during the kharif season. 6 This table provides the comparison of first advance estimates (AE) of 2022-23 with the latest available data for 2021 which is based on 4th AE. However, the comparison of first AEs of the both the years has also been provided in Annex I for reference. 7 Rabi marketing season (RMS) starts in April and continues till March. However, the government procurement of wheat, generally, ends by June or July. 8 As per the IMD’s press release on monthly forecast for winter temperatures (dated December 01, 2022), minimum temperatures (during December) are most likely to be below normal over most parts of peninsular India, many parts of Central India and some parts of northwest India. On the other hand, normal to above normal minimum temperatures are most likely over most parts of northeast India and some parts of east and northwest India. 9 Ali et al. (2017) and Kuriachen et al. (2022) provide empirical evidence of the impact of increased temperature on wheat productivity for Indian subcontinent. 10 Pre sowing prices, here, are taken as average prices from April 01 (start of the Rabi marketing season) till September 30 (prior to the commencement of the sowing activities). |

এই পেজটি শেয়ার করুন:


রিজার্ভ ব্যাঙ্ক অফ ইন্ডিয়া মোবাইল অ্যাপ্লিকেশন ইনস্টল করুন এবং সাম্প্রতিক সংবাদগুলিতে দ্রুত অ্যাক্সেস পান!
আমাদের অ্যাপটি ইনস্টল করতে QR কোডটি স্ক্যান করুন


পেজের শেষ আপডেট করা তারিখ:


